Business water footprint accounting: A tool to assess how production of goods and services impacts on freshwater resources worldwide Value of Water P.W. Gerbens-Leenes A.Y. Hoekstra March 2008 Research Report Series No. 27
Transcript
Business water
footprint accounting:
A tool to assess how production of goods and services impacts on freshwater resources worldwide
Value of Water
P.W. Gerbens-Leenes
A.Y. Hoekstra
March 2008
Research Report Series No. 27
BUSINESS WATER FOOTPRINT ACCOUNTING: A TOOL TO ASSESS HOW PRODUCTION OF GOODS AND SERVICES
IMPACTS ON FRESHWATER RESOURCES WORLDWIDE
P.W. GERBENS-LEENES1
A.Y. HOEKSTRA1,2
MARCH 2008
VALUE OF WATER RESEARCH REPORT SERIES NO. 27
1 Dept. of Water Engineering and Management, University of Twente, Enschede, The Netherlands 2 Contact author: Arjen Hoekstra, [email protected]
The Value of Water Research Report Series is published by UNESCO-IHE Institute for Water Education, Delft, the Netherlands
in collaboration with University of Twente, Enschede, the Netherlands, and Delft University of Technology, Delft, the Netherlands
Contents
Summary................................................................................................................................................................ 5 1. General introduction......................................................................................................................................... 7
1.1 Introduction................................................................................................................................................... 7 1.2 Aim and research questions........................................................................................................................... 7
2. Current state of business water accounting .................................................................................................... 9 2.1 Sustainable business performance................................................................................................................. 9 2.2 Principles, practices and outcomes................................................................................................................ 9 2.3 Initiatives for business water accounting .................................................................................................... 10
2.3.1 OECD’s key environmental indicators................................................................................................. 10 2.3.2 The Sustainable Corporate Performance Project.................................................................................. 10 2.3.3 WBCSD’s Global Water Tool.............................................................................................................. 11 2.3.4 The CEO Water Mandate..................................................................................................................... 11
3. Methods............................................................................................................................................................ 13 3.1 A broad definition of business .................................................................................................................... 13 3.2 Business sectors, companies and company units ........................................................................................ 13 3.3 The business water footprint ....................................................................................................................... 15 3.4 Calculation method for the business water footprint................................................................................... 16
Step 1: definition of the business and business units .................................................................................... 16 Step 2: the operational water footprint per business unit .............................................................................. 18 Step 3: the supply-chain water footprint per business unit............................................................................ 18 Step 4: the total water footprint per business unit ......................................................................................... 19 Step 5: the water footprint of the output products per business unit ............................................................. 19 Step 6: the water footprint of the total business ............................................................................................ 20
3.5 From footprint accounting to impact assessment and from impacts to policy ............................................ 20 4. Application of the method for a theoretical beverage company.................................................................. 21
4.1 Case I: the business as a black box.............................................................................................................. 22 4.2 Case II: the business schematised into business units ................................................................................. 23 4.3 A comparison between the two cases.......................................................................................................... 25
5. Discussion......................................................................................................................................................... 27 6. Conclusion ....................................................................................................................................................... 29 Acknowledgements.............................................................................................................................................. 31 References............................................................................................................................................................ 33 Appendix 1: Glossary.......................................................................................................................................... 37 Appendix 2: Overview of largest companies per business sector with a relatively large water footprint... 39
Summary
Freshwater of adequate quality is a prerequisite for human societies and natural ecosystems. The human use of
freshwater is so large that competition among users occurs and water scarcity is serious in several regions. For
many companies, freshwater is a basic ingredient for their operations, while effluents may lead to pollution of
the local hydrological ecosystem. Initially, public pressure has been the most important reason for sustainable
business initiatives, but today many companies recognize that failure to manage the freshwater issue raises risks,
including damage to the corporate image, threat of increased regulatory control, financial risks caused by
pollution, or insufficient freshwater availability for operations. Especially multinationals, such as the Coca-Cola
Company or Marks & Spencer, recognise that proactive management contributes to their profitability and
competitiveness in the market and avoids risks (Coca-Cola Company, 2006; Marks & Spencer, 2007). Business
water accounting is increasingly regarded as an essential part of sustainable corporate performance accounting.
The foundation of the World Business Council on Sustainable Development (WBCSD) and the Global Reporting
Initiative (GRI), and the development of standards for environmental management systems (ISO and EMAS)
have been important. Since 2000, indicators for business water accounting have been proposed by the OECD, the
University of Groningen and the WBCSD. For freshwater, Hoekstra and Hung (2002) and Hoekstra and
Chapagain (2008) have developed the concept of the water footprint (WF) that has been applied, among other
things, for individual and national consumption comparisons.
This report aims to identify the current state of business water accounting and to design an accounting method
for the business water footprint (BWF). It answers the following questions: (i) What are the main developments
in sustainable business performance so far? (ii) What is the current state of business water accounting? (iii) How
to design an accounting method for the business water footprint? And (iv) How to apply the method for existing
situations? The term “business” is interpreted in this study in a broad sense, in order to include any form of
enterprise, governmental or non-governmental organization or other form of business activity. Based on the
methodology of the WF concept, this report designs an accounting method for the BWF. The method calculates
the BWF per business unit, where a business unit is preferably a part of the business that produces one
homogenous product (good or service) at one particular spot. The WF of a business unit is defined as the total
volume of freshwater that is used, directly and indirectly, to produce the goods and services delivered by that
unit expressed in terms of the volume of freshwater use per year. The WF of a business is defined as the total
volume of freshwater that is used directly or indirectly to run and support the business.
The WF of a business unit consists of two parts: the operational water footprint and the supply-chain water
footprint. The operational water footprint is the amount of freshwater used at a specific business unit, i.e. the
direct freshwater use. The supply-chain water footprint is the amount of freshwater used to produce all the goods
and services that form the input of production at the specific business unit, i.e. the indirect freshwater use. The
method addresses three different types of freshwater use: blue, green and grey. The blue water footprint is the
volume of freshwater that evaporated from the global blue water resources (surface water and ground water) to
produce the goods and services. The green water footprint is the volume of water evaporated from the global
green water resources (rainwater stored in the soil as soil moisture). The grey water footprint is the volume of
6 / Business water footprint accounting
polluted water that associates with the production of goods and services. The water footprint is a geographically
explicit indicator, not only showing volumes of water use and pollution, but also the locations.
Applied to a hypothetical company, the accounting method generates results at different levels of detail
dependent on the availability of data. When data are sufficient, it generates detailed information for
benchmarking or for defining company goals to decrease its WF.
Although most companies focus on their own performance, the report shows that for freshwater it is important to
address complete supply chains. If companies centre on impacts generated by their own activities, large company
efforts may still result in small improvements along the total lifecycle of a product. Compared to earlier
developed methods for business water accounting, the method based on the water footprint concept, extends
existing methods to green and grey water and includes sites of production in a supply chain. It excludes non-
fresh water use because salt water is not a scarce resource. The concept explicitly focuses on freshwater, which
is considered a critical resource and provides detailed methodology on how to calculate water in agriculture,
which is missing in the other tools. Due to the completeness of the WF concept, we therefore used it as a basis
for the development of a method for business water accounting and termed this the business water footprint
(BWF). Adopting the method by business may make a contribution towards more sustainable freshwater use.
1. General introduction
1.1 Introduction
Freshwater of adequate quality is not only a prerequisite for human societies, but also for natural ecosystems that
perform functions essential for human existence and life on earth (Costanza and Daly, 2002). At present,
irrigated agriculture is responsible for about 70% of all freshwater abstractions by humans (Gleick, 1993;
Bruinsma, 2003; Shiklomanov and Rodda, 2003; UNESCO, 2006), while agriculture as a whole applies about
86% of the worldwide freshwater use (Hoekstra and Chapagain, 2007). In many parts of the world, the use of
freshwater for agriculture has to compete with other uses such as urban utilization and business activities
(Rosegrant and Ringler, 1998; UNESCO, 2006). Moreover, research has indicated that the effects of climate
change lead to major shifts in spatial and temporal patterns of precipitation (IPCC, 2007). Lehner et al. (2001),
for example, have shown that in Southern Europe freshwater availability will decrease by 25 to 50 percent over
the period 2000-2070. Estimates on human freshwater use indicate that in some regions water scarcity is already
serious (UNESCO, 2006; CAWMA, 2007).
For many companies, freshwater is a basic ingredient for their operations, while effluents might lead to pollution
of the local hydrological ecosystem. Many companies have addressed these issues and formulated proactive
management (Gerbens-Leenes et al., 2003). Failure to manage the freshwater issue raises four serious risks for a
company: damage to the corporate image, the threat of increased regulatory control, financial risks caused by
pollution, and insufficient freshwater availability for business operations (Rondinelli and Berry, 2000; WWF,
2007).
1.2 Aim and research questions
The efficient use of freshwater and control of pollution is often part of sustainability issues addressed by
business. In the last ten years, initiatives were the foundation of the World Business Council for Sustainable
Development (WBCSD, 1997) and the Global Reporting Initiative (GRI, 2000), the development of standards
for environmental management systems, such as ISO and EMAS standards (OECD, 2001), the development of
Key Environmental Indicators (OECD, 2001; Steg et al., 2001) and the introduction of the Global Water Tool
(WBCSD, 2007).
A tool that calculates freshwater consumption is the concept of the water footprint (WF). This tool has been
introduced by Hoekstra and Hung (2002) and has been developed further by Hoekstra and Chapagain (2007,
2008). Those authors define the water footprint as the total annual volume of freshwater used to produce the
goods and services consumed by any well-defined group of consumers, including a family, village, city,
province, state, nation or business. The water footprint of a business (BWF) is defined as the total volume of
freshwater that is used directly or indirectly to run and support a business. The water footprint of a business
consists of two components: the operational water use (direct water use) and the water use in the supply chain
(indirect water use). A glossary on water footprint and other terminology used in this report is given in Appendix
8 / Business water footprint accounting
1. Compared to other water accounting tools, the concept of the water footprint provides the most extended and
complete tool for water accounting. It has already been applied for various purposes, such as the calculation of
the water footprint of a large number of products from all over the world (Chapagain and Hoekstra, 2004), but so
far there has been no application for business accounting. This report aims to identify the current state of
business water accounting and to design an accounting method for the business water footprint. The research
questions are:
• What are the main developments in sustainable business performance so far?
• What is the current state of business water accounting?
• How to design an accounting method for the business water footprint?
• How to apply the method for existing situations?
The answer to the first question intends to provide general information on where business stands today. The
answer to the second question forms the starting-point for the development of the method. In this way, the report
can play a role in raising awareness on the water scarcity issue, as well as provide insight into options for
change. The answer to the third question provides a tool for accounting the business water footprint based on the
concept and methodology of the water footprint. The answer to the fourth question shows how the method works
in practice.
2. Current state of business water accounting
2.1 Sustainable business performance
The way companies address their use of freshwater and their impact on water systems is one of the aspects of
sustainable business performance. During the past few decades we have seen a movement recognising that
business performance is not only measured in terms of shareholder value but also in terms of the long-term
continuity value of business to communities. In the ongoing debate on globalization, concerns have been
expressed about the sustainability impacts of business on society, especially of multinational corporations
(OECD, 2001). The sustainability concept is determined by three components: a social, economic, and
environmental one (WCED, 1987). Public pressure has been the most important reason that private initiatives for
sustainable business performance have become an important development in business over the last twenty years;
especially a number of large multinationals are interested in the interactions of their operations with the
environment and communities (Gerbens-Leenes et al., 2003). Initially, regulatory compliance and fear of legal
liability were the main reasons for defining sustainability principles; today, many multinationals recognise that
proactive management contributes to their profitability and competitiveness in the market.
Companies change performance in response to specific pressure (Hall, 2000). It has been shown that this
pressure differs among sectors (Green et al., 1996; Hall, 2000). In general, large, high-profile companies are
under considerable pressure to improve their performance. For example, multinational oil companies are more
environmentally responsive than other company types (Moser, 2001). In contrast, firms without pressure may be
hesitant to invest in innovation because it does not necessarily improve their financial performance. Therefore,
lower profile firms, which are an integral part of any industrial system, lack incentives to change their
sustainability performance (Irwin and Hooper, 1992). These pressures need to be responded to on two levels,
however, at an industry level and at a corporate level, since it is impossible for a company to develop a good
reputation for itself in an industry without credibility. What is more, companies must not only behave in a
responsible manner according to their principles, they must also be seen to do so (Humphreys, 2000). In this
respect, differences among companies in the emphasis on the components of the sustainability concept makes
that the use of this concept leads to the use of different time scales, so that the perspective on sustainable
business performance differs according to varying perceptions about the appropriate time horizon in the analysis
(Gerbens-Leenes et al., 2003).
2.2 Principles, practices and outcomes
There are three important steps towards the measurement and the reporting of sustainability (Gerbens-Leenes et
al., 2003). The first step was in the 1970s. Companies started to issue policy statements or principles, codes of
conduct, stating commitments on business ethics and legal compliance (OECD, 2001). The first corporate code
of conduct was the 1977 “Issuance of guidelines on conducting business in South Africa” by an automobile
manufacturer. Later, many other companies adopted these “Sullivan Principles”, or began to issue corporate
codes dealing with business ethics. The second step was the development of management systems or practices
10 / Business water footprint accounting
that refer to action strategies and programs. More recently, the third step formulated the outcomes, standards
providing guidance for business reporting on non-financial performance. However, many companies mainly
focus on their own performance, and only some firms feel responsible for their suppliers’ activities (Hall, 2000).
Moreover, according to an OECD study (2001), the absence of internationally agreed reporting standards on
sustainability results in a range from rudimentary reporting to full-scale reporting.
2.3 Initiatives for business water accounting
Business water accounting is often part of the sustainable corporate performance accounting of a company.
Important developments for the issue of sustainable, corporate performance were the foundation of the World
Business Council for Sustainable Development (WBCSD, 1997), the foundation of the Global Reporting
Initiative (GRI, 2000), and the development of standards for environmental management systems, such as the
ISO and EMAS standards (OECD, 2001). At the end of the 20th century, many multinationals certified their
environmental management systems (EMS) under ISO 14000 standards, and many others were in the process of
doing so (Rondinelli and Vastag, 2000). Today, an increasing number of companies publish information on
environmental impacts of their activities, the outcomes. Although companies recognize the importance of
sustainability issues, they use an enormous variety of indicators for the assessment (Gerbens-Leenes et al.,
2003). Often, this also includes the use of freshwater. Moreover, sustainable business practices incline to focus
on company performance rather than system performance. If companies mainly centre on impacts generated by
their own activities, large company efforts may still result in small improvements along the total lifecycle of a
product. Since 2000, initiatives for business water accounting, often part of a larger accounting scheme, have
been taken. Three are discussed in the following: OECD’s key environmental indicators (OECD, 2001), the
Sustainable Corporate Performance project (Steg et al., 2001) and the Global Water Tool (WBCSD, 2007).
2.3.1 OECD’s key environmental indicators
In 2001, the OECD Environmental Directorate (OECD, 2001) published a report on key environmental
indicators in an effort to reduce the number of environmental indicators and to draw attention to key
environmental issues of concern. One of the key environmental indicators was freshwater, divided into two
categories: freshwater quality and freshwater resources. Indicators in this respect were wastewater treatment and
gross abstractions per capita as percentage of total available freshwater resources.
2.3.2 The Sustainable Corporate Performance Project
In 2001, results of the Sustainable Corporate Performance (SCP) project, a cooperation between the University
of Groningen in the Netherlands and the Ahold company, were published (Steg et al., 2001). Its focus was the
definition of SCP and the development of a practical measuring system for companies. It defined SCP in relation
to the potential addition of economic, social and environmental value to society through corporate activities.
Gerbens-Leenes et al. (2003) designed and developed a measuring method for the environmental value using
three indicators: land use, energy use and freshwater use. Freshwater use was made up of two parts: direct
Business water footprint accounting / 11
freshwater use for a company per year (operational freshwater use) and indirect freshwater use, i.e. the
freshwater use in the supply chain of the company.
2.3.3 WBCSD’s Global Water Tool
In their recent water-scenarios report, the World Business Council for Sustainable Development (WBCSD)
includes in one of their scenarios that ‘water footprint reporting’ will become common practice and even
obligatory for businesses in various countries already by the year 2010 (WBCSD, 2006). Shortly after, at the
World Water Week 2007 in Stockholm, the WBCSD launched the Global Water Tool, a free and easy-to-use
tool for businesses and organizations to map their water use and assess risks relative to their global operations
and supply chains (WBCSD, 2007). Six important questions for business were: (i) How many of your sites are in
extremely water-scarce areas? (ii) Which sites are at greatest risk? (iii) How will that look in the future? (iv)
How many of your employees live in countries that lack access to improved water and sanitation? (v) How many
of your suppliers are in water scarce areas now? And (vi) How many will be in 2025? The Global Water Tool
calculates water withdrawal from fresh and non-freshwater sources (m3/year), fresh and non-freshwater
discharge by receiving bodies (m3/year), and total water consumption of a company calculated as the sum of
withdrawals minus discharges (WBCSD, 2007).
2.3.4 The CEO Water Mandate
In July 2007, at the Global Compact Leaders Summit in Geneva, a group of committed business leaders
officially launched The CEO Water Mandate, representing both a call to action and a strategic framework for
companies seeking to address the issue of water sustainability not only in their operations but also in their supply
chains (CEO Water Mandate, 2007). At the time of writing, the mandate was endorsed by twenty business
leaders and their companies.
3. Methods
3.1 A broad definition of business
We would like to develop a water footprint accounting method that can be applied to various sorts of business.
The method should be applicable to small and large private companies but also to public organizations. Besides,
we want a method that can be applied to both business at a disaggregated level (units or divisions within a larger
corporation or organization) and business at an aggregated level (e.g. a whole business sector or the entire
national government). Before we introduce a method for business water footprint accounting, we will therefore
first define what we understand by the term “business”.
In broad terms, a business is conceived here as a coherent entity producing goods and/or services that are
supplied to consumers or other businesses. It can be a (division of a) private company or corporation, but also a
(component of a) governmental or non-governmental organization. It can refer to various levels of scale, for
instance a specific division of a company, an entire company or a whole business sector. In our broad definition
the term business can also refer to a consortium or joint-venture of companies or organizations aimed at the
delivery of a certain good or service. In fact, the term business can also refer to any project (e.g. construction of a
piece of infrastructure) or activity (e.g. the organization of a large sports event). In this way, the term business
has been defined so broad that it can refer to all sorts of corporations, organizations, projects and activities. A
business is any coherent entity or activity that transforms a set of inputs into one or more outputs.
In order to be able to assess the water footprint of a business, there is an important precondition: the business
should be clearly delineated. It should be clear what are the boundaries of the business considered. It should be
possible to schematize the business into a system that is clearly distinguished from its environment and where
inputs and outputs are well known. The water footprint accounting method that will be introduced in this chapter
is designed in a generic way so that it can be applied to any sort of business. Before defining what precisely is a
business water footprint, we will first enter into some more detail about one particular type of business: the
private company, corporation or enterprise. Since a business water footprint does not only refer to the water use
within a business but also to the water use in its supply chain, it is important to have some understanding of the
structure of an economy, in which different types of business form a complex network of supply chains. For that
reason we spend the next section on a discussion of different business sectors and show how companies or
company units can be localized within the supply-network of an economy.
3.2 Business sectors, companies and company units
Business can be categorized into different business sectors. Figure 1 shows the main sectors: agriculture, which
is divided into primary and secondary production, manufacturing, trade, retailing, primary extraction, power
generation, private and public services, and transportation. Most individual companies can be localized within
one particular business sector, although there exist examples of companies that have business in two or even
14 / Business water footprint accounting
more different business sectors. Some manufacturing companies, for instance, have their own outlets, thus acting
as retail company as well.
Primary extraction
Power generation
Private and public services
Primary production (crops
and forestry)
Livestock production
Manufacturing
Trade and retailing
Consumer
T
T
T
T
Waste handling
= Transportation T Fig. 1. Overview of a production system, the output to consumers and waste handling. Production processes take
place in several business sectors represented by the boxes. A series of processes forms a production chain. The
arrows show transportation of physical streams between the links of the chain.
A company can be defined as a legally recognized corporation aimed to sell goods and/or services to consumers
or other businesses, usually in an effort to generate profit. Companies can be divided according to their size, way
of operating and organisation into three categories: (i) local companies; (ii) overseas independent business
companies; and (iii) multinational corporations (Moser, 2001). Many local businesses exist in different countries
all over the world. This category comprises both state-owned enterprises (enterprises that are owned by the
national government of the country within which the enterprise operates) and privately owned local enterprises
(whose headquarters are located in the country of investigation). Other companies operate in more than one
country: the overseas independent businesses. They are defined here as foreign enterprises (a) comprising
entities operating in up to a maximum of four countries, (b) but within which there is no system for coherent
decision-making on policies and strategies throughout the organisation and (c) within which individual entities
are unable to exert significant influence over the activities of others. On a global scale, multinational
Business water footprint accounting / 15
corporations operate that are defined as foreign enterprises (a) comprising entities in two or more countries, (b)
which operate under a system of decision-making permitting coherent policies and strategies through one or
more decision-making centres and (c) in which entities are so linked that one or more of them may be able to
exercise a significant influence over the activities of the others, and in particular to share knowledge, resources
and responsibilities with others (Westney, 1993).
Whatever type of company, companies often consist of a number of units. For example, a company can have
operations (e.g. factories) at various locations. Or a company may have separate divisions at one location. For
the purpose of water footprint accounting, it is often useful to distinguish between different business units. For
instance, when a manufacturing company has different factories at different locations, the individual factories are
likely to operate under different conditions and derive their inputs from different places. In such a case, it is
useful to do water footprint accounting per business unit first and later on aggregate the business unit accounts
into an account for the business as a whole.
3.3 The business water footprint
The water footprint of a business is defined as the total volume of freshwater that is used directly or indirectly to
run and support the business. The volumes of freshwater use are measured at the place where the actual
production and water use takes place (Hoekstra and Chapagain, 2007; 2008). We propose to calculate the
business water footprint (BWF) per business unit, where a business unit preferably refers to a part of the total
business that produces one homogeneous product at one particular spot. When a business runs at different
locations, it is thus preferred to schematize the overall business into business units in such a way that individual
business units operate at one location. Besides, operations of a business at one particular spot are preferably
schematised in different business units each producing its own product. The water footprint of the business as a
whole consists of the sum of the water footprints of the different business units.
The water footprint of a business unit is defined as the total volume of freshwater that is used, directly and
indirectly, to produce the products and services of that unit expressed in terms of the volume of freshwater use
per year. The water footprint of a business unit consists of two parts: the operational water footprint and the
supply-chain water footprint. The first refers to the amount of freshwater used at a specific business unit, i.e. the
direct freshwater use. The second refers to the amount of freshwater used to produce all the goods and services
that form the input of production at the specific business unit, i.e. the indirect water use. Freshwater use consists
of three different components: the green, blue and grey component (Hoekstra and Chapagain, 2008).
• The “green” component of the water footprint refers to the volume of rainwater that evaporated during the
production process. This is mainly relevant for agricultural products (e.g. crops or trees), where it refers to
the total rainwater evapotranspiration during crop growth (from fields and plants).
• The “blue” component of the water footprint refers to the volume of surface and groundwater evaporated as
a result of the production of the product or service. For example, for crop production, the “blue” component
is defined as the sum of the evaporation of irrigation water from the field and the evaporation of water from
16 / Business water footprint accounting
irrigation canals and artificial storage reservoirs. For industrial production or services, the “blue” component
is defined as the amount of water withdrawn from ground- or surface water that does not return to the
system from which it came.
• The “grey” component of the water footprint is the volume of polluted water that associates with the
production of goods and services. It is quantified as the volume of water that is required to dilute pollutants
to such an extent that the quality of the ambient water remains above agreed water quality standards.
The distinction between blue and green water is important because the hydrological, environmental and social
impacts and the economic opportunity costs of surface and groundwater use for production differ distinctively
from the impacts and costs of rainwater use (Falkenmark and Rockström, 2004; Falkenmark, 2003; Rockström,
1999). The grey component of water use, expressed as a dilution water requirement, has been recognised earlier
by for example Postel et al. (1996) and Chapagain et al. (2006).
In a production chain, all chain links and transportation activities between links contribute to the freshwater used
to produce a product or service. This means that not only the performance of an individual business is important
but also the performance of all companies linked through this business through the production chain or web.
Production methods, production locations and water productivities in its supply chain will thus influence the
water footprint of a business.
Closely connected to the concept of the ‘business water footprint’ is the concept of the ‘product water footprint’.
The water footprint of a product is defined as the total volume of freshwater that is used directly or indirectly to
produce the product1. By definition, the ‘water footprint of a business’ is equal to the ‘sum of the water
footprints of the business output products’. The ‘supply-chain water footprint of a business’ is equal to the 'sum
of the water footprints of the business input products'.
3.4 Calculation method for the business water footprint
The calculation of the water footprint of a business is done in six subsequent steps.
Step 1: definition of the business and business units
In this step the business is clearly defined by describing the business units that will be distinguished and
specifying the annual inputs and outputs per business unit. Inputs and outputs are described in physical units.
Preferably, business units are chosen small enough so that they can be localized at one spot, where the actual
production of that unit takes place and one homogeneous product is manufactured. It is most useful to
schematise the business based on the various primary products delivered by the business. However, one can also
distinguish service units providing only goods or services to primary production units.
1 The 'water footprint' of a product is the same as what in other publications has been called alternatively the 'virtual water content' of the product or the product’s embedded, embodied, exogenous or shadow water (see for literature reviews: Hoekstra, 2003; Hoekstra and Chapagain, 2008).
Business water footprint accounting / 17
As an example, Figure 2 shows a business producing output products X, Y and Z. The business consists of three
business units. Every unit has an intake of a number of input products derived from companies in a preceding
link of the production chain, and a related indirect freshwater input, as well a direct freshwater input. Business
unit 1 produces product X that is sold partly to a business in the next link of the supply chain; the other part is
delivered to business unit 2 of the same business. Unit 2 produces product Y, which is partly sold to another
business and partly delivered to unit 3. Unit 3 produces product Z, both for delivery to unit 2 and for selling
externally.
When a business is large and heterogeneous (different locations, different products), it can be attractive to
schematise the business into some major business units and each major unit into a number of minor units again.
In this way the business can be schematised as a system with subsystems at a number of levels. Later on the
water footprint accounts at the lowest level can be aggregated to accounts at the second-lowest level, etcetera, up
to the level of the business as a whole.
O*[1,X] O*[2,Y] O*[3,Z]
I[s,2,p] I[s,3,p]
Business unit 3
Outputs X, Y and Z to consumers or other businesses
Business
Business unit 1
Business unit 2
I[s,1,p]
O[1,X] O[2,Y] O[3,Z]
BWFo[2] BWFo[1] BWFo[3]
Product flows
Operational business water footprint (BWFo)
Inputs to the business (products p=1 to n, sources s=1 to m)
Fig. 2. Business that consists of business units 1-3 producing products X-Z respectively. Product inflow I[s,u,p]
refers to the annual volume of input product p from source s into business unit u. Product outflow O[u,p] refers to
the annual volume of output product p from business unit u. Product flow O*[u,p] refers to the part of O[u,p] that
goes to another business unit within the same business.
18 / Business water footprint accounting
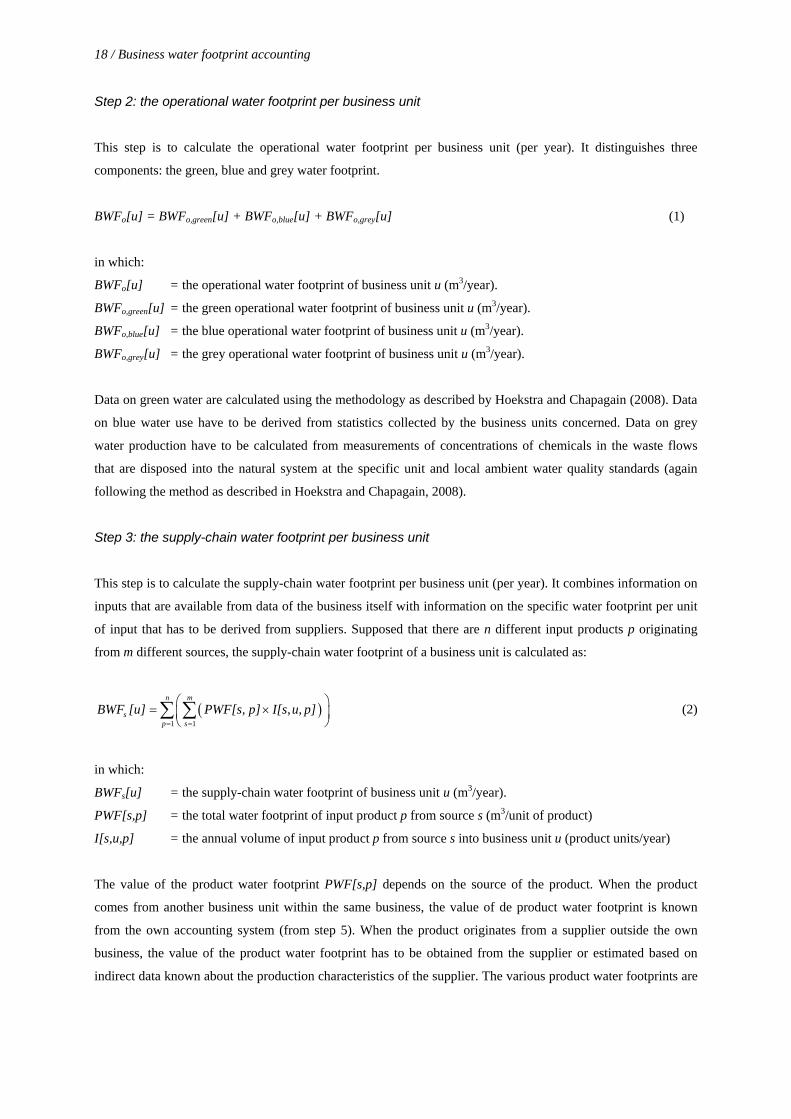
Step 2: the operational water footprint per business unit
This step is to calculate the operational water footprint per business unit (per year). It distinguishes three
components: the green, blue and grey water footprint.
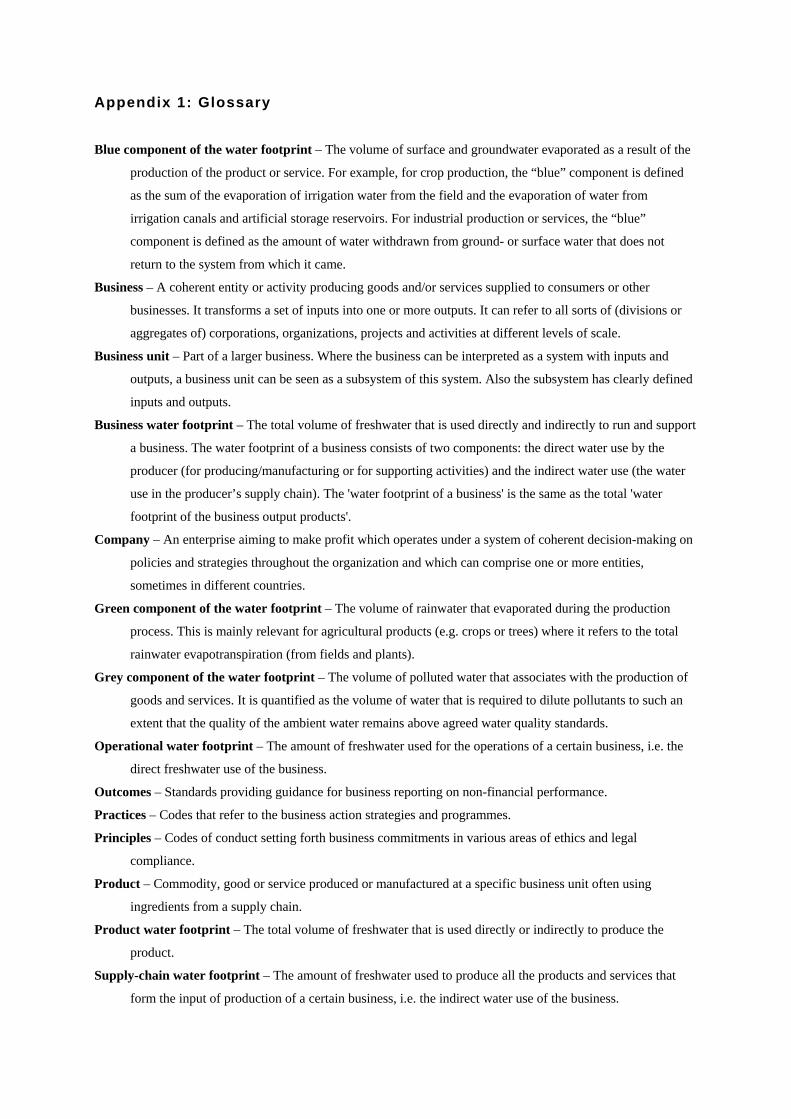
Blue component of the water footprint – The volume of surface and groundwater evaporated as a result of the
production of the product or service. For example, for crop production, the “blue” component is defined
as the sum of the evaporation of irrigation water from the field and the evaporation of water from
irrigation canals and artificial storage reservoirs. For industrial production or services, the “blue”
component is defined as the amount of water withdrawn from ground- or surface water that does not
return to the system from which it came.
Business – A coherent entity or activity producing goods and/or services supplied to consumers or other
businesses. It transforms a set of inputs into one or more outputs. It can refer to all sorts of (divisions or
aggregates of) corporations, organizations, projects and activities at different levels of scale.
Business unit – Part of a larger business. Where the business can be interpreted as a system with inputs and
outputs, a business unit can be seen as a subsystem of this system. Also the subsystem has clearly defined
inputs and outputs.
Business water footprint – The total volume of freshwater that is used directly and indirectly to run and support
a business. The water footprint of a business consists of two components: the direct water use by the
producer (for producing/manufacturing or for supporting activities) and the indirect water use (the water
use in the producer’s supply chain). The 'water footprint of a business' is the same as the total 'water
footprint of the business output products'.
Company – An enterprise aiming to make profit which operates under a system of coherent decision-making on
policies and strategies throughout the organization and which can comprise one or more entities,
sometimes in different countries.
Green component of the water footprint – The volume of rainwater that evaporated during the production
process. This is mainly relevant for agricultural products (e.g. crops or trees) where it refers to the total
rainwater evapotranspiration (from fields and plants).
Grey component of the water footprint – The volume of polluted water that associates with the production of
goods and services. It is quantified as the volume of water that is required to dilute pollutants to such an
extent that the quality of the ambient water remains above agreed water quality standards.
Operational water footprint – The amount of freshwater used for the operations of a certain business, i.e. the
direct freshwater use of the business.
Outcomes – Standards providing guidance for business reporting on non-financial performance.
Practices – Codes that refer to the business action strategies and programmes.
Principles – Codes of conduct setting forth business commitments in various areas of ethics and legal
compliance.
Product – Commodity, good or service produced or manufactured at a specific business unit often using
ingredients from a supply chain.
Product water footprint – The total volume of freshwater that is used directly or indirectly to produce the
product.
Supply-chain water footprint – The amount of freshwater used to produce all the products and services that
form the input of production of a certain business, i.e. the indirect water use of the business.
38 / Business water footprint accounting
Water footprint – An indicator of water use that looks at both direct and indirect water use of a consumer or
producer. The water footprint of an individual, community or business is defined as the total volume of
freshwater that is used to produce the goods and services consumed by the individual or community or
produced by the business. Water use is measured in terms of water volumes consumed (evaporated)
and/or polluted per unit of time. A water footprint can be calculated for any well-defined group of
consumers (e.g. an individual, family, village, city, province, state or nation) or producers (e.g. a public
organization, private enterprise or economic sector). The water footprint is a geographically explicit
indicator, not only showing volumes of water use and pollution, but also the locations.
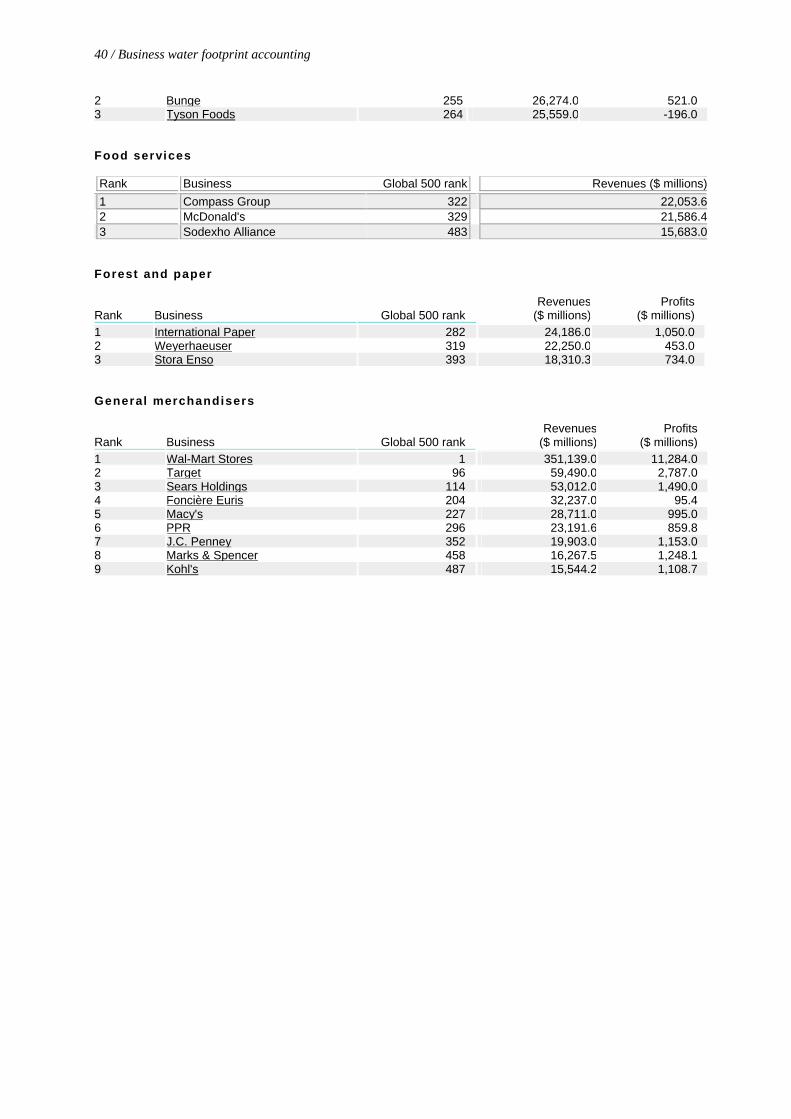
Appendix 2: Overview of largest companies per business sector with a relatively large water footprint Source: Fortune (2007) Apparel Rank Business Global 500 rank Revenues ($ millions)1 Christian Dior 351 20,094.52 Nike 499 14,954.9