227
iiBV.206.Manual.9.10.20 ©2020 The Saudi Authority for Accredited Valuers (TAQEEM) BV 206: Valuing Small and Medium- Sized Companies Course Manual

iiBV.206.Manual.9.10.20 ©2020 The Saudi Authority for Accredited Valuers (TAQEEM)
BV 206: Valuing Small and Medium-
Sized Companies
Course Manual

iiBV.206.Manual.9.10.20 ©2020 The Saudi Authority for Accredited Valuers (TAQEEM)
[this page intentionally left blank]

©2020 The Saudi Authority for Accredited Valuers (TAQEEM) i
Table of Contents
About This Course ............................................................................................ iii
Chapter 1. Introduction to Small and Medium-Sized Entities .............................. 1
Chapter 2. Valuing Start-up Companies ........................................................... 40
Chapter 3. Managing Growth in an SME ........................................................ 111
Chapter 4. Calculating the Cost of Capital of SMEs ....................................... 153
Chapter 5. Legal Agreements ........................................................................ 182
Chapter 6. Sensitivity Analyses and Common Errors in Valuation ................. 204

©2020 The Saudi Authority for Accredited Valuers (TAQEEM) ii
[this page intentionally left blank]

BV 206: Valuing Small and Medium-Sized Companies About This Course
©2020 The Saudi Authority for Accredited Valuers (TAQEEM) iii
About This Course
The Saudi Authority for Accredited Valuers (Taqeem) emphasizes that these course materials
are not authoritative. They are intended to be used as a foundation for course lectures and
discussions, in conjunction with observations by the course instructors.
The valuation processes and approaches presented in the course are:
A. Not the only valuation processes and approaches used by competent valuers;
B. Not the only way that valuation analysis may be completed;
C. Not to be taken as a rote process or approach that should be used in any
valuation analysis;
Valuations should be based on a full knowledge of the facts and circumstances of the subject
company, its industry, and the economic environment. A particular valuation process or
approach that is relevant for one company at a particular point in time may not be appropriate
for the same or another company at another point in time.
The terminology and standards in this course are based on the International Valuation
Standards (“IVS”) published by the International Valuation Standards Council (“IVSC”). The
IVSC is an independent organization committed to building the public’s trust in the valuation
profession by issuing universal standards and seeking their adoption around the world.
The IVS are referenced from the publication, International Valuation Standards 2017,
Copyright @ 2017 International Valuation Standards Council. Copies of the publication can be
purchased from the following website: https://www.ivsc.org/news/article/ivsc-launches-new-
global-standards-for-valuation-profession. In contexts where the IVS does not specifically
address a valuation topic, references to other standards and sources will be made such as the
International Glossary of Business Valuation Terms (“the International Glossary”) from the
American Institute of Certified Public Accountants’ (AICPA’s) Statement on Standards for
Valuation Services No. 1.
Business valuation, as with many other areas of professional knowledge, is a changing
discipline. It is subject to constant evolution, based on analysis of the capital markets, the results
of academic research, and evolving professional best practice. Continuing professional
education is an essential component of the professional responsibilities of those engaged in
business valuation.
Several of the topics discussed in this course are outside the basic core body of knowledge of
the business valuation profession. Small and medium sized entities that have reached
commercial operations are within the body of knowledge that has been covered in the Taqeem

BV 206: Valuing Small and Medium-Sized Companies About This Course
©2020 The Saudi Authority for Accredited Valuers (TAQEEM) iv
courses 101 through 104. Venture capital concepts are related to business valuation but are
adapted for a market that is more ambiguous and difficult to measure.
This manual includes details of the IVSC core competencies covered by each chapter. The
Taqeem core courses cover the IVSC competencies other than those which relate to the specific
circumstances of the tax and legal regimes in various countries.
COURSE OBJECTIVES
This course covers six topics:
1. Introduction to small and medium-sized entities (SMEs)
2. Start-up companies
3. Managing growth
4. Measuring the cost of equity of SMEs
5. Legal agreements
6. Sensitivity analyses and common errors
The course has the following objectives:
1. Familiarize student with the legal and SME regulatory environment in Saudi Arabia
2. Overview of SME characteristics and specific valuation issues particular to SMEs
3. Distinguish between professional and personal goodwill in the context of the IVS
definition of Market Value
4. Review the market for start-up entities in KSA
5. Provide an overview of how start-up entities are funded and how they evolve to
become stable operating entities
6. Overview of the growth strategies and challenges facing SMEs and assess how the
SME’s growth performance affects value
7. Provide an overview of specific issues affecting the cost of equity of SMEs, specifically
the size premium and distinction between the size premium and the specific premium
8. Overview of the legal agreements that are common in SMEs
9. Sensitivity analysis and common errors in SME valuations

BV 206: Valuing Small and Medium-Sized Companies About This Course
©2020 The Saudi Authority for Accredited Valuers (TAQEEM) v
COURSE FORMAT
1. This course makes use of three tools to communicate material to the candidates: 1) the
course manual; 2) lecture; and 3) PowerPoint slides. There will be four days of in-
class instruction followed by an examination on the fifth day.
2. Each chapter is followed by multiple choice questions and some chapters have case-
like studies which further test the candidate’s understanding of the topics. The
candidate should familiarize himself or herself with these questions since the format of
the exam is similar.
3. Candidates are expected to be present for the majority, if not all, of the class time.
Candidates are free to come and go as they need during the four days of classes.
However, a candidate who is absent for an extended period of time may not develop
enough competency with the material to perform well on the exam.
4. Classes begin at 8:00am and end at approximately 3:00pm. There will be two short
breaks, at 10:00am and at 12:15pm. The facilitator of the course will begin the class
on time. The candidate is responsible for material missed if he/she is absent.
5. A review session for the exam will be held at the end of class on the fourth day. The
review will cover all of the major points in the course. The candidate should plan to
attend this review.
6. The examination will be four hours in length and will be held on the fifth day. The exam
will commence at 10:00am and end at 2:00pm unless Taqeem has made other
arrangements. There are 100 multiple choice questions on the exam. The candidate
will be allowed only to have a hand calculator during the exam - the course manual,
notes, and all personal computers and tablets must be stored away for the duration.
7. After four hours have passed all exams will be collected. Candidates who complete
the examination earlier than four hours may leave when they finished. Extra time will
not be awarded. Candidates who continue to read the exam after time has been called
run the risk of have their exam disqualified.

BV 206: Valuing Small and Medium-Sized Companies About This Course
©2020 The Saudi Authority for Accredited Valuers (TAQEEM) vi

BV 206: Valuing Small and Medium-Sized Companies Chapter 1 – Introduction to Small and Medium Sized Entities
©2020 The Saudi Authority for Accredited Valuers (TAQEEM) 1
Chapter 1. Introduction to Small and Medium-
Sized Entities
I. Small and Medium-Sized Companies (SME) in the Kingdom of Saudi Arabia
(KSA)
1. The KSA legal and regulatory environment
A. The government of KSA enacted the Companies Law, effective May 2, 2016.
This law changed how companies are formed and regulated in the Kingdom.
Most companies are formed as joint stock companies (JSCs) or limited liability
companies (LLCs). The corporate forms in KSA and the specifications of each
are described in detail later in this chapter.
The Companies Law addressed the following corporate functions which are
overseen by the Ministry of Trade (formerly, the Ministry of Commerce and
Investment, or MOCI) and the Ministry of Investment (formerly, the Saudi
Arabian General Investment Authority, or SAGIA). MOCI and SAGIA were
restructured into the Ministry of Commerce and the Ministry of Trade in 2020.
1) Issuance of financial statements
2) Shareholder meetings
3) Voting rights
4) Corporate directors
5) Chairmen and managing directors
6) Foreign investment
7) Other matters of corporate governance
B. Taqeem – Saudi Authority for Accredited Valuers
1) Operates under the Ministry of Trade, originally established in 2011
2) Taqeem develops and regulates the valuation profession, accredits and
oversees licensed valuers and enforces International Valuation
Standards (IVS) in valuation practice.
3) Taqeem and its accredited valuers serve a critical function in the
development of a profession that assesses financial risk and the value

BV 206: Valuing Small and Medium-Sized Companies Chapter 1 – Introduction to Small and Medium Sized Entities
©2020 The Saudi Authority for Accredited Valuers (TAQEEM) 2
of SMEs primarily for the purpose of improved lending practice and
validity in the merger and acquisition market.
C. Monsha’at – General Authority for Small and Medium Enterprises
1) Established in 2016, Monsha’at organizes, develops, and sponsors
small and medium-sized entities in KSA.
2) Under the Vision 2030 Program it is the objective of Monsha’at to
increase the SME contribution to the KSA gross domestic product
(GDP) from 20% to 35% by the year 2030.
3) Monsha’at works to allocate government financial and technical support
as well as to facilitate market financing to ensure the development and
growth of the SME sector.
D. Saudi Venture Capital and Private Equity Association (SVCPEA)
1) Established by a resolution from the Saudi Council of Ministers and
Monsha’at. The Association is charged with:
(a) Establishing regulatory policies
(b) Foster collaboration between small businesses and the venture
capital and private equity companies in the Kingdom
(c) Promote investment interest in the VC and PE company funds
(d) Issue industry data and research on SME market investment
(e) Offer professional conferences, workshops and training
seminars
E. Vision 2030
1) The Vision 2030 program is the KSA government’s long-term strategic
economic plan.
2) The plan is a macroeconomic strategy to diversify KSA’s markets to
include entrepreneurial endeavors, healthcare entities, educational
institutions, recreational businesses, financial institutions, and tourism.
3) The oil sector, including supporting industries, encompasses up to 50%
of the KSA economy. The recognition of risk concentration, as well as
the movement of the world away from fossil fuels encouraged the
formation of the Vision 2030 strategy. The plan has three main
objectives:
BV 206: Valuing Small and Medium-Sized Companies Chapter 1 – Introduction to Small and Medium Sized Entities
©2020 The Saudi Authority for Accredited Valuers (TAQEEM) 3
(a) Develop KSA as the economic center of the Arab world
(b) Encourage financial institutions to establish KSA as a middle
eastern center of operations
(c) Develop KSA as the economic, transportation, and financial hub
linking the Asian, European, and African continents.
F. SMEs in Saudi Arabia
1) According to the KSA National Enterprise Initiative, small and medium-
sized businesses comprise 90% of the KSA private sector and 60% of
the country’s labor force.
2) KSA’s economy is the 18th largest in the world by GDP (SAR 3.1 trillion;
$770 billion).
3) SMEs contributed SAR 485 billion to the KSA economy as of 2016. The
Vision 2030 Program plans to increase this contribution to SAR 2.1
trillion ten years from now, a compound annual growth rate (“CAGR”) of
11.0%.
4) There are approximately 950,000 registered SMEs in KSA. In 2017, the
KSA government devoted SAR 72 billion to the development of this
sector.
G. Areas targeted for development
1) Construction
2) Solar energy
3) Education, especially english as second language (ESL)
4) Healthcare
5) IT
6) Processed foods
7) Financial servces
8) Water infrastructure
Recreation

BV 206: Valuing Small and Medium-Sized Companies Chapter 1 – Introduction to Small and Medium Sized Entities
©2020 The Saudi Authority for Accredited Valuers (TAQEEM) 4
2. SME Characteristics
A. This course addresses analytical and valuation issues in small and medium-
sized entities. For purposes of the discussion herein, the term SME captures
three levels of companies:
1) Pre-profitability start-up companies
(a) Start-up companies include companies from the first day of
operations until they reach a stabilized level of operations.
Included in this category are:
Seed-stage companies
Early-stage companies
Expansion-stage companies
Later-stage companies
(b) Start-up companies are covered in detail in Chapter 2.
2) Small operating companies
(a) Private companies that generate revenue and profits, most of
which are categorized as LLCs in KSA.
3) IFRS and SMEs
(a) Under IFRS, an SME is defined as an entity that:
Does not have public accountability (i.e. does not have
debt or equity instruments traded in a public market
and/or is not a fiduciary holding assets for a broad group
of outsiders)
Publishes general purpose financial statements for
external users
(b) The IFRS standards cover both public and private SMEs. Many
of the companies that are considered SMEs reporting under this
Standard are larger than the typical company discussed in this
manual.
(c) The valuer should familiarize himself or herself with the norms
under IFRS for SMEs.

BV 206: Valuing Small and Medium-Sized Companies Chapter 1 – Introduction to Small and Medium Sized Entities
©2020 The Saudi Authority for Accredited Valuers (TAQEEM) 5
II. KSA Corporate Environment
1. Financial reporting requirements
A. There are five types of corporate structures in KSA:
1) Joint stock companies (JSC)
(a) Public JSCs – Listed public companies on the Tadawul stock
exchange. Includes all bank and insurance companies.
(b) Closed JSCs – JSCs that are not listed on the exchange
(c) All JSCs are subject to a higher level of oversight by the Capital
Market Authority (CMA) and the Ministry of Investment. The cost
of compliance with government authorities is higher than other
types of companies.
(d) JSCs have the following characteristics:
Minimum of 2 shareholders (unless it is a closed JSC
owned by the government or one shareholder with capital
over of SAR 5 million)
Minimum of SAR 500,000 in capital
Must have between 3-11 Directors
Minority shareholders can allocate their votes for board
members in accordance with their ownership percentage
Must have an audit committee independent of the board
Can issue sukuks (sharia compliant bonds) and other
debt instruments
Shareholders do not have pre-emptive rights
2) Limited liability companies (LLC)
(a) LLCs are private companies and the most common form of
corporation in KSA.
(b) Maximum of 50 shareholders
(c) Privately held. Cannot offer shares to the public.
(d) Transfer of interests to third parties is subject to pre-emptive
right (a pre-emptive right is a shareholder’s ability to purchase

BV 206: Valuing Small and Medium-Sized Companies Chapter 1 – Introduction to Small and Medium Sized Entities
©2020 The Saudi Authority for Accredited Valuers (TAQEEM) 6
shares ahead of an the additional issuance of shares in order to
maintain a percentage stake in a company).
(e) Shareholders are able to specify a valuation method for their
interests in the LLC in the articles of association.
(f) Subject to limited oversight by the Ministry of Trade
(g) The LLC must have an auditor.
3) Joint liability companies
(a) The equivalent of a general partnership in North America
4) Limited partnership companies
(a) The equivalent of a limited liability partnership in North America
5) Joint venture
(a) Joint ventures are often set up with foreign companies or foreign
investors who want to do business in KSA and join with a
domestic partner or entity.
(b) Foreign investors can also set up business in KSA by forming an
LLC above.
B. All JSCs and LLCs must issue financial statements that comply with the Saudi
Organization of Certified Public Accountants (SOCPA) standards. SOCPA
standards have essentially merged with IFRS standards.
1) Banks and insurance companies must comply directly with IFRS.
2) SOCPA requires all listed companies to apply IFRS standards endorsed
by SOCPA as of the financial period beginning January 1, 2017.
3) All unlisted companies, including LLCs, whether public or privately
owned, must comply with IFRS standards endorsed by SOCPA as of
January 1, 2018.
C. As of 2015, the quality of financial information produced by both public and
private companies in KSA improved commensurate with the requirements
imposed by SOCPA, the CMA and the Ministries of Commerce and Investment.
1) Despite this, there is still no guarantee that the financial statements do
not contain errors or outright fraud. This is true with any financial
statements issued anywhere in the world, regardless of the level of
auditing scrutiny.

BV 206: Valuing Small and Medium-Sized Companies Chapter 1 – Introduction to Small and Medium Sized Entities
©2020 The Saudi Authority for Accredited Valuers (TAQEEM) 7
2) Also, there are circumstances in which the financial data may comply
with IFRS and SOCPA auditing requirements, but may need to be
converted into economic information that is more relevant to a valuation.
3) Financial data issued prior to the new regulations put in place over the
last five years should be especially scrutinized for errors.
III. Analyzing SME Financial Statements
1. Forensic accounting with SMEs
A. One challenge in valuing SMEs is the quality of the historical financial
information that the valuer needs to rely on to assess risk and make growth
projections.
B. Forensic accounting is the limited or extensive auditing process by which the
valuer reconstructs historical financial data into a set of reliable and relevant
financial statements. Forensic analysis becomes necessary in the valuation
process in the following cases:
1) The subject company has never issued financial statements. Data
consists of raw accounting documents such as bank deposits, check
registers, customer invoices, cash disbursement journals, etc.
2) The subject company has issued financial statements but the valuer has
valid reasons to expect that the statements are fraudulent or prepared in
error.
3) The subject company has issued valid financial statements but they
were not prepared under a recognized accrual accounting system (i.e.
SOCPA-IFRS, GAAP, etc.).
4) The financial statements are relevant and reliable but the accrual
accounting information must be converted to cash flow data that will
enable more relevant valuation observations.
C. Before accepting an assignment the valuer should consider the quality of the
historical financial data and determine how much forensic accounting will be
needed to convert the financial statements into reliable and relevant data on
which he/she can base prospective financial information (PFI).
1) Forensic accounting is a labor-intensive, time-consuming process. If the
valuation firm is not equipped to complete the forensic process in an
efficient manner, then the client should be informed of that and
arrangements should be made to either subcontract the accounting
work to another firm or decline the assignment.

BV 206: Valuing Small and Medium-Sized Companies Chapter 1 – Introduction to Small and Medium Sized Entities
©2020 The Saudi Authority for Accredited Valuers (TAQEEM) 8
2) The valuer should have relevant and reliable historical financial
statements prepared on the accrual basis of accounting before
beginning the valuation analysis.
3) Forensic analysis is a separate field of study and beyond the scope of
this course. The valuer should appreciate that most forensic
assignments are conducted under a separate engagement agreement
with the client.
4) Common forensic accounting problems and auditing procedures are
listed below.
D. Investigate the accounting system
1) A well-structured accounting system includes an IT function, risk
management procedures, and personnel with segregated duties. Many
SMEs do not have the resources to deploy such a system. SMEs
therefore have a higher potential for fraud or incompetence to
undermine the accounting data.
2) Before investigating the SME’s books of account, make an assessment
of the overall accounting system in the company. Ask the following
questions:
(a) Does the company have a formal accounting system with
recognized books of account?
(b) Who are the people responsible for the system? Are they
qualified?
(c) Is there a separation of accounting functions?
Does the physical inventory manager have sole access to
the company’s information system?
Is the warehouse manager the same person who
authorizes payments for goods received?
Is the salesman the same person who records the sale
and accepts payment?
Is the accounts payable employee the same person who
authorizes a payment and receives the goods or service?
There is a standard list of additional segregated
personnel and duties in every accounting audit program.
BV 206: Valuing Small and Medium-Sized Companies Chapter 1 – Introduction to Small and Medium Sized Entities
©2020 The Saudi Authority for Accredited Valuers (TAQEEM) 9
(d) SMEs rarely have a well-segregated system of accounting duties
in their personnel. Oftentimes, there is one or two people who
handle all of the office functions. This opens the door to fraud
and error.
The valuer has the right to assume that when working
with audited financial statements, the outside accountant
has made the appropriate investigations.
If the valuer does not have reliable financial statements,
he/she can qualify the valuation analysis as dependent
on the quality of the accounting data.
Note that most valuers have qualifying statements
in their engagement letters and their reports that
state that the valuation analysis assumes that the
underlying accounting data is accurate and free
from error or fraud – that the valuation in no way
represents an audit, review or compilation of the
accounting data on behalf of the valuation expert.
Having said that, in cases where misstatements in the
financial information are obvious, the valuer has an
obligation to address the issue or decline the job.
Valuers are not auditors and are not engaged
explicitly or implicitly to conduct an audit. Where
one is required, the valuer, if competent and able
to complete the work, should offer two separate
engagement letters – one for the forensic
accounting and another for the valuation.
E. Analyzing the income statement
1) Reported sales
(a) Under what conditions might sales be misstated? Is the client
motivated to overstate or understate sales?
In a taxable jurisdiction, the motivation is to underreport
sales which would lower income and taxes.
In other contexts, the client may overstate sales in order
to portray the company in a better light to gain a higher
valuation or to obtain financing.

BV 206: Valuing Small and Medium-Sized Companies Chapter 1 – Introduction to Small and Medium Sized Entities
©2020 The Saudi Authority for Accredited Valuers (TAQEEM) 10
Public companies in the U.S. are tempted to push
forward revenues to prop up a stock price or
satisfy nervous shareholders. It is not uncommon
to see public companies in the U.S. restate
financial statements for this reason.
(b) Income statement accounts are tied to balance sheet accounts.
Sales are analyzed by reviewing inventory records. Records for
beginning inventory, purchases, and ending inventory should be
reviewed both in the information system as well as a physical
count in the warehouse.
The sales journal should contain a record of the products
or service sold and the amount received.
Inventory records should tie to sales as well as cost of
goods sold.
If ending inventory is overstated (i.e. the books report
higher amounts of inventory than actually exist in the
warehouse), then there is the possibility that reported
sales and cost of sales are understated. Consider the
following example:
In the above example the financial statements show
ending inventory of 21,000 and cost of goods sold of
353,000. When the valuer performed an inventory count,
the actual ending inventory was 15,000, meaning that
actual cost of goods sold is 359,000.
What are the possibilities?
A simple error in the inventory count
Inventory is being stolen.
Sample (SAR 000) Reported Actual
Beginning inventory 24,000 24,000
Purchases 350,000 350,000
Ending inventory 21,000 15,000
Cost of goods sold 353,000 359,000

BV 206: Valuing Small and Medium-Sized Companies Chapter 1 – Introduction to Small and Medium Sized Entities
©2020 The Saudi Authority for Accredited Valuers (TAQEEM) 11
The client wanted to understate reported
revenues on the financial statements relative to
what actually occurred.
If the opposite were true – ending inventory was
understated (15,000 instead of 21,000) then sales and
cost of sales are overstated.
(c) In addition to reported revenues, purchases can be manipulated
as well. This is often done by employees who want to divert
purchased goods to their own possession.
A common form of fraud is when an employee, usually
one who works in accounts payable, sets up a dummy
supply company and creates fake invoices from that
company which the subject company then pays.
If the invoicing system is not validated anywhere
else in the accounting system (shipping/receiving,
etc.), then the fraud can be maintained
indefinitely.
2) Reported expenses
(a) Manipulating the reporting of expenses is usually the easiest and
least complex way of extracting illicit income from the company
and/or to manipulate reported income.
(b) In an accrual accounting statement, expenses should only
capture the market value of charges that are necessary for the
company to operate in the current period. In addition, expenses
should be timed to the generation of sales in the same period.
Expenses that are paid for a prior period’s operations or are paid
for a future period’s operations are not recorded on the income
statement but are charged to balance sheet accounts - accounts
payable or prepaid expenses.
(c) Illicit expenses – It is difficult to identify an illicit expense on the
income statement just by looking at the statement. These issues
come to light usually by standard analytical procedures:
Common size statement – all income statement accounts
are expressed in excel as a percentage of sales. The
analyst can then look at multiple years of data for
percentages that are not in line with other years.

BV 206: Valuing Small and Medium-Sized Companies Chapter 1 – Introduction to Small and Medium Sized Entities
©2020 The Saudi Authority for Accredited Valuers (TAQEEM) 12
Comparison to industry norms – Good data for industry
financial ratios may or may not exist depending on the
country and industry. If a survey is available, differences
between the company’s ratios and industry norms may
indicate improprieties in the recording of expenses.
Management should be asked to explain differences.
(d) Expense adjustments are usually categorized in two groups:
Non-operating expenses – expenses incurred that were
not related to the operation of the business. These
expenses may not necessarily be illicit or illegally
recorded. Examples:
Excessive salary – a common adjustment is made
to officer salary which is often too high relevant to
industry norms. This adjustment is discussed in
detail below.
Excessive rent
Non-recurring expenses – expenses incurred legitimately
that will not reoccur in the future. Remember that the
purpose of this part of the analysis is to render financial
statements that provide a better basis for predicting
future operations. Examples:
Non-recurring legal expense
Non-recurring damages
Non-recurring gains or losses on disposal
F. Analyzing the balance sheet
1) The valuer should be aware that changes to the income statement will
change historical balance sheet accounts and historical financial ratios.
It is difficult to trace each income statement adjustment through to the
historical balance sheets and often this exercise is not worth the time.
The valuer should be aware though that if income statement
adjustments were made, then balance sheet accounts such as return on
equity, turnover ratios, etc. will also be affected.
2) The balance sheet at the valuation date may need to be adjusted to
account for differences between book value and market value.

BV 206: Valuing Small and Medium-Sized Companies Chapter 1 – Introduction to Small and Medium Sized Entities
©2020 The Saudi Authority for Accredited Valuers (TAQEEM) 13
(a) If tangible assets were recorded at historical cost, then there
may be a material difference between recorded book value and
the actual market value. This must be adjusted.
(b) In the following example, a company’s real estate was appraised
by a real estate appraiser at 21.4 million. This is significantly
above the booked value of 430,000. The book value is adjusted
up by 20.97 million.
(c) Two other adjustments were made, one to add accounts
receivable and another to add current liabilities.
(d) After these adjustments, the adjusted equity (partners’ capital
account) is equal to 21.17 million.
3) Non-operating and excess assets
(a) Owners of small companies often fail to distinguish between the
company’s accounts and their own personal accounts. The
SME’s balance sheet may include assets that are not needed to
generate sales. Examples include:
Personal and family automobiles
Personal homes and other properties (boats, airplanes,
etc.)
REAL ESTATE HOLDING COMPANY - EQUITY VALUATION
December Adjusted
2019 Adjustments 2019
ASSETS
Current Assets
Accounts Receivable 0 4,852 4,852
REAL ESTATE VALUATION Total current assets 0 4,852
Real estate, net 430,000 20,970,000 21,400,000
2019
Intangible assets, net 0 0 0
Effective gross income 3,145,400
Expenses 1,752,191 Total Assets 430,000 20,974,852 21,404,852
Net operating income 1,393,209
Capitalization rate 6.50% Total current liabilities 231,907 3,218 235,125
Indicated Value 21,433,985
Total liabilities 231,907 3,218 235,125
Rounded Value 21,400,000
Partners' capital accounts 198,093 20,971,634 21,169,727
Total liabilities and capital 430,000 21,404,852

BV 206: Valuing Small and Medium-Sized Companies Chapter 1 – Introduction to Small and Medium Sized Entities
©2020 The Saudi Authority for Accredited Valuers (TAQEEM) 14
These assets should be removed from the balance sheet,
appraised separately, and added to the value at the end
of the assignment. Any income statement effects of the
assets (rent, utilities, etc.) should be removed from the
income statement prior to conducting the income
approach.
(b) Each company should be analyzed to assess if the company has
excess cash or excess working capital (or the alternative,
deficient levels of cash and working capital).
Excess cash, working capital, or marketable securities
should be treated the same way as non-operating assets.
They should be removed and added to the final value.
Negative working capital should be subtracted from the
final value since a buyer would need to invest that
amount in the company after the acquisition.
Note that in some industries a negative working
capital balance is the norm; in such cases, the
valuer would not necessarily subtract the negative
balance from value.
4) The adjusted balance sheet becomes relevant in the cost approach if
the adjusted equity value is at or above the values indicated in the
income and market approaches.
G. Comparing to industry norms
1) A sound financial analysis includes comparing the SME’s financial ratios
to financial ratios in the industry. This topic was discussed at length in
BV 201. Such comparisons are difficult to conduct unless the valuer
can get industry financial data.
(a) A good source for industry surveys and ratios in KSA is Bayan
Indices: https://qima.taqeem.sa/event/3
2. Distinguishing between owners and owner-managers
A. A distinction must be made between an owner who actively works in the
business and owners who do not work in the business but instead hire third-
party employees to manage the day-to-day operations.
1) The distinction centers around compensation and perquisites that are
paid to the owner who works in the business.

BV 206: Valuing Small and Medium-Sized Companies Chapter 1 – Introduction to Small and Medium Sized Entities
©2020 The Saudi Authority for Accredited Valuers (TAQEEM) 15
(a) Any compensation or perquisites paid to an owner (or owner’s
family members) who does not work in the business should be
added back to profits.
2) All compensation paid to the working owner(s) must be analyzed in
comparison to a reasonable level of compensation that would be paid to
a third-party executive who would be doing the same job.
(a) Return on labor – a reasonable level of compensation should be
paid to an owner who works in the company. This is a legitimate
business expense.
(b) Return on ownership – returns on ownership (i.e. dividends) are
not legitimate business expenses and do not get deducted on
the income statement. This includes amounts paid to an owner
above what he/she deserves as a return on labor.
3) Value is based on projected operating earnings. These earnings cannot
be understated because an owner takes too much out in salary.
Common abuses to the company income statement include:
(a) Excessive salary - It common, especially with owners of small
companies, to treat the business as his or her personal bank
account, withdrawing money when it becomes available.
(b) Perquisites - It is also common for owners to have the company
pay for personal and family expenses (perquisites). Perquisites
include:
Automobile expense – all auto payments that are not
made for business operations should be added back.
Salaries for family, friends – Many owners pay salaries to
spouses and children who do not work in the company.
Vacations – Many owners run the cost of family and
personal vacations through their businesses.
Household expenses – Payments for groceries, school
tuition, personal hobbies, etc. If the expense is not made
in the generation of operating revenues (i.e. a legitimate
business expense) it gets added back to profit.
(c) Rent – If the business owner personally owns the underlying real
estate on which the company operates, it is common for the
owner to overcharge the company for rent and utilities.
BV 206: Valuing Small and Medium-Sized Companies Chapter 1 – Introduction to Small and Medium Sized Entities
©2020 The Saudi Authority for Accredited Valuers (TAQEEM) 16
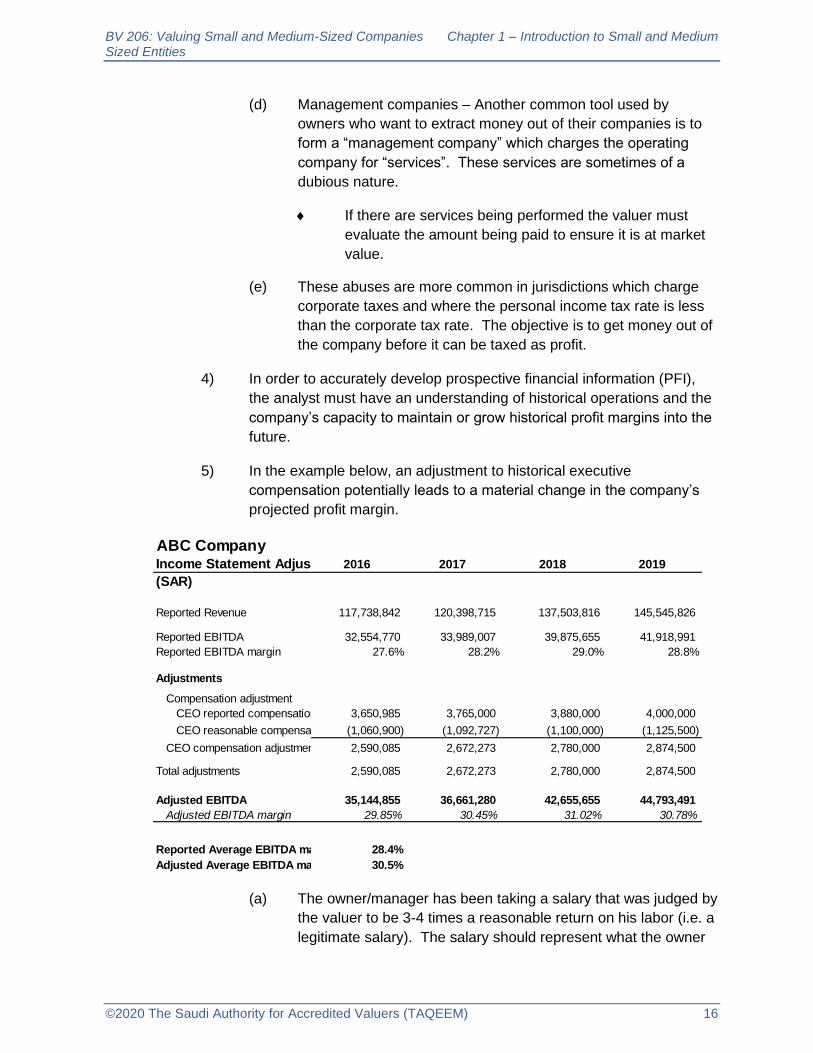
(d) Management companies – Another common tool used by
owners who want to extract money out of their companies is to
form a “management company” which charges the operating
company for “services”. These services are sometimes of a
dubious nature.
If there are services being performed the valuer must
evaluate the amount being paid to ensure it is at market
value.
(e) These abuses are more common in jurisdictions which charge
corporate taxes and where the personal income tax rate is less
than the corporate tax rate. The objective is to get money out of
the company before it can be taxed as profit.
4) In order to accurately develop prospective financial information (PFI),
the analyst must have an understanding of historical operations and the
company’s capacity to maintain or grow historical profit margins into the
future.
5) In the example below, an adjustment to historical executive
compensation potentially leads to a material change in the company’s
projected profit margin.
(a) The owner/manager has been taking a salary that was judged by
the valuer to be 3-4 times a reasonable return on his labor (i.e. a
legitimate salary). The salary should represent what the owner
ABC Company
Income Statement Adjustments2016 2017 2018 2019
(SAR)
Reported Revenue 117,738,842 120,398,715 137,503,816 145,545,826
Reported EBITDA 32,554,770 33,989,007 39,875,655 41,918,991
Reported EBITDA margin 27.6% 28.2% 29.0% 28.8%
Adjustments
Compensation adjustment
CEO reported compensation 3,650,985 3,765,000 3,880,000 4,000,000
CEO reasonable compensation (1,060,900) (1,092,727) (1,100,000) (1,125,500)
CEO compensation adjustment 2,590,085 2,672,273 2,780,000 2,874,500
Total adjustments 2,590,085 2,672,273 2,780,000 2,874,500
Adjusted EBITDA 35,144,855 36,661,280 42,655,655 44,793,491
Adjusted EBITDA margin 29.85% 30.45% 31.02% 30.78%
Reported Average EBITDA margin 28.4%
Adjusted Average EBITDA margin 30.5%

BV 206: Valuing Small and Medium-Sized Companies Chapter 1 – Introduction to Small and Medium Sized Entities
©2020 The Saudi Authority for Accredited Valuers (TAQEEM) 17
would have to pay to a third party in an arms’ length agreement
to obtain the same level of expertise.
(b) In the above example, without the adjustment, and assuming no
other factors that would make forecasted operations different
from the recent past, the valuer may have projected a 28.4%
EBITDA margin into the future.
After the adjustment, the accurate projection, with the
same assumptions, would be 30.5%.
6) In order to complete such an adjustment, the valuer needs to have a
basis for estimating reasonable compensation. Such a basis can be
obtained from:
(a) Industry financial ratio surveys
(b) Analyzing salaries of executives of publicly-held companies in
the same industry
(c) Industry literature
7) The cash value of all perquisites should be included in the analysis.
(a) Perquisites are essentially the same as compensation. It doesn’t
matter whether the owner extracts the money in cash and then
uses the cash to pay household bills personally or orders the
company to pay his household bills directly.
IV. Valuation overview
1. Valuation Challenges
A. A distinction is made between operating SMEs and start-up companies that are
pre-commercial.
1) SME valuation issues will be discussed in this chapter.
2) Start-up valuations are discussed in chapter 2.
B. When valuing a start-up, many practitioners look for a new or adapted version
of a quantitative valuation model that can magically deal with the challenges
that are particular to a start-up company. This is, for the most part, a fallacy.
1) Consider the metrics that standard valuation models require as inputs:
(a) Annual growth rate
(b) Discount rate

BV 206: Valuing Small and Medium-Sized Companies Chapter 1 – Introduction to Small and Medium Sized Entities
©2020 The Saudi Authority for Accredited Valuers (TAQEEM) 18
(c) Sales level
(d) Profit margin
2) Now consider the dilemna that start-up companies pose to the valuation
practitioner:
(a) Annual growth rate – Most start-up companies are either pre-
commercial or are in a very early stage of operation. This
means that forecasted growth rates will be speculative.
(b) Discount rate – Although a risk assessment for early-stage
companies may be well-above the range for established
companies, an exact risk metric (25%? 35%, 75%?) is also
speculative.
(c) It is very difficult to forecast when sales will occur and the rate at
which sales will grow in the years after commercialization.
(d) Profit margin - Although the expense forecast (and resultant
profit margin) might be the most achievable of these four
metrics, it is still difficult to accurately measure cost of sales and
overhead expenses that may not occur for years in the future.
3) The absence of reliable inputs for these four metrics renders standard
valuation models only marginally useful for start-ups.
(a) Applying a DCF model to an early-stage life sciences lab that is
years away from commercial operations is speculative, at best.
(b) The same is true with a guideline company methodology; a start-
up company cannot, by definition, be compared to a publicly-
held company.
C. SMEs, as defined herein, have reached an operating stage and therefore the
valuer can apply standard valuation models.
1) The valuer must understand that although the SME is generating
revenue and profit it still may not have reached stabilized operations.
2) Care must be taken to assess near-term growth rates which may be
more dynamic than rates ten years down the road.
3) Measuring the cost of capital for SMEs can also be challenging. Size
risk studies exist in the United States and Europe which attempt to
capture the basket of risks that characterize small companies. These
studies do not necessarily apply to all economies though.

BV 206: Valuing Small and Medium-Sized Companies Chapter 1 – Introduction to Small and Medium Sized Entities
©2020 The Saudi Authority for Accredited Valuers (TAQEEM) 19
(a) Despite this, the valuer should recognize that when developing
an SME’s cost of equity, a risk premium above similar large-cap
stocks may be warranted.
(b) Developing a cost of equity for the SME is covered in more detail
in Chapter 4.
2. Valuation approaches
A. Income approach
1) It is assumed that the candidate has completed BV 202 and is
knowledgeable of the theory and practice of the income approach. A
brief review of some key concepts follows.
(a) Capitalization vs discounting models
A capitalization model is a single calculation:
A discounting model is a forecast and present value
calculation:
(b) Equity or invested capital models
Equity income streams
Net after-tax equity cash flow
Net income after tax
Pre-tax income (EBT)
10,000 x (1 + .03)
.15 - .03
10,300
12.0%
= £85,833
=
2014 2015 2016 2017 2018 Residual
Value = CF1 CF2 CF3 CF4 CF5 CF5 * (1 + G)
(1 + k) (1 + k)2
(1 + k)3
(1 + k)4
(1 + k)5
K - G
(1 + k)5
Where:
CF = Cash flow
k = Discount rate
G = Growth rate
+ + ( )++ +

BV 206: Valuing Small and Medium-Sized Companies Chapter 1 – Introduction to Small and Medium Sized Entities
©2020 The Saudi Authority for Accredited Valuers (TAQEEM) 20
Invested capital income streams
Net after-tax invested capital cash flow
Net operating profit after-tax (NOPAT)
Earnings before interest and tax (EBIT)
Earnings before interest, tax, depreciation and
amortization (EBITDA)
Prospective Financial Information (PFI)
Use of management’s forecast or an independent
forecast prepared by the valuer
Analyzing changing growth rates (growth rates
are discussed in greater detail in chapter 3)
Deriving a cost of equity
The capital asset pricing model (CAPM)
Build-up model
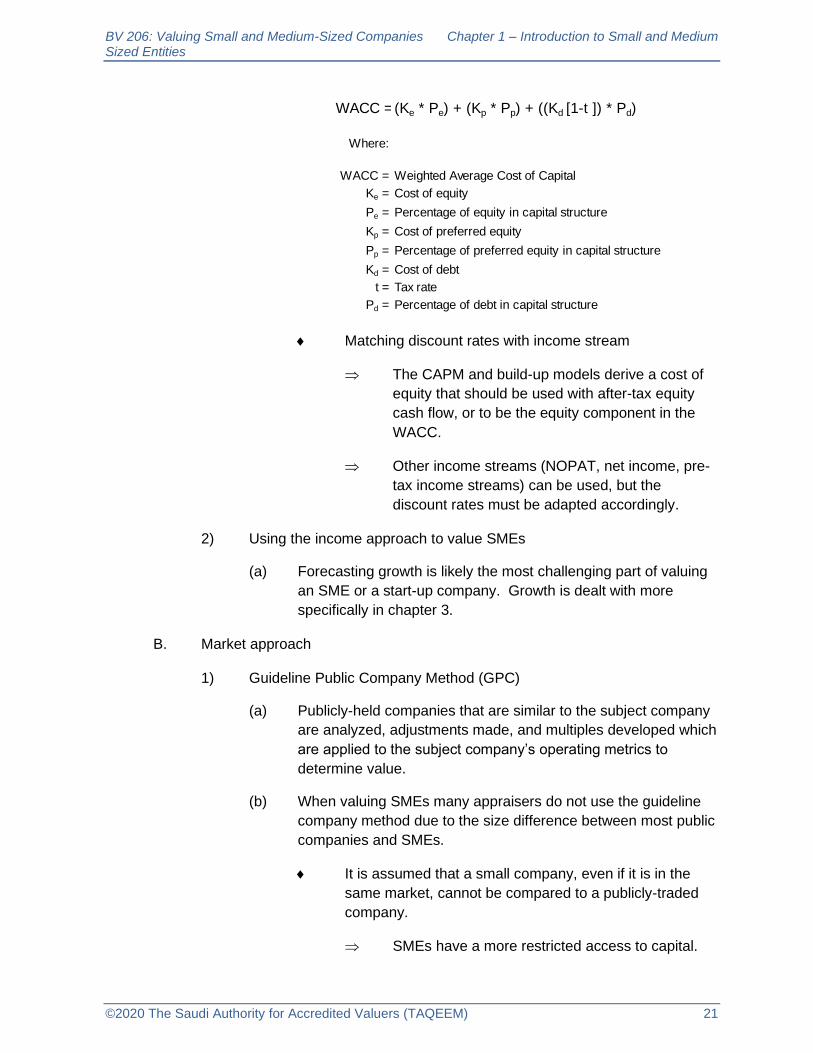
Deriving a weighted average cost of capital (WACC)
Cost of debt (after-tax)
Cost of equity
Capital structure and the WACC formula
Ke = Rf + β(ERP) + Α
Where:
Ke = Cost of equity
Rf = Risk-free rate
β = Beta (systematic risk)
ERP = Equity risk premium
A = Alpha (size and specific risk)
Risk-free rate 3.00%
Premia over Rf 13.50%
Company specific risk 2.00%
Cost of Equity 18.00%
BV 206: Valuing Small and Medium-Sized Companies Chapter 1 – Introduction to Small and Medium Sized Entities
©2020 The Saudi Authority for Accredited Valuers (TAQEEM) 21
Matching discount rates with income stream
The CAPM and build-up models derive a cost of
equity that should be used with after-tax equity
cash flow, or to be the equity component in the
WACC.
Other income streams (NOPAT, net income, pre-
tax income streams) can be used, but the
discount rates must be adapted accordingly.
2) Using the income approach to value SMEs
(a) Forecasting growth is likely the most challenging part of valuing
an SME or a start-up company. Growth is dealt with more
specifically in chapter 3.
B. Market approach
1) Guideline Public Company Method (GPC)
(a) Publicly-held companies that are similar to the subject company
are analyzed, adjustments made, and multiples developed which
are applied to the subject company’s operating metrics to
determine value.
(b) When valuing SMEs many appraisers do not use the guideline
company method due to the size difference between most public
companies and SMEs.
It is assumed that a small company, even if it is in the
same market, cannot be compared to a publicly-traded
company.
SMEs have a more restricted access to capital.
WACC =(Ke * Pe) + (Kp * Pp) + ((Kd [1-t ]) * Pd)
Where:
WACC = Weighted Average Cost of Capital
Ke = Cost of equity
Pe = Percentage of equity in capital structure
Kp = Cost of preferred equity
Pp = Percentage of preferred equity in capital structure
Kd = Cost of debt
t = Tax rate
Pd = Percentage of debt in capital structure

BV 206: Valuing Small and Medium-Sized Companies Chapter 1 – Introduction to Small and Medium Sized Entities
©2020 The Saudi Authority for Accredited Valuers (TAQEEM) 22
SMEs are less diversified.
SMEs rely on a smaller labor pool, often just one
or two key persons.
SMEs tend to have a smaller and riskier customer
base.
(c) Despite the obvious differences between a public company
which may generate hundreds of millions or billions in revenue
and a small closely-held business, methods have been
developed which isolate size risk. These sources can be used to
mathematically adjust the reported multiples from the GPC. Two
studies exist as of 2019:
Duff & Phelps Risk Premium Report (U.S. study)
Prof. Erik Peek & Duff & Phelps (European study)
Example:
A GPC has been selected as a legitimate comparable
company for a subject company. The price/earnings ratio
for the GPC is 9.50x.
The market value of equity of the GPC (shares
outstanding x price per share) is $2.95 billion.
The estimated market value of the equity of the
subject company is $110 million (from the income
approach).
The data below was extracted from the Duff &
Phelps Risk Premium Report from several years
ago. The Study allocates the public stocks in the
U.S. into 25 size portfolios with size defined as
the market value of equity.
Given the equity value of the GPC, it falls into the
12th portfolio and has a size premium relevant to
the capital asset pricing model of 3.03%.
The subject company falls into the 25th portfolio
(as many subject companies do) and has a size
premium over the CAPM of 7.15%.

BV 206: Valuing Small and Medium-Sized Companies Chapter 1 – Introduction to Small and Medium Sized Entities
©2020 The Saudi Authority for Accredited Valuers (TAQEEM) 23
Therefore, the GPC, in terms of size risk, is 4.12%
less risky than the subject company (i.e. 7.15 –
3.03).
This quantitative measurement of size risk
differential is useful in adjusting the GPC’s
reported P/E multiple into a P/E multiple that is
relevant to the subject company.

BV 206: Valuing Small and Medium-Sized Companies Chapter 1 – Introduction to Small and Medium Sized Entities
©2020 The Saudi Authority for Accredited Valuers (TAQEEM) 24
Market Value Premium
P of Equity ($ mill) Over CAPM
1 127,995 -1.72%
2 36,587 -0.15%
3 21,569 0.52%
4 16,126 0.88%
5 12,369 1.22%
6 9,399 1.56%
7 7,150 1.91%
8 5,597 2.21%
9 4,775 2.41%
10 3,948 2.65%
11 3,418 2.83%
12 2,933 3.03% Guideline Co.
13 2,675 3.14%
14 2,346 3.31%
15 2,086 3.45%
16 1,808 3.63%
17 1,558 3.82%
18 1,347 4.00%
19 1,172 4.18%
20 977 4.41%
21 838 4.60%
22 697 4.83%
23 515 5.21%
24 331 5.77%
25 111 7.15% Subject Co.
Guideline company P/E multiple = 9.50x
Guideline company cap rate = 10.53%
Discount rate - growth = cap rate
Assume:
Risk-free rate 3.5%
Equity Risk Premium 5.5%
Beta 1.0
GPC growth rate 1.5%
GPC size risk 3.03%
GPC CAPM calculation
3.5% + 1.0(5.5%) + 3.03% = 12.03%
Subject Company calculations
CAPM:
3.5% + 1.0(5.5%) + 7.15% = 16.15%
Assume growth is the same as GPC
Subject Company capitalization rate
16.15% - 1.5% = 14.65%
Subject Company P/E multiple 6.83x
Duff & Phelps Risk Premium Study

BV 206: Valuing Small and Medium-Sized Companies Chapter 1 – Introduction to Small and Medium Sized Entities
©2020 The Saudi Authority for Accredited Valuers (TAQEEM) 25
In the above calculations, the 9.50x GPC multiple
is inverted to obtain the relevant capitalization rate
of 10.53%. We know that this 10.53% equals the
GPC’s equity discount rate less its growth rate.
Given the metrics in the CAPM (which are given
in this example and are assumed to be the same
for both companies except for the size risk), the
GPC’s equity discount rate is calculated as
12.03%.
◼ Therefore, the GPC’s growth rate is 1.5%
(12.03 – 1.5 = 10.53).
The subject company’s discount rate is 16.15%,
as shown above. Remember, the discount rate
minus growth equals the capitalization rate.
Therefore, the subject’s cap rate is 14.65%
(16.15 – 1.5 = 14.54)
We invert the subject’s cap rate to obtain the risk-
adjusted P/E multiple appropriate for the subject
company. The multiple is 6.83x.
Therefore, given the similarity between the GPC
and the subject and the difference in size risk
between the two companies, the GPC multiple is
adjusted down from 9.50x to 6.83x.
2) Transaction Method
(a) The transaction method has been downplayed as a primary
approach to value since most information sources on
transactions do not provide enough data to verify the cash value
paid and to ensure that the value paid is not synergistic value.
(b) However, most transaction databases contain data on smaller
companies which are more relevant to SMEs.
(c) If a critical mass of companies in the subject’s same industry can
be analyzed and multiples derived, then the transaction method
may take on more prominence in the valuation conclusion.

BV 206: Valuing Small and Medium-Sized Companies Chapter 1 – Introduction to Small and Medium Sized Entities
©2020 The Saudi Authority for Accredited Valuers (TAQEEM) 26
3. Excess earnings model
A. In the 1920s the U.S. government prohibited the sale of alcoholic beverages in
the country and in so doing put numerous production and retail companies out
of business. As part of that action the government was obligated to reimburse
those companies for their loss. The U.S. Internal Revenue Service developed a
formula called the excess earnings method which attempted to put a value on
those companies.
1) The formula attempts to separate returns on tangible assets from
returns on intangible assets and assign separate rates of return to each.
Sample Excess Earnings Analysis
Balance Sheet (SAR)
Dec. 31, 2019
ASSETS
Total Current Assets 86,934,541
Property and Equipment, net 10,756,121
Total Assets 97,690,662
LIABILITIES & EQUITY
Total Current Liabilities 21,735,828
Total Long-term liabilities 2,620,988
Total Liabilities 24,356,816
Shareholders' Equity 73,333,846
Total Liabilities and Partners' Capital 97,690,662

BV 206: Valuing Small and Medium-Sized Companies Chapter 1 – Introduction to Small and Medium Sized Entities
©2020 The Saudi Authority for Accredited Valuers (TAQEEM) 27
2) The sample company above has tangible equity of SAR 73.3 million (it is
tangible equity since there are no intangible assets booked on the
balance sheet).
3) The model assumes that a return on tangible equity of 15.0% is a
legitimate market return given the company, its industry, and the basket
of risks that affect these assets.
4) Given the return rate, a prospective buyer would observe that the
expected company returns, without intangible value, would be
approximately $11 million (73,333,846 x .15).
Sample Excess Earnings Analysis
Income Statement (SAR)
Dec. 31, 2019
Revenue 106,203,741
Cost of Revenues 9,930,408
Gross Profit 96,273,333
General and Administrative Expenses 65,546,691
EBITDA 30,726,642
Depreciation & amortization 1,065,966
Operating income 29,660,676
Total other income (686,782)
EBT 28,973,894
Sample Company
Excess Earnings Calculations (SAR)
Reported Equity 73,333,846
Tangible Return on Equity @ 15.0% 11,000,077 (15% x 73.3m)
Total earnings 28,973,894
less: tangible earnings (11,000,077)
Excess earnings 17,973,817
Excess Capitalization @ 25.0% 71,895,268
Valuation
Tangible Value (book value) = 73,333,846
Intangible Valule = 71,895,268
Total value = 145,229,114
BV 206: Valuing Small and Medium-Sized Companies Chapter 1 – Introduction to Small and Medium Sized Entities
©2020 The Saudi Authority for Accredited Valuers (TAQEEM) 28
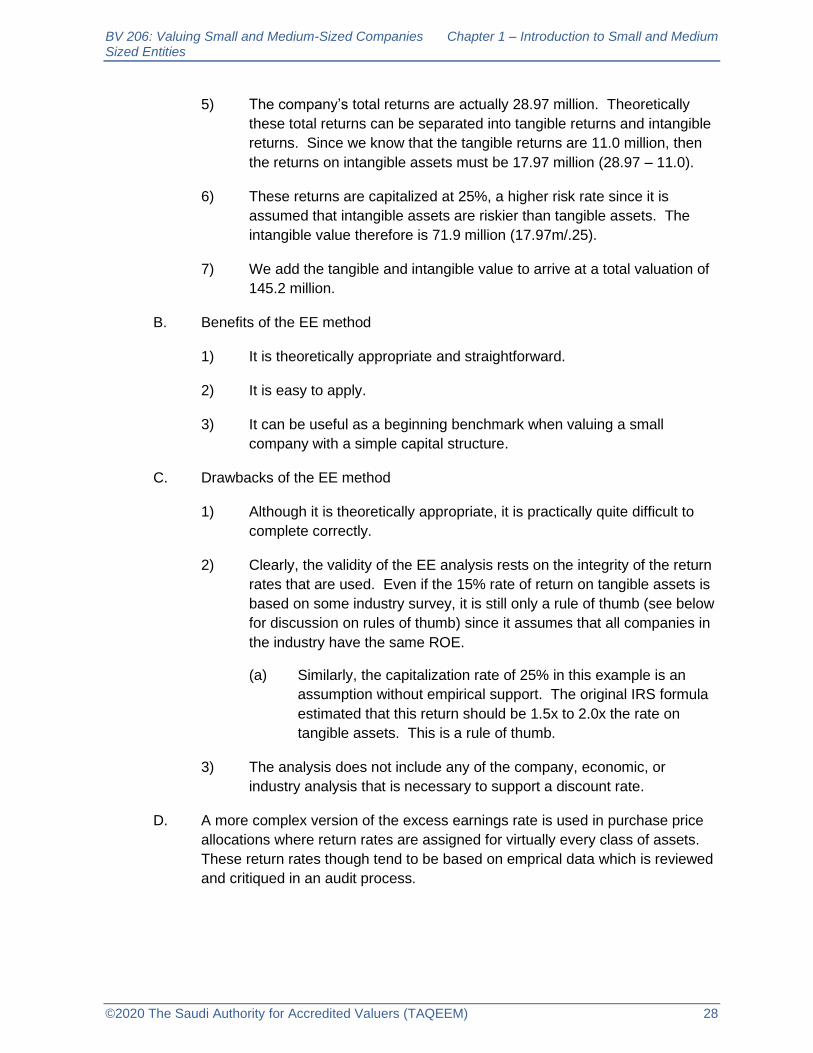
5) The company’s total returns are actually 28.97 million. Theoretically
these total returns can be separated into tangible returns and intangible
returns. Since we know that the tangible returns are 11.0 million, then
the returns on intangible assets must be 17.97 million (28.97 – 11.0).
6) These returns are capitalized at 25%, a higher risk rate since it is
assumed that intangible assets are riskier than tangible assets. The
intangible value therefore is 71.9 million (17.97m/.25).
7) We add the tangible and intangible value to arrive at a total valuation of
145.2 million.
B. Benefits of the EE method
1) It is theoretically appropriate and straightforward.
2) It is easy to apply.
3) It can be useful as a beginning benchmark when valuing a small
company with a simple capital structure.
C. Drawbacks of the EE method
1) Although it is theoretically appropriate, it is practically quite difficult to
complete correctly.
2) Clearly, the validity of the EE analysis rests on the integrity of the return
rates that are used. Even if the 15% rate of return on tangible assets is
based on some industry survey, it is still only a rule of thumb (see below
for discussion on rules of thumb) since it assumes that all companies in
the industry have the same ROE.
(a) Similarly, the capitalization rate of 25% in this example is an
assumption without empirical support. The original IRS formula
estimated that this return should be 1.5x to 2.0x the rate on
tangible assets. This is a rule of thumb.
3) The analysis does not include any of the company, economic, or
industry analysis that is necessary to support a discount rate.
D. A more complex version of the excess earnings rate is used in purchase price
allocations where return rates are assigned for virtually every class of assets.
These return rates though tend to be based on emprical data which is reviewed
and critiqued in an audit process.

BV 206: Valuing Small and Medium-Sized Companies Chapter 1 – Introduction to Small and Medium Sized Entities
©2020 The Saudi Authority for Accredited Valuers (TAQEEM) 29
4. Rules of thumb
A. Rules of thumb are formulas, similar to the excess earnings method described
above, in which small companies are valued.
1) These formulas evolved largely from business brokers in the United
States over decades of observations of transactions of small companies.
Business brokers are market middlemen who link sellers of businesses
with prospective buyers, similar to real estate brokers.
The formulas are categorized by industry, such as grocery stores,
medical practices, bakeries, auto dealerships, petrol stations, etc.
2) These formulas have been published in a few sources in the United
States, including:
(a) Handbook of Small Business Valuation Formulas and Rules of
Thumb, Glenn Desmond, Valuation Press, 1993
(b) Business Reference Guide, Tom West, Business Brokers Press,
2008
(c) Other Valuation text books, such as Shannon Pratt’s Valuing a
Business, contain ad hoc references to several rules of thumb.
3) Similar to the EE method, rules of thumb might be used as a benchmark
or as a check against a real valuation analysis.
B. Example – The following business is a dental practice with a sole shareholder
dentist (since rules of thumb have not yet been tabulated in KSA, the following
example was taken from the U.S.).

BV 206: Valuing Small and Medium-Sized Companies Chapter 1 – Introduction to Small and Medium Sized Entities
©2020 The Saudi Authority for Accredited Valuers (TAQEEM) 30
1) There are several rules of thumb for dental practices in the United
States, including:
(a) 20% to 60% of annual revenues, plus fixtures, equipment, and
inventory.
Rule of Thumb Dental Practice
Balance Sheet
Dec. 31, 2019
ASSETS
Current Assets
Cash 65,528
Total Current Assets 65,528
Property and Equipment, net 100,000
TOTAL ASSETS 165,528
LIABILITIES & EQUITY
Current Liabilities
Note payable 32,467
Total Current Liabilities 32,467
Total Liabilities 32,467
Total stockholders' equity 133,061
Total Liabilities and Stockholders' Equity 165,528
Rule of Thumb Dental Practice
Income Statement (SAR)
Dec. 31, 2019
Revenues 696,639
General & administrative expenses
Compensation of officers 235,000
Salaries & wages 54,080
Repairs & maintenance 819
Rents 37,640
Pension, profit-sharing 50,576
Insurance 28,509
Legal & professional 52,240
Other 69,785
Total general & administrative expenses 528,649
Income 167,990

BV 206: Valuing Small and Medium-Sized Companies Chapter 1 – Introduction to Small and Medium Sized Entities
©2020 The Saudi Authority for Accredited Valuers (TAQEEM) 31
(b) 8.0x to 12.0x monthly revenues, plus net asset value, less fixed
assets.
(c) The first rule of thumb yields the following:
(d) The second rule of thumb yielded:
.
2) These two analyses yielded disparate values for the practice, from SAR
380,000 to SAR 610,000, a 58% difference.
(a) This is one of the major problems with using rules of thumb.
Different rules for the same industry may yield widely disparate
values.
3) The valuer will notice that he has to select from a range of possible
mutliples (20% to 60% of revenue and 8.0x to 12.0x monthly revenues).
(a) The implication is that the valuer can make a judgment as to the
quality and financial health of the dental practice: a poorly run
practice might earn the 20% multiplier or the 8.0x multiplier while
a well-run, healthy practice might earn a 60% multiplier or 12.0x
multiplier.
C. Drawbacks of Rules of Thumb
1) They assume that all businesses in the industry are the same or fall in a
narrow range. To the extent that the rule of thumb provides a wide
range of multiples (e.g. 20% to 60%) then its usefulness as a ‘rule’ is
diminished.
Rule of Thumb #1 (SAR)
Annual Fee Revenue 696,639
Multiplier 40.0% 278,656
PP&L (appraised value) 100,000
Total Value 380,000
Rule of Thumb #2 (SAR)
Annual Fee Revenue 696,639
Monthly Fee Revenue 58,053
Multiplier 10.0x 580,533
Net asset value 133,061
Less: fixed assets (100,000)
Total Value 610,000

BV 206: Valuing Small and Medium-Sized Companies Chapter 1 – Introduction to Small and Medium Sized Entities
©2020 The Saudi Authority for Accredited Valuers (TAQEEM) 32
2) Some industries have multiple rules of thumb from different sources
which may not correlate well.
3) They allow little analysis of the specific subject company.
4) Some rules of thumb provide wide ranges of multiples.
5) They are not based on accepted valuation models, but rather from
hundreds or thousands of observations over decades.
6) They provide an indication of central tendency and do not speak to the
range of observations on which they are based.
D. Benefits of Rules of Thumb.
1) They are easy to apply.
2) They might provide a range of values against which the more reliable
valuation approaches can be compared.
V. Personal versus Company Goodwill
1. The valuer needs to be conscious of separating two types of company goodwill value in
SMEs – personal goodwill vs. company goodwill.
A. Company goodwill – Intangible value that adheres to the company and is
transferable in a transaction. Most of this value can be traced to an asset that
is sold:
1) Patents
2) Tradename
3) Software
4) Customer relationships
5) In-process research & development
B. Personal goodwill – intangible value that adheres to the owner or owners
personally and is not transferable in a transaction. It cannot be separated from
the owner and follows him after he/she leaves.
C. Consider the following two companies:
1) Cardiology Medical Practice #1 – This practice is wholly-owned and
operated by Dr. Ahmed Abadi, a world famous cardiologist who
personally invented angioplasty, stents, and was the first to develop the

BV 206: Valuing Small and Medium-Sized Companies Chapter 1 – Introduction to Small and Medium Sized Entities
©2020 The Saudi Authority for Accredited Valuers (TAQEEM) 33
coronary bypass surgery. He has been a cardiologist for 35 years.
Patients come to Dr. Abadi’s practice in Riyadh from all over the world.
The practice generates SAR 10,000,000 in revenue.
2) Cardiology Medical Practice #2 – This practice is wholly-owned and
operated by Dr. Tariq Abboud. Dr. Abboud graduated from Salman bin
Abdlaziz University three years ago and purchased a cardiology practice
from a retiring cardiologist in Dammam two years ago. The practice
generates SAR 1,000,000 in revenue.
3) These are an extreme example of the difference between personal and
corporate goodwill. A buyer of Practice #1 (assuming he/she is not
world famous in the field) would justifiably argue that the 10,000,000 in
revenues generated by Dr. Abadi would not transfer to him/her. Without
the same reputation, patients from around the world would probably not
travel to his/her location to be treated. Therefore the Market Value of
the practice would not be based on the reported revenues and profits.
This is an example of high personal goodwill.
(a) The Practice has substantial intrinsic value, but much less
market value.
4) A buyer of Practice #2, based on observations of the patient base,
would more likely assume that the majority of patients would continue to
patronize the practice after a transaction.
(a) In this case, the practice has little to no personal goodwill. The
market value would be based on the reported financial
statements.
D. Non-compete Agreements
1) A non-compete agreement is a legal agreement wherein a selling owner
agrees not to open a competing business within the market area of the
business being sold for a defined period of time.
2) A non-compete agreement in certain contexts is a measurement of the
company’s intangible value, part or all of which might be the personal
goodwill.
(a) A non-compete agreement analysis is one tool to separate a
company’s intangible value into company goodwill versus
personal goodwill. In most cases, if no personal goodwill
existed, the risk of a seller taking business from the buyer would
be significantly lower.

BV 206: Valuing Small and Medium-Sized Companies Chapter 1 – Introduction to Small and Medium Sized Entities
©2020 The Saudi Authority for Accredited Valuers (TAQEEM) 34
Note that the non-compete value might not entirely
consist of personal goodwill. By opening a competing
business, a seller may recreate other intangible assets
(location, customer list, etc.) that the buying shareholders
assumed would not exist in the marketplace.
3) Valuation of a non-compete agreement
(a) In the following example, assume that a company is sold for
SAR 15 million. The following spreadsheets are contained in the
excel file forwarded to you as “NonCompete.Valuation”.
(b) In the first analysis, the Base Case, the company’s forecast is
set against the transaction value in an IRR calculation of 15
million to determine a cost of capital equal to 19.8%.
(c) In the above example, the practice generated 10 million in 2019
and was projected to grow by 6.0% per year with a 20.0% profit
margin.
(d) The practice was sold for SAR 15 million which results in a
19.8% cost of capital given the forecast and the IRR calculation
(performed through the goal-seek function in excel).
Base Case
2019 2020 2021 2022 2023 2024 Perpetuity
REVENUE 10,000.0 10,600.0 11,236.0 11,910.2 12,624.8 13,382.3 13,783.7
OPERATING INCOME 0.0 2,120.0 2,247.2 2,382.0 2,525.0 2,676.5 2,756.7
TAXES 0.0 0.0 0.0 0.0 0.0 0.0
NET INCOME 2,120.0 2,247.2 2,382.0 2,525.0 2,676.5 2,756.7
PLUS (MINUS):
Dep. & Amort. 106.0 112.4 119.1 126.2 133.8 0.0
Net Working Capital Additions (30.0) (31.8) (33.7) (35.7) (37.9) (20.1)
Capx (53.0) (56.2) (59.6) (63.1) (66.9) 0.0
FREE CASH FLOW 2,143.0 2,271.6 2,407.9 2,552.3 2,705.5 2,736.7
As % of Rev. 20.2% 20.2% 20.2% 20.2% 20.2% 19.9%
PRO-RATA ADJUSTMENT FACTOR 100.0% 100.0% 100.0% 100.0% 100.0% 100.0%
PRO-RATA AFTER-TAX CASH FLOW 2,143.0 2,271.6 2,407.9 2,552.3 2,705.5 2,736.7
Capitalization Rate 16.8%
DISCOUNT RATE 19.8% <---- Transaction IRR (Run Goal Seek Function) Perpetuity Value 16,284.3
Time Remaining in 1st Period 1.0000
Years to Discount 0.5000 1.5000 2.5000 3.5000 4.5000 4.5000
PV FACTOR 0.9136 0.7626 0.6365 0.5313 0.4435 0.4435
PV CASH FLOW 1,957.9 1,732.3 1,532.6 1,356.0 1,199.8 7,221.4
Sum of Interim Period Present Value 7,778.6
Present Value of Terminal Value 7,221.4
Market Value of Invested Capital 15,000.0 <----- Should Agree to Total Consideration (%100 Equity + Assumed Debt + New Debt)
Assumptions
Revenue Growth 6.0% 6.0% 6.0% 6.0% 6.0% 3.0%
EBIT Margin 20.0% 20.0% 20.0% 20.0% 20.0% 20.0%
Tax Rate 0.0% 0.0% 0.0% 0.0% 0.0% 0.0%
Dep & Amort. (% of rev.) 1.0% 1.0% 1.0% 1.0% 1.0% n/a
Net Working Capital (% of rev.) 5.0% 5.0% 5.0% 5.0% 5.0% 5.0%
Capx (% of rev.) 0.5% 0.5% 0.5% 0.5% 0.5% n/a

BV 206: Valuing Small and Medium-Sized Companies Chapter 1 – Introduction to Small and Medium Sized Entities
©2020 The Saudi Authority for Accredited Valuers (TAQEEM) 35
(e) This base case is then compared to three (or more) scenarios
which contain the likelihood of the selling owner competing, and
the damage that would result to the sold company if the seller
did compete.
(f) In Scenario 1, the selling shareholder competes which causes
the subject company to experience zero growth and the profit
margin to drop to 17.5% from 20.0%.
(g) This competition under Scenario 1 causes the value of the
company to drop to SAR 9.84 million, which represents a
damage of SAR 5.16 million. In Scenario 1 the seller competes
and eliminate all growth in the subject company so that revenues
remain at 10 million.
(h) Two more scenarios were analyzed, one which saw revenues
declining by 10.0% to 20.0% per year as a result of the
competition with profit margins dropping to 15.0% (Scenario 2),
and the final analysis in which revenues drop by 25.0% to 30.0%
and profit margins drop to 10.0%. Scenario 2 results in a value
of SAR 4.17 million and Scenario 3 to SAR 2.1 million.
Scenario 1
2019 2020 2021 2022 2023 2024 Perpetuity
REVENUE 10,000.0 10,000.0 10,000.0 10,000.0 10,000.0 10,000.0 10,000.0
OPERATING INCOME 0.0 1,750.0 1,750.0 1,750.0 1,750.0 1,750.0 1,750.0
TAXES 0.0 0.0 0.0 0.0 0.0 0.0
NET INCOME 1,750.0 1,750.0 1,750.0 1,750.0 1,750.0 1,750.0
PLUS (MINUS):
Dep. & Amort. 100.0 100.0 100.0 100.0 100.0 0.0
Net Working Capital Additions 0.0 0.0 0.0 0.0 0.0 0.0
Capx (50.0) (50.0) (50.0) (50.0) (50.0) 0.0
FREE CASH FLOW 1,800.0 1,800.0 1,800.0 1,800.0 1,800.0 1,750.0
As % of Rev. 18.0% 18.0% 18.0% 18.0% 18.0% 17.5%
PRO-RATA ADJUSTMENT FACTOR 100.0% 100.0% 100.0% 100.0% 100.0% 100.0%
PRO-RATA AFTER-TAX CASH FLOW 1,800.0 1,800.0 1,800.0 1,800.0 1,800.0 1,750.0
Capitalization Rate 19.8%
DISCOUNT RATE 19.8% Perpetuity Value 8,835.9
Time Remaining in 1st Period 1.0000
Years to Discount 0.5000 1.5000 2.5000 3.5000 4.5000 4.5000
PV FACTOR 0.9136 0.7626 0.6365 0.5313 0.4435 0.4435
PV CASH FLOW 1,644.5 1,372.6 1,145.7 956.3 798.2 3,918.4
Sum of Interim Period Present Value 5,917.4
Present Value of Terminal Value 3,918.4
Market Value of Invested Capital 9,835.8
Assumptions
Revenue Growth 0.0% 0.0% 0.0% 0.0% 0.0% 0.0%
EBIT Margin 17.5% 17.5% 17.5% 17.5% 17.5% 17.5%
Tax Rate 0.0% 0.0% 0.0% 0.0% 0.0% 0.0%
Dep & Amort. (% of rev.) 1.0% 1.0% 1.0% 1.0% 1.0% n/a
Net Working Capital (% of rev.) 5.0% 5.0% 5.0% 5.0% 5.0% 5.0%
Capx (% of rev.) 0.5% 0.5% 0.5% 0.5% 0.5% n/a

BV 206: Valuing Small and Medium-Sized Companies Chapter 1 – Introduction to Small and Medium Sized Entities
©2020 The Saudi Authority for Accredited Valuers (TAQEEM) 36
Scenario 2
2019 2020 2021 2022 2023 2024 Perpetuity
REVENUE 10,000.0 8,000.0 6,400.0 5,440.0 4,624.0 4,161.6 3,745.4
OPERATING INCOME 0.0 1,200.0 960.0 816.0 693.6 624.2 561.8
TAXES 0.0 0.0 0.0 0.0 0.0 0.0
NET INCOME 1,200.0 960.0 816.0 693.6 624.2 561.8
PLUS (MINUS):
Dep. & Amort. 80.0 64.0 54.4 46.2 41.6 0.0
Net Working Capital Additions 100.0 80.0 48.0 40.8 23.1 20.8
Capx (40.0) (32.0) (27.2) (23.1) (20.8) 0.0
FREE CASH FLOW 1,340.0 1,072.0 891.2 757.5 668.2 582.6
As % of Rev. 16.8% 16.8% 16.4% 16.4% 16.1% 15.6%
PRO-RATA ADJUSTMENT FACTOR 100.0% 100.0% 100.0% 100.0% 100.0% 100.0%
PRO-RATA AFTER-TAX CASH FLOW 1,340.0 1,072.0 891.2 757.5 668.2 582.6
Capitalization Rate 29.8%
DISCOUNT RATE 19.8% Perpetuity Value 1,954.7
Time Remaining in 1st Period 1.0000
Years to Discount 0.5000 1.5000 2.5000 3.5000 4.5000 4.5000
PV FACTOR 0.9136 0.7626 0.6365 0.5313 0.4435 0.4435
PV CASH FLOW 1,224.2 817.5 567.3 402.5 296.3 866.9
Sum of Interim Period Present Value 3,307.8
Present Value of Terminal Value 866.9
Market Value of Invested Capital 4,174.6
Assumptions
Revenue Growth -20.0% -20.0% -15.0% -15.0% -10.0% -10.0%
EBIT Margin 15.0% 15.0% 15.0% 15.0% 15.0% 15.0%
Tax Rate 0.0% 0.0% 0.0% 0.0% 0.0% 0.0%
Dep & Amort. (% of rev.) 1.0% 1.0% 1.0% 1.0% 1.0% n/a
Net Working Capital (% of rev.) 5.0% 5.0% 5.0% 5.0% 5.0% 5.0%
Capx (% of rev.) 0.5% 0.5% 0.5% 0.5% 0.5% n/a
Scenario 3
2019 2020 2021 2022 2023 2024 Perpetuity
REVENUE 10,000.0 7,000.0 4,900.0 3,675.0 2,756.3 2,067.2 1,653.8
OPERATING INCOME 0.0 700.0 490.0 367.5 275.6 206.7 165.4
TAXES 0.0 0.0 0.0 0.0 0.0 0.0
NET INCOME 700.0 490.0 367.5 275.6 206.7 165.4
PLUS (MINUS):
Dep. & Amort. 70.0 49.0 36.8 27.6 20.7 0.0
Net Working Capital Additions 150.0 105.0 61.3 45.9 34.5 20.7
Capx (35.0) (24.5) (18.4) (13.8) (10.3) 0.0
FREE CASH FLOW 885.0 619.5 447.1 335.3 251.5 186.0
As % of Rev. 12.6% 12.6% 12.2% 12.2% 12.2% 11.3%
PRO-RATA ADJUSTMENT FACTOR 100.0% 100.0% 100.0% 100.0% 100.0% 100.0%
PRO-RATA AFTER-TAX CASH FLOW 885.0 619.5 447.1 335.3 251.5 186.0
Capitalization Rate 39.8%
DISCOUNT RATE 19.8% Perpetuity Value 467.4
Time Remaining in 1st Period 1.0000
Years to Discount 0.5000 1.5000 2.5000 3.5000 4.5000 4.5000
PV FACTOR 0.9136 0.7626 0.6365 0.5313 0.4435 0.4435
PV CASH FLOW 808.5 472.4 284.6 178.2 111.5 207.3
Sum of Interim Period Present Value 1,855.3
Present Value of Terminal Value 207.3
Market Value of Invested Capital 2,062.5
Assumptions
Revenue Growth -30.0% -30.0% -25.0% -25.0% -25.0% -20.0%
EBIT Margin 10.0% 10.0% 10.0% 10.0% 10.0% 10.0%
Tax Rate 0.0% 0.0% 0.0% 0.0% 0.0% 0.0%
Dep & Amort. (% of rev.) 1.0% 1.0% 1.0% 1.0% 1.0% n/a
Net Working Capital (% of rev.) 5.0% 5.0% 5.0% 5.0% 5.0% 5.0%
Capx (% of rev.) 0.5% 0.5% 0.5% 0.5% 0.5% n/a
BV 206: Valuing Small and Medium-Sized Companies Chapter 1 – Introduction to Small and Medium Sized Entities
©2020 The Saudi Authority for Accredited Valuers (TAQEEM) 37
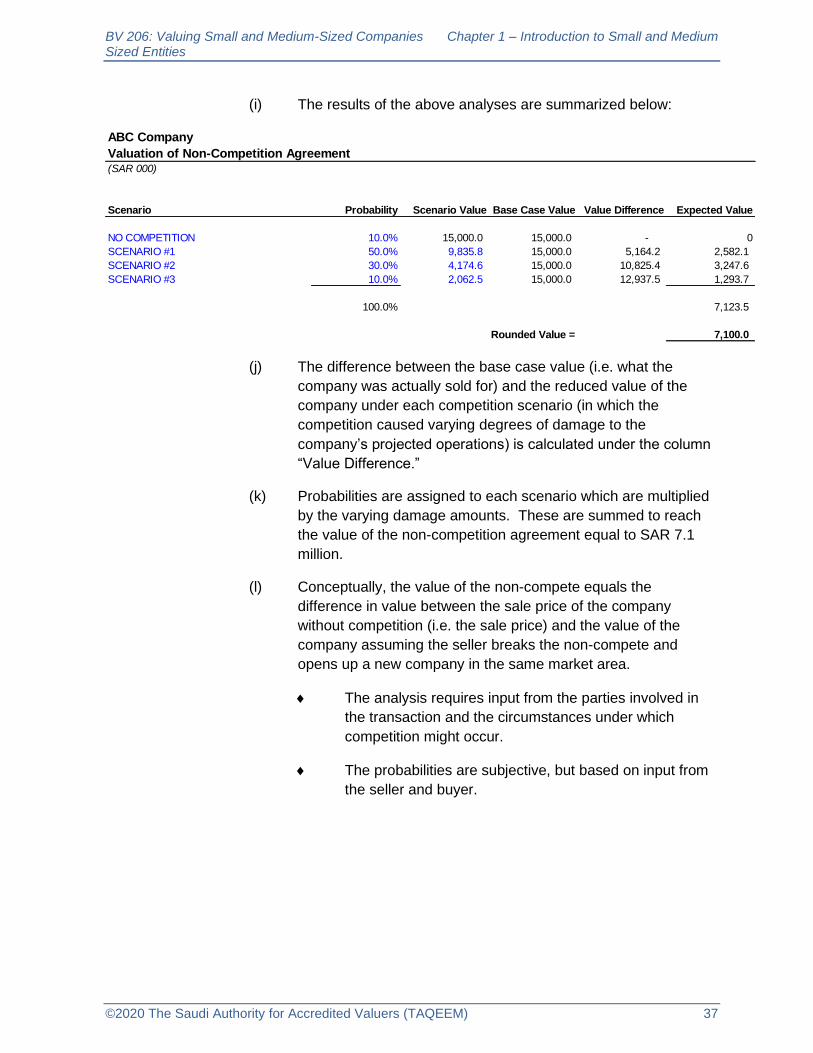
(i) The results of the above analyses are summarized below:
(j) The difference between the base case value (i.e. what the
company was actually sold for) and the reduced value of the
company under each competition scenario (in which the
competition caused varying degrees of damage to the
company’s projected operations) is calculated under the column
“Value Difference.”
(k) Probabilities are assigned to each scenario which are multiplied
by the varying damage amounts. These are summed to reach
the value of the non-competition agreement equal to SAR 7.1
million.
(l) Conceptually, the value of the non-compete equals the
difference in value between the sale price of the company
without competition (i.e. the sale price) and the value of the
company assuming the seller breaks the non-compete and
opens up a new company in the same market area.
The analysis requires input from the parties involved in
the transaction and the circumstances under which
competition might occur.
The probabilities are subjective, but based on input from
the seller and buyer.
ABC Company
Valuation of Non-Competition Agreement(SAR 000)
Scenario Probability Scenario Value Base Case Value Value Difference Expected Value
NO COMPETITION 10.0% 15,000.0 15,000.0 - 0
SCENARIO #1 50.0% 9,835.8 15,000.0 5,164.2 2,582.1
SCENARIO #2 30.0% 4,174.6 15,000.0 10,825.4 3,247.6
SCENARIO #3 10.0% 2,062.5 15,000.0 12,937.5 1,293.7
100.0% 7,123.5
Rounded Value = 7,100.0

BV 206: Valuing Small and Medium-Sized Companies Chapter 1 – Introduction to Small and Medium Sized Entities
©2020 The Saudi Authority for Accredited Valuers (TAQEEM) 38
VI. Appendix A - Chapter Review Questions
1. An artificial intelligence research firm is solely owned and operated by a scientist who
devised the algorithms used in the company’s products. The algorithms are
proprietary and no other employee other than the owner is familiar with them. In
appraising the market value of the firm, the valuer must:
A. Reject the market approach since the company is unique.
B. Separate the firm’s market value from its intrinsic value.
C. Use a high discount rate to account for the science involved.
D. Attribute a higher market salary to the key employees.
2. One drawback of the excess earnings model is:
A. It separates profits into tangible returns and intangible returns.
B. There is little empirical support for the expected return on book value.
C. The model assumes that growth will be uniform in the future.
D. There is no opportunity to make income statement adjustments.
3. A guideline company has a P/E ratio of 8.25x. The company’s long-term growth rate is
3.0%. The Company’s discount rate is:
A. 15.12%
B. 12.12%
C. 9.12%
D. 10.12%
4. The size of the SME market in Saudi Arabia is:
A. Approximately 100,000 companies which contribute SAR 1 trillion to the Saudi
GDP
B. Approximately 3 million companies which contribute SAR 5 trillion to the Saudi
GDP
C. Approximately 5,000 companies which contribute SAR 10 billion to the Saudia
GDP
D. Approximately 950,000 companies which contribute SAR 485 billion to the
Saudi GDP
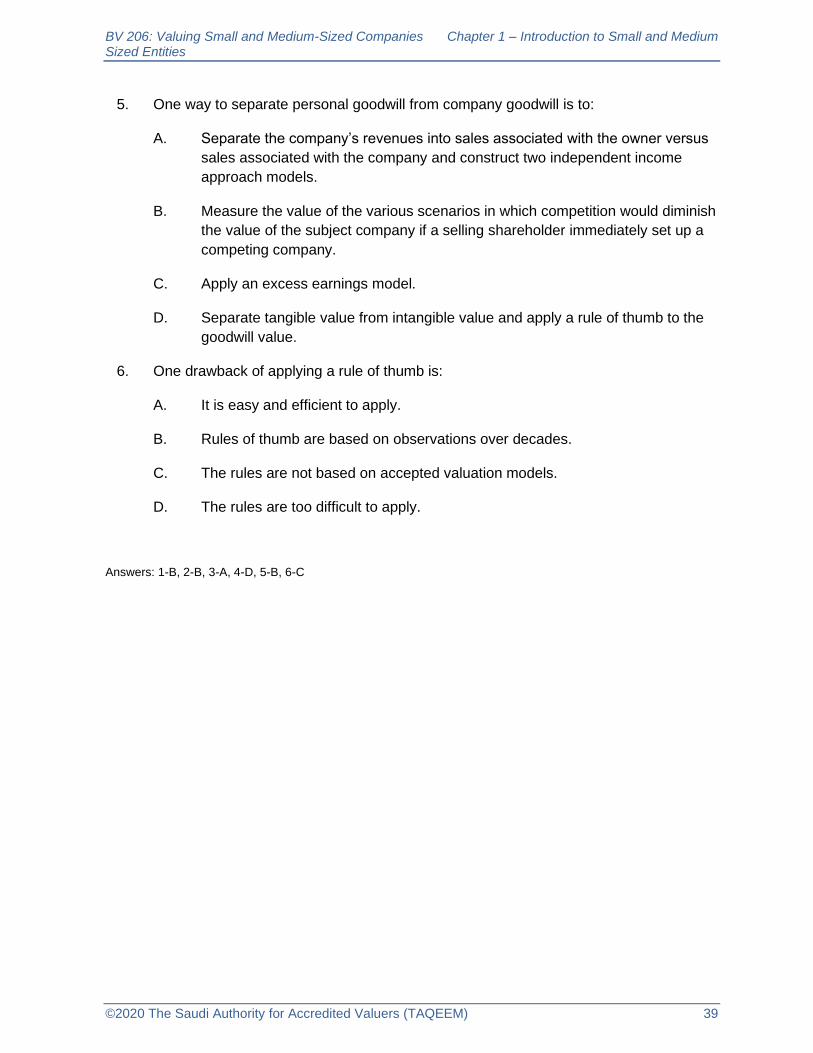
BV 206: Valuing Small and Medium-Sized Companies Chapter 1 – Introduction to Small and Medium Sized Entities
©2020 The Saudi Authority for Accredited Valuers (TAQEEM) 39
5. One way to separate personal goodwill from company goodwill is to:
A. Separate the company’s revenues into sales associated with the owner versus
sales associated with the company and construct two independent income
approach models.
B. Measure the value of the various scenarios in which competition would diminish
the value of the subject company if a selling shareholder immediately set up a
competing company.
C. Apply an excess earnings model.
D. Separate tangible value from intangible value and apply a rule of thumb to the
goodwill value.
6. One drawback of applying a rule of thumb is:
A. It is easy and efficient to apply.
B. Rules of thumb are based on observations over decades.
C. The rules are not based on accepted valuation models.
D. The rules are too difficult to apply.
Answers: 1-B, 2-B, 3-A, 4-D, 5-B, 6-C
BV 206: Valuing Small and Medium-Sized Companies Chapter 2 – Valuing Start-Up Companies
©2020 The Saudi Authority for Accredited Valuers (TAQEEM) 40
Chapter 2. Valuing Start-up Companies
I. Characteristics of Start-up Companies
1. Differences between a start-up company and a small/medium-sized entity (SME)
A. Commercialization
1) In this manual, the term start-up company refers to a company in a pre-
commercial stage.
(a) The start-up has expenses but either does not generate revenue
or does not generate enough revenue to cover the expenses.
Start-ups in the later-stage development may be
generating profits but are not close to actualizing their
potential and require additional funding to reach that
potential.
(b) Start-ups in earlier stages will not survive without external
funding.
2) The term small/medium entity, or SME, refers to a company in a
commercial stage.
(a) The SME generates revenues and profits.
(b) It is able to fund its own operations.
(c) The SME experiences size risk.
3) This chapter covers the characteristics, funding, and valuation of start-
up companies.
B. Financing
1) A start-up company usually obtains financing from one of the following
sources: 1) venture capital firms; 2) private equity; 3) government grants
or loans; or 4) individual investors. The types of investors and the
norms through which they invest vary by country. Start-up investors will
require a very high return on their investment since they bear
extraordinary risk relative to investments in operating entities.
(a) Equity return rates may be at or well above the 25.0% range.

BV 206: Valuing Small and Medium-Sized Companies Chapter 2 – Valuing Start-Up Companies
©2020 The Saudi Authority for Accredited Valuers (TAQEEM) 41
2) An SME usually funds its own operations although it will often require
external financing to fund future growth. External funding will usually
come from a traditional commerical bank loan.
(a) Bank financing rates, as of 2020, generally range in the 3% to
10% range, depending on the borrower’s risk profile.
(b) Debt rates of return are significantly below venture capital rates
of return.
Venture rates are equity rates and apply to pre-
commercial companies.
Debt rates apply to operating, profitable companies and
have priority claims over all equity investors.
2. Stages of start-up company development
A. Categorization of development stages per the American Institute of Certified
Public Accountants (AICPA)
1) Stage 1 – Company exists as more an idea than a functioning company.
Investment comes usually from founders and family members as the
efforts lead to initial product development. On occasion financing may
come from angel investors or a micro-fund in a venture capital (VC) firm.
2) Stage 2 – Company has meaningful expense history as product
development is well underway, though no revenues exist. A second and
possibly third round of financing will occur from angel investors or VC
firms with the outside investors receiving preferred stock (where
relevent) and board seats.
3) Stage 3 - Product development is nearing completion as several
milestones are met, but revenues have not yet materialized. Additional
rounds of financing have occurred with VC firms and possibly strategic
investors.
4) Stage 4 - Company has begun generating revenues, though still
operates at a loss. Mezzanine rounds of financing occur and plans
begin for an initial public offering or a strategic acquisition.
5) Stage 5 - Company has reached profitability and an IPO is planned.
Financing, if necessary, will come in the form of a bridge loan or
common stock. Preferred investors at this stage usually anticipate
converting their shares into common stock.

BV 206: Valuing Small and Medium-Sized Companies Chapter 2 – Valuing Start-Up Companies
©2020 The Saudi Authority for Accredited Valuers (TAQEEM) 42
6) Stage 6 - Company has a history of profitable operations. An exit of the
founding shareholders becomes imminent through either an IPO or a
sale.
B. Abridged version of development stages (will be used in this manual)
1) Seed Stage – Company exists at the concept stage without operations
or with operations just getting organized. Financing provided by
founders and/or family. Usually this stage lasts about 18 months.
2) Early-Stage – Company has a product in testing or in initial production
but not yet generating revenues. Financing provided by founders,
family, angels, or VC micro-funds. This stage lasts usually up to three
years.
3) Expansion- Stage - Commercialization has occurred with revenue
generation but the company may not yet be generating profits.
Financing comes from VC firms. Companies in this stage have usually
been in existence longer than three years.
4) Later-Stage – Commercialization is complete with the company
generating revenue and profits. Plans for an IPO or strategic sale are in
formation. Depending on the type of company and the level of
operations, financing could be in the form of debt, common stock, or VC
funding and preferred stock.
5) The Saudi VC market includes four stages of development:
(a) Pre-seed – equivalent to seed stage above
(b) Seed – equivalent to early-stage above
(c) Series A – equivalent to expansion stage, above
(d) Series B – equivalent to later stage, above
C. Not all start-up companies will fit neatly into this outline or progress through
these each of these stages in the same time frame.
1) Venture capital funds usually have a time limit in the 7-10 year time
frame for each portfolio of investments. Their focus is to invest and
achieve a target return on investment within a defined time period.
II. The Venture Capital Industry
1. VC firms provide financing to companies in the early stages of operation, including pre-
commercial companies. Norms in the VC profession (i.e. required rates of return,
number of firms, etc.) may vary from country to country, but the economics of risk and

BV 206: Valuing Small and Medium-Sized Companies Chapter 2 – Valuing Start-Up Companies
©2020 The Saudi Authority for Accredited Valuers (TAQEEM) 43
return are constant – the greater the risk, the higher the required return. The structure
and terminology that are common to VC firms in established markets are reflected
below.
2. Industry Terminology
A. Several terms are commonly used in the private investment market. It is
important to understand the meaning of each term. An extensive glossary of
industry terms is contained in Appendix C of this chapter.
1) Private equity (PE) – Refers to the investment community outside of
public investment. Any firm which invests in closely-held companies is
in this sector.
(a) Private equity firms are usually firms that purchase 100 percent,
or at least a control position, in mature, operating closely-held
companies.
(b) Private equity firms usually do not acquire, or invest in, early-
stage companies. Their strategy is to acquire an
underperforming commercial company with potential, improve
performance, and put it back on the market.
2) Venture capital – VC firms invest in seed-stage, early-stage or
expansion companies. These start-ups are usually too risky or too small
to attract bank funding or private equity investment.
3) Angel Investors – these are high net worth individuals who are certified
(depending on the country) to assume the risks of various types of
private investment. They may invest through PE firms, VC firms, or as
individuals.
4) Pre-money valuation – A pre-money valuation is the value attributed to a
company by an investor before making an investment in that company.
5) Post-money valuation – A post-money valuation is the value of the
company after the investor has invested money. It equals the pre-
money valuation plus the invested amount.
(a) The terms pre-money and post-money often are confused by
company founders who may not be familiar with industry jargon.
For example:
A venture capital firm proposes to “invest SAR 100 million
at a valuation of SAR 400 million”.
BV 206: Valuing Small and Medium-Sized Companies Chapter 2 – Valuing Start-Up Companies
©2020 The Saudi Authority for Accredited Valuers (TAQEEM) 44
Is the VC firm anticipating a 25% interest (i.e. 100/400)?
Or is the VC firm anticipating a 20% interest (i.e.
100/500)?
The founder needs to ask this question up front and be
sure it is clarified in the Term Sheet (see glossary).
The VC may assume that the 400 million value is post-
money, meaning that he thinks the pre-money value is
300 million and it will be worth 400 million after he makes
the 100 million investment, which would yield him a 25%
interest.
The Founder may think the opposite – that the “valuation”
of 400 million is pre-money and after the VC’s investment
will have a post-money value of 500 million, which would
yield the VC a 20% interest (100/500).
Many negotiations have gone on for weeks with the two
sides assuming completely different values only because
this one term was left unspecified.
6) Cash burn rate – the total amount of money the start-up company is
spending (i.e. leaving the company’s bank account) over a measurable
time period, usually per month. Analysts compare the burn rate to the
remaining cash on hand to measure the time remaining until the next
round of financing will be needed.
3. Structure of VC market
A. There are approximately between 2,000 and 2,500 venture capital firms in the
world, over half of which are located in the United States. Since venture firms
dissolve and are formed each year it is difficult to determine a precise number.
1) VC firms invest money through funds which usually have a lifespan of 7
to 10 years.
2) The countries with the greatest concentration of VC firms are the United
States, China, India, Germany and England.
B. History
1) VC investing began in the 1950s but became a major part of world
finance in the 1990s when it financed the growth of tech companies,
predominantly in the Silicon Valley region of California.
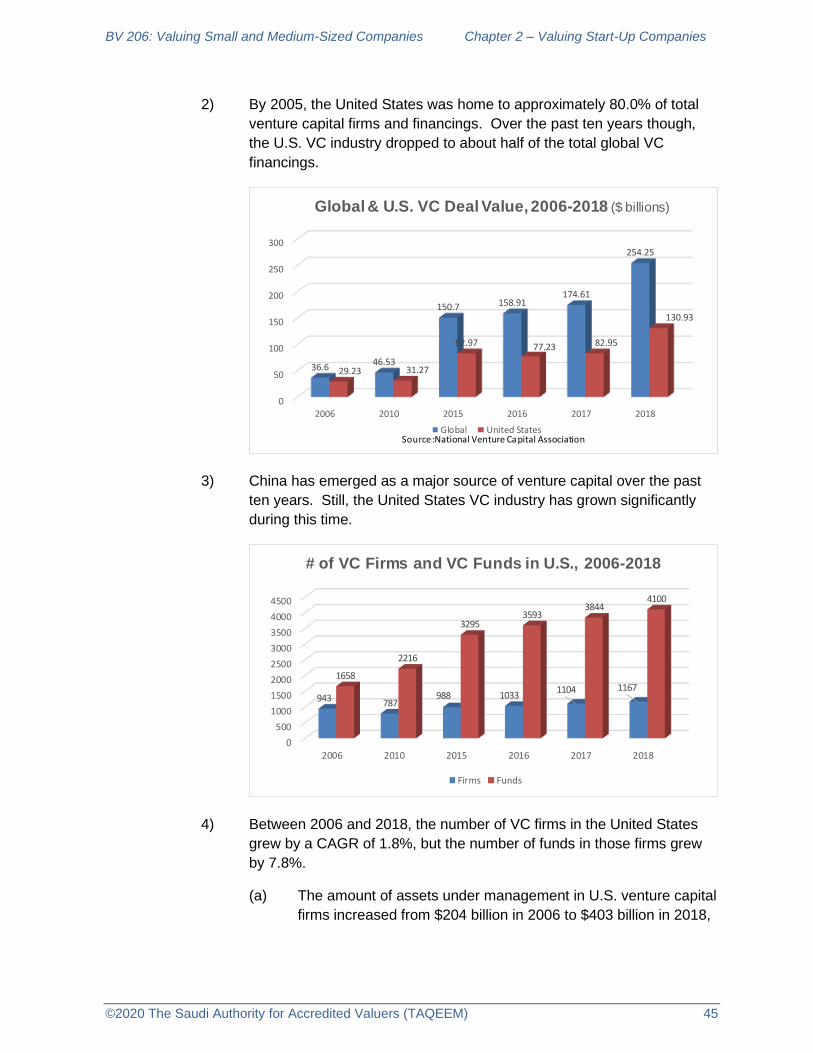
BV 206: Valuing Small and Medium-Sized Companies Chapter 2 – Valuing Start-Up Companies
©2020 The Saudi Authority for Accredited Valuers (TAQEEM) 45
2) By 2005, the United States was home to approximately 80.0% of total
venture capital firms and financings. Over the past ten years though,
the U.S. VC industry dropped to about half of the total global VC
financings.
3) China has emerged as a major source of venture capital over the past
ten years. Still, the United States VC industry has grown significantly
during this time.
4) Between 2006 and 2018, the number of VC firms in the United States
grew by a CAGR of 1.8%, but the number of funds in those firms grew
by 7.8%.
(a) The amount of assets under management in U.S. venture capital
firms increased from $204 billion in 2006 to $403 billion in 2018,
0
50
100
150
200
250
300
2006 2010 2015 2016 2017 2018
36.646.53
150.7 158.91174.61
254.25
29.23 31.27
82.97 77.23 82.95
130.93
Global & U.S. VC Deal Value, 2006-2018 ($ billions)
Global United StatesSource:National Venture Capital Association
0
500
1000
1500
2000
2500
3000
3500
4000
4500
2006 2010 2015 2016 2017 2018
943 787988 1033
1104 11671658
2216
32953593
38444100
# of VC Firms and VC Funds in U.S., 2006-2018
Firms Funds

BV 206: Valuing Small and Medium-Sized Companies Chapter 2 – Valuing Start-Up Companies
©2020 The Saudi Authority for Accredited Valuers (TAQEEM) 46
a CAGR of 5.8%. The median venture firm size was $39 million
in 2018 (with size defined as commitments and net asset value).
(b) The categorization of firms in the U.S. by assets under
management (AUM) was spread fairly evenly by dollar as of
2018, according to the National Venture Capital Association.
.
C. Saudi Venture Capital Industry
1) As of 2020 Q2, there were 63 Saudi, international, and regional firms
operating in KSA:
(a) 51 VC firms
(b) 4 Angel firms
(c) 8 Accelerators
D. Types of VC firms
1) VC Firms will have one or more active funds at any time. Each fund has
a defined amount of capital raised from internal and external investors.
The fund invests the raised capital in a portfolio of early-stage
companies. The funds are usually characterized as one of the following
types:
(a) Micro VCs - Small firm with one general partner who invests his
own and others money in one or two funds capitalized with $15
0
50
100
150
200
250
300
$0-$10 $10-$25 $25-$50 $50-$100 $100-$250 $250-$500 $500-$1 bill $1 bill +
Distribution of U.S. VC Firms by AUM, 2018 (mil)

BV 206: Valuing Small and Medium-Sized Companies Chapter 2 – Valuing Start-Up Companies
©2020 The Saudi Authority for Accredited Valuers (TAQEEM) 47
to $20 million. Investments are made in seed and early-stage
companies.
(b) Seed-stage VCs – Fund size ranges between $20 million and
$150 million. The funds are often the first external money
invested in an early-stage company. In the U.S. these VC firms
only invest in the first Series A preferred round and usually do
not participate in any subsequent financing rounds.
(c) Early-stage VCs – Fund size ranges between $100 million to
$300 million. These VC firms invest in Series A and B preferred
rounds.
(d) Mid-stage VCs – Fund size ranges between $200 million and $1
billion. These funds invest in companies that have established
operations and are entering a growth phase.
(e) Late-stage VCs – Funds invest in successful companies that are
entering a pre-IPO stage. Other investors at this stage might
include private equity firms and hedge funds.
2) A venture capital firm may manage funds in one or more of the above
categories. VC firms may also distinguish themselves in other areas.
(a) By industry such as information technology, life sciences, etc.
(b) By geographical region – most VC firms invest on a local or
regional scale. VC personnel want an in-person relationship with
the managers of their companies, which is facilitated by
proximity.
3) Founders of early-stage companies who seek investment should
research the VC industry and contact only those VC firms that would be
attracted to his/her type of company. An entrepreneur in the seed stage
who seeks financing from a mid-stage VC firm exhibits a lack of
sophistication which may preclude funding from other more appropriate
VC firms.
4. Venture Capital in Saudi Arabia
A. The economics and norms discussed in this manual are based on the more
diverse and developed venture capital industry in western economies. Norms
in other developed economies such as Saudi Arabia differ from the west since
the opportunities for early-stage investment are fewer and the legal structure for
investment differs.

BV 206: Valuing Small and Medium-Sized Companies Chapter 2 – Valuing Start-Up Companies
©2020 The Saudi Authority for Accredited Valuers (TAQEEM) 48
B. Venture capital investment in KSA is overseen by the 2016 Companies Law.
That law allows:
1) The incorporation of holding companies. This allows a corporate
structure that has no operations other than to hold a controlling interest
in another company which may be a venture fund.
2) Single member companies (previously, the smallest LLC had to have at
least two members).
3) Some common characteristics of preferred stock in western countries,
such as drag-along rights and forced transfers may be unenforceable in
KSA under Sharia Law. This has not been extenstively tested in the
KSA courts.
4) The key difference between the venture capital profession in KSA and
the U.S. is the prevalance in the U.S. of the issuance of preferred stock.
In the U.S. there may be a series of rounds of preferred share
issuances, each with varying seniority and rights. In KSA, the norm is
for companies only to have ordinary, or common shares, although
different classes of common stock can have varying rights.
C. KSA does not have as many VC firms as exist in western economies. Funding
for early-stage companies tends to come from the following sources:
1) Government-backed enterprises and government-backed funds:
(a) The Public Investment Fund
(b) TAQNIA
(c) King Abdullah University of Science and Technology Innovation
Fund
(d) Beacon I Venture fund
(e) The Saudi Telecom Company (through STC Ventures)
(f) Saudi Aramco Energy Ventures
2) Family wealth
3) High net worth individuals (i.e. angel investors)
4) Other institutions
D. As of 2020 Q2, there were 63 domestic, international, and regional early-stage
investment firms operating in KSA:
BV 206: Valuing Small and Medium-Sized Companies Chapter 2 – Valuing Start-Up Companies
©2020 The Saudi Authority for Accredited Valuers (TAQEEM) 49
1) 51 VC firms
2) 4 Angel firms
3) 8 Accelerators
E. Financial structure of KSA venture deals
1) The second quarter of 2020 saw 16 VC deals in KSA with an average
deal size of $5.6 million (U.S).
2) Saudi VC firms invested in another 15 global start-ups, for a total 2020
Q2 deals of 31 (16 domestic and 15 international).
(a) This is an increase from a total of 17 deals in 2019 (11 in KSA
start-ups and 6 international)
3) The early-stage investment volume increased in 2020Q2 over 2019Q2
from $15.1 million to $66.9 million.
(a) In addition, Saudi VC firms invested outside of KSA. Global
investment from Saudi VC firms increased from $42.1 million in
2019 Q1 to $64.4 million in 2020 Q2.
4) The Saudi VC market divides investment stages into the following:
(a) Pre-Seed
(b) Seed
(c) Series A
(d) Series B
(e) Of the total amount of Saudi VC funding into Saudi start-ups in
2020 Q2, 64% of funding went to companies in the Pre-seed and
Seed stages of investment.
29% went to Series A stage
7% went to Series B stage
(f) Of the total amount of VC funding from Saudi firms into global
companies outside of KSA, 27% went to Pre-seed and Seed
stage companies, 64% went to Series A stage companies, and
9% went to Series B stage companies.
F. Legal structure of KSA venture funds

BV 206: Valuing Small and Medium-Sized Companies Chapter 2 – Valuing Start-Up Companies
©2020 The Saudi Authority for Accredited Valuers (TAQEEM) 50
1) Venture capital funds are legally structured as either a limited liability
company (LLC), a joint stock company (JSC), or a Capital Market
Authority (CMA) approved investment fund.
(a) LLCs
Shareholders are personally liable for company debts up
to the amount of their interest.
If the number of shareholders exceeds 50 the company
must convert to a JSC.
A Board is not required unless the LLC has more than 20
shareholders.
Cannot issue shares to the public
Preferred shares and pre-emption rights are not allowed
(pre-emption rights are an investor’s ability to buy newly
offered shares before those shares are offered to the
public).
(b) JSCs
Shareholders are personally liable up to the amount of
their interest.
Controlled by a board of directors (3-11 members).
Single shareholder JSC is allowed.
Must have minimum capital of SAR 500,000.
Public can buy shares under CMA rules.
Preferred shares allowed, though few JSCs have them.
Pre-emption rights allowed.
(c) CMA-approved investment fund
An investment fund is defined as a collective investment
scheme which provides investors with the opportunity to
participate collectively in the profits of the scheme. The
fund should be managed by a fund manager who is paid
fees for managing the fund.
2) CMA-approved investment funds can be pubic or private

BV 206: Valuing Small and Medium-Sized Companies Chapter 2 – Valuing Start-Up Companies
©2020 The Saudi Authority for Accredited Valuers (TAQEEM) 51
(a) Public CMA-approved funds
Must have a fund manager who complies with all KSA
rules under Investment Fund Regulations. The manager
must detect risk affecting fund investments.
Must have a Board with at least 3 persons who are
approved by the CMA. The Board must meet at least
twice annually to ensure the fund’s regulatory compliance
and to ensure the fund manager is acting in the
unitholders’ best interests.
Public funds have no pre-emption rights.
Investments are restricted to securities, money markets,
bank deposits, real estate and commodities.
Initial offer period of fund is 45 days maximum, with a
minimum raise of SAR 10 million.
The fund manager must supply annual report.
(b) Private funds
CMA approval is required to establish a private fund.
The fund must have a manager who has the same duties
as discussed above under public funds.
Investors in private funds must be sophisticated investors
or must have the ability to invest SAR 1 million.
Sophisticated investors are defined as:
◼ CMA authorized persons, or
◼ The Saudi government, or
◼ Institutions acting on their own account, or
◼ The Saudi stock exchange, or
◼ Professional investors, or
◼ Clients of an authorized manager.
Private funds do not require a Board of Directors.

BV 206: Valuing Small and Medium-Sized Companies Chapter 2 – Valuing Start-Up Companies
©2020 The Saudi Authority for Accredited Valuers (TAQEEM) 52
Private funds can invest in any asset as long as it is
properly described and meets the fund’s defined
objectives.
There are no pre-emption rights for unitholders.
Annual reports with audited financial statements must be
prepared for unitholders.
3) Government Oversight
(a) Public and Private funds in KSA must have a fund manager who
is authorized by the CMA.
(b) The CMA must approve the offering of fund units in KSA.
(c) Foreign funds that want to offer units in KSA must be made
through a KSA agent authorized by the CMA.
G. Regulations for foreign VC Firms investing in KSA companies
1) A foreign firm must be a Qualified Financial Institution (QFI) approved by
the CMA. A QFI has the following characteristics:
(a) Must be a legal financial institution
(b) Have assets under management of at least SAR 3.75 million
(c) Be incorporated in a jurisdiction that applies regulatory standards
equivalent to CMA standards or at least acceptable to the CMA.
5. How to Attract Venture Capital
A. Contact with the Venture Capital Firm
1) Entrepreneurs approach venture capitalists for funding. Venture capital
firms have specific expectations as to what should be included in the
initial communication. A detailed business plan is neither realistic nor
expected by the VC firm at this point.
2) The entrepreneur should research VC firms and select one that matches
the type of company and the stage of investment.
3) How does the entrepreneur contact a selected VC firm? This is what
the VC expects from a company seeking investment:
(a) Initial contact

BV 206: Valuing Small and Medium-Sized Companies Chapter 2 – Valuing Start-Up Companies
©2020 The Saudi Authority for Accredited Valuers (TAQEEM) 53
An email describing the business. Short, direct, to the
point. Not more than a few sentences.
An executive summary (attached to the email) which
conveys a basic description of the company (presented
on social media such as Google Docs or PowerPoint).
Should be 1-3 pages that addresses the following:
What the product or service does: why is it
needed?
How large is the market for the product?
How many other companies are in the market?
What competitive advantage do you have over the
other companies in the market?
The company’s management team – background
of each key player
How will you access the market?
Current status of the company including general
financial overview, current use of funds, and
future milestones
How much funding is requested? How much
founder cash is invested?
If the company is making a physical product, send
a prototype of that product.
(b) Second contact
If the VC firm is interested in the company, they will
request a more formal presentation, usually in-person.
This presentation should also be well-planned, concise
(~20 slides), and assembled professionally. The VC’s
decision to fund or not fund the company will probably be
based on this presentation.
The presentation should elaborate on the above
points.
Specific funding needed for each milestone
should be presented. A specific amount should
be requested, not a range of investment.
BV 206: Valuing Small and Medium-Sized Companies Chapter 2 – Valuing Start-Up Companies
©2020 The Saudi Authority for Accredited Valuers (TAQEEM) 54
The amount of the founders’ investment will be an
issue. VCs tend not to invest heavily unless the
founder has committed investment as well. VCs
accept a lot of risk, but not all the risk.
The presentation may have to stand on its own
without an in-person contact. It should be created
assuming an in-person appearance may not be
requested and assuming it may be passed around
to personnel within the VC firm.
B. VC firm Response
1) The VC firm may respond to the funding request with a range of
reactions from a definite yes to a definite no.
(a) If the answer is yes, a term sheet will follow which details the
amount of proposed funding and what the VC firm expects in
return in terms of control and economic rights.
(b) A boilerplate term sheet is contained in Appendix D of this
chapter (from the National Association of Venture Capital
(NAVC) -https://nvca.org/model-legal-documents/
III. Alternative Securities for Alternative Risk Profiles
1. When a VC firm calculates the value of an early-stage company, which Basis of Value
under IVS is in play?
A. Market Value is defined as:
“The estimated amount for which an asset or liability should exchange
on the valuation date between a willing buyer and a willing seller in an
arms’ length transaction, after proper marketing and where the parties
had each acted knowledgeably and without compulsion”.
1) Since the VC firm is an identified buyer, the hypothetical concept implied
in Market Value is violated.
2) In the case of many early-stage companies, obtaining funding is an
existential event (meaning that without the funding the company will
close). This violates the concept of “without compulsion”.
B. Equitable Value is defined as:

BV 206: Valuing Small and Medium-Sized Companies Chapter 2 – Valuing Start-Up Companies
©2020 The Saudi Authority for Accredited Valuers (TAQEEM) 55
“The estimated price for the transfer of an asset or liability between
knowledgeable and willing parties that reflects the respective interests of
those parties”.
1) Equitable Value may be the more relevant Basis of Value when
discussing the topic of early-stage company valuation.
(a) The VC firm is an identified buyer.
(b) The amount invested by a VC firm may vary depending on the
needs and position of the VC firm.
The VC may consider the target company to have value
but outside its geographical reach.
The company may not fit well into the risk profile of the
particular fund being managed by the VC.
The company’s industry may be outside the VC’s area of
expertise.
Because of these factors, two VC firms may attach
different values to the same early-stage company since
their respective interests may differ.
C. When valuing an early-stage company in the VC context, the valuer’s focus
should be on those factors that make a given VC firm comfortable with the risk
being accepted.
1) That comfort level is captured not just in the price paid but in all of the
factors of the deal, including:
(a) Control factors – board seats, voting rights, pre-emptive
provisions, drag-along rights, etc.
(b) Economic factors – dividends, participation rights, conversion
rights, anti-dilution rights, etc.
2) The economic value of the deal equals the price paid plus, theoretically,
the present cash value of all of the control and economic rights
conveyed to the VC firm in the deal. This may be exceedingly difficult to
quantify.
2. Depending on the securities laws of a given country investors who accept varying
levels of risk in the same closely-held company may acquire different types of equity or

BV 206: Valuing Small and Medium-Sized Companies Chapter 2 – Valuing Start-Up Companies
©2020 The Saudi Authority for Accredited Valuers (TAQEEM) 56
hybrid securities. This concept was originally discussed in BV 201 with the difference
between rates of return on equity investment and third-party debt investment.
A. Preferred stock – preferred stock was discussed at length in BV 204. It is
common in western economies, including the United States, Canada, Germany
and the UK.
B. The securities laws of KSA allow for varying rights to what is referred to as
ordinary shares, or common stock.
C. Regardless of the country, investors in early-stage companies must receive a
security that provides the rights and returns that adequately compensates them
for the risk they accept.
1) Consider the following example: A start-up was capitalized with SAR
500,000 from its founding partners one year ago; the original 500,000
has been spent. The company is at least 3 to 5 years away from
generating revenues and is seeking SAR 2,000,000 in venture capital.
Should a VC require an 80.0% ownership (2,000,000 divided by
2,500,000)?
(a) The answer depends on the success to date of the company in
achieving its goal, the market the company is targeting, and the
ability of the management to get there. The VC will seek the
following if a deal is pursued:
A priority claim on any future profits until its original
capital (SAR 2,000,000) is returned to the VC;
An additional claim on profits either through annual
dividends or participation with common shareholders to
reward the VC for illiquidity and for risk.
Control or input into how the company pursues its
milestones.
VC investors must still provide incentives to the
founders/existing management to make sure they
are motivated to achieve company milestones.
3. Rights required by early-stage Investors (these rights were covered in BV 204 and are
also defined in the Glossary contained in Appendix C of this chapter.)
A. Economic Rights
1) Liquidition preference
BV 206: Valuing Small and Medium-Sized Companies Chapter 2 – Valuing Start-Up Companies
©2020 The Saudi Authority for Accredited Valuers (TAQEEM) 57
2) Dividends
3) Redemption rights
4) Conversion rights
5) Participation rights
6) Anti-dilution rights
7) Registration rights
B. Control Rights
1) Board positions
2) Voting rights
3) Veto rights
4) Drag-along rights
5) First-refusal rights
6) Information rights
4. Imprecision in Market Pricing
A. The Dow Jones Internet Stock Composite index performance for the five
quarters between January, 2000 and March, 2001 is shown below. The index
was comprised of publicly-traded “dot.com” companies that were, at that time, a
new industry. Many of these companies had not reached commercial
operations, yet many had market capitalizations – in the public stock market -
that ran into the billions of dollars.

BV 206: Valuing Small and Medium-Sized Companies Chapter 2 – Valuing Start-Up Companies
©2020 The Saudi Authority for Accredited Valuers (TAQEEM) 58
1) Internet stocks, as a group, dropped by 82.0% in the five quarters
between January, 2000 and March, 2001. This precipitated a recession
in the United States.
2) The internet came into prominence during the late 1990s as a new
technology with multiple opportunities for commercialization.
Thousands of potential applications appeared on the market as new
companies looked for investment.
(a) Many of these start-ups went public at high capitalizations even
though they were in a pre-commercial stage.
(b) Most of the companies failed during the 2000 – 2001 recession.
(c) If the stock market is efficient, how could so many companies be
valued so highly and end up in bankruptcy so quickly?
3) The answer lies not so much in what a buyer invested in, but how the
buyer invested (or should have invested).
4) Consider a scenario in which a buyer invested a fund of $100,000 -
apportioned as $10,000 in each of the following ten companies in the
late 1990s:
(a) 1) Pets.com; 2) Netscape; 3) Nortel Networks; 4) The Globe; 5)
CDNow; 6) Microsoft; 7) Napster; 8) Infospace; 9) Microstrategy;
10) Value America
(b) The fund would be positive today, as per the following
approximate values:
0
50
100
150
200
250
300
350
400
450
500
DJ Internet Composite Stock Index, 2000-
2001

BV 206: Valuing Small and Medium-Sized Companies Chapter 2 – Valuing Start-Up Companies
©2020 The Saudi Authority for Accredited Valuers (TAQEEM) 59
(c) Nine of the ten tech companies in this fund, some of which were
household names in 1999 with market capitalizations in the
billions have since failed; most failed by the end of 2002. Only
Microsoft survived. However, the value of that single stock paid
for all the others in the fund (although, admittedly, the fund would
have an unimpressive 1.5% annual return).
B. In an early pre-commercial stage, companies have few of the historical
operating metrics that make traditional valuation models possible. Therefore,
valuation becomes even more of a subjective undertaking.
1) During the dot.com boom, the market turned to price/revenue multiples
to value companies that were generating sales (but no profits) and to
other more obscure metrics, such as price/clicks, price/subscribers, etc.
(a) To apply a price/revenue multiple there should be some
correlation between the guideline company’s profitability and the
subject’s profitability. This, obviously, was impossible to do.
5. VC firms often do not engage in a formal valuation process as was outlined in courses
BV 201 through 204. There are several reasons why a formal valuation would be
impractical:
A. There is no historical data to extrapolate.
B. Forecasted operations would be too speculative to be reliable.
C. Start-ups cannot be compared to guideline public companies.
D. The valuation analysis is an ongoing process that may occur over several years
and several rounds of investment.
CURRENT
INVESTMENT VALUE
Pets.com 0
Netscape 0
Nortel Networks 0
The Globe 0
CDNow 0
Microsoft 134,000$
Napster 0
Infospace 0
Microstrategy 0
Value America 0
Fund Value = 134,000$
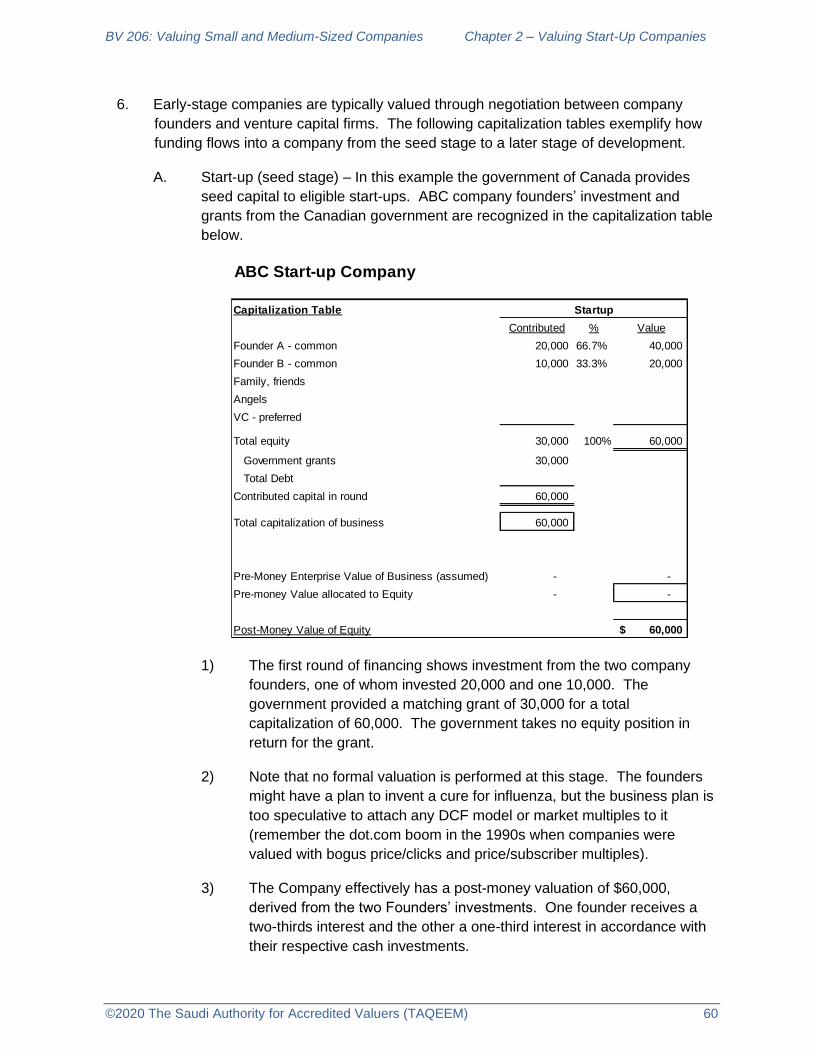
BV 206: Valuing Small and Medium-Sized Companies Chapter 2 – Valuing Start-Up Companies
©2020 The Saudi Authority for Accredited Valuers (TAQEEM) 60
6. Early-stage companies are typically valued through negotiation between company
founders and venture capital firms. The following capitalization tables exemplify how
funding flows into a company from the seed stage to a later stage of development.
A. Start-up (seed stage) – In this example the government of Canada provides
seed capital to eligible start-ups. ABC company founders’ investment and
grants from the Canadian government are recognized in the capitalization table
below.
1) The first round of financing shows investment from the two company
founders, one of whom invested 20,000 and one 10,000. The
government provided a matching grant of 30,000 for a total
capitalization of 60,000. The government takes no equity position in
return for the grant.
2) Note that no formal valuation is performed at this stage. The founders
might have a plan to invent a cure for influenza, but the business plan is
too speculative to attach any DCF model or market multiples to it
(remember the dot.com boom in the 1990s when companies were
valued with bogus price/clicks and price/subscriber multiples).
3) The Company effectively has a post-money valuation of $60,000,
derived from the two Founders’ investments. One founder receives a
two-thirds interest and the other a one-third interest in accordance with
their respective cash investments.
ABC Start-up Company
Capitalization Table
Contributed % Value
Founder A - common 20,000 66.7% 40,000
Founder B - common 10,000 33.3% 20,000
Family, friends
Angels
VC - preferred
Total equity 30,000 100% 60,000
Government grants 30,000
Total Debt
Contributed capital in round 60,000
Total capitalization of business 60,000
Pre-Money Enterprise Value of Business (assumed) - -
Pre-money Value allocated to Equity - -
Post-Money Value of Equity 60,000$
Startup

BV 206: Valuing Small and Medium-Sized Companies Chapter 2 – Valuing Start-Up Companies
©2020 The Saudi Authority for Accredited Valuers (TAQEEM) 61
4) The Founders also created a business plan before opening the
company and applying for a grant from Canada’s Industry Research
Assistance Program (IRAP). This plan details the milestone objectives
in the company’s development and the financing needed to reach each
milestone.
B. Milestone 1 (Seed Stage)
1) The company has met its first round of objectives and is seeking another
round of investment. The founders decided not to invest their own
money but rather have applied for a second round of grants from IRAP
and have appealed to family members and friends for investment. They
succeed in obtaining $100,000 from family members. Also, the
Canadian government, through IRAP, invested another $50,000. The
total investment in Milestone 1 is $150,000. The capitalization table is
recalculated as:
2) The shaded cell reflects a pre-money valuation of $500,000. How was
the $500,000 determined?
(a) At this stage it is unlikely that a formal valuation was completed.
Given the success of the company to date in meeting its
milestones and the perceived integrity of the business plan going
forward, the founders approached family members and IRAP
with a pre-money estimate of value at $500,000.
Investors often use a calibration method to estimate
value in subsequent rounds. Under this method the
investors adjust the value from the previous financing
round based on the company’s subsequent achievement.
ABC Start-up Company
Capitalization Table
Contributed % Value Contributed % Value
Founder A - common 20,000 66.7% 40,000 56.4% 366,667
Founder B - common 10,000 33.3% 20,000 28.2% 183,333
Family, friends 100,000 15.4% 100,000
Angels -
VC - preferred -
Total equity 30,000 100% 60,000 100,000 100% 650,000
Government grants 30,000 50,000
Total Debt -
Contributed capital in round 60,000 150,000
Total capitalization of business 60,000 210,000
Pre-Money Enterprise Value of Business (assumed) - - 500,000$
Pre-money Value allocated to Equity - - 550,000
Post-Money Value of Equity 60,000$ 650,000$
Startup (seed stage) Milestone 1 (seed stage)

BV 206: Valuing Small and Medium-Sized Companies Chapter 2 – Valuing Start-Up Companies
©2020 The Saudi Authority for Accredited Valuers (TAQEEM) 62
(b) With a pre-money subjective valuation of $500,000 accepted by
family and friend investors, a post-money valuation of $650,000
is calculated, given the additional cash investments of $150,000
($100,000 from family and $50,000 from IRAP).
Note that the pre-money allocated to equity is $550,000
due to the government grant which effectively goes
directly to equity from the perspective of the
shareholders.
(c) The new investors therefore receive a diluted interest of 15.4%
($100,000/$650,000). The Founders’ interests are calculated as
their original percentage interest multiplied by the remaining
interest after the new investors % is deducted (i.e. 100% - 15.4%
= 84.6%).
Founder A = (66.67% x 84.6% = 56.4%); and
Founder B = (33.3% x 84.6% = 28.2%)
(d) Note that despite the higher value of the Founders’ interest, both
have experienced dilution in ownership.
C. Milestone 2 (Early Stage)
1) The company has established a record of success in reaching its first
and second set of milestones. A third round of investment is needed to
pursue the next milestones. Again, the pre-money shaded cell of
$2,000,000 does not reflect a formal valuation analysis. It’s likely that
ABC Start-up Company
Capitalization Table
Contributed % Value Contributed % Value Contributed % Value
Founder A - common 20,000 66.7% 40,000 56.4% 366,667 44.9% 1,100,000
Founder B - common 10,000 33.3% 20,000 28.2% 183,333 22.4% 550,000
Family, friends 100,000 15.4% 100,000 12.2% 300,000
Angels - 500,000 20.4% 500,000
VC - preferred -
Total equity 30,000 100% 60,000 100,000 100% 650,000 500,000 100% 2,450,000
Government grants 30,000 50,000
Total Debt - 50,000
Contributed capital in round 60,000 150,000 550,000
Total capitalization of business 60,000 210,000 760,000
Pre-Money Enterprise Value of Business (assumed) - - 500,000$ 2,000,000$
Pre-money Value allocated to Equity - - 550,000 1,950,000
Post-Money Value of Equity 60,000$ 650,000$ 2,450,000$
Startup (seed stage) Milestone 1 (seed stage) Milestone 2 (early-stage)

BV 206: Valuing Small and Medium-Sized Companies Chapter 2 – Valuing Start-Up Companies
©2020 The Saudi Authority for Accredited Valuers (TAQEEM) 63
this company is in the pre-commercial phase, with no revenues or
profits. Investors at this stage are taking educated guesses at value
given their appetite for risk, other investments in the VC portfolio, and
the following factors:
(a) The main points in the value negotiation from the investor’s
perspective are:
the company’s success to date;
the amount the company needs to reach the next
milestone;
How much financing it will need in future rounds to reach
commercialization.
Their ultimate concern is retrieving their initial investment,
plus a required return on that investment and what effect
future dilution of their interest will have on their return.
(b) The main points to the founders are:
how much more money they’ll need to reach their next
milestones;
the percentage ownership they need to sacrifice, and;
the cash burn during the intervening time period.
(c) In this stage, angel investors invested $500,000 at a negotiated
pre-money value of $2,000,000. Since a bridge loan was also
taken out by the company in the amount of $50,000, the post-
money value of equity is $2,450,000 (i.e. $2,000,000 + $500,000
- $50,000).
Hence, the percentage interest to the angel investors is
20.4% ($500,000/ $2,450,000)
(d) Note again that existing investors see an increase in the value of
their interests but a decrease in the percentage ownership.
D. Milestone 3 (Expansion Stage)
1) The company has met its third set of milestones on the promised
timeline. At this point it is becoming clear that the company will reach
commercialization and is worthy of a material investment at a material
value.

BV 206: Valuing Small and Medium-Sized Companies Chapter 2 – Valuing Start-Up Companies
©2020 The Saudi Authority for Accredited Valuers (TAQEEM) 64
2) A venture capital firm has invested $2.5 million at a pre-money value of
$10 million in return for a 20.6 percentage ownership.
(a) In most settings the venture interest would be in preferred stock
which would have economic and control rights above the 20.6
percentage that would yield a higher value, but that is ignored for
the purposed of simplicity here.
3) Note that the company has also secured an additional grant of $150,000
from IRAP and additional debt funding of $500,000, indicating that it is
likely at or near commercial operations. So total post-money equity
value is calculated thus: $10,000,000 + $150,000 + $2,500,000 -
$500,000 = $12,150,000.
4) Existing shareholders at the time of the new investment (Founders,
family, and the angel investors) have all seen an increase in value
accompanied by dilution.
5) The total capitalization at this point is $3,910,000 (all the $ invested to
date as equity and debt).
(a) The company has a value of $12,150,000, indicating goodwill as
a result of reaching its milestones and the promise of continued
growth.
7. How are the valuations reached at each stage?
A. As stated, the negotiated values at the seed and early-stages of development
are not determined by hiring valuation firms which conduct traditional analyses.
The Founders, the Angels, and the VC firms have unique perspectives which
will evolve as the company succeeds (or fails), as their own financial condition
ABC Start-up Company
Capitalization Table
Contributed % Value Contributed % Value Contributed % Value Contributed % Value
Founder A - common 20,000 66.7% 40,000 56.4% 366,667 44.9% 1,100,000 35.7% 4,332,653
Founder B - common 10,000 33.3% 20,000 28.2% 183,333 22.4% 550,000 17.8% 2,166,327
Family, friends 100,000 15.4% 100,000 12.2% 300,000 9.7% 1,181,633
Angels - 500,000 20.4% 500,000 16.2% 1,969,388
VC - preferred - 2,500,000 20.6% 2,500,000
Total equity 30,000 100% 60,000 100,000 100% 650,000 500,000 100% 2,450,000 2,500,000 100% 12,150,000
Government grants 30,000 50,000 150,000
Total Debt - 50,000 500,000
Contributed capital in round 60,000 150,000 550,000 3,150,000
Total capitalization of business 60,000 210,000 760,000 3,910,000
Pre-Money Enterprise Value of Business (assumed) - - 500,000$ 2,000,000$ 10,000,000$
Pre-money Value allocated to Equity - - 550,000 1,950,000 9,650,000
Post-Money Value of Equity 60,000$ 650,000$ 2,450,000$ 12,150,000$
Startup (seed stage) Milestone 1 (seed stage) Milestone 2 (early-stage) Milestone 3 (expansion-stage)

BV 206: Valuing Small and Medium-Sized Companies Chapter 2 – Valuing Start-Up Companies
©2020 The Saudi Authority for Accredited Valuers (TAQEEM) 65
changes, and as opportunities elsewhere in the market become available (or
disappear).
1) A Venture Fund manager revealed the following regarding rules of
thumb in relation to his and his investors expectations:
(a) Success to an angel investor typically means the following:
A return of the original capital in 18 months
A 4x to 5x multiple on their original investment in 2-3
years
A 10x multiple on their original investment in 5 years
A home-run investment (i.e. best-case investment
scenario) is an investment that yields a 40.0x multiple.
(b) Both the angel investors and the VC funds (which consist of
internal and external investments) are seeking a return on
investment which justifies the risk accepted.
The required return is analyzed by these investors in a
portfolio context. That is, they don’t look at a single
company and base their investment on a valuation of the
single company. True, an estimate of each company is
made (the pre-money valuation), but many of these
calculations are educated bets made on a company that
has demonstrated some level of success, be it a proven
management team, a product idea that has demonstrated
demand factors, milestones that have been reached, etc.
2) The pre-money estimate of value is therefore more a function of the VC
investor’s observation that the company is a good candidate for
success, his required return rate needed for his fund, his timeline, and
his ability to convince the founder that his needs and the founder’s
needs are in alignment.
(a) It is important to recognize that the above value estimate
assumes the VC’s portfolio context. This means that the
perceived risk may be lessened by the fact that the risk of the
subject company is lessened in that it is diversified somewhat by
its combination with other companies in the portfolio.

BV 206: Valuing Small and Medium-Sized Companies Chapter 2 – Valuing Start-Up Companies
©2020 The Saudi Authority for Accredited Valuers (TAQEEM) 66
IV. Valuation Models for Early-Stage Companies
1. Investors in early stage companies are less concerned with using a valuation model to
determine enterprise value than they are with obtaining a rate of return on their
investment. Toward that end, they evaluate the company’s business plan, its product,
and its management team in light of whether it will provide the desired return on their
investment. The following models are not always used by VC and angel investors.
However, they may provide some parameter values which guide the investment
decision.
2. Venture Capital Estimates
A. A series of rules of thumb can be used to estimate value.
1) As of 2018, the average seed-stage investment in the U.S. was $2
million. Most seed-stage VC firms are looking to invest an amount in
this range. The question is whether the target firm warrants the
investment.
2) The VC also knows that the average “give-up” (i.e. percentage
purchased) at this stage is 27.0%.
(a) So the average value is $7.4 million ($2 million/27%).
This is a central tendency rule of thumb.
(b) The rule of thumb does not consider any of the factors specific to
the seed-stage company.
(c) It does though suggest that VCs look for seed-stage investments
in the $5 to $10 million range.
(d) This does not mean that all seed-stage companies are valued in
this range, nor does it mean that companies maintain a value in
this range for an extended period of time.
3) The following table breaks down investment by stage over the four
stages of development.
Early Stage Later Stage
Angel/Seed Venture Venture
Amount Invested 7,500,000,000$ 41,000,000,000$ 82,400,000,000$
# Deals 3,760 3,156 2,032
Average Invested 2,000,000$ 13,000,000$ 40,600,000$
U.S. Venture Capital - Amount Invested by Stage, 2018
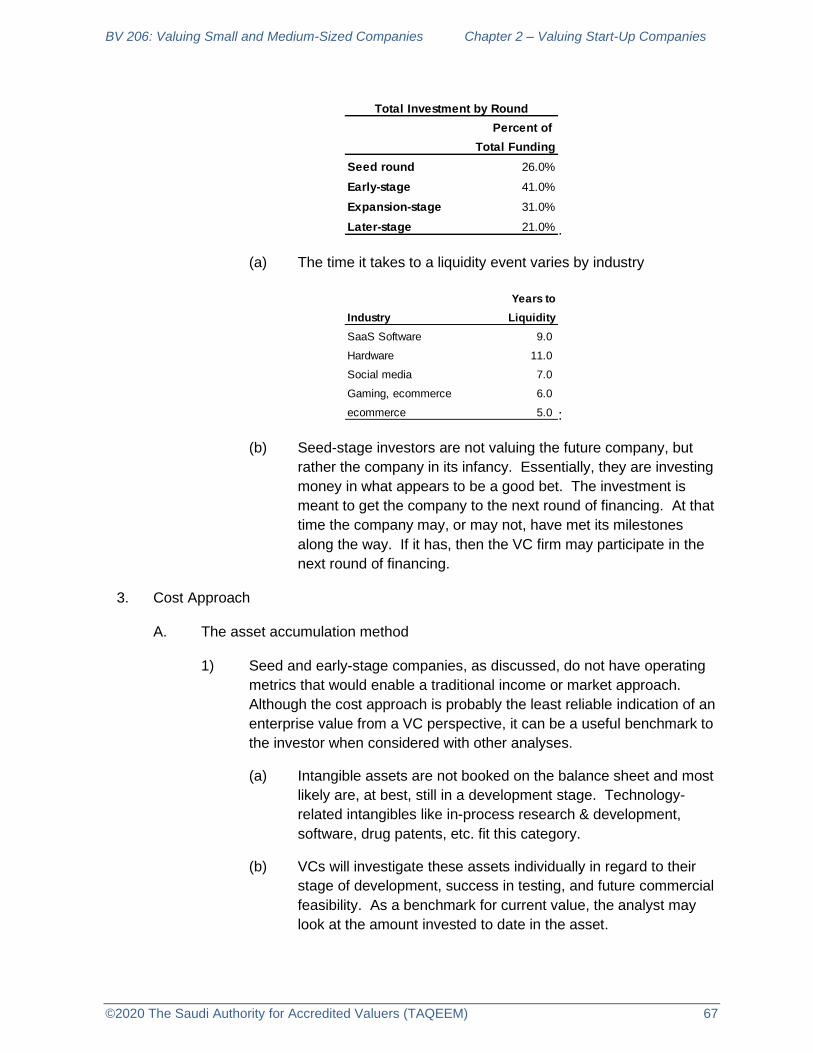
BV 206: Valuing Small and Medium-Sized Companies Chapter 2 – Valuing Start-Up Companies
©2020 The Saudi Authority for Accredited Valuers (TAQEEM) 67
.
(a) The time it takes to a liquidity event varies by industry
:
(b) Seed-stage investors are not valuing the future company, but
rather the company in its infancy. Essentially, they are investing
money in what appears to be a good bet. The investment is
meant to get the company to the next round of financing. At that
time the company may, or may not, have met its milestones
along the way. If it has, then the VC firm may participate in the
next round of financing.
3. Cost Approach
A. The asset accumulation method
1) Seed and early-stage companies, as discussed, do not have operating
metrics that would enable a traditional income or market approach.
Although the cost approach is probably the least reliable indication of an
enterprise value from a VC perspective, it can be a useful benchmark to
the investor when considered with other analyses.
(a) Intangible assets are not booked on the balance sheet and most
likely are, at best, still in a development stage. Technology-
related intangibles like in-process research & development,
software, drug patents, etc. fit this category.
(b) VCs will investigate these assets individually in regard to their
stage of development, success in testing, and future commercial
feasibility. As a benchmark for current value, the analyst may
look at the amount invested to date in the asset.
Percent of
Total Funding
Seed round 26.0%
Early-stage 41.0%
Expansion-stage 31.0%
Later-stage 21.0%
Total Investment by Round
Years to
Industry Liquidity
SaaS Software 9.0
Hardware 11.0
Social media 7.0
Gaming, ecommerce 6.0
ecommerce 5.0

BV 206: Valuing Small and Medium-Sized Companies Chapter 2 – Valuing Start-Up Companies
©2020 The Saudi Authority for Accredited Valuers (TAQEEM) 68
If the intangibles can be valued independently, then they
should be posted separately to the balance sheet.
If not, then the analyst may consider the amount of
retained earnings (most likely, losses to date, or amount
spent to date in the absence of revenues) as a cost
method for assessing intangible value.
In the above example, the assumption is that the
4,967,500 spent through 12/31/19 has gone toward the
development of intangible value.
The intangibles could be worth considerably more
(even as of 12/31/19) if the technology being
developed is commercially viable.
The assets could be worth nothing if the
technology is not viable.
(c) A VC might consider the SAR 9.5 million value as another data
point in their investment decision.
Cost Approach Example
Adjusted Balance Sheet
SAR (000) Adjusted
12/31/19 Adjustments 12/31/19
ASSETS
Cash 3,750,000 3,750,000
Prepaid assets 22,500 22,500
Total current assets 3,772,500 - 3,772,500
Net property, plant & equipment 1,685,000 - 1,685,000
Intangible Assets - 4,967,500 4,967,500
Total Assets 5,457,500 4,967,500 10,425,000
Current liabilities
Accounts payable 750,000
Prepaid rent liabilities 175,000
Total current liabilities 925,000 - 925,000
Total liabilities 925,000 - 925,000
Shareholders' Equity
Preferred stock 9,000,000
Common stock 500,000
Retained earnings (4,967,500)
Total Equity 4,532,500 4,967,500 9,500,000
Total liabilities and capital 5,457,500 10,425,000

BV 206: Valuing Small and Medium-Sized Companies Chapter 2 – Valuing Start-Up Companies
©2020 The Saudi Authority for Accredited Valuers (TAQEEM) 69
4. Income Approach
A. An early-stage or expansion-stage company may be generating, or be close to
generating, revenues. In these cases, analysts may draft cash flow forecasts
which estimate the growth rate of sales, cash burn rates (expenses), and apply
a discount rate commensurate with the speculative nature of the forecast.
There are several difficulties with such forecasts:
1) The timing of sales growth is difficult to predict.
2) Although cash burn may, at this point, have a history on which forecasts
can be made, unforseen costs or new expansion costs could undermine
the integrity of the projections.
3) The amount and timing of future financing needs is difficult to predict.
4) The discount rate used is speculative.
B. Revenue forecast
1) Similar to any sales growth analysis, this is a function of the product, the
market size for the product, the product’s competitive advantage in the
market, and the management and sales team that will bring the product
to market.
(a) Are raw materials needed and if so, is a supply chain in place?
(b) Does the company have a manufacturing system in place?
(c) Does the company have a distribution system in place?
(d) Does the company have customer relationships in place?
(e) If not, what is the timing for these systems to be up and running?
2) Management (depending on the quality of the team) is best suited to put
these forecasts together but the forecast should be critiqued and
questioned.
C. Expense forecast
1) If the company is in the early-stage or expansion-stage it has an
expense history. It also has successfully reached milestone(s) which
means that the original projections of sales and expenses were at least
somewhat accuate.

BV 206: Valuing Small and Medium-Sized Companies Chapter 2 – Valuing Start-Up Companies
©2020 The Saudi Authority for Accredited Valuers (TAQEEM) 70
2) The investor needs to scrutinize the expense forecast, focusing on
expense categories that were not necessary at the seed-stage but will
appear in the expansion period.
D. Cost of equity
1) Venture capital rates of return can range from 20% to 80%, a very big
range:
2) Factors to remember when determing rates:
(a) These rates apply to portfolios of early-stage investments. The
VC looks for a total return of, say, 70%, on a seed-stage portfolio
with the expectation that one-third of the companies will fail
completely, one-third will only return the original investment, and
one-third will reach a commercial stage. Of that group, the last
third will return far in excess of 70% on the original investment to
make up for the investments that failed.
These rates do not apply to a single DCF model of an
isolated company any more than the original CAPM
applies to a single company.
(b) Projected losses should not be discounted at these high rates of
return. Losses, especially in the first years of a forecast, do not
carry the same risk factor that projected positive cash flow
carries in the later years. Losses should be discounted at the
risk-free rate of return since they are less speculative.
E. If the company has reached enough of an operating stage to make a forecast
possible, the analyst may use a form of the probability weighted expected
return method (PWERM) and conduct several projections and weight them
according to their probability of occurrence.
Scherlis &
Stage of Development Plummer Sahlman Bygrave
Seed-stage 50% - 70% 50% - 70% 60% - 80%
Early-stage 40% - 60% 40% - 60% 40%
Expansion-stage 35% - 50% 30% - 50% 30%
Later-stage 25% - 35% 20% - 30% 25%
From:
Plummer, James L., QED Report on Venture Capital Financial Analysis, Palo Alto: QED
Research, Inc. 1987
Scherlis, Daniel L. and William A. Sahlman, "A Method for Valuing High Risk, Long-term
Investments: The Venture Capital Method, Harvard Business School Teaching Note, 1989
Bygrave, William D., "Classic Venture Capital in the Next Millenium", Babson College, June 1997
Venture Capital Rates of Return
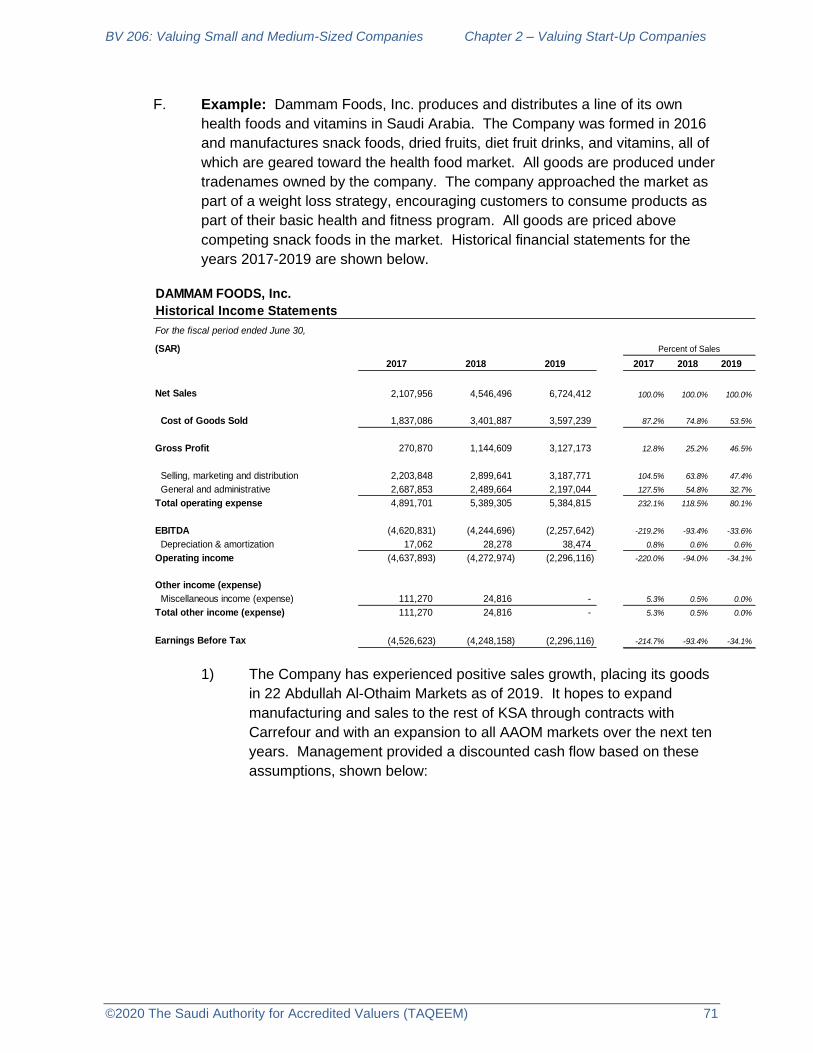
BV 206: Valuing Small and Medium-Sized Companies Chapter 2 – Valuing Start-Up Companies
©2020 The Saudi Authority for Accredited Valuers (TAQEEM) 71
F. Example: Dammam Foods, Inc. produces and distributes a line of its own
health foods and vitamins in Saudi Arabia. The Company was formed in 2016
and manufactures snack foods, dried fruits, diet fruit drinks, and vitamins, all of
which are geared toward the health food market. All goods are produced under
tradenames owned by the company. The company approached the market as
part of a weight loss strategy, encouraging customers to consume products as
part of their basic health and fitness program. All goods are priced above
competing snack foods in the market. Historical financial statements for the
years 2017-2019 are shown below.
1) The Company has experienced positive sales growth, placing its goods
in 22 Abdullah Al-Othaim Markets as of 2019. It hopes to expand
manufacturing and sales to the rest of KSA through contracts with
Carrefour and with an expansion to all AAOM markets over the next ten
years. Management provided a discounted cash flow based on these
assumptions, shown below:
DAMMAM FOODS, Inc.
Historical Income Statements
For the fiscal period ended June 30,
(SAR)
2017 2018 2019 2017 2018 2019
Net Sales 2,107,956 4,546,496 6,724,412 100.0% 100.0% 100.0%
Cost of Goods Sold 1,837,086 3,401,887 3,597,239 87.2% 74.8% 53.5%
Gross Profit 270,870 1,144,609 3,127,173 12.8% 25.2% 46.5%
Selling, marketing and distribution 2,203,848 2,899,641 3,187,771 104.5% 63.8% 47.4%
General and administrative 2,687,853 2,489,664 2,197,044 127.5% 54.8% 32.7%
Total operating expense 4,891,701 5,389,305 5,384,815 232.1% 118.5% 80.1%
EBITDA (4,620,831) (4,244,696) (2,257,642) -219.2% -93.4% -33.6%
Depreciation & amortization 17,062 28,278 38,474 0.8% 0.6% 0.6%
Operating income (4,637,893) (4,272,974) (2,296,116) -220.0% -94.0% -34.1%
Other income (expense)
Miscellaneous income (expense) 111,270 24,816 - 5.3% 0.5% 0.0%
Total other income (expense) 111,270 24,816 - 5.3% 0.5% 0.0%
Earnings Before Tax (4,526,623) (4,248,158) (2,296,116) -214.7% -93.4% -34.1%
Percent of Sales

BV 206: Valuing Small and Medium-Sized Companies Chapter 2 – Valuing Start-Up Companies
©2020 The Saudi Authority for Accredited Valuers (TAQEEM) 72
G. Management also provided a discounted cash flow model which values the
company given the prospective financial information above:
DAMMAM FOODS, Inc.
PFI - BASE CASE SCENARIO
Currency: SAR
2020 2021 2022 2023 2024 2025 2026 2027 2028 CAGR
Revenue 9,750,000 17,062,500 25,593,750 35,831,250 46,580,625 55,896,750 64,281,263 71,995,014 77,754,615 29.6%
Cost of Revenues 4,680,000 7,678,125 11,517,188 14,332,500 18,632,250 22,358,700 24,105,473 26,998,130 29,157,981
Gross Profit 5,070,000 9,384,375 14,076,563 21,498,750 27,948,375 33,538,050 40,175,789 44,996,884 48,596,634 32.6%
Selling, marketing & distribution 4,631,250 7,251,563 10,237,500 12,540,938 15,371,606 16,769,025 17,355,941 17,998,754 19,438,654
General & administrative 2,450,000 2,891,000 3,396,925 3,906,464 4,394,772 4,834,249 5,220,989 5,534,248 5,810,961
Total S,G&A 7,081,250 10,142,563 13,634,425 16,447,401 19,766,378 21,603,274 22,576,930 23,533,002 25,249,614
EBITDA (2,011,250) (758,188) 442,138 5,051,349 8,181,997 11,934,776 17,598,859 21,463,882 23,347,020
Depreciation & Amortization 27,120 32,120 52,120 67,120 77,120 70,000 75,000 90,000 110,000
EBIT (2,038,370) (790,307) 390,018 4,984,229 8,104,877 11,864,776 17,523,859 21,373,882 23,237,020
Other income (expense)
Other expense - - - - - - - - -
EBT (2,038,370) (790,307) 390,018 4,984,229 8,104,877 11,864,776 17,523,859 21,373,882 23,237,020
Invested Capital Cash Flow
2020 2021 2022 2023 2024 2025 2026 2027 2028
EBT (2,038,370) (790,307) 390,018 4,984,229 8,104,877 11,864,776 17,523,859 21,373,882 23,237,020
Income Tax Rate 0.0% 0.0% 0.0% 0.0% 0.0% 0.0% 0.0% 0.0% 0.0%
Income Taxes - - - - - - - - -
Net income After Tax (2,038,370) (790,307) 390,018 4,984,229 8,104,877 11,864,776 17,523,859 21,373,882 23,237,020
Cash Flow Adjustments
Depreciation 27,120 32,120 52,120 67,120 77,120 70,000 75,000 90,000 110,000
Capital investment (75,000) (25,000) (100,000) (75,000) (50,000) (100,000) (50,000) (75,000) (100,000)
Change in working capital (350,000) (365,625) (426,563) (511,875) (537,469) (465,806) (419,226) (385,688) (287,980)
Total Cash Flow Adjustments (397,880) (358,505) (474,443) (519,755) (510,349) (495,806) (394,226) (370,688) (277,980)
Equity Cash Flow (2,436,250) (1,148,813) (84,425) 4,464,474 7,594,528 11,368,970 17,129,634 21,003,195 22,959,040
Assumptions
Revenue growth 75.0% 50.0% 40.0% 30.0% 20.0% 15.0% 12.0% 8.0%
Gross profit margin 52.0% 55.0% 55.0% 60.0% 60.0% 60.0% 62.5% 62.5% 62.5%
Selling, marketing & distribution 47.5% 42.5% 40.0% 35.0% 33.0% 30.0% 27.0% 25.0% 25.0%
General & Administrative expense growth rate 10.00% 18.00% 17.50% 15.00% 12.50% 10.00% 8.00% 6.00% 5.00%
EBITDA Margin -20.63% -4.44% 1.73% 14.10% 17.57% 21.35% 27.38% 29.81% 30.03%
Depreciation 0.40% 0.40% 0.40% 0.40% 0.40% 0.40% 0.40% 0.40% 0.40%
Op Working Capital as % sales 5.0% 5.0% 5.0% 5.0% 5.0% 5.0% 5.0% 5.0% 5.0%
Fiscal Year Ended December 31,
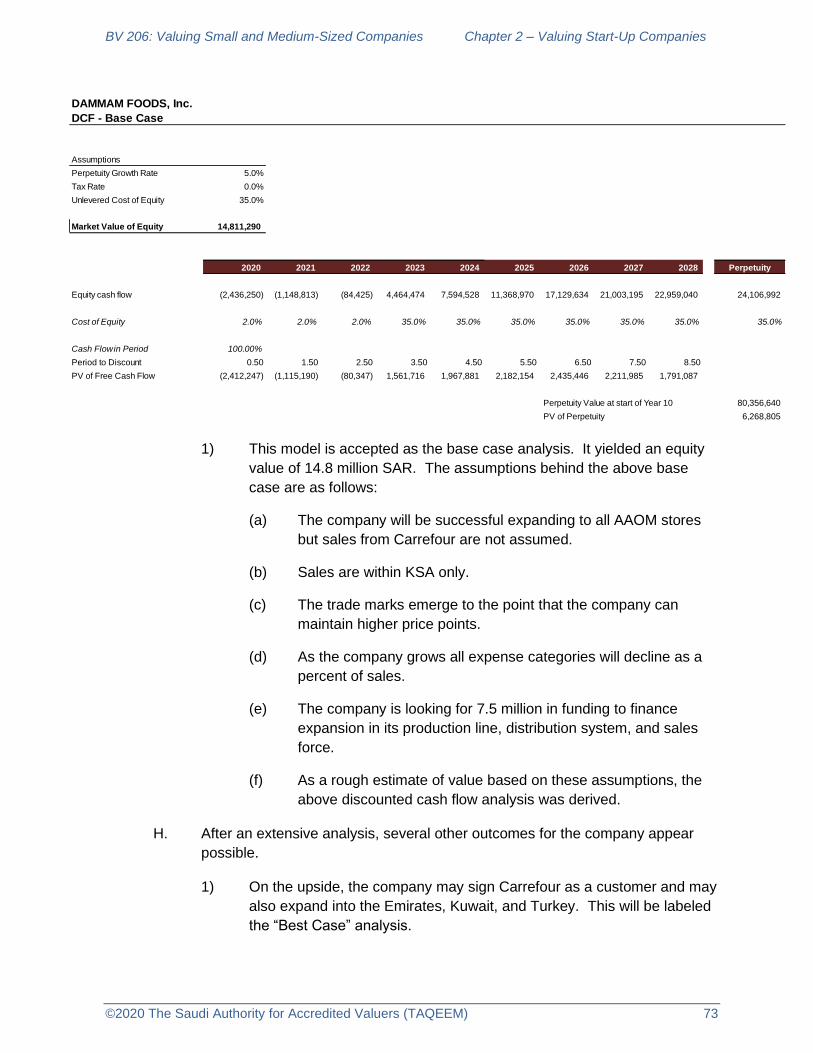
BV 206: Valuing Small and Medium-Sized Companies Chapter 2 – Valuing Start-Up Companies
©2020 The Saudi Authority for Accredited Valuers (TAQEEM) 73
1) This model is accepted as the base case analysis. It yielded an equity
value of 14.8 million SAR. The assumptions behind the above base
case are as follows:
(a) The company will be successful expanding to all AAOM stores
but sales from Carrefour are not assumed.
(b) Sales are within KSA only.
(c) The trade marks emerge to the point that the company can
maintain higher price points.
(d) As the company grows all expense categories will decline as a
percent of sales.
(e) The company is looking for 7.5 million in funding to finance
expansion in its production line, distribution system, and sales
force.
(f) As a rough estimate of value based on these assumptions, the
above discounted cash flow analysis was derived.
H. After an extensive analysis, several other outcomes for the company appear
possible.
1) On the upside, the company may sign Carrefour as a customer and may
also expand into the Emirates, Kuwait, and Turkey. This will be labeled
the “Best Case” analysis.
DAMMAM FOODS, Inc.
DCF - Base Case
Assumptions
Perpetuity Growth Rate 5.0%
Tax Rate 0.0%
Unlevered Cost of Equity 35.0%
Market Value of Equity 14,811,290
2020 2021 2022 2023 2024 2025 2026 2027 2028 Perpetuity
Equity cash flow (2,436,250) (1,148,813) (84,425) 4,464,474 7,594,528 11,368,970 17,129,634 21,003,195 22,959,040 24,106,992
Cost of Equity 2.0% 2.0% 2.0% 35.0% 35.0% 35.0% 35.0% 35.0% 35.0% 35.0%
Cash Flow in Period 100.00%
Period to Discount 0.50 1.50 2.50 3.50 4.50 5.50 6.50 7.50 8.50
PV of Free Cash Flow (2,412,247) (1,115,190) (80,347) 1,561,716 1,967,881 2,182,154 2,435,446 2,211,985 1,791,087
Perpetuity Value at start of Year 10 80,356,640
PV of Perpetuity 6,268,805

BV 206: Valuing Small and Medium-Sized Companies Chapter 2 – Valuing Start-Up Companies
©2020 The Saudi Authority for Accredited Valuers (TAQEEM) 74
2) On the downside, the company’s tradenames may not catch on, making
it unable to achieve the higher price points. Expansion to Carrefour and
other countries does not occur. This will be labeled the “Worst Case”
analysis.
I. The Best Case PFI and DCF are as follows:
1) The Best Case DCF results are shown below:
DAMMAM FOODS, Inc.
PFI - BEST CASE SCENARIO
Currency: SAR
2020 2021 2022 2023 2024 2025 2026 2027 2028 CAGR
Revenue 10,500,000 21,000,000 42,000,000 84,000,000 147,000,000 220,500,000 308,700,000 385,875,000 424,462,500 58.8%
Cost of Revenues 5,040,000 9,450,000 18,480,000 33,600,000 55,860,000 83,790,000 111,132,000 138,915,000 148,561,875
Gross Profit 5,460,000 11,550,000 23,520,000 50,400,000 91,140,000 136,710,000 197,568,000 246,960,000 275,900,625 63.3%
Selling, marketing & distribution 4,987,500 8,820,000 16,800,000 29,400,000 48,510,000 66,150,000 83,349,000 96,468,750 106,115,625
General & administrative 2,450,000 2,891,000 3,324,650 3,790,101 4,244,913 4,669,404 5,042,957 5,345,534 5,612,811
Total S,G&A 7,437,500 11,711,000 20,124,650 33,190,101 52,754,913 70,819,404 88,391,957 101,814,284 111,728,436
EBITDA (1,977,500) (161,000) 3,395,350 17,209,899 38,385,087 65,890,596 109,176,043 145,145,716 164,172,189
Depreciation & Amortization 82,120 162,120 262,120 362,120 452,120 460,000 450,000 510,000 560,000
EBIT (2,059,620) (323,120) 3,133,230 16,847,779 37,932,967 65,430,596 108,726,043 144,635,716 163,612,189
Other income (expense)
Other expense - - - - - - - - -
EBT (2,059,620) (323,120) 3,133,230 16,847,779 37,932,967 65,430,596 108,726,043 144,635,716 163,612,189
Equity Cash Flow
2020 2021 2022 2023 2024 2025 2026 2027 2028
EBT (2,059,620) (323,120) 3,133,230 16,847,779 37,932,967 65,430,596 108,726,043 144,635,716 163,612,189
Income Tax Rate 0.0% 0.0% 0.0% 0.0% 0.0% 0.0% 0.0% 0.0% 0.0%
Income Taxes - - - - - - - - -
Net Income After Tax (2,059,620) (323,120) 3,133,230 16,847,779 37,932,967 65,430,596 108,726,043 144,635,716 163,612,189
Cash Flow Adjustments
Depreciation 82,120 162,120 262,120 362,120 452,120 460,000 450,000 510,000 560,000
Capital investment (350,000) (400,000) (500,000) (500,000) (450,000) (450,000) (350,000) (300,000) (250,000)
Change in working capital (350,000) (525,000) (1,050,000) (2,100,000) (3,150,000) (3,675,000) (4,410,000) (3,858,750) (1,929,375)
Total Cash Flow Adjustments (617,880) (762,880) (1,287,880) (2,237,880) (3,147,880) (3,665,000) (4,310,000) (3,648,750) (1,619,375)
Equity Cash Flow (2,677,500) (1,086,000) 1,845,350 14,609,899 34,785,087 61,765,596 104,416,043 140,986,966 161,992,814
Assumptions
Revenue growth 100.0% 100.0% 100.0% 75.0% 50.0% 40.0% 25.0% 10.0%
Gross profit margin 52.0% 55.0% 56.0% 60.0% 62.0% 62.0% 64.0% 64.0% 65.0%
Selling, marketing & distribution 47.5% 42.0% 40.0% 35.0% 33.0% 30.0% 27.0% 25.0% 25.0%
General & Administrative expense growth rate 10.00% 18.00% 15.00% 14.00% 12.00% 10.00% 8.00% 6.00% 5.00%
EBITDA Margin -18.83% -0.77% 8.08% 20.49% 26.11% 29.88% 35.37% 37.61% 38.68%
Depreciation 0.40% 0.40% 0.40% 0.40% 0.40% 0.40% 0.40% 0.40% 0.40%
Op Working Capital as % sales 5.0% 5.0% 5.0% 5.0% 5.0% 5.0% 5.0% 5.0% 5.0%
Fiscal Year Ended December 31,

BV 206: Valuing Small and Medium-Sized Companies Chapter 2 – Valuing Start-Up Companies
©2020 The Saudi Authority for Accredited Valuers (TAQEEM) 75
2) Under the Best Case, the sales growth rate is obviously higher but the
margins also improve over the Base Case as the company gains
economies of scale. Also, since the forecast is more speculative, a
higher discount rate is applied, at 45%.
J. The Worst Case PFI and DCF are shown below:
DAMMAM FOODS, Inc.
DCF - Best Case
Assumptions
Perpetuity Growth Rate 5.0%
Tax Rate 0.0%
Unlevered Cost of Equity 45.0%
Market Value of Equity 58,403,778
2020 2021 2022 2023 2024 2025 2026 2027 2028 Perpetuity
Equity Cash Flow (2,677,500) (1,086,000) 1,845,350 14,609,899 34,785,087 61,765,596 104,416,043 140,986,966 161,992,814 169,050,000
Cost of Equity 2.0% 2.0% 45.0% 45.0% 45.0% 45.0% 45.0% 45.0% 45.0% 45.0%
Cash Flow in Period 100.00%
Period to Discount 0.50 1.50 2.50 3.50 4.50 5.50 6.50 7.50 8.50
PV of Free Cash Flow (2,651,120) (1,054,216) 728,885 3,979,781 6,534,872 8,002,444 9,329,862 8,687,983 6,884,426
Perpetuity Value at start of Year 10 422,625,000
PV of Perpetuity 17,960,862

BV 206: Valuing Small and Medium-Sized Companies Chapter 2 – Valuing Start-Up Companies
©2020 The Saudi Authority for Accredited Valuers (TAQEEM) 76
K. The Worst Case DCF is shown below:
DAMMAM FOODS, Inc.
PFI -WORST CASE SCENARIO
Currency: SAR
2020 2021 2022 2023 2024 2025 2026 2027 2028 CAGR
Revenue 8,000,000 8,480,000 8,904,000 9,349,200 9,816,660 10,307,493 10,822,868 11,364,011 11,932,212 5.1%
Cost of Revenues 4,000,000 4,240,000 4,452,000 4,674,600 4,908,330 5,153,747 5,411,434 5,682,006 5,966,106
Gross Profit 4,000,000 4,240,000 4,452,000 4,674,600 4,908,330 5,153,747 5,411,434 5,682,006 5,966,106 5.1%
Selling, marketing & distribution 3,600,000 2,968,000 2,893,800 2,804,760 2,454,165 2,061,499 2,164,574 2,272,802 2,386,442
General & administrative 2,450,000 2,499,000 2,548,980 2,599,960 2,651,959 2,704,998 2,759,098 2,814,280 2,870,565
Total S,G&A 6,050,000 5,467,000 5,442,780 5,404,720 5,106,124 4,766,497 4,923,671 5,087,082 5,257,008
EBITDA (2,050,000) (1,227,000) (990,780) (730,120) (197,794) 387,250 487,762 594,923 709,098
Depreciation & Amortization 22,120 32,120 36,120 38,120 40,120 20,000 12,000 14,000 16,000
EBIT (2,072,120) (1,259,120) (1,026,900) (768,239) (237,914) 367,250 475,762 580,923 693,098
Other income (expense)
Other expense - - - - - - - - -
EBT (2,072,120) (1,259,120) (1,026,900) (768,239) (237,914) 367,250 475,762 580,923 693,098
Equity Cash Flow
2020 2021 2022 2023 2024 2025 2026 2027 2028
EBT (2,072,120) (1,259,120) (1,026,900) (768,239) (237,914) 367,250 475,762 580,923 693,098
Income Tax Rate 0.0% 0.0% 0.0% 0.0% 0.0% 0.0% 0.0% 0.0% 0.0%
Income Taxes - - - - - - - - -
Net Income After Tax (2,072,120) (1,259,120) (1,026,900) (768,239) (237,914) 367,250 475,762 580,923 693,098
Cash Flow Adjustments
Depreciation 22,120 32,120 36,120 38,120 40,120 20,000 12,000 14,000 16,000
Capital investment (50,000) (50,000) (20,000) (10,000) (10,000) (10,000) (10,000) (10,000) (10,000)
Change in working capital (350,000) (24,000) (21,200) (22,260) (23,373) (24,542) (25,769) (27,057) (28,410)
Total Cash Flow Adjustments (377,880) (41,880) (5,080) 5,860 6,747 (14,542) (23,769) (23,057) (22,410)
Equity Cash Flow (2,450,000) (1,301,000) (1,031,980) (762,380) (231,167) 352,708 451,994 557,866 670,688
Assumptions
Revenue growth 6.0% 5.0% 5.0% 5.0% 5.0% 5.0% 5.0% 5.0%
Gross profit margin 50.0% 50.0% 50.0% 50.0% 50.0% 50.0% 50.0% 50.0% 50.0%
Selling, marketing & distribution 45.0% 35.0% 32.5% 30.0% 25.0% 20.0% 20.0% 20.0% 20.0%
General & Administrative expense growth rate 5.00% 2.00% 2.00% 2.00% 2.00% 2.00% 2.00% 2.00% 2.00%
EBITDA Margin -25.63% -14.47% -11.13% -7.81% -2.01% 3.76% 4.51% 5.24% 5.94%
Depreciation 0.40% 0.40% 0.40% 0.40% 0.40% 0.40% 0.40% 0.40% 0.40%
Op Working Capital as % sales 5.0% 5.0% 5.0% 5.0% 5.0% 5.0% 5.0% 5.0% 5.0%
Fiscal Year Ended December 31,

BV 206: Valuing Small and Medium-Sized Companies Chapter 2 – Valuing Start-Up Companies
©2020 The Saudi Authority for Accredited Valuers (TAQEEM) 77
1) Under the worst case, the company does not gain pricing traction and is
unable to expand effectively. Even though profits are projected to occur
in the future they are not substantial enough to counteract losses over
the next five years. Hence the value is zero.
L. Reconciation of Analyses
1) After the three scenarios were completed the analyst decided on a
conservative probability weighting of 30% for the worst case, 60% for
the base case, and 10% for the best case. As shown above, this results
in an estimate of value of SAR 13,600,000.
(a) This value could drive the thinking on how much to invest and
the take-back on the investment. For example, if a VC has a
comfort level with the 13.6 million, he might offer 5,000,000 of
DAMMAM FOODS, Inc.
DCF - Worst Case
Assumptions
Perpetuity Growth Rate 5.0%
Tax Rate 0.0%
Unlevered Cost of Equity 25.0%
Market Value of Equity (3,770,328)
2020 2021 2022 2023 2024 2025 2026 2027 2028 Perpetuity
Equity Cash Flow (2,450,000) (1,301,000) (1,031,980) (762,380) (231,167) 352,708 451,994 557,866 670,688 704,222
Cost of Equity 2.0% 2.0% 25.0% 25.0% 25.0% 25.0% 25.0% 25.0% 25.0% 25.0%
Cash Flow in Period 100.00%
Period to Discount 0.50 1.50 2.50 3.50 4.50 5.50 6.50 7.50 8.50
PV of Free Cash Flow (2,425,861) (1,262,923) (590,740) (349,129) (84,690) 103,374 105,978 104,642 100,643
Perpetuity Value at start of Year 10 3,521,112
PV of Perpetuity 528,378
DAMMAM FOODS, Inc.
Scenario Summary
(SAR)
Worst Case Base Case Best Case
Scenario Scenario Scenario
Indicated Fair Market Value of Equity, control (3,800,000) 14,800,000 58,400,000
Probability of Occurrence 30.0% 60.0% 10.0%
Weighted Contribution to Value (1,140,000) 8,880,000 5,840,000
Value Estimate = 13,600,000

BV 206: Valuing Small and Medium-Sized Companies Chapter 2 – Valuing Start-Up Companies
©2020 The Saudi Authority for Accredited Valuers (TAQEEM) 78
financing for a 50% interest with a preference of a return of
capital and let negotiations proceed from there.
M. Problems with the income approach
1) The analyses of Dammam Foods above would not be applicable to
companies in the seed-stage and early-stage since they have no
historical commercial operations on which to base the PFI.
(a) Many VC firms would say that a DCF analysis on companies in
any of the first three categories is too speculative to be
meaningful.
2) The costs of equity are speculative, given broad ranges of rates that are
accepted in the industry.
(a) Also, in the case example above, the rates of return apply to
portfolios of companies, not single companies, so they likely
overestimate value.
3) The probability weights (30%, 60%, and 10%) are not based on any
empirical studies. They represent the analyst’s opinion only.
5. Market Approach
A. Back-solve Method
1) This method is part of the market approach since it relies on a prior
transaction of the subject’s stock to establish enterprise value. The
method simply applies the price of the most recent round of investment
across all of the issues stock in the company. Assume, for example the
following capitalization table:
2) In the example above, the 22.5 million value ignores the prices paid in
the first two issuances of common stock since those prices reflect facts
that are no longer relevant. For the 22.5 million value to be relevant:
Back-Solve Example 1. Common Stock
Capital Structure Issued # Shares SAR Per Share
Common stock (1st issue) 01/31/18 500,000 1.00
Common stock (2nd issue) 12/31/18 2,000,000 2.50
Common stock (3rd issue) 06/30/19 2,000,000 5.00
Value using back-solve method = 4,500,000 shares x 5.00 per share
= SAR 22,500,000
BV 206: Valuing Small and Medium-Sized Companies Chapter 2 – Valuing Start-Up Companies
©2020 The Saudi Authority for Accredited Valuers (TAQEEM) 79
(a) The valuation date should be not so long after June 30, 2019
that the price of SAT 5.00 per share paid is no longer applicable;
and
(b) The company and economic facts in play as of June 30, 2019
should still apply at the valuation date.
6. Option Models
A. Option models were presented in BV 104 as a method of allocating an
enterprise value over various classes of securities (common stock, preferred
stock, etc.). The topic in this chapter is how the venture capitalist and founder
establish a pre-money enterprise value at the early-stage.
B. Binomial lattice models are used both to establish the underlying value of the
asset and to allocate value over the classes of ownership in the asset. The
Black-Scholes option model was covered in BV 104. Binomial models are
considered better in these cases to the Black-Scholes model.
1) Multi-stage binomial models allow for fluctuations in value over the life of
the option.
2) Binomial models allow multiple exerise scenarios which follow mutliple
financing rounds
7. The factors that VCs rely on to value early-stage companies – industry literature
indicates the following seven factors:
A. Stage of the company – Micro-fund VCs have a valuation range that is driven
by the parameters of average seed-stage investments. Toward that end, seed-
stage companies that appear to be good bets might get $2 to $3 million for a
take-back of 25% to 35%.
B. Competition with other funding sources – Values tend to increase with more VC
firms competing for the investment. The presence of competition provides
confirmation that the company is worth the investment. VCs do not like to be
the only investor thinking a prospect is worth the money.
C. Experience of the founders and management team – Without historical
business operations, the only history the VC can analze is the work history of
the management team. If they have experience, have raised money before and
brought companies to market, this factor will drive the value up.
D. Size and trendiness of the market – Values may increase or decrease with the
trendiness of the market. If the company is entering a mature-stage industry it
is likely they’ll have problems with funding unless they have a demonstrated
competitive advantage over existing products in the market.

BV 206: Valuing Small and Medium-Sized Companies Chapter 2 – Valuing Start-Up Companies
©2020 The Saudi Authority for Accredited Valuers (TAQEEM) 80
E. The VCs natural entry point – Seed-stage and early-stage VCs tend to invest at
values within their given parameters (discussed above). All start-up companies
that are worthwhile tend to be viewed within the VC’s range of comfort. Later-
stage VCs will have a broader valuation range, but also have more data within
the company to work with.
F. Quantitative analysis – If the company has a history of operations, those
numbers will be scrutinized and projections will be made with full awareness of
how speculative those numbers will be.
G. Current economic climate – Valuations of all companies are partially affected by
the macroeconomy. VC firms were funding at lower points in 2008 than they
were in 2004 or 2019. Good economic times drive venture values up, while bad
economic times drive venture value down.

BV 206: Valuing Small and Medium-Sized Companies Chapter 2 – Valuing Start-Up Companies
©2020 The Saudi Authority for Accredited Valuers (TAQEEM) 81
V. Appendix A - Chapter Review Questions
1. To operate in KSA, a domestic, privately-owned venture capital fund must comply with
which of the following:
A. Have at least 50 shareholders
B. A venture capital fund can only be public. There are no private VC funds in
KSA.
C. Gain approval from the Capital Markets Authority
D. Raise at least SAR 100 million in capital
2. An analyst could use the cost approach to estimate the value of early-stage intangible
assets by:
A. Assuming all expenditures between opening and the valuation date represent
the value of all intangible assets
B. Applying an MPEEM model
C. Using a relief from royalty method to isolate the intangible’s cash flow
D. Estimating future cash flows from the intangible asset
3. A venture capital firm decides to invest SAR 500,000 into a company at a pre-money
value of $1,000,000. The pre-financing cap table for the company is shown below:
What will the diluted interest of Founder #2 become after the investment is made?
A. 5.0%
B. 22.2%
C. 33.0%
D. 16.7%
Pre-Financing
Security # of Shares %
Common – Founders
Founder #1 100,000 67.0%
Founder #2 50,000 33.0%
Series A Preferred -

BV 206: Valuing Small and Medium-Sized Companies Chapter 2 – Valuing Start-Up Companies
©2020 The Saudi Authority for Accredited Valuers (TAQEEM) 82
4. An average seed-stage investment by a VC firm in the U.S. as of 2018 would be:
A. $10,000,000
B. $40,000,000
C. $500,000
D. $2,000,000
5. A VC’s required rate of return for a portfolio of expansion-stage companies would likely
fall in which of the following ranges?
A. 50% to 75%
B. 25% to 80%
C. 30% to 50%
D. 10% to 20%
Answers: 1-C, 2-A, 3-B, 4-D, 5-C

BV 206: Valuing Small and Medium-Sized Companies Chapter 2 – Valuing Start-Up Companies
©2020 The Saudi Authority for Accredited Valuers (TAQEEM) 83
VI. Appendix B – Case Exercise
GenA Software Company was opened in Jeddah on July 1, 2017. The Company is an early-
stage enterprise since they developed a suite of software products and are generating
revenues. GenA provides software services to the Saudi stock exchange, Tadawul and the
Nomu Parallel Market. The software solutions enable the deposit, transfer, clearing,
settlement, and registry of daily stock trades in the market. GenA plans to expand its services
to the Kuwait Stock Exchange, the Dubai Financial Market, and the Ammam Stock Exchange
between 2020 and 2022.
GenA is owned by Ahmed bin Alwaq, who personally developed the original suite of software
products. He has grown GenA over the past two years by relying on a mix of subcontractors
and in-house employees. Mr. Alwaq is well-known in the IT field with a 20-year history as a
consultant to governmental and private institutions in the Middle East. He launched GenA with
his personal funds and had been financing the Company through its first 2.5 years. The
Company operates out of one floor of an office building owned by Mr. Alwaq.
Mr. Alwaq has approached your venture capital firm with a request for SAR 25,000,000 in
investment to enable him to achieve the following:
• Convert the Company’s products to a cloud-based service
• Move from a subcontractor-reliant firm to a full employee-based firm
• Expand services into Dubai, Kuwait, and Jordan
Mr. Alwaq prepared an income statement forecast that accompanies the historical statements.
This information is contained below and is included in the GenA excel file.

BV 206: Valuing Small and Medium-Sized Companies Chapter 2 – Valuing Start-Up Companies
©2020 The Saudi Authority for Accredited Valuers (TAQEEM) 84
GenA Software
Balance SheetsFor the Fiscal Year Ended December 31,
(SAR)
2017 2018 2019 2017 2018 2019
ASSETS
Current Assets
Cash 68,760 229,432 50,600 95.5% 26.4% 5.3%
Accounts receivable 3,236 640,076 906,492 4.5% 73.6% 94.7%
Total current assets 71,996 869,508 957,092 100.0% 100.0% 100.0%
-
Total Assets 71,996 869,508 957,092 100.0% 100.0% 100.0%
Current liabilities -
Total current liabilities - - - 0.0% 0.0% 0.0%
Total liabilities - - - 0.0% 0.0% 0.0%
Shareholders' Equity -
Owner's investment 50,400 951,200 1,024,000 70.0% 109.4% 107.0%
Retained earnings 21,596 (81,692) (66,908) 30.0% -9.4% -7.0%
Shareholder equity 71,996 869,508 957,092 100.0% 100.0% 100.0%
- - -
Total liabilities and capital 71,996 869,508 957,092 100.0% 100.0% 100.0%
Percent of Assets
GenA Software
Income StatementsFor the Fiscal Year Ended December 31,
(SAR)
2017 2018 2019 2017 2018 2019
Gross Revenue 427,740 3,897,784 5,579,152 100.0% 100.0% 100.0%
Operating Expenses
Advertising & marketing 2,040 62,000 91,600 0.5% 1.6% 1.6%
Bank charges 700 6,944 1,008 0.2% 0.2% 0.0%
Subcontractors 114,400 1,311,560 1,491,540 26.7% 33.6% 26.7%
Staff salaries 36,080 1,538,520 1,826,128 8.4% 39.5% 32.7%
Insurance 6,300 8,292 37,904 1.5% 0.2% 0.7%
Legal & professional 139,500 623,248 825,424 32.6% 16.0% 14.8%
Meals & entertainment 27,808 78,652 189,648 6.5% 2.0% 3.4%
Office supplies & software 23,264 113,396 374,704 5.4% 2.9% 6.7%
Other business expenses 9,972 87,512 52,576 2.3% 2.2% 0.9%
Licenses, permits - 12,284 282,336 0.0% 0.3% 5.1%
Miscellaneous expense - 48 880 0.0% 0.0% 0.0%
Travel 46,080 158,616 390,620 10.8% 4.1% 7.0%
Total Operating Expenses 406,144 4,001,072 5,564,368 95.0% 102.6% 99.7%
EBITDA 21,596 (103,288) 14,784 5.0% -2.6% 0.3%
Depreciation & amortization - - - 0.0% 0.0% 0.0%
EBIT 21,596 (103,288) 14,784 5.0% -2.6% 0.3%
Other income (expense) - - - 0.0% 0.0% 0.0%
Earnings Before Tax 21,596 (103,288) 14,784 5.0% -2.6% 0.3%
The fiscal year 2017 represents six months of operations
Percent of Sales

BV 206: Valuing Small and Medium-Sized Companies Chapter 2 – Valuing Start-Up Companies
©2020 The Saudi Authority for Accredited Valuers (TAQEEM) 85
Chapter 2 Case Exercises
1. Questions
A. Review the historical balance sheet and income statement for the last three
fiscal periods as well as the management’s projections prepared by Mr. Alwaq.
Based on your review, prepare a list of questions to ask Mr. Alwaq in your
meeting.
2. Your staff corrected management’s forecast and prepared three sets of projections, a
pessimistic, base, and optimistic forecast. These projections are contained in tabs
‘Pessimistic Frcst’, ‘Base Forecst’, and ‘Optimistic Frcst’. You must complete the
following:
A. Decide a cost of equity for each scenario and enter into the shaded cell in the
tabs ‘DCF-Pessimist’, ‘DCF-Base’, and ‘DCF-Optim’. Net present values will be
calculated automatically.
B. Based on these calculations and your review of Mr. bin Alwaq’s answers, make
a proposal to your VC partners as to the amount the firm should invest and
under what terms.
GenA Software
Management's Projections 2020-2024(SAR)
2020 2021 2022 2023 2024 2020 2021 2022 2023 2024
Revenue 8,000,000 12,000,000 20,000,000 30,000,000 40,000,000 100.0% 100.0% 100.0% 100.0% 100.0%
Overhead
Software subscriptions 429,069 426,016 427,292 427,292 428,292 5.4% 3.6% 2.1% 1.4% 1.1%
Business Insurance 13,293 15,000 15,000 15,000 15,000 0.2% 0.1% 0.1% 0.1% 0.0%
Internet 19,200 24,800 26,800 28,800 32,800 0.2% 0.2% 0.1% 0.1% 0.1%
Bank Fees 1,200 1,200 1,200 1,200 1,200 0.0% 0.0% 0.0% 0.0% 0.0%
Telephone 15,352 15,352 15,352 15,352 15,352 0.2% 0.1% 0.1% 0.1% 0.0%
Retirement Plan 2,688 2,688 2,688 2,688 2,688 0.0% 0.0% 0.0% 0.0% 0.0%
Office expense 195,130 220,000 240,000 260,000 320,000 2.4% 1.8% 1.2% 0.9% 0.8%
Misc/Travel 40,000 60,000 60,000 60,000 60,000 0.5% 0.5% 0.3% 0.2% 0.2%
Subcontractors 1,325,000 1,100,000 875,000 690,000 425,000 16.6% 9.2% 4.4% 2.3% 1.1%
VP, Operations 408,000 440,000 480,000 500,000 520,000 5.1% 3.7% 2.4% 1.7% 1.3%
Senior consultant #1 240,000 250,000 260,000 280,000 300,000 3.0% 2.1% 1.3% 0.9% 0.8%
Senior consultant #2 240,000 250,000 260,000 280,000 300,000 3.0% 2.1% 1.3% 0.9% 0.8%
Senior programmer 220,000 230,000 240,000 260,000 280,000 2.8% 1.9% 1.2% 0.9% 0.7%
Programmer #1 180,000 190,000 200,000 220,000 240,000 2.3% 1.6% 1.0% 0.7% 0.6%
Programmer #2 180,000 190,000 200,000 220,000 240,000 2.3% 1.6% 1.0% 0.7% 0.6%
Programmer #3 170,000 180,000 190,000 200,000 220,000 2.1% 1.5% 1.0% 0.7% 0.6%
Programmer #4 170,000 180,000 190,000 200,000 220,000 2.1% 1.5% 1.0% 0.7% 0.6%
Programmer #5 - 170,000 180,000 190,000 200,000 0.0% 1.4% 0.9% 0.6% 0.5%
Programmer #6 - - 170,000 180,000 200,000 0.0% 0.0% 0.9% 0.6% 0.5%
Programmer #7 - - 170,000 180,000 190,000 0.0% 0.0% 0.9% 0.6% 0.5%
Programmer #8 - - - 170,000 180,000 0.0% 0.0% 0.0% 0.6% 0.5%
Total expenses 3,848,931 3,945,056 4,203,332 4,380,332 4,390,332 48.1% 32.9% 21.0% 14.6% 11.0%
Reported Income 4,151,069 8,054,944 15,796,668 25,619,668 35,609,668 51.9% 67.1% 79.0% 85.4% 89.0%
Percent of Revenue

BV 206: Valuing Small and Medium-Sized Companies Chapter 2 – Valuing Start-Up Companies
©2020 The Saudi Authority for Accredited Valuers (TAQEEM) 86
Chapter 2 Case Exercise Answers
1. Suggested Questions
Financial forecast questions
1) Your forecast of operations shows profits in 2020 of 5 million growing to
36 million by 2024. With internally generated profits this high, why do
you need external funding?
2) What are the assumptions behind the sales forecast? Does this include
expansion into all three countries? If so, break down by country.
3) How much will the company grow organically if none of the new target
clients are signed?
4) There is no allocation for your salary. Have you taken compensation in
the past? How much will be taken in the future?
5) The Company has no tangible assets (no equipment, furniture, real
estate, etc.). How does the company operate with no equipment? Who
owns the computers?
6) Several areas of overhead do not appear on the projected income
statements. There are no administrative salaries (CFO, A/R, payroll,
office manager, administrative, legal and professional costs, etc.).
Why?
7) There is no rent for office space, although there is an office expense.
Explain.
8) The company only adds 4 employees between 2020 and 2024, although
sales grow from 8 million to 40 million. How is this possible?
9) Total staff compensation, including subcontractors, actually declines in
riyals between 2019 and 2024. How will this be possible even if you can
generate the higher sales without subcontractors and with only 12
employees?
General business questions
10) Who are your top employees? Who are the people who will make this
work?
11) How has the company achieved the sales growth over the last three
years? Personal relationships? Product quality?

BV 206: Valuing Small and Medium-Sized Companies Chapter 2 – Valuing Start-Up Companies
©2020 The Saudi Authority for Accredited Valuers (TAQEEM) 87
12) How do the factors that made the company grow so far in KSA translate
to the new target markets in Dubair, Kuwait, and Jordan?
13) What vendors are currently used by the stock markets in the target
markets? Why would these customers switch to GenA?
14) How much of your own money are you investing?
15) If 50,000,000 is invested how will it break down according to the three
areas you discussed (switching to the cloud, switching from subs to
employees, expanding market)?
Answers provided by Ahmed bin Alwaq
1) Your forecast of operations shows profits in 2020 of 5 million growing to
36 million by 2024. With internally generated profits this high, why do
you need external funding?
I may have been aggressive in growth calculations happening so
quickly. It will take a couple years to convert to the cloud. We also
need capital to hire personnel.
2) What are the assumptions behind the sales forecast? Does this include
expansion into all three countries? If so, break down by country.
I anticipate that about 40% of the growth will come from Dubai, 30%
from Kuwait, and 20% from Jordan. About 10% will come from existing
operations.
3) How much will the company grow organically if none of the new target
clients are signed?
Maybe 10% to 20% per year.
4) There is no allocation for your salary. Have you taken compensation in
the past? How much will be taken in the future?
I have not taken a salary since I have been investing money in the
company over the first three years. A reasonable compensation for
someone with my skill set is at least 750,000 to 1,000,000 per year.
5) The Company has no tangible assets (no equipment, furniture, real
estate, etc.). How does the company operate with no equipment? Who
owns the computers?
The computers are owned by each employee. We really should be
supplying computers. Since many of the employees work from home
we have not experienced a need for furniture, etc.
BV 206: Valuing Small and Medium-Sized Companies Chapter 2 – Valuing Start-Up Companies
©2020 The Saudi Authority for Accredited Valuers (TAQEEM) 88
6) Several areas of overhead do not appear on the projected income
statements. There are no administrative salaries (CFO, A/R, payroll,
office manager, administrative, legal and professional costs, etc.).
Why?
My mistake. My projections really only focused on sales and employee
salaries. Those other costs should have been included.
7) There is no rent for office space, although there is an office expense.
Explain.
I have provided space rent free in an office building that I own
personally. We will need at least 10,000 square feet of space if my
forecast is to come about.
8) The company only adds 4 employees between 2020 and 2024, although
sales grow from 8 million to 40 million. How is this possible?
That is correct. We probably will need additional employees with that
high a revenue base, especially since employees will need to be on
location in other countries.
9) Total staff compensation, including subcontractors, actually declines in
riyals between 2019 and 2024. How will this be possible even if you can
generate the higher sales without subcontractors and with only 12
employees?
Yes, it appears that I should rethink the staffing costs. It appears that
those costs are underestimated in my projections.
General business questions
10) Who are your top employees? Who are the people who will make this
work?
My top three personnel are listed as the VP of operations and the two
senior consultants. These three each have at least 15 years experience
working in the field. My VP was recruited from the London Exchange
where he worked in IT.
11) How has the company achieved the sales growth over the last three
years? Personal relationships? Product quality?
I have two close personal family relationships with key decision makers
at the CMA.

BV 206: Valuing Small and Medium-Sized Companies Chapter 2 – Valuing Start-Up Companies
©2020 The Saudi Authority for Accredited Valuers (TAQEEM) 89
12) How do the factors that made the company grow so far in KSA translate
to the new target markets in Dubair, Kuwait, and Jordan?
I have a similar relationship at the Dubai exchange. A brother-in-law at
the exchange is hoped to give us an inside track there. I am afraid the
Kuwait and Jordan deals will be a bit of a cold call.
13) What vendors are currently used by the stock markets in the target
markets? Why would these customers switch to GenA?
I have yet to complete that research.
14) How much of your own money are you investing?
I’ve invested several hundred thousand thus far. At this point I am
looking for outside investors.
15) If 25,000,000 is invested how will it break down according to the three
areas you discussed (switching to the cloud, switching from subs to
employees, expanding market)?
Most will be invested in the cloud work and expansion into Dubai. I may
need another round of investment to cover expansion into Kuwait and
Jordan.
2. Net present values and suggested investment
GenA Software
Discounted Cash Flow Analysis
Pessimistic Case
(SAR)
2020 2021 2022 2023 2024 Perpetuity
Equity Cash Flow 750,322 1,091,456 1,100,903 1,116,182 1,098,782 1,142,733
Cost of Equity 22.0% 22.0% 22.0% 22.0% 22.0% 22.0%
Cash Flow in Period 100.00%
Period to Discount 0.50 1.50 2.50 3.50 4.50
PV of Equity Cash Flow 679,309 809,966 669,653 556,513 449,047
Perpetuity Value at start of Year 2024 6,348,516
PV of Perpetuity 2,594,496
Cost of Equity 22.0%
Long term growth 4.0%
NPV = 5,758,984

BV 206: Valuing Small and Medium-Sized Companies Chapter 2 – Valuing Start-Up Companies
©2020 The Saudi Authority for Accredited Valuers (TAQEEM) 90
Suggested Investment
It is doubtful that an investment in GenA would serve our interests for the
following reasons:
• The personal relationships that have driven sales thus far would not help
in two of the three expansion markets.
• It is not clear that Mr. Alwaq’s family relationship in Dubai will lead to a
guaranteed contract.
GenA Software
Discounted Cash Flow Analysis
Base Case
(SAR)
2020 2021 2022 2023 2024 Perpetuity
Equity Cash Flow 1,071,421 1,021,362 1,440,776 1,560,007 2,025,361 2,106,376
Cost of Equity 25.0% 25.0% 25.0% 25.0% 25.0% 25.0%
Cash Flow in Period 100.00%
Period to Discount 0.50 1.50 2.50 3.50 4.50
PV of Equity Cash Flow 958,308 730,827 824,748 714,400 742,006
Perpetuity Value at start of Year 2024 10,030,362
PV of Perpetuity 3,674,697
Cost of Equity 25.0%
Long term growth 4.0%
NPV = 7,644,986
GenA Software
Discounted Cash Flow Analysis
Optimistic Case
(SAR)
2020 2021 2022 2023 2024 Perpetuity
Equity Cash Flow 1,971,421 3,476,248 8,314,306 14,356,154 21,302,498 22,154,598
Cost of Equity 40.0% 40.0% 40.0% 40.0% 40.0% 40.0%
Cash Flow in Period 100.00%
Period to Discount 0.50 1.50 2.50 3.50 4.50
PV of Equity Cash Flow 1,666,155 2,098,547 3,585,139 4,421,707 4,686,562
Perpetuity Value at start of Year 2024 61,540,550
PV of Perpetuity 13,538,957
Cost of Equity 40.0%
Long term growth 4.0%
NPV = 29,997,067

BV 206: Valuing Small and Medium-Sized Companies Chapter 2 – Valuing Start-Up Companies
©2020 The Saudi Authority for Accredited Valuers (TAQEEM) 91
• There is no evidence that the software product has a competitive
advantage over other products in the market.
• The Company’s growth to date is probably more a result of Mr. Alwaq’s
personal relationships than the product.
• Management’s amateurish projections raise suspicions about the
success of a future partnership.
Upon additional due diligence the Company may consider the following:
• For an investment of 5 million, we would require:
o A contractual return of our initial 5 million investment before other
shareholders receive returns.
o A 75% interest in the Company
o A 75% share of all profits after the return

BV 206: Valuing Small and Medium-Sized Companies Chapter 2 – Valuing Start-Up Companies
©2020 The Saudi Authority for Accredited Valuers (TAQEEM) 92
VII. APPENDIX C – Venture Capital Glossary
1. Venture Capital Terminology
A. Accredited Investor – (United State) An investor who under Federal securities
laws is allowed to invest in venture capital funds and other high risk
unregistered companies. Under U.S. law, an accredited investor must have
annual income of at least $200,000, or net worth of at least $1,000,000
(excluding equity in principal residence), or be an insider or founder in the
target company.
B. Angel investor – An individual investor who invests his or her own money into
an early-stage company. Angels can aggregate their money and act as a
group.
C. Antidilution – Occurs in a down round of financing. Provides price protection
by pricing shares of a subsequent round at a lower price per share.
D. Bridge loan – A loan intended to provide operating capital so that a company
can reach its next round of financing. Usually much smaller in magnitude
compared to the financing rounds.
E. Burn rate – The amount of money being spent by a start-up company over a
set perior of time, usually measured per month, per quarter or per year.
F. Capitalization table – A spreadsheet which reflects each investment in the
company by security and by owner. Cap tables are usually produced at the
time of financing to reflect each shareholder’s interest.
G. Carried interest – The profit of the VC firm after the fund investors are paid
their returns. This should range between 20% to 30% of committed capital.
H. Carve-out – An amount set aside for management or personnel of a company
in situations where the preferred shareholders liquidation preference will likely
surpass the value of the company, leaving nothing for employees if the carve-
out were not created.
I. Clawback – A provision in a preferred shareholder agreement by which
shareholders can get money back from the VC investor if the amount taken by
the VC is unreasonable.
J. Conversion – A provision in a preferred shareholder agreement in which
preferred stock converts to common stock upon certain defined conditions.
K. Convertible debt – A security that initially acts as a standard loan but has a
provision under which it can convert to an equity security under certain
conditions.

BV 206: Valuing Small and Medium-Sized Companies Chapter 2 – Valuing Start-Up Companies
©2020 The Saudi Authority for Accredited Valuers (TAQEEM) 93
L. Crowdfunding – The circumstances under which a group of people pool
resources to fund a company through equity, debt investment or some other
means. In the U.S., crowdfunding is used by investors who do not meet the
SEC requirements to be an accredited investor but want to invest in early-stage
companies.
M. Down round – Any round of financing that occurs with a valuation lower than
the previous round.
N. Drag-along agreement – A provision in the preferred shareholders’ agreement
by which one investor’s vote is proxied to another’s vote. Usually a minority
investor is forced to vote the same way as a control shareholder.
O. Earnout – The amount paid to the original shareholders after a merger or
acquisition once identified operating targets are met.
P. Executive summary – A short document, less than 5 pages in length, that
presents the fundamental operations and strategy of a company. Presented
during the pitch period to a VC firm by the entrepreneur.
Q. Exercise period – the amount of time an employee has to exercise his or her
stock rights or options after departing a company.
R. Fiduciary – An individual who has a legal obligation to perform in the financial
and ethical best interests of a company.
S. First right of refusal – A right that gives an investor the ability, but not the
obligation, to invest in a subsequent round of financing or acquire the company
given certain conditions.
T. Flat round – A subsequent round of financing at a valuation that is the same as
the post-money valuation of a prior round.
U. Founder – An individual who opens a new company. Also referred to in this
manual as an entrepreneur.
V. Fully diluted – A valuation calculation which captures all the exercise rights of
all security owners of a company.
W. General partner – A managing partner who controls a limited partnership
X. Holdback – An amount of the purchase price that is held by an acquiring
company and paid out only after certain representations and warranties made
by the selling shareholder are confirmed.
Y. Lead investor – A primary investor in a start-up company investment who
takes the largest stake in a round of financing

BV 206: Valuing Small and Medium-Sized Companies Chapter 2 – Valuing Start-Up Companies
©2020 The Saudi Authority for Accredited Valuers (TAQEEM) 94
Z. Letter of intent – A term sheet for an acquisition which includes the amount,
dates, and terms under which the investment will be made
AA. Limited partner – The investors in a VC fund (i.e. the accredited investors or
crowdfund investors defined above)
BB. Limited partnership – A legal partnership between limited partners and one or
more general partners in which the limited partners have limited control over an
entity. In the VC environment, investors put money into a VC Fund through a
limited partnership in which the limited parters are the investors and the general
partner is the VC firm.
CC. Liquidity event – An event which causes a company to be sold or liquidated,
examples being an initial public offering or the sale of a company to a private
equity firm.
DD. Liquidation preference – A providion in a preferred shareholder agreement
that gives the preferred shareholder the right to receive proceeds from a
liquidity event ahead of other investors.
EE. Management fee – Fees collected by and for the VC firm from the limited
partners to compensate them for managing the fund.
FF. Nondisclosure agreement – An agreement under which the signing parties
cannot discuss the negotiations or operations of the other parties
GG. Non-participating preferred – A preferred stock that does not give its owner
the right to participate in additional profits after its initial payback is returned.
HH. Option pool – Shares set aside by a company for employee stock options
II. Pari passu – The term used when all preferred stock classes have the same
liquidation rights.
JJ. Pay-to-play – When VC investors must participate in future rounds or see their
initial investment lose value.
KK. Post-money – The value of a company after an investor has invested
LL. Pre-money – The value of a company before an investor has invested
MM. Preferred stock – A security that has rights and preferences that are superior
to common stock. In some countries securities law allow for different classes of
common stock to achieve similar distinctions.
NN. Pre-seed round – The first round of financing in a start-up company

BV 206: Valuing Small and Medium-Sized Companies Chapter 2 – Valuing Start-Up Companies
©2020 The Saudi Authority for Accredited Valuers (TAQEEM) 95
OO. Private placement memorandum – (United States) A legal document that is
circulated to attract investors. The document contains the company’s detailed
business plan.
PP. Pro-rata right – The right of a shareholder to purchase shares in a future round
of financing that equals his percentage owned in the company prior to that
financing.
QQ. Reverse dilution – occurs when a departing employee returns stock to the
company that has not vested. This has the effect of raising the per share value
of existing shareholders.
RR. Right of rescission – (United States) – A put right given to shareholders who
were not supposed to buy the stock initially.
SS. Safe harbor – A way of escaping liability under the law if the party acts
according to the terms of that law
TT. Seed stage – A start-up business in its initial stage of operation.
UU. Stock option - the right to purchase shares in a company. Usually the right is
given to employees over a defined time period. Once expired, the right expires.
VV. Strike price – The price at which a stock option can be exercised
WW. Term sheet – A document which summarizes the terms under which the VC
firm will provide funding to an early-stage company
XX. Unicorn – A start-up that achieves a $1 billion valuation
YY. VC fund – The legal entities that comprise the VC firm. Each fund is a limited
partnerhip with a certain amount of money invested or waiting to be invested.
ZZ. Venture capitalist – An investor who invests in early-stage companies and
accepts a higher level of risk for a set of defined higher returns
AAA. Warrant – The right to purchase shares in a company (differs from a stock
option in that the warrant shares have not been issued by the company yet)

BV 206: Valuing Small and Medium-Sized Companies Chapter 2 – Valuing Start-Up Companies
©2020 The Saudi Authority for Accredited Valuers (TAQEEM) 96
VIII. Appendix D – Sample Term Sheet
1. TERM SHEET SAMPLE
This Term Sheet summarizes the principal terms of the Series A Preferred Stock Financing of
[___________], Inc., a [Delaware] corporation (the “Company”). In consideration of the time and expense devoted and to be devoted by the Investors with respect to this investment, the No Shop/Confidentiality [and Counsel and Expenses] provisions of this Term Sheet shall be binding obligations of the Company whether or not the financing is consummated. No other legally binding obligations will be created until definitive agreements are executed and delivered by all parties. This Term Sheet is not a commitment to invest, and is conditioned on the completion of due diligence, legal review and documentation that is satisfactory to the Investors. This Term Sheet shall be governed in all respects by the laws of [______________the ].1 Offering Terms
Closing Date: As soon as practicable following the Company’s acceptance of this Term Sheet and satisfaction of the Conditions to Closing (the “Closing”). [provide for multiple closings if applicable]
Investors: Investor No. 1: [_______] shares ([__]%), $[_________]
Investor No. 2: [_______] shares ([__]%), $[_________]
[as well other investors mutually agreed upon by Investors and the Company]
Amount Raised: $[________], [including $[________] from the conversion of principal [and interest] on bridge notes].2
Price Per Share: $[________] per share (based on the capitalization of the Company set forth below) (the “Original Purchase Price”).
1 The choice of law governing a term sheet can be important because in some jurisdictions a term sheet that expressly states that it is nonbinding may nonetheless create an enforceable obligation to negotiate the terms set forth in the term sheet in good faith. Compare SIGA Techs., Inc. v. PharmAthene, Inc., Case No. C.A. 2627 ( (Del. Supreme Court May 24, 2013) (holding that where parties agreed to negotiate in good faith in accordance with a term sheet, that obligation was enforceable notwithstanding the fact that the term sheet itself was not signed and contained a footer on each page stating “Non Binding Terms”); EQT Infrastructure Ltd. v. Smith, 861 F. Supp. 2d 220 (S.D.N.Y. 2012); Stanford Hotels Corp. v. Potomac Creek Assocs., L.P., 18 A.3d 725 (D.C. App. 2011) with Rosenfield v. United States Trust Co., 5 N.E. 323, 326 (Mass. 1935) (“An agreement to reach an agreement is a contradiction in terms and imposes no obligation on the parties thereo.”); Martin v. Martin, 326 S.W.3d 741 (Tex. App. 2010); Va. Power Energy Mktg. v. EQT Energy, LLC, 2012 WL 2905110 (E.D. Va. July 16, 2012). As such, because a “nonbinding” term sheet governed by the law of a jurisdiction such as Delaware, New York or the District of Columbia may in fact create an enforceable obligation to negotiate in good faith to come to agreement on the terms set forth in the term sheet, parties should give consideration to the choice of law selected to govern the term sheet. 2 Modify this provision to account for staged investments or investments dependent on the
achievement of milestones by the Company.

BV 206: Valuing Small and Medium-Sized Companies Chapter 2 – Valuing Start-Up Companies
©2020 The Saudi Authority for Accredited Valuers (TAQEEM) 97
Pre-Money Valuation: The Original Purchase Price is based upon a fully-diluted pre-money valuation of $[_____] and a fully-diluted post-money valuation of $[______] (including an employee pool representing [__]% of the fully-diluted post-money capitalization).
Capitalization: The Company’s capital structure before and after the Closing is set forth on Exhibit A.
CHARTER3
Dividends: [Alternative 1: Dividends will be paid on the Series A Preferred on an as-converted basis when, as, and if paid on the Common Stock]
[Alternative 2: The Series A Preferred will carry an annual [__]% cumulative dividend [payable upon a liquidation or redemption]. For any other dividends or distributions, participation with Common Stock on an as-converted basis.] 4
[Alternative 3: Non-cumulative dividends will be paid on the Series A Preferred in an amount equal to $[_____] per share of Series A Preferred when and if declared by the Board.]
Liquidation Preference:
In the event of any liquidation, dissolution or winding up of the Company, the proceeds shall be paid as follows:
[Alternative 1 (non-participating Preferred Stock): First pay [one] times the Original Purchase Price [plus accrued dividends] [plus declared and unpaid dividends] on each share of Series A Preferred (or, if greater, the amount that the Series A Preferred would receive on an as-converted basis). The balance of any proceeds shall be distributed pro rata to holders of Common Stock.]
[Alternative 2 (full participating Preferred Stock): First pay [one] times the Original Purchase Price [plus accrued dividends] [plus declared and unpaid dividends] on each share of Series A Preferred. Thereafter, the Series A Preferred participates with the Common Stock pro rata on an as-converted basis.]
[Alternative 3 (cap on Preferred Stock participation rights): First pay [one] times the Original Purchase Price [plus accrued dividends] [plus declared
3 The Charter (Certificate of Incorporation) is a public document, filed with the Secretary of State of
the state in which the company is incorporated, that establishes all of the rights, preferences, privileges and restrictions of the Preferred Stock. 4 In some cases, accrued and unpaid dividends are payable on conversion as well as upon a
liquidation event. Most typically, however, dividends are not paid if the preferred is converted. Another alternative is to give the Company the option to pay accrued and unpaid dividends in cash or in common shares valued at fair market value. The latter are referred to as “PIK” (payment-in-kind) dividends.

BV 206: Valuing Small and Medium-Sized Companies Chapter 2 – Valuing Start-Up Companies
©2020 The Saudi Authority for Accredited Valuers (TAQEEM) 98
and unpaid dividends] on each share of Series A Preferred. Thereafter, Series A Preferred participates with Common Stock pro rata on an as-converted basis until the holders of Series A Preferred receive an aggregate of [_____] times the Original Purchase Price (including the amount paid pursuant to the preceding sentence).]
A merger or consolidation (other than one in which stockholders of the Company own a majority by voting power of the outstanding shares of the surviving or acquiring corporation) and a sale, lease, transfer, exclusive license or other disposition of all or substantially all of the assets of the Company will be treated as a liquidation event (a “Deemed Liquidation Event”), thereby triggering payment of the liquidation preferences described above [unless the holders of [___]% of the Series A Preferred elect otherwise]. [The Investors' entitlement to their liquidation preference shall not be abrogated or diminished in the event part of the consideration is subject to escrow in connection with a Deemed Liquidation Event.]5
Voting Rights: The Series A Preferred shall vote together with the Common Stock on an as-converted basis, and not as a separate class, except (i) [so long as [insert fixed number, or %, or “any”] shares of Series A Preferred are outstanding,] the Series A Preferred as a class shall be entitled to elect [_______] [(_)] members of the Board (the “Series A Directors”), and (ii) as required by law. The Company’s Certificate of Incorporation will provide that the number of authorized shares of Common Stock may be increased or decreased with the approval of a majority of the Preferred and Common Stock, voting together as a single class, and without a separate class vote by the Common Stock.6
Protective Provisions: [So long as [insert fixed number, or %, or “any”] shares of Series A Preferred are outstanding,] in addition to any other vote or approval required under the Company’s Charter or Bylaws, the Company will not, without the written consent of the holders of at least [__]% of the Company’s Series A Preferred, either directly or by amendment, merger, consolidation, or otherwise:
(i) liquidate, dissolve or wind-up the affairs of the Company, or effect any merger or consolidation or any other Deemed Liquidation Event; (ii) amend, alter, or repeal any provision of the Certificate of Incorporation or Bylaws [in a manner adverse to the Series A Preferred];7 (iii) create or authorize the creation of or issue any other security convertible into or exercisable for any equity security, having rights, preferences or privileges senior to or on parity with the Series A Preferred, or increase the authorized number of shares of Series A Preferred; (iv) purchase or redeem or pay any dividend on any capital stock prior to the Series A
5 See Subsection 2.3.4 of the Model Certificate of Incorporation and the detailed explanation in
related footnote 25. 6 For corporations incorporated in California, one cannot “opt out” of the statutory requirement of a
separate class vote by Common Stockholders to authorize shares of Common Stock. The purpose of this provision is to "opt out" of DGL 242(b)(2). 7 Note that as a matter of background law, Section 242(b)(2) of the Delaware General Corporation
Law provides that if any proposed charter amendment would adversely alter the rights, preferences and powers of one series of Preferred Stock, but not similarly adversely alter the entire class of all Preferred Stock, then the holders of that series are entitled to a separate series vote on the amendment.

BV 206: Valuing Small and Medium-Sized Companies Chapter 2 – Valuing Start-Up Companies
©2020 The Saudi Authority for Accredited Valuers (TAQEEM) 99
Preferred, [other than stock repurchased from former employees or consultants in connection with the cessation of their employment/services, at the lower of fair market value or cost;] [other than as approved by the Board, including the approval of [_____] Series A Director(s)]; or (v) create or authorize the creation of any debt security [if the Company’s aggregate indebtedness would exceed $[____][other than equipment leases or bank lines of credit][unless such debt security has received the prior approval of the Board of Directors, including the approval of [________] Series A Director(s)]; (vi) create or hold capital stock in any subsidiary that is not a wholly-owned subsidiary or dispose of any subsidiary stock or all or substantially all of any subsidiary assets; [or (vii) increase or decrease the size of the Board of Directors].8
Optional Conversion: The Series A Preferred initially converts 1:1 to Common Stock at any time at option of holder, subject to adjustments for stock dividends, splits, combinations and similar events and as described below under “Anti-dilution Provisions.”
Anti-dilution Provisions: In the event that the Company issues additional securities at a purchase price less than the current Series A Preferred conversion price, such conversion price shall be adjusted in accordance with the following formula:
[Alternative 1: “Typical” weighted average:
CP2 = CP1 * (A+B) / (A+C)
CP2 = Series A Conversion Price in effect immediately after new
issue
CP1 = Series A Conversion Price in effect immediately prior to
new issue
A = Number of shares of Common Stock deemed to be
outstanding immediately prior to new issue (includes all
shares of outstanding common stock, all shares of
outstanding preferred stock on an as-converted basis, and
all outstanding options on an as-exercised basis; and does
not include any convertible securities converting into this
round of financing)9
B = Aggregate consideration received by the Corporation with respect to the new issue divided by CP1
C = Number of shares of stock issued in the subject transaction]
8 The board size provision may also be addressed in the Voting Agreement; see Section 1.1 of the Model Voting Agreement. 9 The "broadest" base would include shares reserved in the option pool.

BV 206: Valuing Small and Medium-Sized Companies Chapter 2 – Valuing Start-Up Companies
©2020 The Saudi Authority for Accredited Valuers (TAQEEM) 100
[Alternative 2: Full-ratchet – the conversion price will be reduced to the price at which the new shares are issued.]
[Alternative 3: No price-based anti-dilution protection.]
The following issuances shall not trigger anti-dilution adjustment:10
(i) securities issuable upon conversion of any of the Series A Preferred, or as a dividend or distribution on the Series A Preferred; (ii) securities issued upon the conversion of any debenture, warrant, option, or other convertible security; (iii) Common Stock issuable upon a stock split, stock dividend, or any subdivision of shares of Common Stock; and (iv) shares of Common Stock (or options to purchase such shares of Common Stock) issued or issuable to employees or directors of, or consultants to, the Company pursuant to any plan approved by the Company’s Board of Directors [including at least [_______] Series A Director(s)].
Mandatory Conversion: Each share of Series A Preferred will automatically be converted into Common Stock at the then applicable conversion rate in the event of the closing of a [firm commitment] underwritten public offering with a price of [___] times the Original Purchase Price (subject to adjustments for stock dividends, splits, combinations and similar events) and [net/gross] proceeds to the Company of not less than $[_______] (a “QPO”), or (ii) upon the written consent of the holders of [__]% of the Series A Preferred.11
[Pay-to-Play:
[Unless the holders of [__]% of the Series A elect otherwise,] on any subsequent [down] round all [Major] Investors are required to purchase their pro rata share of the securities set aside by the Board for purchase by the [Major] Investors. All shares of Series A Preferred12 of any [Major] Investor failing to do so will automatically [lose anti-dilution rights] [lose right to participate in future rounds] [convert to Common Stock and lose the right to a Board seat if applicable].]13
10 Note that additional exclusions are frequently negotiated, such as issuances in connection with
equipment leasing and commercial borrowing. See Subsections 4.4.1(d)(v)-(viii) of the Model Certificate of Incorporation for additional exclusions. 11 The per share test ensures that the investor achieves a significant return on investment before the
Company can go public. Also consider allowing a non-QPO to become a QPO if an adjustment is made to the Conversion Price for the benefit of the investor, so that the investor does not have the power to block a public offering. 12 Alternatively, this provision could apply on a proportionate basis (e.g., if Investor plays for ½ of pro
rata share, receives ½ of anti-dilution adjustment). 13 If the punishment for failure to participate is losing some but not all rights of the Preferred (e.g.,
anything other than a forced conversion to common), the Certificate of Incorporation will need to have so-called “blank check preferred” provisions at least to the extent necessary to enable the Board to issue a “shadow” class of preferred with diminished rights in the event an investor fails to participate. As a drafting matter, it is far easier to simply have (some or all of) the preferred convert to common.

BV 206: Valuing Small and Medium-Sized Companies Chapter 2 – Valuing Start-Up Companies
©2020 The Saudi Authority for Accredited Valuers (TAQEEM) 101
Redemption Rights:14 Unless prohibited by Delaware law governing distributions to stockholders, the Series A Preferred shall be redeemable at the option of holders of at least [__]% of the Series A Preferred commencing any time after [________] at a price equal to the Original Purchase Price [plus all accrued but unpaid dividends]. Redemption shall occur in three equal annual portions. Upon a redemption request from the holders of the required percentage of the Series A Preferred, all Series A Preferred shares shall be redeemed [(except for any Series A holders who affirmatively opt-out)].15
STOCK PURCHASE AGREEMENT
Representations and Warranties: Standard representations and warranties by the Company. [Representations and warranties by Founders regarding technology ownership, etc.].16 [Representations and warranties regarding CFIUS.]17
[Regulatory Covenants (CFIUS): To the extent a CFIUS filing is or may be required: Investors and the Company shall use reasonable best efforts to submit the proposed transaction to the Committee on Foreign Investment in the United States
14 Redemption rights allow Investors to force the Company to redeem their shares at cost (and
sometimes investors may also request a small guaranteed rate of return, in the form of a dividend). In practice, redemption rights are not often used; however, they do provide a form of exit and some possible leverage over the Company. While it is possible that the right to receive dividends on redemption could give rise to a Code Section 305 “deemed dividend” problem, many tax practitioners take the view that if the liquidation preference provisions in the Charter are drafted to provide that, on conversion, the holder receives the greater of its liquidation preference or its as-converted amount (as provided in the Model Certificate of Incorporation), then there is no Section 305 issue. 15 Due to statutory restrictions, the Company may not be legally permitted to redeem in the very
circumstances where investors most want it (the so-called “sideways situation”). Accordingly, and particulary in light of the Delaware Chancery Court’s ruling in Thoughtworks (see discussion in Model Charter), investors may seek enforcement provisions to give their redemption rights more teeth - e.g., the holders of a majority of the Series A Preferred shall be entitled to elect a majority of the Company’s Board of Directors, or shall have consent rights on Company cash expenditures, until such amounts are paid in full. 16 Founders’ representations are controversial and may elicit significant resistance as they are found
in a minority of venture deals. They are more likely to appear if Founders are receiving liquidity from the transaction, or if there is heightened concern over intellectual property (e.g., the Company is a spin-out from an academic institution or the Founder was formerly with another company whose business could be deemed competitive with the Company), or in international deals. Founders’ representations are even less common in subsequent rounds, where risk is viewed as significantly diminished and fairly shared by the investors, rather than being disproportionately borne by the Founders. A sample set of Founders Representations is attached as an Addendum at the end of the Model Stock Purchase Agreement. 17 To be considered in order to address issues under the Defense Production Act of 1950 and related
regulations (DPA). Relevant representations may include whether or not a Company works with “critical technologies” within the meaning of the DPA, whether a Company has operations or activities in particular sectors of the U.S. economy or in the U.S. at all, whether an Investor is foreign, and whether an Investor has foreign government relationships, among others.
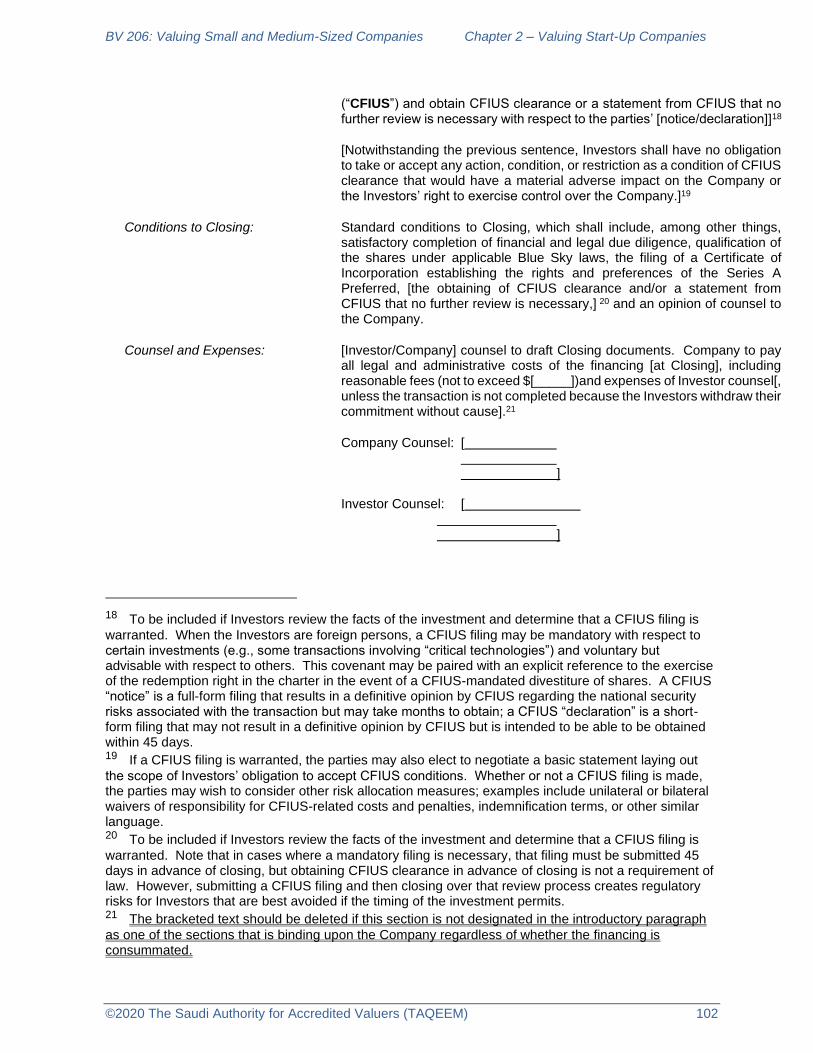
BV 206: Valuing Small and Medium-Sized Companies Chapter 2 – Valuing Start-Up Companies
©2020 The Saudi Authority for Accredited Valuers (TAQEEM) 102
(“CFIUS”) and obtain CFIUS clearance or a statement from CFIUS that no further review is necessary with respect to the parties’ [notice/declaration]]18
[Notwithstanding the previous sentence, Investors shall have no obligation to take or accept any action, condition, or restriction as a condition of CFIUS clearance that would have a material adverse impact on the Company or the Investors’ right to exercise control over the Company.]19
Conditions to Closing: Standard conditions to Closing, which shall include, among other things, satisfactory completion of financial and legal due diligence, qualification of the shares under applicable Blue Sky laws, the filing of a Certificate of Incorporation establishing the rights and preferences of the Series A Preferred, [the obtaining of CFIUS clearance and/or a statement from CFIUS that no further review is necessary,] 20 and an opinion of counsel to the Company.
Counsel and Expenses: [Investor/Company] counsel to draft Closing documents. Company to pay all legal and administrative costs of the financing [at Closing], including reasonable fees (not to exceed $[_____])and expenses of Investor counsel[, unless the transaction is not completed because the Investors withdraw their commitment without cause].21
Company Counsel: [ ] Investor Counsel: [ ]
18 To be included if Investors review the facts of the investment and determine that a CFIUS filing is
warranted. When the Investors are foreign persons, a CFIUS filing may be mandatory with respect to certain investments (e.g., some transactions involving “critical technologies”) and voluntary but advisable with respect to others. This covenant may be paired with an explicit reference to the exercise of the redemption right in the charter in the event of a CFIUS-mandated divestiture of shares. A CFIUS “notice” is a full-form filing that results in a definitive opinion by CFIUS regarding the national security risks associated with the transaction but may take months to obtain; a CFIUS “declaration” is a short-form filing that may not result in a definitive opinion by CFIUS but is intended to be able to be obtained within 45 days. 19 If a CFIUS filing is warranted, the parties may also elect to negotiate a basic statement laying out
the scope of Investors’ obligation to accept CFIUS conditions. Whether or not a CFIUS filing is made, the parties may wish to consider other risk allocation measures; examples include unilateral or bilateral waivers of responsibility for CFIUS-related costs and penalties, indemnification terms, or other similar language. 20 To be included if Investors review the facts of the investment and determine that a CFIUS filing is
warranted. Note that in cases where a mandatory filing is necessary, that filing must be submitted 45 days in advance of closing, but obtaining CFIUS clearance in advance of closing is not a requirement of law. However, submitting a CFIUS filing and then closing over that review process creates regulatory risks for Investors that are best avoided if the timing of the investment permits. 21 The bracketed text should be deleted if this section is not designated in the introductory paragraph
as one of the sections that is binding upon the Company regardless of whether the financing is consummated.

BV 206: Valuing Small and Medium-Sized Companies Chapter 2 – Valuing Start-Up Companies
©2020 The Saudi Authority for Accredited Valuers (TAQEEM) 103
INVESTORS’ RIGHTS AGREEMENT
Registration Rights:
Registrable Securities: All shares of Common Stock issuable upon conversion of the Series A Preferred [and [any other Common Stock held by the Investors] will be deemed “Registrable Securities.”22
Demand Registration: Upon earliest of (i) [three-five] years after the Closing; or (ii) [six] months23 following an initial public offering (“IPO”), persons holding [__]% of the Registrable Securities may request [one][two] (consummated) registrations by the Company of their shares. The aggregate offering price for such registration may not be less than $[5-15] million. A registration will count for this purpose only if (i) all Registrable Securities requested to be registered are registered, and (ii) it is closed, or withdrawn at the request of the Investors (other than as a result of a material adverse change to the Company).
Registration on Form S-3: The holders of [10-30]% of the Registrable Securities will have the right to require the Company to register on Form S-3, if available for use by the Company, Registrable Securities for an aggregate offering price of at least $[1-5 million]. There will be no limit on the aggregate number of such Form S-3 registrations, provided that there are no more than [two] per year.
Piggyback Registration: The holders of Registrable Securities will be entitled to “piggyback” registration rights on all registration statements of the Company, subject to the right, however, of the Company and its underwriters to reduce the number of shares proposed to be registered to a minimum of [20-30]% on a pro rata basis and to complete reduction on an IPO at the underwriter’s discretion. In all events, the shares to be registered by holders of Registrable Securities will be reduced only after all other stockholders’ shares are reduced.
Expenses: The registration expenses (exclusive of stock transfer taxes, underwriting discounts and commissions will be borne by the Company. The Company will also pay the reasonable fees and expenses[, not to exceed $______,] of one special counsel to represent all the participating stockholders.
Lock-up: Investors shall agree in connection with the IPO, if requested by the managing underwriter, not to sell or transfer any shares of Common Stock of the Company [(including/excluding shares acquired in or following the IPO)] for a period of up to 180 days [plus up to an additional 18 days to the extent necessary to comply with applicable regulatory requirements]24
22 Note that Founders/management sometimes also seek limited registration rights. 23 The Company will want the percentage to be high enough so that a significant portion of the
investor base is behind the demand. Companies will typically resist allowing a single investor to cause a registration. Experienced investors will want to ensure that less experienced investors do not have the right to cause a demand registration. In some cases, different series of Preferred Stock may request the right for that series to initiate a certain number of demand registrations. Companies will typically resist this due to the cost and diversion of management resources when multiple constituencies have this right. 24 See commentary in footnotes 23 and 24 of the Model Investors’ Rights Agreement regarding
possible extensions of lock-up period.

BV 206: Valuing Small and Medium-Sized Companies Chapter 2 – Valuing Start-Up Companies
©2020 The Saudi Authority for Accredited Valuers (TAQEEM) 104
following the IPO (provided all directors and officers of the Company [and [1 – 5]% stockholders] agree to the same lock-up). [Such lock-up agreement shall provide that any discretionary waiver or termination of the restrictions of such agreements by the Company or representatives of the underwriters shall apply to Investors, pro rata, based on the number of shares held.
Termination: Upon a Deemed Liquidation Event, [and/or] when all shares of an Investor are eligible to be sold without restriction under Rule 144 [and/or] the [____] anniversary of the IPO.
No future registration rights may be granted without consent of the holders of a [majority] of the Registrable Securities unless subordinate to the Investor’s rights.
Management and Information Rights:
A Management Rights letter from the Company, in a form reasonably acceptable to the Investors, will be delivered prior to Closing to each Investor that requests one.25
Any [Major] Investor [(who is not a competitor)] will be granted access to Company facilities and personnel during normal business hours and with reasonable advance notification. The Company will deliver to such Major Investor (i) annual, quarterly, [and monthly] financial statements, and other information as determined by the Board; (ii) thirty days prior to the end of each fiscal year, a comprehensive operating budget forecasting the Company’s revenues, expenses, and cash position on a month-to-month basis for the upcoming fiscal year[; and (iii) promptly following the end of each quarter an up-to-date capitalization table. A “Major Investor” means any Investor who purchases at least $[______] of Series A Preferred.
Right to Participate Pro Rata in Future Rounds:
All [Major] Investors shall have a pro rata right, based on their percentage equity ownership in the Company (assuming the conversion of all outstanding Preferred Stock into Common Stock and the exercise of all options outstanding under the Company’s stock plans), to participate in subsequent issuances of equity securities of the Company (excluding those issuances listed at the end of the “Anti-dilution Provisions” section of this Term Sheet. In addition, should any [Major] Investor choose not to purchase its full pro rata share, the remaining [Major] Investors shall have the right to purchase the remaining pro rata shares.
Matters Requiring Investor Director Approval:
[So long as the holders of Series A Preferred are entitled to elect a Series A Director, the Company will not, without Board approval, which approval must include the affirmative vote of [one/both] of the Series A Director(s):
(i) make any loan or advance to, or own any stock or other securities of, any subsidiary or other corporation, partnership, or other entity unless it is wholly owned by the Company; (ii) make any loan or advance to any person, including, any employee or director, except advances and similar expenditures in the ordinary course of business or under the terms of a employee stock or option plan approved by the Board of Directors; (iii) guarantee, any indebtedness except for trade accounts of
25 See commentary in introduction to Model Managements Rights Letter, explaining purpose of such
letter.
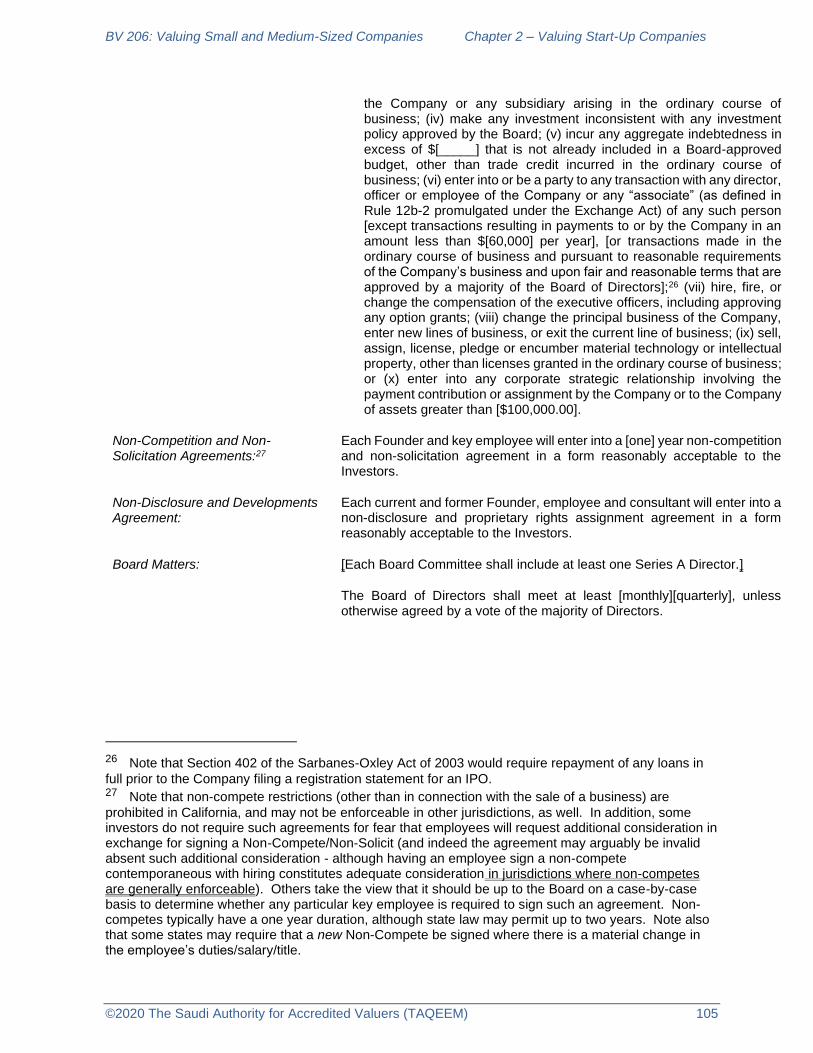
BV 206: Valuing Small and Medium-Sized Companies Chapter 2 – Valuing Start-Up Companies
©2020 The Saudi Authority for Accredited Valuers (TAQEEM) 105
the Company or any subsidiary arising in the ordinary course of business; (iv) make any investment inconsistent with any investment policy approved by the Board; (v) incur any aggregate indebtedness in excess of $[_____] that is not already included in a Board-approved budget, other than trade credit incurred in the ordinary course of business; (vi) enter into or be a party to any transaction with any director, officer or employee of the Company or any “associate” (as defined in Rule 12b-2 promulgated under the Exchange Act) of any such person [except transactions resulting in payments to or by the Company in an amount less than $[60,000] per year], [or transactions made in the ordinary course of business and pursuant to reasonable requirements of the Company’s business and upon fair and reasonable terms that are approved by a majority of the Board of Directors];26 (vii) hire, fire, or change the compensation of the executive officers, including approving any option grants; (viii) change the principal business of the Company, enter new lines of business, or exit the current line of business; (ix) sell, assign, license, pledge or encumber material technology or intellectual property, other than licenses granted in the ordinary course of business; or (x) enter into any corporate strategic relationship involving the payment contribution or assignment by the Company or to the Company of assets greater than [$100,000.00].
Non-Competition and Non-Solicitation Agreements:27
Each Founder and key employee will enter into a [one] year non-competition and non-solicitation agreement in a form reasonably acceptable to the Investors.
Non-Disclosure and Developments Agreement:
Each current and former Founder, employee and consultant will enter into a non-disclosure and proprietary rights assignment agreement in a form reasonably acceptable to the Investors.
Board Matters: [Each Board Committee shall include at least one Series A Director.]
The Board of Directors shall meet at least [monthly][quarterly], unless otherwise agreed by a vote of the majority of Directors.
26 Note that Section 402 of the Sarbanes-Oxley Act of 2003 would require repayment of any loans in
full prior to the Company filing a registration statement for an IPO. 27 Note that non-compete restrictions (other than in connection with the sale of a business) are
prohibited in California, and may not be enforceable in other jurisdictions, as well. In addition, some investors do not require such agreements for fear that employees will request additional consideration in exchange for signing a Non-Compete/Non-Solicit (and indeed the agreement may arguably be invalid absent such additional consideration - although having an employee sign a non-compete contemporaneous with hiring constitutes adequate consideration in jurisdictions where non-competes are generally enforceable). Others take the view that it should be up to the Board on a case-by-case basis to determine whether any particular key employee is required to sign such an agreement. Non-competes typically have a one year duration, although state law may permit up to two years. Note also that some states may require that a new Non-Compete be signed where there is a material change in the employee’s duties/salary/title.
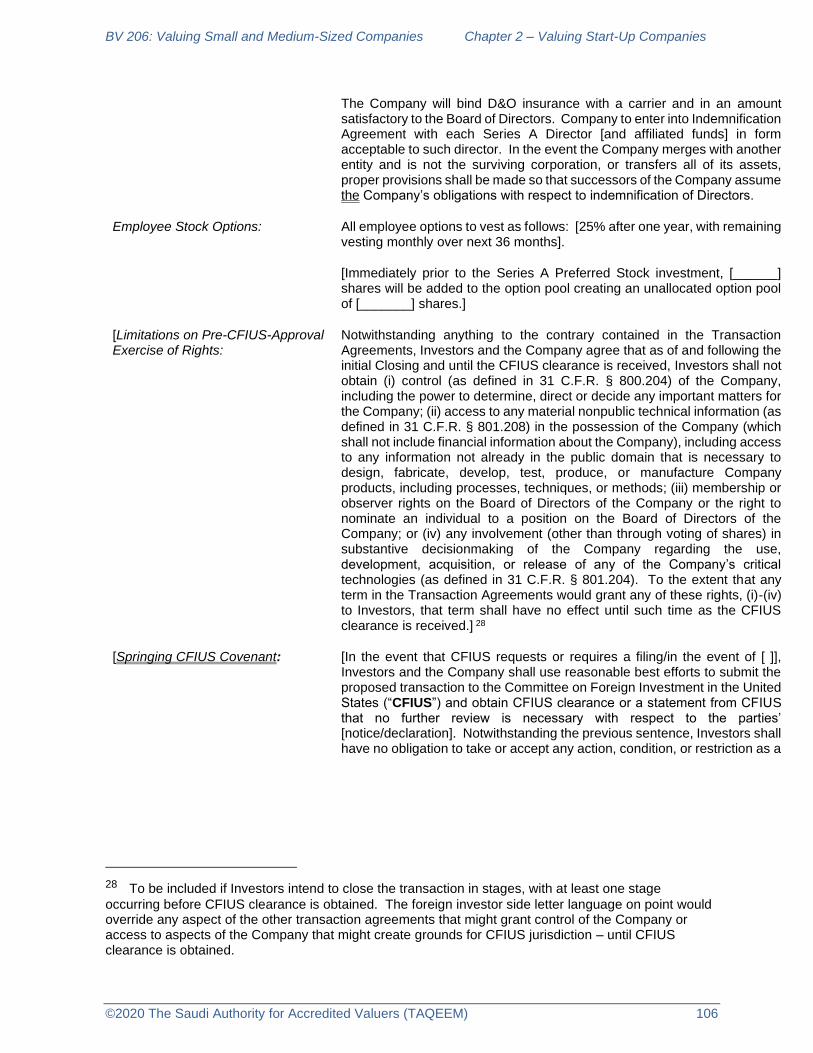
BV 206: Valuing Small and Medium-Sized Companies Chapter 2 – Valuing Start-Up Companies
©2020 The Saudi Authority for Accredited Valuers (TAQEEM) 106
The Company will bind D&O insurance with a carrier and in an amount satisfactory to the Board of Directors. Company to enter into Indemnification Agreement with each Series A Director [and affiliated funds] in form acceptable to such director. In the event the Company merges with another entity and is not the surviving corporation, or transfers all of its assets, proper provisions shall be made so that successors of the Company assume the Company’s obligations with respect to indemnification of Directors.
Employee Stock Options: All employee options to vest as follows: [25% after one year, with remaining vesting monthly over next 36 months].
[Immediately prior to the Series A Preferred Stock investment, [______] shares will be added to the option pool creating an unallocated option pool of [_______] shares.]
[Limitations on Pre-CFIUS-Approval Exercise of Rights:
Notwithstanding anything to the contrary contained in the Transaction Agreements, Investors and the Company agree that as of and following the initial Closing and until the CFIUS clearance is received, Investors shall not obtain (i) control (as defined in 31 C.F.R. § 800.204) of the Company, including the power to determine, direct or decide any important matters for the Company; (ii) access to any material nonpublic technical information (as defined in 31 C.F.R. § 801.208) in the possession of the Company (which shall not include financial information about the Company), including access to any information not already in the public domain that is necessary to design, fabricate, develop, test, produce, or manufacture Company products, including processes, techniques, or methods; (iii) membership or observer rights on the Board of Directors of the Company or the right to nominate an individual to a position on the Board of Directors of the Company; or (iv) any involvement (other than through voting of shares) in substantive decisionmaking of the Company regarding the use, development, acquisition, or release of any of the Company’s critical technologies (as defined in 31 C.F.R. § 801.204). To the extent that any term in the Transaction Agreements would grant any of these rights, (i)-(iv) to Investors, that term shall have no effect until such time as the CFIUS clearance is received.] 28
[Springing CFIUS Covenant: [In the event that CFIUS requests or requires a filing/in the event of [ ]], Investors and the Company shall use reasonable best efforts to submit the proposed transaction to the Committee on Foreign Investment in the United States (“CFIUS”) and obtain CFIUS clearance or a statement from CFIUS that no further review is necessary with respect to the parties’ [notice/declaration]. Notwithstanding the previous sentence, Investors shall have no obligation to take or accept any action, condition, or restriction as a
28 To be included if Investors intend to close the transaction in stages, with at least one stage
occurring before CFIUS clearance is obtained. The foreign investor side letter language on point would override any aspect of the other transaction agreements that might grant control of the Company or access to aspects of the Company that might create grounds for CFIUS jurisdiction – until CFIUS clearance is obtained.
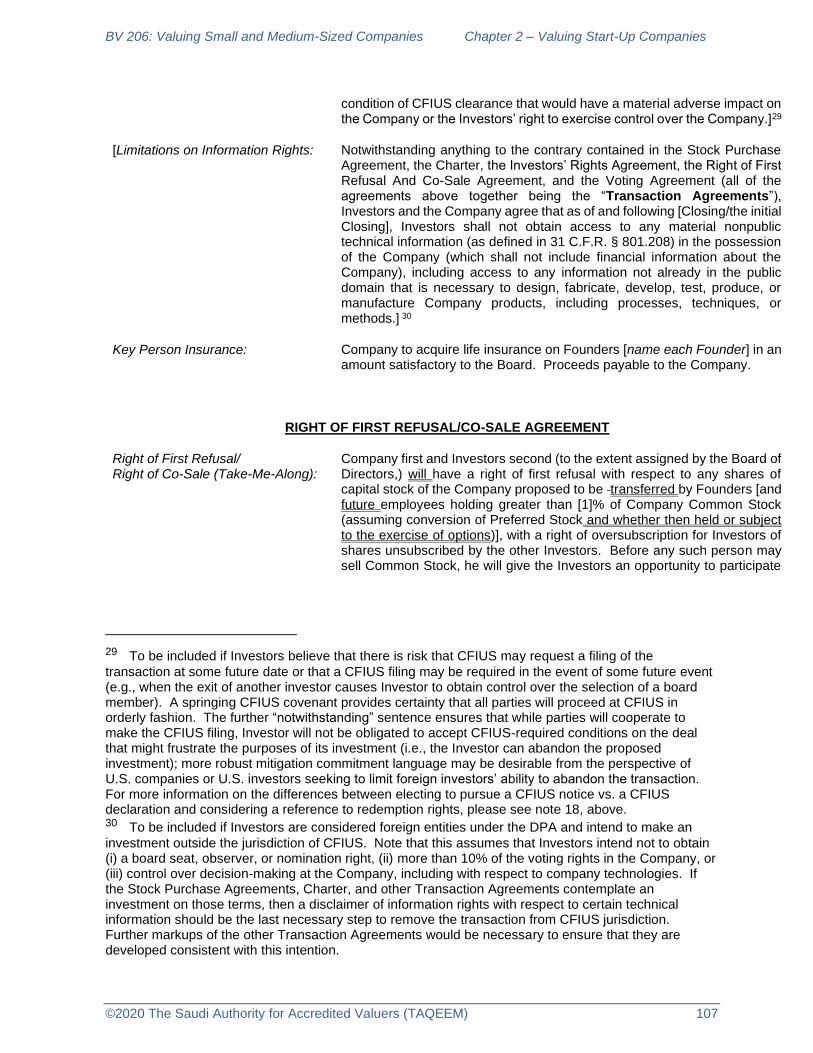
BV 206: Valuing Small and Medium-Sized Companies Chapter 2 – Valuing Start-Up Companies
©2020 The Saudi Authority for Accredited Valuers (TAQEEM) 107
condition of CFIUS clearance that would have a material adverse impact on the Company or the Investors’ right to exercise control over the Company.]29
[Limitations on Information Rights: Notwithstanding anything to the contrary contained in the Stock Purchase Agreement, the Charter, the Investors’ Rights Agreement, the Right of First Refusal And Co-Sale Agreement, and the Voting Agreement (all of the agreements above together being the “Transaction Agreements”), Investors and the Company agree that as of and following [Closing/the initial Closing], Investors shall not obtain access to any material nonpublic technical information (as defined in 31 C.F.R. § 801.208) in the possession of the Company (which shall not include financial information about the Company), including access to any information not already in the public domain that is necessary to design, fabricate, develop, test, produce, or manufacture Company products, including processes, techniques, or methods.] 30
Key Person Insurance: Company to acquire life insurance on Founders [name each Founder] in an amount satisfactory to the Board. Proceeds payable to the Company.
RIGHT OF FIRST REFUSAL/CO-SALE AGREEMENT
Right of First Refusal/ Right of Co-Sale (Take-Me-Along):
Company first and Investors second (to the extent assigned by the Board of Directors,) will have a right of first refusal with respect to any shares of capital stock of the Company proposed to be transferred by Founders [and future employees holding greater than [1]% of Company Common Stock (assuming conversion of Preferred Stock and whether then held or subject to the exercise of options)], with a right of oversubscription for Investors of shares unsubscribed by the other Investors. Before any such person may sell Common Stock, he will give the Investors an opportunity to participate
29 To be included if Investors believe that there is risk that CFIUS may request a filing of the
transaction at some future date or that a CFIUS filing may be required in the event of some future event (e.g., when the exit of another investor causes Investor to obtain control over the selection of a board member). A springing CFIUS covenant provides certainty that all parties will proceed at CFIUS in orderly fashion. The further “notwithstanding” sentence ensures that while parties will cooperate to make the CFIUS filing, Investor will not be obligated to accept CFIUS-required conditions on the deal that might frustrate the purposes of its investment (i.e., the Investor can abandon the proposed investment); more robust mitigation commitment language may be desirable from the perspective of U.S. companies or U.S. investors seeking to limit foreign investors’ ability to abandon the transaction. For more information on the differences between electing to pursue a CFIUS notice vs. a CFIUS declaration and considering a reference to redemption rights, please see note 18, above. 30 To be included if Investors are considered foreign entities under the DPA and intend to make an
investment outside the jurisdiction of CFIUS. Note that this assumes that Investors intend not to obtain (i) a board seat, observer, or nomination right, (ii) more than 10% of the voting rights in the Company, or (iii) control over decision-making at the Company, including with respect to company technologies. If the Stock Purchase Agreements, Charter, and other Transaction Agreements contemplate an investment on those terms, then a disclaimer of information rights with respect to certain technical information should be the last necessary step to remove the transaction from CFIUS jurisdiction. Further markups of the other Transaction Agreements would be necessary to ensure that they are developed consistent with this intention.

BV 206: Valuing Small and Medium-Sized Companies Chapter 2 – Valuing Start-Up Companies
©2020 The Saudi Authority for Accredited Valuers (TAQEEM) 108
in such sale on a basis proportionate to the amount of securities held by the seller and those held by the participating Investors.31
VOTING AGREEMENT
Board of Directors: At the initial Closing, the Board shall consist of [______] members comprised of (i) [name] as [the representative designated by [____], as the lead Investor, (ii) [name] as the representative designated by the remaining Investors, (iii) [name] as the representative designated by the Founders, (iv) the person then serving as the Chief Executive Officer of the Company, and (v) [___] person(s) who are not employed by the Company and who are mutually acceptable [to the Founders and Investors][to the other directors].
[Drag Along: Holders of Preferred Stock and the Founders [and all future holders of greater than [1]% of Common Stock (assuming conversion of Preferred Stock and whether then held or subject to the exercise of options)] shall be required to enter into an agreement with the Investors that provides that such stockholders will vote their shares in favor of a Deemed Liquidation Event or transaction in which 50% or more of the voting power of the Company is transferred and which is approved by [the Board of Directors] [and the holders of ____% of the outstanding shares of Preferred Stock, on an as-converted basis (the “Electing Holders”)], so long as the liability of each stockholder in such transaction is several (and not joint) and does not exceed the stockholder's pro rata portion of any claim and the consideration to be paid to the stockholders in such transaction will be allocated as if the consideration were the proceeds to be distributed to the Company's stockholders in a liquidation under the Company's then-current Certificate of Incorporation.]32
[Sale Rights: Upon written notice to the Company from the Electing Holders, the Company shall initiate a process intended to result in a sale of the Company.]33
OTHER MATTERS
Founders’ Stock:
All Founders to own stock outright subject to Company right to buyback at cost. Buyback right for [__]% for first [12 months] after Closing; thereafter, right lapses in equal [monthly] increments over following [__] months.
[Existing Preferred Stock:34 The terms set forth above for the Series [_] Preferred Stock are subject to a review of the rights, preferences and restrictions for the existing Preferred Stock. Any changes necessary to conform the existing Preferred Stock to this term sheet will be made at the Closing.]
No Shop/Confidentiality: The Company agrees to work in good faith expeditiously towards a closing.
31 Certain exceptions are typically negotiated, e.g., estate planning or de minimis transfers. Investors
may also seek ROFR rights with respect to transfers by investors, in order to be able to have some control over the composition of the investor group. 32 See Subsection 3.3 of the Model Voting Agreement for a more detailed list o f conditions that must
be satisfied in order for the drag-along to be invoked. 33 See Addendum to Model Voting Agreement 34 Necessary only if this is a later round of financing, and not the initial Series A round.

BV 206: Valuing Small and Medium-Sized Companies Chapter 2 – Valuing Start-Up Companies
©2020 The Saudi Authority for Accredited Valuers (TAQEEM) 109
The Company and the Founders agree that they will not, for a period of
[______] weeks from the date these terms are accepted, take any action to
solicit, initiate, encourage or assist the submission of any proposal,
negotiation or offer from any person or entity other than the Investors
relating to the sale or issuance, of any of the capital stock of the Company
[or the acquisition, sale, lease, license or other disposition of the Company
or any material part of the stock or assets of the Company] and shall notify
the Investors promptly of any inquiries by any third parties in regards to the
foregoing. [In the event that the Company breaches this no-shop obligation
and, prior to [________], closes any of the above-referenced transactions
[without providing the Investors the opportunity to invest on the same terms
as the other parties to such transaction], then the Company shall pay to the
Investors $[_______] upon the closing of any such transaction as liquidated
damages.]35 The Company will not disclose the terms of this Term Sheet
to any person other than officers, members of the Board of Directors and
the Company’s accountants and attorneys and other potential Investors
acceptable to [_________], as lead Investor, without the written consent of
the Investors.
Expiration: This Term Sheet expires on [_______ __, 20__] if not accepted by the Company by that date.
EXECUTED THIS [__] DAY OF [_________],20[___]. [SIGNATURE BLOCKS]
35 It is unusual to provide for such “break-up” fees in connection with a venture capital financing, but
might be something to consider where there is a substantial possibility the Company may be sold prior to consummation of the financing (e.g., a later stage deal).
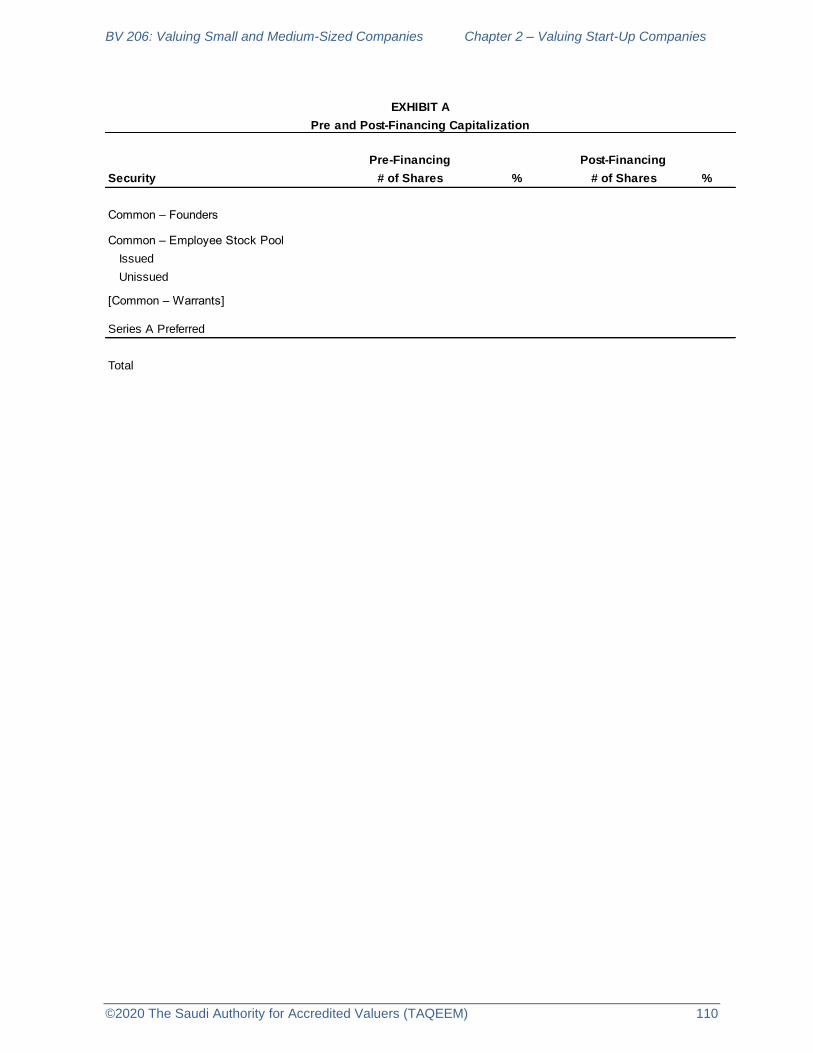
BV 206: Valuing Small and Medium-Sized Companies Chapter 2 – Valuing Start-Up Companies
©2020 The Saudi Authority for Accredited Valuers (TAQEEM) 110
Pre-Financing Post-Financing
Security # of Shares % # of Shares %
Common – Founders
Common – Employee Stock Pool
Issued
Unissued
[Common – Warrants]
Series A Preferred
Total
EXHIBIT A
Pre and Post-Financing Capitalization
BV 206: Valuing Small and Medium-Sized Companies Chapter 3 – Managing Growth in an SME
©2020 The Saudi Authority for Accredited Valuers (TAQEEM) 111
Chapter 3. Managing Growth in an SME
I. Growth in the Strategic Plan
1. Introduction
A. This chapter focuses on SME growth in the following contexts:
1) Recognizing the factors in the SME’s environment that will allow growth
2) Recognizing the factors in the SME that will allow growth
3) Projecting future operations based on observations
4) How to forecast an income statement and balance sheet
5) Case study – information technology
B. In this context, the valuer may be analyzing growth prospects as part of a
valuation but also may be advising management on how to expand. The first
questions to ask is:
1) What is the company in business to do?
(a) Though the answer may seem obvious to management, their
response is rarely accurate from a strategic viewpoint. Usually,
they will answer “We sell food”, or “We sell audit and control
services” or “We fix broken pipes”, etc.
(b) Although these answers aren’t incorrect, they say nothing about
the company’s strategy. The valuer’s response should be “so do
a thousand other companies. What is it that you do differently
from them?”
(c) Picture yourself as the head of Apple’s iphone division and a
valuation consultant asks you the above question. What is the
appropriate strategic response?
“We bring the best user experience to our customers
through our innovative hardware, software and services.”
….or
“We sell dopamine rushes”
The first response may be acceptable in the corporate
sense and is Apple’s actual mission statement (though it
says little about Apple’s mission relative to that of
BV 206: Valuing Small and Medium-Sized Companies Chapter 3 - Managing Growth in an SME
©2020 The Saudi Authority for Accredited Valuers (TAQEEM) 112
Samsung). The second response, though cynical,
certainly plays a large role in why over 5 billion people on
earth have cell phones.
The valuer can learn a great deal about the subject
company’s CEO – and by default the company’s future
prospects - by how he or she answers this question.
2) What kind of growth is planned?
(a) Sales growth – the majority of business owners think of growth
as higher sales. A plan on growing sales by itself indicates
neither a strategic plan nor insurance of an increase in value.
(b) Profit growth – focus on growing profits along with sales; this is
usually assumed by management when sales growth is planned.
(c) Value growth – companies can become more valuable by
increasing sales and profits, but also by decreasing risk.
Assessment of risk and how it affects value is an integral
part of the strategic plan.
(d) There is only one meaningful plan for growth – a plan to increase
value. For the SME this must be analyzed by the valuer in the
context of a cogent strategic plan.
2. Analyzing the Strategic Plan
A. A strategic plan will have the following components. Growth in sales and
profitability, or a decrease in risk, must be supported with analyses in each of
the following area:
1) Documentation
(a) The strategic plan is a comprehensive vision for the long-term
future of the company. By definition, it details when, where, how
and why the company will grow.
(b) The plan documents how the strategy filters down through the
organization into managerial line responsibilities.
(c) The strategy must be communicated throughout the staff to
ensure that all employees are committed to the plan within the
context of their responsibilities.
2) Competitive strategies
BV 206: Valuing Small and Medium-Sized Companies Chapter 3 - Managing Growth in an SME
©2020 The Saudi Authority for Accredited Valuers (TAQEEM) 113
(a) Price leader – Is the company competing on the basis of low
price?
(b) Product differentiation – Is the company competing on the basis
of product distinction?
(c) Focus – Is the company centered on one niche or segment of
the industry?
Most SMEs choose a focus strategy since they are
limited geographically.
Within their segment the company might be a price
leader or a product differentiator.
3) Resources to support growth
(a) Financial capital
Access to bank financing
Cost of debt
Borrowing capacity
Debt ratio and capital structure analyses
(b) Physical capital
Production (Property, plant & equipment)
Correlate plant capacity to unit production growth
Assess when plant investment will be needed
Physical capital tied to investment (will future
investment be paid with equity or debt financing?)
Technology
What technology will be needed?
When and how will it be purchased?
Working capital
How much working capital will be needed to
support sales growth?
How much cash will be needed weekly?

BV 206: Valuing Small and Medium-Sized Companies Chapter 3 - Managing Growth in an SME
©2020 The Saudi Authority for Accredited Valuers (TAQEEM) 114
Financial ratio analysis (inventory turnover,
receivable turnover, payable turnover)
(c) Human resources
Executive team – assess management’s expertise and
ability to deploy strategy.
Educational background
Experience in field, record of success
Which executives/managers will carry out each
part of the strategy?
Compare staffing levels to norms in industry
Which staff levels will be needed for each level of
growth?
Training program and budget
Compensation and benefit package – competitive?
Staff analysis
Turnover – what is the annual staff turnover?
Sick days – what is the average sick days per
employee?
How does the compensation and benefit package
compare to industry norms?
Does the company have a mechanism for
measuring staff productivity?
Does the company have a written personnel
handbook?
(d) Organizational support
Does the company have the professional managerial
processes in place, or a plan to put one in place?
Supplier network
◼ Do the current suppliers have the capacity
to provide raw materials in the future? If

BV 206: Valuing Small and Medium-Sized Companies Chapter 3 - Managing Growth in an SME
©2020 The Saudi Authority for Accredited Valuers (TAQEEM) 115
not, what is the plan for additional
suppliers?
Distribution network
◼ How does the company access the
market? As the company expands, how
will this network grow?
Customer list and feedback loop
◼ Does management have a customer list?
How often is it updated?
◼ How are new customers attained?
◼ What is the average life and range of lives
of the customers? Are there barriers to
leaving the company?
◼ Does the company communicate with its
customers? Do they issue customer
satisfaction surveys? How are those
surveys used to affect change in the
company?
◼ Customer list analysis and valuation was
covered in BV 201 and 204.
(e) Competitive Analysis
Analysis of competition includes the following questions:
How large is the market?
How is the market segmented?
Who are the major market players?
Do any customers compete with the subject?
What competitive advantages do the competitors
have over the subject and vice versa?
On what basis does each competitor compete?
On price? Product quality? Service? How do the
answers to these questions fit with the company’s
strategy?

BV 206: Valuing Small and Medium-Sized Companies Chapter 3 - Managing Growth in an SME
©2020 The Saudi Authority for Accredited Valuers (TAQEEM) 116
◼ Does management claim that it competes
on product quality but then say that
competitors beat them with lower prices?
(f) Value drivers and competitive advantages
Value drivers are the characteristics of the SME that will
enable it to grow. The value driver, or competitive
advantage, is distinctive to the subject business and
cannot be easily copied by competitors.
CEO’s customer relationships (many SMEs rely
on these personal relationships for the initial
growth curve.)
Unique software (e.g. United Postal Service
(UPS) in the United States has logistics software
that make the U.S. postal service – which does
not have similar technology - less relevant).
With many SMEs it is location – the physical
presence of the business gives it an advantage
(assuming competition, for some reason, cannot
move in next door).
If the SME has no value drivers or advantages (i.e. it is
just another grocery store or just another furniture store
existing in a crowded field of competitors) why will it
grow?
Consider the retail industry in the U.S. over the last 100
years:
Sears Roebuck & Co. – formed in 1893 this
company dominated retail in the U.S. for decades
through innovation and achievement of scale. It
was the first store to inventory most consumer
products in one location. They marketed through
a mailed catalogue, and brought retail outlets to
most locations. Prices were lower than other
retail chains.
Walmart – formed in 1962, it copied Sears model
in terms of outlets and geographic location, but
developed a logistics system that allowed much
lower prices. Sears faded; Walmart grew.

BV 206: Valuing Small and Medium-Sized Companies Chapter 3 - Managing Growth in an SME
©2020 The Saudi Authority for Accredited Valuers (TAQEEM) 117
Amazon – formed in 1994, it developed a logistics
and distribution IT system that allowed customers
to not only shop from home but receive their
product within 24 hours. Walmart is fading
(though still a major force in American retail),
Amazon is growing. It is estimated that 80% of
U.S. households use Amazon Prime.
In 101 years, the market leadership turned twice
on new competitive advantages that the existing
market leader either didn’t recognize, or
recognized too late.
No competitive advantage is permanently sustainable.
Each has a lifespan that should be estimated.
The average lifespan of a Fortune 500 public
company is 18 years, down from 60 years in 1950
(including bankruptcies, mergers, etc.)
Technology is shortening these lifespans.
The average lifespan of a tech start-up is less
than one year (high failure rate).
Among private companies in the U.S.,
approximately 50% will cease operations within
five years after inception.
After twenty years, only 1 out of 5 start-up
companies will still be in business.
0.0%
10.0%
20.0%
30.0%
40.0%
50.0%
60.0%
70.0%
80.0%
90.0%
100.0%
0 1 2 3 4 5 6 7 8 9 10 11 12 13 14 15 16 17 18 19 20
Business Survival Rate for New Companies, Years
Source: U.S. Bureau of Labor Statistics

BV 206: Valuing Small and Medium-Sized Companies Chapter 3 - Managing Growth in an SME
©2020 The Saudi Authority for Accredited Valuers (TAQEEM) 118
The client company may already be beyond this point.
Many family-owned companies endure generations of
ownership. The difficult task is to identify the value
drivers that will allow expansion.
Analyze the competitive advantage
How does it contribute to value? Does it ensure
higher sales? Lower expenses?
Is the advantage rare? An example is a
government-guaranteed monopoly (Aramco does
not have to worry about BP coming to KSA). UPS
has proprietary software (though other firms have
developed similar software). A life sciences firm
owns a patent on its new drug, which provides
exclusive sales for a legally mandated period of
time, etc.
Can the advantage be imitated? If it can, then it’s
not as valuable.
◼ Companies that imitate an advantage are
usually not as successful. There is no
substitute for innovation.
Is the company structured in a way to capitalize
on the advantage?
◼ If the life sciences firm doesn’t bring
lawsuits against companies that infringe
on its patent, then the patent is worthless.
(g) Diversification plans
There are three ways to grow:
Market penetration – an organic growth in sales
based on existing product line and capabilities.
The company takes market share from
competitors.
Market expansion – growing sales because the
market is expanding and all industry participants
are benefiting.
BV 206: Valuing Small and Medium-Sized Companies Chapter 3 - Managing Growth in an SME
©2020 The Saudi Authority for Accredited Valuers (TAQEEM) 119
Acquisition – Grow by acquiring other companies.
Diversification is most easily achieved by
acquisition.
Most SMEs do not grow through diversification.
However, at some point their market will become mature
making future growth difficult without diversification.
Type of diversification
Product diversification
Geographic diversification.
B. The valuer must analyze the company’s strategic plan by asking the
appropriate questions in each of the above areas. If there is no plan and no
specific responses to these questions, then it is quite possible that the subject
company will fall into the 80% of start-up enterprises that do not live to see their
5th birthday.
II. Mechanics of the Growth Forecast
1. Introduction
A. Projected financial information (PFI) for the SME is based on the company’s
strategic plan, as described above. The more specific and valid the plan is, the
easier it is to prepare the PFI. This section describes the mechanics of
completing a forecast of sales, profits, and investment required to achieve
sales. There are eight steps in the PFI process:
1) Project sales for each business line.
2) Project cost of sales and selling, general, and administrative expenses
(SGA).
3) Project the assets needed to support the projected sales capacity.
4) Project the financing needed to achieve the asset growth.
5) Determine the cost of financing for each year (interest expense).
6) Calculate the cash flows, given the future net profits and balance
sheets.
7) Calculate the future financial ratios based on the PFI.
8) Compare projected financial ratios to past financial ratios to ensure that
changing ratios are warranted.

BV 206: Valuing Small and Medium-Sized Companies Chapter 3 - Managing Growth in an SME
©2020 The Saudi Authority for Accredited Valuers (TAQEEM) 120
2. Steps in creating PFI
A. Sales Projection
1) Factors affecting sales
(a) Distinguish nominal growth from real growth
Nominal growth is the total growth, including inflationary
growth
Real growth excludes inflation.
(b) Market penetration – the valuer researches the competition and
the subject company’s ability to take market share away from
competing companies.
(c) Market expansion – the valuer researches the size of the market
and demand factors in the market that will cause it to expand as
well as the subject company’s ability to participate in that growth.
(d) Price increases
Inflation (both macroeconomic and industry)
Industry life cycle (infancy, growth, mature) – prices are
more volatile during infancy and growth. As the industry
stabilizes price increases become more difficult to
achieve.
Excess capacity – especially in capital intensive
industries, the valuer should research capacity rates. If
there is excess capacity there will be little potential for
raising prices.
Number of competitors and basis for competing – as per
the Porter Five Forces Analysis, the number of
competitors and ease of switching will affect the
company’s ability to increase prices.
(e) Unit growth – Sales can be measured in the change in the units
sold year to year.
Capital intensive companies - Manufactured units of
goods
Service companies – Assignments completed or billable
hours
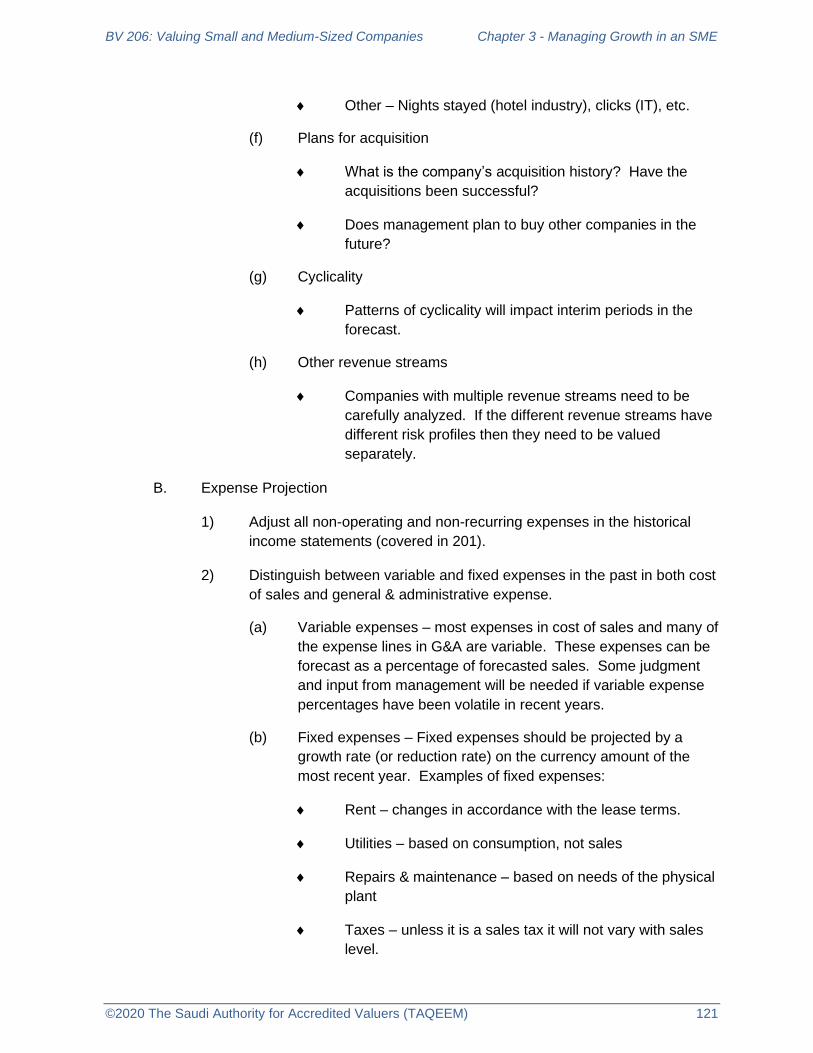
BV 206: Valuing Small and Medium-Sized Companies Chapter 3 - Managing Growth in an SME
©2020 The Saudi Authority for Accredited Valuers (TAQEEM) 121
Other – Nights stayed (hotel industry), clicks (IT), etc.
(f) Plans for acquisition
What is the company’s acquisition history? Have the
acquisitions been successful?
Does management plan to buy other companies in the
future?
(g) Cyclicality
Patterns of cyclicality will impact interim periods in the
forecast.
(h) Other revenue streams
Companies with multiple revenue streams need to be
carefully analyzed. If the different revenue streams have
different risk profiles then they need to be valued
separately.
B. Expense Projection
1) Adjust all non-operating and non-recurring expenses in the historical
income statements (covered in 201).
2) Distinguish between variable and fixed expenses in the past in both cost
of sales and general & administrative expense.
(a) Variable expenses – most expenses in cost of sales and many of
the expense lines in G&A are variable. These expenses can be
forecast as a percentage of forecasted sales. Some judgment
and input from management will be needed if variable expense
percentages have been volatile in recent years.
(b) Fixed expenses – Fixed expenses should be projected by a
growth rate (or reduction rate) on the currency amount of the
most recent year. Examples of fixed expenses:
Rent – changes in accordance with the lease terms.
Utilities – based on consumption, not sales
Repairs & maintenance – based on needs of the physical
plant
Taxes – unless it is a sales tax it will not vary with sales
level.

BV 206: Valuing Small and Medium-Sized Companies Chapter 3 - Managing Growth in an SME
©2020 The Saudi Authority for Accredited Valuers (TAQEEM) 122
These expenses should be reviewed individually with company
management.
(c) Semi-variable – Some expenses will change loosely with sales.
Salaries, for example will not increase in direct proportion with
sales but obviously will increase as the company grows.
3) Relevant range of operation
(a) Fixed expenses and semi-variable expenses should by analyzed
in light of the company’s anticipated relevant ranges of
operations. A relevant range of operation is a range of sales in
which a given fixed cost analysis is relevant.
As the company grows it will be able to operate with a set
amount of fixed assets (office space, warehouses, trucks,
etc.) which correlates to a range of sales.
Once the company’s sales grow beyond a certain point, it
enters a new range of operations and will need to acquire
additional office space, machinery & equipment,
warehousing, etc.
To derive valid PFI, the valuer needs to get
management’s input as what the break points will be in
each range and when they are expected to occur.
4) Depreciation
(a) Projecting depreciation expense is part of the balance sheet
forecast and capital investment spending. This is addressed
below.
5) Interest expense
(a) Projecting interest expense is part of the balance sheet forecast
and is addressed as part of projecting future debt levels below.
6) Example
(a) This example has been distributed as an excel file
“Palm.Disposal.Case”. The historical income statements and
balance sheets are shown below:

BV 206: Valuing Small and Medium-Sized Companies Chapter 3 - Managing Growth in an SME
©2020 The Saudi Authority for Accredited Valuers (TAQEEM) 123
Palm Disposal, LLCIncome StatementsFor the Fiscal Year Ended December 31,
2015 2016 2017 2018 2019
Total Revenue 9,820$ 815,536$ 2,047,114$ 7,228,368$ 11,973,945$
Total Cost of Revenues 46,236 995,460 1,406,214 5,494,629 10,669,737
Gross Profit (36,416) (179,924) 640,900 1,733,739 1,304,208
OPERATING EXPENSES
Advertising & promotion 6,504 23,701 31,133 92,653 95,136
Automobile 2,239 6,642 33,620 - -
Bank service charges (2) 2,853 4,086 34,857 39,134
Loan cost - 2,007 - - -
Charitable contributions 200 - 1,700 - 10,540
Commissions - 11,394 28,246 - -
Computer 81 1,256 7,993 - -
Depreciation - - - 374,191 22,547
Dues & subscriptions 700 1,606 1,425 - -
Equipment rental 5,795 6,546 37,346 7,660 221,784
Insurance 7,583 29,662 117,012 450,090 908,590
Penalties - 285 - - -
Telephone 192 8,336 10,060 37,226 54,142
Supplies - 1,787 3,796 - -
Officers Life insurance - 2,960 - - -
Miscellaneous 426 0 19,932 25,900 37,937
Office supplies 2,347 15,164 21,899 87,107 113,495
Salaries & wages 31,492 187,313 217,544 409,554 756,451
Payroll taxes 3,234 31,215 61,427 179,810 76,315
Postage - 1,101 - - -
Professional fees 8,893 61,044 43,779 166,170 87,650
Repairs and maintenance 5,459 11,052 19,399 60,070 274,420
Small tools & equipment 3,613 11,211 21,891 - -
Taxes & licenses - 18,303 6,930 132,325 302,467
Travel 1,633 13,285 5,095 55,474 98,500
Utilities 1,097 5,571 4,822 13,072 24,407
OPERATING EXPENSES 81,487 454,294 699,135 2,126,159 3,123,515
EBIT (117,903) (634,218) (58,235) (392,420) (1,819,307)
Other income (expense)
Other - 63 - (9,129) (4,475)
Scrap iron income - 32,415 - - -
Scrap iron expense - (12,909) (20,732) - -
Interest expense (2,742) (44,226) (44,093) (341,380) (617,773)
Total other (2,742) (24,657) (64,825) (350,509) (622,248)
Earnings Before Tax (120,645)$ (658,875)$ (123,060)$ (742,929)$ (2,441,555)$
EBITDA (93,484) (398,014) (58,235) 1,017,509 567,827

BV 206: Valuing Small and Medium-Sized Companies Chapter 3 - Managing Growth in an SME
©2020 The Saudi Authority for Accredited Valuers (TAQEEM) 124
(b) Palm Disposal, LLC is a waste collection company that serves
certain residential communities in Jeddah. The company has
been subcontracted by the Jeddah Municipal government to
service designated areas within the city for a 3-year contracted
time period. Company management provided the valuer with
forecasted sales levels given assumptions about gaining new
contracts and an increasing population within its designated
market area. Based on those sales and the company’s historical
common size income statements, the valuer prepared the
following profit forecast:
Palm Disposal, LLC
Balance SheetsFor the Fiscal Year Ended December 31,
(SAR)
2015 2016 2017 2018 2019
ASSETS
Current Assets
Cash 258,528 779 58,486 665,817 3,874
Accounts receivable 3,954 135,149 435,005 1,328,434 1,948,995
Prepaid insurance 37,620 55,662 44,529 417,951 585,599
Deposits - 16,781 - 267,780 675
Total current assets 300,102 208,371 538,020 2,679,982 2,539,143
Property, plant & equipment
Gross PP&L 709,269 2,102,805 2,290,740 11,947,440 18,337,678
less: accumulated depreciation (24,419) (260,623) (260,623) (2,169,889) (4,557,024)
Net property, plant & equipment 684,850 1,842,182 2,030,117 9,777,551 13,780,654
Total Assets 984,952 2,050,553 2,568,137 12,457,533 16,319,797
Current liabilities
Current portion of LTD 12,818 6,073 6,073 2,012,597 3,183,279
Long term debt - due on demand 478,841 443,489 507,438 550,015 2,571,577
Accounts payable - 180,616 406,647 770,851 1,754,893
Payroll liabilities 13,278 5,529 29,853 22,196 44,408
Other current liabilities 33,833 111,773 - 392,843 543,977
Total current liabilities 538,770 747,480 751,914 3,748,502 8,098,134
Long term liabilities
Long term demand debt - beyond 1 yr - 1,449,461 2,182,900 8,912,035 10,866,222
Other long term liabilities 66,826 33,131 25,759 - -
Total long term liabilities 66,826 1,482,592 2,208,659 8,912,035 10,866,222
Total liabilities 605,596 2,230,072 2,960,573 12,660,537 18,964,356
Shareholders' Equity
Contributed capital 500,000 600,000 1,600,000 539,925 -
Retained earnings (deficit) - (120,644) (796,299) - -
Net income (loss) (120,644) (658,875) (1,196,137) (742,929) -
Shareholder equity 379,356 (179,519) (392,436) (203,004) (2,644,559)
Total liabilities and capital 984,952 2,050,553 2,568,137 12,457,533 16,319,797

BV 206: Valuing Small and Medium-Sized Companies Chapter 3 - Managing Growth in an SME
©2020 The Saudi Authority for Accredited Valuers (TAQEEM) 125
(c) In the above forecast the valuer makes a common mistake. He
projected the historical expense to sales relationship into the
future with no consideration given to whether costs are fixed or
variable.
(d) There are several problems with the above forecast.
Operating expenses likely include fixed costs that will not
increase in direct correlation with sales.
Depreciation and interest expense were forecast at a set
riyal amount which is probably inaccurate for a growing
company. These expenses cannot be forecast unless
the valuer has forecast all or part of the balance sheet.
After an initial review, management provided a list of fixed
expenses, the rate at which they are expected to grow, and also
provided the capital investment needed to support various sales
ranges. Finally, management provided the debt forecast and the
related interest expense.
This enabled the revised forecast, below.
Palm Disposal, LLC
Projected Income Statements(SAR)
12/31/2020 12/31/2021 12/31/2022 12/31/2023 12/31/2024 12/31/2025 12/31/2026
REVENUES 21,025,000 32,588,750 47,253,688 61,429,794 67,572,773 71,627,140 74,492,225
Cost of goods sold 13,666,250 21,182,688 30,714,897 39,929,366 43,922,303 46,557,641 48,419,946
Gross Profit 7,358,750 11,406,063 16,538,791 21,500,428 23,650,471 25,069,499 26,072,279
Operating expenses 4,415,250 6,843,638 9,923,274 12,900,257 14,190,282 15,041,699 15,643,367
EBITDA 2,943,500 4,562,425 6,615,516 8,600,171 9,460,188 10,027,800 10,428,912
Depreciation & Amortization 2,275,000 2,275,000 2,275,000 2,275,000 2,275,000 2,275,000 2,275,000
EBIT 668,500 2,287,425 4,340,516 6,325,171 7,185,188 7,752,800 8,153,912
Interest - 565,000 565,000 565,000 565,000 565,000 565,000
Net income 668,500 1,722,425 3,775,516 5,760,171 6,620,188 7,187,800 7,588,912
Forecast Variables
Revenue growth 55.0% 45.0% 30.0% 10.0% 6.0% 4.0%
Cost of goods sold 65.0% 65.0% 65.0% 65.0% 65.0% 65.0% 65.0%
Gross margin 35.0% 35.0% 35.0% 35.0% 35.0% 35.0% 35.0%
Op. Expense 21.0% 21.0% 21.0% 21.0% 21.0% 21.0% 21.0%
EBITDA margin 14.0% 14.0% 14.0% 14.0% 14.0% 14.0% 14.0%
EBIT Margin 3.2% 7.0% 9.2% 10.3% 10.6% 10.8% 10.9%

BV 206: Valuing Small and Medium-Sized Companies Chapter 3 - Managing Growth in an SME
©2020 The Saudi Authority for Accredited Valuers (TAQEEM) 126
(e) As shown, this income statement is different from the original
simple analysis. In the original analysis, the forecasted EBITDA
margin is 14.0%. In the revised model, the rate gradually
increases to 16.0% due to lower fixed costs.
(f) Still, the valuer cannot analyze net income since he does not yet
have the information to project depreciation and interest
expense.
C. Projecting the balance sheet
1) Project total assets.
(a) Since sales have been forecast, the valuer can use the total
asset turnover ratio to project total assets in the forecast.
Care must be taken to select a valid turnover ratio. The
most recent year may not be appropriate if a large
increase in assets occurred. As is the case with the
Palm Disposal, LLC
Projected Income Statements(SAR)
12/31/2020 12/31/2021 12/31/2022 12/31/2023 12/31/2024 12/31/2025 12/31/2026
REVENUES 21,025,000 32,588,750 47,253,688 61,429,794 67,572,773 71,627,140 74,492,225
Cost of goods sold 13,666,250 21,182,688 30,714,897 39,929,366 43,922,303 46,557,641 48,419,946
Gross Profit 7,358,750 11,406,063 16,538,791 21,500,428 23,650,471 25,069,499 26,072,279
Variable expenses 3,637,325 5,637,854 8,174,888 10,627,354 11,690,090 12,391,495 12,887,155
Fixed expenses 777,000 933,700 1,013,751 1,141,164 1,219,948 1,256,547 1,294,243
Total overhead 4,414,325 6,571,554 9,188,639 11,768,518 12,910,038 13,648,042 14,181,398
EBITDA 2,944,425 4,834,509 7,350,152 9,731,910 10,740,432 11,421,457 11,890,881
Forecast Variables
Revenue growth 55.0% 45.0% 30.0% 10.0% 6.0% 4.0%
Cost of goods sold 65.0% 65.0% 65.0% 65.0% 65.0% 65.0% 65.0%
Gross margin 35.0% 35.0% 35.0% 35.0% 35.0% 0.0% 35.0%
Op. Expense 17.3% 17.3% 17.3% 17.3% 17.3% 17.3% 17.3%
EBITDA margin 14.0% 14.8% 15.6% 15.8% 15.9% 15.9% 16.0%
EBIT Margin 2.7% 5.4% 6.2% 6.4% 6.2% 6.0% 5.6%
Fixed cost analysis
Rent 275,000 375,000 400,000 475,000 510,000 525,300 541,059
Utilities 90,000 120,000 155,000 190,000 215,000 221,450 228,094
Maintenance 22,000 37,000 45,000 50,000 56,000 57,680 59,410
Other fixed costs 390,000 401,700 413,751 426,164 438,948 452,117 465,680
777,000 933,700 1,013,751 1,141,164 1,219,948 1,256,547 1,294,243
Notes:
1. Rent increases in accordance with leasing rates for the space needed to warehouse the disposal trucks which will increase as operations
expand. Also, additional office expense was factored in. After 2021, rent increases at 3.0%
2. Utilities also are projected to increase in relevant ranges with sales. As the physical plant grows, utilities and gasoline will increase in step.
3. Maintenance expenses increase in step with the number of trucks, not sales.
4. Other fixed expenses were projected by management to grow at 3% per year.
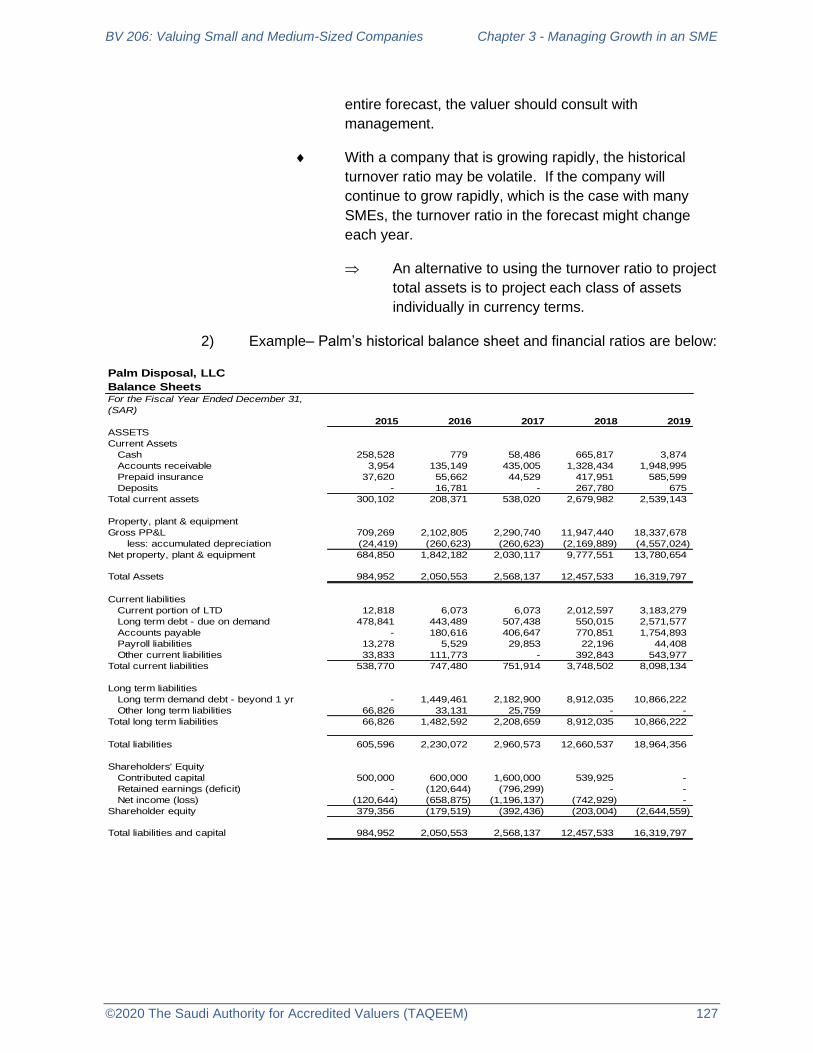
BV 206: Valuing Small and Medium-Sized Companies Chapter 3 - Managing Growth in an SME
©2020 The Saudi Authority for Accredited Valuers (TAQEEM) 127
entire forecast, the valuer should consult with
management.
With a company that is growing rapidly, the historical
turnover ratio may be volatile. If the company will
continue to grow rapidly, which is the case with many
SMEs, the turnover ratio in the forecast might change
each year.
An alternative to using the turnover ratio to project
total assets is to project each class of assets
individually in currency terms.
2) Example– Palm’s historical balance sheet and financial ratios are below:
Palm Disposal, LLC
Balance SheetsFor the Fiscal Year Ended December 31,
(SAR)
2015 2016 2017 2018 2019
ASSETS
Current Assets
Cash 258,528 779 58,486 665,817 3,874
Accounts receivable 3,954 135,149 435,005 1,328,434 1,948,995
Prepaid insurance 37,620 55,662 44,529 417,951 585,599
Deposits - 16,781 - 267,780 675
Total current assets 300,102 208,371 538,020 2,679,982 2,539,143
Property, plant & equipment
Gross PP&L 709,269 2,102,805 2,290,740 11,947,440 18,337,678
less: accumulated depreciation (24,419) (260,623) (260,623) (2,169,889) (4,557,024)
Net property, plant & equipment 684,850 1,842,182 2,030,117 9,777,551 13,780,654
Total Assets 984,952 2,050,553 2,568,137 12,457,533 16,319,797
Current liabilities
Current portion of LTD 12,818 6,073 6,073 2,012,597 3,183,279
Long term debt - due on demand 478,841 443,489 507,438 550,015 2,571,577
Accounts payable - 180,616 406,647 770,851 1,754,893
Payroll liabilities 13,278 5,529 29,853 22,196 44,408
Other current liabilities 33,833 111,773 - 392,843 543,977
Total current liabilities 538,770 747,480 751,914 3,748,502 8,098,134
Long term liabilities
Long term demand debt - beyond 1 yr - 1,449,461 2,182,900 8,912,035 10,866,222
Other long term liabilities 66,826 33,131 25,759 - -
Total long term liabilities 66,826 1,482,592 2,208,659 8,912,035 10,866,222
Total liabilities 605,596 2,230,072 2,960,573 12,660,537 18,964,356
Shareholders' Equity
Contributed capital 500,000 600,000 1,600,000 539,925 -
Retained earnings (deficit) - (120,644) (796,299) - -
Net income (loss) (120,644) (658,875) (1,196,137) (742,929) -
Shareholder equity 379,356 (179,519) (392,436) (203,004) (2,644,559)
Total liabilities and capital 984,952 2,050,553 2,568,137 12,457,533 16,319,797
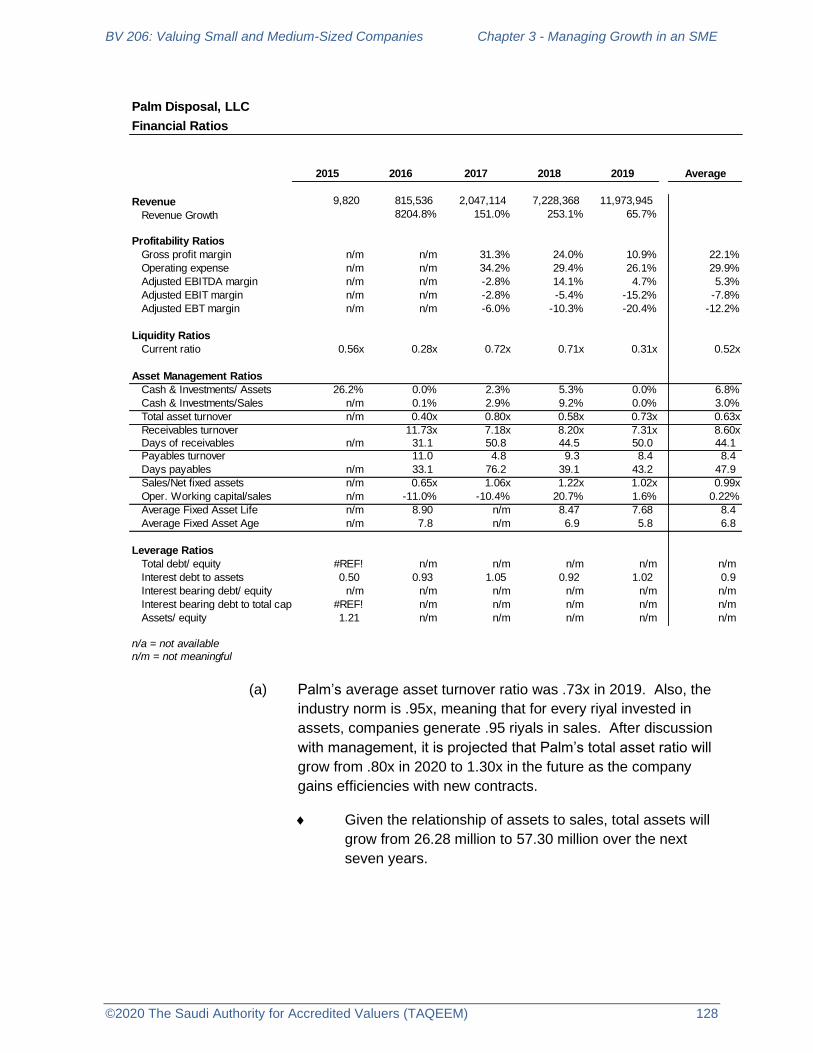
BV 206: Valuing Small and Medium-Sized Companies Chapter 3 - Managing Growth in an SME
©2020 The Saudi Authority for Accredited Valuers (TAQEEM) 128
(a) Palm’s average asset turnover ratio was .73x in 2019. Also, the
industry norm is .95x, meaning that for every riyal invested in
assets, companies generate .95 riyals in sales. After discussion
with management, it is projected that Palm’s total asset ratio will
grow from .80x in 2020 to 1.30x in the future as the company
gains efficiencies with new contracts.
Given the relationship of assets to sales, total assets will
grow from 26.28 million to 57.30 million over the next
seven years.
Palm Disposal, LLC
Financial Ratios
2015 2016 2017 2018 2019 Average
Revenue 9,820 815,536 2,047,114 7,228,368 11,973,945
Revenue Growth 8204.8% 151.0% 253.1% 65.7%
Profitability Ratios
Gross profit margin n/m n/m 31.3% 24.0% 10.9% 22.1%
Operating expense n/m n/m 34.2% 29.4% 26.1% 29.9%
Adjusted EBITDA margin n/m n/m -2.8% 14.1% 4.7% 5.3%
Adjusted EBIT margin n/m n/m -2.8% -5.4% -15.2% -7.8%
Adjusted EBT margin n/m n/m -6.0% -10.3% -20.4% -12.2%
Liquidity Ratios
Current ratio 0.56x 0.28x 0.72x 0.71x 0.31x 0.52x
Asset Management Ratios **
Cash & Investments/ Assets 26.2% 0.0% 2.3% 5.3% 0.0% 6.8%
Cash & Investments/Sales n/m 0.1% 2.9% 9.2% 0.0% 3.0%
Total asset turnover n/m 0.40x 0.80x 0.58x 0.73x 0.63x
Receivables turnover 11.73x 7.18x 8.20x 7.31x 8.60x
Days of receivables n/m 31.1 50.8 44.5 50.0 44.1
Payables turnover 11.0 4.8 9.3 8.4 8.4
Days payables n/m 33.1 76.2 39.1 43.2 47.9
Sales/Net fixed assets n/m 0.65x 1.06x 1.22x 1.02x 0.99x
Oper. Working capital/sales n/m -11.0% -10.4% 20.7% 1.6% 0.22%
Average Fixed Asset Life n/m 8.90 n/m 8.47 7.68 8.4
Average Fixed Asset Age n/m 7.8 n/m 6.9 5.8 6.8
Leverage Ratios
Total debt/ equity #REF! n/m n/m n/m n/m n/m
Interest debt to assets 0.50 0.93 1.05 0.92 1.02 0.9
Interest bearing debt/ equity n/m n/m n/m n/m n/m n/m
Interest bearing debt to total capital #REF! n/m n/m n/m n/m n/m
Assets/ equity 1.21 n/m n/m n/m n/m n/m
n/a = not available
n/m = not meaningful

BV 206: Valuing Small and Medium-Sized Companies Chapter 3 - Managing Growth in an SME
©2020 The Saudi Authority for Accredited Valuers (TAQEEM) 129
(b) Other key balance sheet accounts can be projected using
financial ratios as the valuer has confidence in the projected
account relationship in the ratio.
Four balance sheets accounts were projected based on
financial ratios. It is important to measure financial ratios
based on average metrics (sales to average receivables;
sales to average assets; cost of sale to average payable,
etc.).
One objective of projecting the assets and working capital
is to estimate the amount of financing that will be needed
and discussing with management whether additional
investment will be in the form of debt or equity.
Palm Disposal, LLCAsset forecast (SAR) 12/31/2020 12/31/2021 12/31/2022 12/31/2023 12/31/2024 12/31/2025 12/31/2026
REVENUES 21,025,000 32,588,750 47,253,688 61,429,794 67,572,773 71,627,140 74,492,225
Total Asset Turnover 0.80x 0.85x 0.90x 1.00x 1.15x 1.20x 1.30x
Total Assets 26,281,250 38,339,706 52,504,097 61,429,794 58,758,933 59,689,283 57,301,712
Palm Disposal, LLCA/R forecast (SAR) 12/31/2020 12/31/2021 12/31/2022 12/31/2023 12/31/2024 12/31/2025 12/31/2026
REVENUES 21,025,000 32,588,750 47,253,688 61,429,794 67,572,773 71,627,140 74,492,225
Accts. Receivable Turnover 7.50x 7.50x 7.50x 7.50x 7.50x 7.50x 7.50x
Accounts Receivable 2,803,333 4,345,167 6,300,492 8,190,639 9,009,703 9,550,285 9,932,297
Palm Disposal, LLCFixed Asset forecast (SAR) 12/31/2020 12/31/2021 12/31/2022 12/31/2023 12/31/2024 12/31/2025 12/31/2026
REVENUES 21,025,000 32,588,750 47,253,688 61,429,794 67,572,773 71,627,140 74,492,225
Fixed Asset Turnover 1.00x 1.20x 1.30x 1.40x 1.50x 1.70x 1.80x
Fixed Assets 21,025,000 27,157,292 36,348,990 43,878,424 45,048,515 42,133,611 41,384,569
Palm Disposal, LLCA/P (SAR) 12/31/2020 12/31/2021 12/31/2022 12/31/2023 12/31/2024 12/31/2025 12/31/2026
Cost of Sales 13,666,250 21,182,688 30,714,897 39,929,366 43,922,303 46,557,641 48,419,946
Accts Payable Turnover 8.50x 8.50x 8.50x 8.50x 8.50x 8.50x 8.50x
Accounts payable 1,607,794 2,492,081 3,613,517 4,697,572 5,167,330 5,477,369 5,696,464

BV 206: Valuing Small and Medium-Sized Companies Chapter 3 - Managing Growth in an SME
©2020 The Saudi Authority for Accredited Valuers (TAQEEM) 130
(c) The valuer should use additional methods of projecting these
accounts. As stated above, certain accounts can be projected
on a currency basis.
In the case of Palm, major investments are for the waste
collection and recycling trucks which can cost over SAR
1,000,000 apiece. Management should be able to
specifically forecast the number of trucks needed each
year, when new ones will be purchased, and when
existing assets will be retired.
(d) An alternative method of projecting fixed assets (and probably a
more precise method, especially in a company like Palm), is to
obtain management’s plan for investing in capital assets. In the
example, Palm’s management provided the following fixed asset
investment and depreciation schedule.
The shaded cells show management’s expectation of
annual capital investment to support growth. Investment
consists mostly of disposal trucks, as mentioned.
Average asset life above (10 years) represents that
average annual life of all the assets acquired.
Given the expectation for future investment, the annual
depreciation is calculated for each future year’s
acquisitions. These are added to the remaining
depreciation on the assets that existed as of the valuation
date. This provides another key expense for the income
statement.
The valuer should check for consistency since
independently forecast financial statement accounts may
conflict with one another.
Capital Investment (Management)(SAR)
Depreciation Schedule 2020 2021 2022 2023 2024 2025 2026
Average Asset Life 10.00
Depreciable @ 12/31/19 13,780,654 1,378,065 1,378,065 1,378,065 1,378,065 1,378,065 1,378,065 1,378,065
Ending depreciation
Annual Capital
Year Investment
2020 10,000,000 1,000,000 1,000,000 1,000,000 1,000,000 1,000,000 1,000,000 1,000,000
2021 12,000,000 1,200,000 1,200,000 1,200,000 1,200,000 1,200,000 1,200,000
2022 12,000,000 1,200,000 1,200,000 1,200,000 1,200,000 1,200,000
2023 10,000,000 1,000,000 1,000,000 1,000,000 1,000,000
2024 7,500,000 750,000 750,000 750,000
2025 6,000,000 600,000 600,000
2026 6,000,000 600,000
Annual Depreciation = 2,378,065 3,078,065 4,428,065 5,778,065 6,528,065 7,128,065 7,728,065

BV 206: Valuing Small and Medium-Sized Companies Chapter 3 - Managing Growth in an SME
©2020 The Saudi Authority for Accredited Valuers (TAQEEM) 131
3) Forecast financing needs
(a) Growing companies require financing to acquire assets and
personnel. Once needs are identified, management decides on
how much of the need will be debt versus equity investment.
(b) The projection of debt financing is a complex forecast, involving
several factors:
Management’s expectation about the company’s capital
structure.
The valuer can determine the total need for
investment but how that breaks down into debt or
equity financing depends on the company’s
borrowing capacity, its risk, and management’s
target capital structure.
As a first cut, the interest-bearing debt to total asset ratio
is calculated given the total asset projection above and
the relevant ratio. Assume that Palm’s interest-bearing
debt to asset ratio is 1.0x, increasing over time to 1.30x in
keeping with management’s projection of debt discussed
below.
(c) A pro forma balance sheet can be calculated given the data that
has been projected through the above calculations. This
balance sheet is not a final document.
The process of determining financing needs is iterative in
nature. The valuer must calculate preliminary equity
cash flow, determine the shortfall in financing (i.e. the
negative cash flow to equity) and then enter the amount
of financing (debt or equity) in the model that will yield at
least a breakeven analysis.
Palm Disposal, LLCInt.bear debt/Assets 12/31/2020 12/31/2021 12/31/2022 12/31/2023 12/31/2024 12/31/2025 12/31/2026
Assets 26,281,250 38,339,706 52,504,097 61,429,794 58,758,933 59,689,283 57,301,712
Intrst-bearing debt/asset ratio 1.00x 1.10x 1.15x 1.23x 1.26x 1.28x 1.30x
Interest-bearing debt 26,281,250 34,854,278 45,655,737 50,146,770 46,634,074 46,815,124 44,078,240

BV 206: Valuing Small and Medium-Sized Companies Chapter 3 - Managing Growth in an SME
©2020 The Saudi Authority for Accredited Valuers (TAQEEM) 132
The above balance sheet is missing several accounts
(cash, other current assets, other current liabilities, etc.),
so the equity values are not precise.
A projected preliminary working capital need can be
assessed by subtracting current liabilities from current
assets. The change in working capital reveals the
working capital cash flow requirement (see Investment in
W/C, above).
D. Projecting Cash Flow
1) The analysis above has yielded enough information to project cash
flows with minimal financing considerations (debt level is left at the 2019
level). This will help to determine the amount of cash shortfall in
operations, if any.
Palm Disposal, LLCPro Forma Balance Sheet
12/31/2020 12/31/2021 12/31/2022 12/31/2023 12/31/2024 12/31/2025 12/31/2026
ASSETS
Cash n/a n/a n/a n/a n/a n/a n/a
Accounts receivable 2,803,333 4,345,167 6,300,492 8,190,639 9,009,703 9,550,285 9,932,297
Other current assets n/a n/a n/a n/a n/a n/a n/a
Total current assets 2,803,333 4,345,167 6,300,492 8,190,639 9,009,703 9,550,285 9,932,297
Net fixed assets 21,025,000 27,157,292 36,348,990 43,878,424 45,048,515 42,133,611 41,384,569
Other n/a n/a n/a n/a n/a n/a n/a
Total assets 26,281,250 38,339,706 52,504,097 61,429,794 58,758,933 59,689,283 57,301,712
LIABILITIES & EQUITY
Currrent liabilities
Accounts payable 1,607,794 2,492,081 3,613,517 4,697,572 5,167,330 5,477,369 5,696,464
Other current liabilities n/a n/a n/a n/a n/a n/a n/a
Total current liabilities 1,607,794 2,492,081 3,613,517 4,697,572 5,167,330 5,477,369 5,696,464
Debt 26,281,250 34,854,278 45,655,737 50,146,770 46,634,074 46,815,124 44,078,240
Total liabilities 27,889,044 37,346,359 49,269,254 54,844,343 51,801,404 52,292,493 49,774,704
Equity (1,607,794) 993,347 3,234,843 6,585,451 6,957,530 7,396,790 7,527,008
Liab & Equity 26,281,250 38,339,706 52,504,097 61,429,794 58,758,933 59,689,283 57,301,712
Working Capital Analysis
Working capital 1,195,539 1,853,086 2,686,974 3,493,067 3,842,373 4,072,916 4,235,832
Investment in W/C (999,674) (657,547) (833,889) (806,092) (349,307) (230,542) (162,917)

BV 206: Valuing Small and Medium-Sized Companies Chapter 3 - Managing Growth in an SME
©2020 The Saudi Authority for Accredited Valuers (TAQEEM) 133
2) As the preliminary cash flow statement shows, the company will have a
shortfall in funding of 8.9 million in 2020, 8.7 million in 2021, 6.3 million
in 2022, and 1.9 million in 2023.
(a) This cash flow statement indicates that internal profitability will
not suffice to support projected sales, leaving management with
three options:
Do not grow the company
Invest equity funding to support growth
Invest debt funding to support growth
(b) The valuer must get this input from management. There are
several ramifications of management’s decision:
Not growing the company will leave it open to competition
that will, assuming the market share is actually there,
Palm Disposal, LLC
Projected Income Statements(SAR)
12/31/2020 12/31/2021 12/31/2022 12/31/2023 12/31/2024 12/31/2025 12/31/2026
REVENUES 21,025,000 32,588,750 47,253,688 61,429,794 67,572,773 71,627,140 74,492,225
Cost of goods sold 13,666,250 21,182,688 30,714,897 39,929,366 43,922,303 46,557,641 48,419,946
Gross Profit 7,358,750 11,406,063 16,538,791 21,500,428 23,650,471 25,069,499 26,072,279
Variable expenses 3,637,325 5,637,854 8,174,888 10,627,354 11,690,090 12,391,495 12,887,155
Fixed expenses 777,000 933,700 1,013,751 1,141,164 1,219,948 1,256,547 1,294,243
Total overhead 4,414,325 6,571,554 9,188,639 11,768,518 12,910,038 13,648,042 14,181,398
EBITDA 2,944,425 4,834,509 7,350,152 9,731,910 10,740,432 11,421,457 11,890,881
Depreciation & Amortization 2,378,065 3,078,065 4,428,065 5,778,065 6,528,065 7,128,065 7,728,065
EBIT 566,360 1,756,443 2,922,086 3,953,845 4,212,367 4,293,391 4,162,815
Interest 864,296 864,296 864,296 864,296 864,296 864,296 864,296
Net income (297,936) 892,147 2,057,790 3,089,549 3,348,071 3,429,095 3,298,519
Cash Flow Adjustments
Depreciation 2,378,065 3,078,065 4,428,065 5,778,065 6,528,065 7,128,065 7,728,065
Capital investment (10,000,000) (12,000,000) (12,000,000) (10,000,000) (7,500,000) (6,000,000) (6,000,000)
Working capital investment (999,674) (657,547) (833,889) (806,092) (349,307) (230,542) (162,917)
Debt Principal Repayment - - - - - - -
Total cash flow adjustments (8,621,609) (9,579,481) (8,405,823) (5,028,027) (1,321,241) 897,523 1,565,149
Preliminary Cash Flow (8,919,545) (8,687,334) (6,348,033) (1,938,478) 2,026,830 4,326,618 4,863,668
Debt Principal Received - - - - - - -
Equity Cash Flow (8,919,545) (8,687,334) (6,348,033) (1,938,478) 2,026,830 4,326,618 4,863,668
Forecast Variables
Revenue growth 55.0% 45.0% 30.0% 10.0% 6.0% 4.0%
Cost of goods sold 65.0% 65.0% 65.0% 65.0% 65.0% 65.0% 65.0%
Gross margin 35.0% 35.0% 35.0% 35.0% 35.0% 0.0% 35.0%
Op. Expense 17.3% 17.3% 17.3% 17.3% 17.3% 17.3% 17.3%
EBITDA margin 14.0% 14.8% 15.6% 15.8% 15.9% 15.9% 16.0%
EBIT Margin 2.7% 5.4% 6.2% 6.4% 6.2% 6.0% 5.6%

BV 206: Valuing Small and Medium-Sized Companies Chapter 3 - Managing Growth in an SME
©2020 The Saudi Authority for Accredited Valuers (TAQEEM) 134
take the market share and thus diminish Palm’s ability to
compete in the future.
Invest equity funding. This can be done by existing
shareholders investing more personal funds or by offering
equity interests to new investors.
Invest debt funding – this depends on Palm’s existing
debt (over 16 million), its capacity to add debt, the cost of
new debt, and the risk of the new capital structure with
the greater proportion of debt funding.
If debt is used, the valuer needs to consider
the cost of debt and how the additional
interest expense will affect equity cash flow.
The valuer also needs to consider how the
changing capital structure affects enterprise
value. Is the company moving toward, or
away from, an optimal capital structure?
Given anticipated interest expense and debt principal
repayments, the valuer and management projected the
future debt incurrence and repayment as follows:
Management amortized the additional principal and
interest payments resulting in the debt incursion and
repayment schedule above.
In practice, this will take several iterations to
complete since it may include a mixture of debt
and equity funding. Each iteration needs to check
the net equity cash flow to see if all operating and
financing obligations are met between operating
profits and new financing.
In the cash flow statement below, the valuer went through
a few iterations of additional debt to cover the cash flow
shortfall. The assumed interest expense is 5.2%.
Palm Disposal, LLCCapital Investment (Management)(SAR)Debt Schedule 2020 2021 2022 2023 2024 2025 2026
Beginning balance 16,621,078
Debt incurred 12,000,000 12,000,000 11,000,000 7,000,000 3,000,000 - -
Debt repaid (2,000,000) (2,200,000) (3,000,000) (3,000,000) (3,000,000) (3,000,000) (2,000,000)
Ending balance 26,621,078 36,421,078 44,421,078 48,421,078 48,421,078 45,421,078 43,421,078
Interest at 5.2% 1,384,296 1,893,896 2,309,896 2,517,896 2,517,896 2,361,896 2,257,896

BV 206: Valuing Small and Medium-Sized Companies Chapter 3 - Managing Growth in an SME
©2020 The Saudi Authority for Accredited Valuers (TAQEEM) 135
3) More sophisticated models will project all balance sheet accounts and
will have fewer cells with hard data entry. This model is intended to
show each of the major components of funding.
(a) The most important point of this analysis is the realization that
SME growth is more likely to be volatile. Depending on the type
of company this may cause a wide disparity between income
statement earnings and equity cash flow.
Palm Disposal, LLC
Projected Income Statements(SAR)
12/31/2020 12/31/2021 12/31/2022 12/31/2023 12/31/2024 12/31/2025 12/31/2026
REVENUES 21,025,000 32,588,750 47,253,688 61,429,794 67,572,773 71,627,140 74,492,225
Cost of goods sold 13,666,250 21,182,688 30,714,897 39,929,366 43,922,303 46,557,641 48,419,946
Gross Profit 7,358,750 11,406,063 16,538,791 21,500,428 23,650,471 25,069,499 26,072,279
Variable expenses 3,637,325 5,637,854 8,174,888 10,627,354 11,690,090 12,391,495 12,887,155
Fixed expenses 777,000 933,700 1,013,751 1,141,164 1,219,948 1,256,547 1,294,243
Total overhead 4,414,325 6,571,554 9,188,639 11,768,518 12,910,038 13,648,042 14,181,398
EBITDA 2,944,425 4,834,509 7,350,152 9,731,910 10,740,432 11,421,457 11,890,881
Depreciation & Amortization 2,378,065 3,078,065 4,428,065 5,778,065 6,528,065 7,128,065 7,728,065
EBIT 566,360 1,756,443 2,922,086 3,953,845 4,212,367 4,293,391 4,162,815
Interest 1,384,296 1,893,896 2,309,896 2,517,896 2,517,896 2,361,896 2,257,896
Net income (817,936) (137,453) 612,190 1,435,949 1,694,471 1,931,495 1,904,919
Cash Flow Adjustments
Depreciation 2,378,065 3,078,065 4,428,065 5,778,065 6,528,065 7,128,065 7,728,065
Capital investment (10,000,000) (12,000,000) (12,000,000) (10,000,000) (7,500,000) (6,000,000) (6,000,000)
Working capital investment (999,674) (657,547) (833,889) (806,092) (349,307) (230,542) (162,917)
Debt Principal Repayment (2,000,000) (2,200,000) (3,000,000) (3,000,000) (3,000,000) (3,000,000) (2,000,000)
Total cash flow adjustments (10,621,609) (11,779,481) (11,405,823) (8,028,027) (4,321,241) (2,102,477) (434,851)
Preliminary Cash Flow (11,439,545) (11,916,934) (10,793,633) (6,592,078) (2,626,770) (170,982) 1,470,068
Debt Principal Received 12,000,000 12,000,000 11,000,000 7,000,000 3,000,000 - -
Equity Cash Flow 560,455 83,066 206,367 407,922 373,230 (170,982) 1,470,068
Forecast Variables
Revenue growth 55.0% 45.0% 30.0% 10.0% 6.0% 4.0%
Cost of goods sold 65.0% 65.0% 65.0% 65.0% 65.0% 65.0% 65.0%
Gross margin 35.0% 35.0% 35.0% 35.0% 35.0% 0.0% 35.0%
Op. Expense 17.3% 17.3% 17.3% 17.3% 17.3% 17.3% 17.3%
EBITDA margin 14.0% 14.8% 15.6% 15.8% 15.9% 15.9% 16.0%
EBIT Margin 2.7% 5.4% 6.2% 6.4% 6.2% 6.0% 5.6%

BV 206: Valuing Small and Medium-Sized Companies Chapter 3 - Managing Growth in an SME
©2020 The Saudi Authority for Accredited Valuers (TAQEEM) 136
III. Managing Growth in Technology Start-ups
1. Introduction
A. The discussion above applies to SMEs in traditional industries. In traditional
companies, the investment needed to support growth follows a linear path
1) Managing growth in this context involves determining the market
strategies discussed above (price leader, product differentiation, focus),
planning sales growth in that context, and calculating required
investment.
2) Technology industries do not follow traditional business strategies.
Growth in these industries must be managed in a new context with new
types of analyses.
2. Tech Start-up Strategies
A. Free, then charge – The company offers its service for free to subscribers to get
them used to its utility and after a period of time charges subscription fees.
1) Dropbox
B. Advertising platform – Company generates advertising revenue on a wide free
use of product.
1) Google
C. Crowd strategy – Build a wide user group in which users come to the site
because they can communicate with other users. The accumulation of users
leads to numerous possibilities, including ad revenue and the commercialization
of data.
1) Facebook
2) Twitter
D. Subscription-based – Users pay a one-time entrance fee or monthly fee for the
use of software.
1) Adobe
Production Sales Delivery Consumption
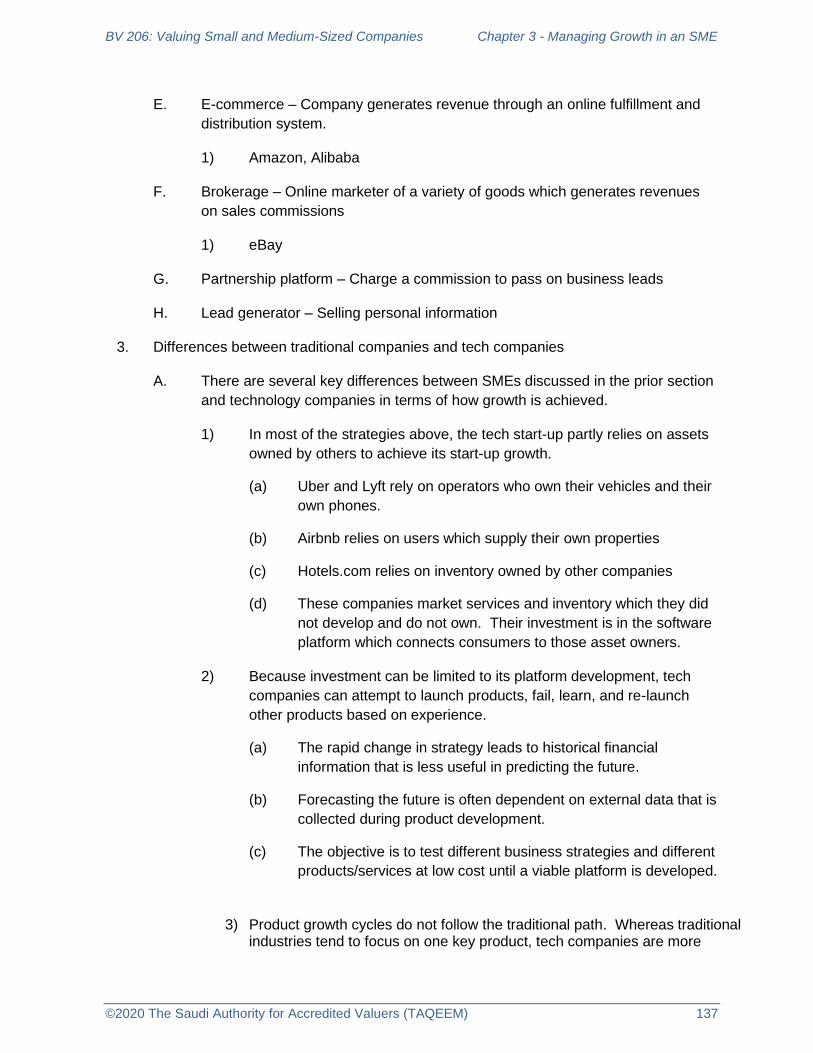
BV 206: Valuing Small and Medium-Sized Companies Chapter 3 - Managing Growth in an SME
©2020 The Saudi Authority for Accredited Valuers (TAQEEM) 137
E. E-commerce – Company generates revenue through an online fulfillment and
distribution system.
1) Amazon, Alibaba
F. Brokerage – Online marketer of a variety of goods which generates revenues
on sales commissions
1) eBay
G. Partnership platform – Charge a commission to pass on business leads
H. Lead generator – Selling personal information
3. Differences between traditional companies and tech companies
A. There are several key differences between SMEs discussed in the prior section
and technology companies in terms of how growth is achieved.
1) In most of the strategies above, the tech start-up partly relies on assets
owned by others to achieve its start-up growth.
(a) Uber and Lyft rely on operators who own their vehicles and their
own phones.
(b) Airbnb relies on users which supply their own properties
(c) Hotels.com relies on inventory owned by other companies
(d) These companies market services and inventory which they did
not develop and do not own. Their investment is in the software
platform which connects consumers to those asset owners.
2) Because investment can be limited to its platform development, tech
companies can attempt to launch products, fail, learn, and re-launch
other products based on experience.
(a) The rapid change in strategy leads to historical financial
information that is less useful in predicting the future.
(b) Forecasting the future is often dependent on external data that is
collected during product development.
(c) The objective is to test different business strategies and different
products/services at low cost until a viable platform is developed.
3) Product growth cycles do not follow the traditional path. Whereas traditional industries tend to focus on one key product, tech companies are more
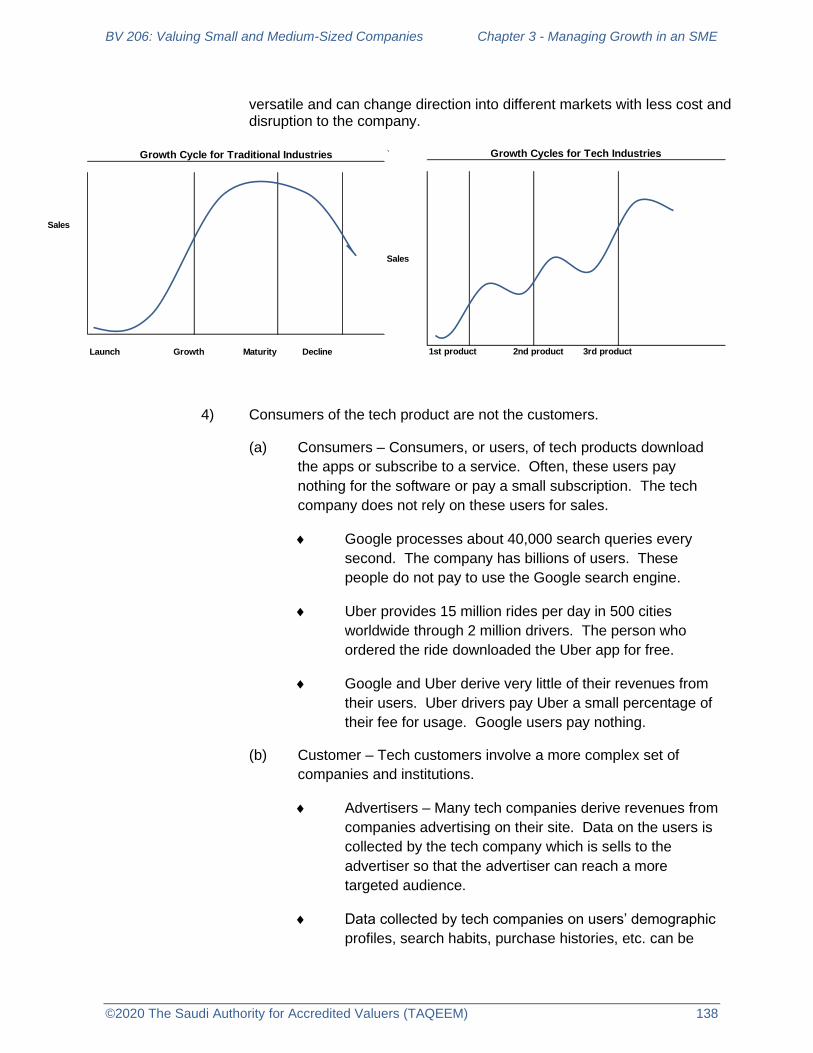
BV 206: Valuing Small and Medium-Sized Companies Chapter 3 - Managing Growth in an SME
©2020 The Saudi Authority for Accredited Valuers (TAQEEM) 138
versatile and can change direction into different markets with less cost and disruption to the company.
4) Consumers of the tech product are not the customers.
(a) Consumers – Consumers, or users, of tech products download
the apps or subscribe to a service. Often, these users pay
nothing for the software or pay a small subscription. The tech
company does not rely on these users for sales.
Google processes about 40,000 search queries every
second. The company has billions of users. These
people do not pay to use the Google search engine.
Uber provides 15 million rides per day in 500 cities
worldwide through 2 million drivers. The person who
ordered the ride downloaded the Uber app for free.
Google and Uber derive very little of their revenues from
their users. Uber drivers pay Uber a small percentage of
their fee for usage. Google users pay nothing.
(b) Customer – Tech customers involve a more complex set of
companies and institutions.
Advertisers – Many tech companies derive revenues from
companies advertising on their site. Data on the users is
collected by the tech company which is sells to the
advertiser so that the advertiser can reach a more
targeted audience.
Data collected by tech companies on users’ demographic
profiles, search habits, purchase histories, etc. can be
Sales
Launch Growth Maturity Decline
Growth Cycle for Traditional Industries `
Sales
1st product 2nd product 3rd product
Growth Cycles for Tech Industries

BV 206: Valuing Small and Medium-Sized Companies Chapter 3 - Managing Growth in an SME
©2020 The Saudi Authority for Accredited Valuers (TAQEEM) 139
packaged and sold to a variety of companies for reasons
other than targeted advertising, depending on the privacy
laws of the country.
The legal and ethical aspects of commercializing
user data is still evolving in the industry. Having
said that, it is becoming evident that the value of
the data collected by companies may emerge as
their most significant asset.
(c) Analyzing growth therefore involves identifying the actual
customer, what they are buying and how much they’ll pay for
either advertising, market intelligence, or personal data on user
groups.
4. Managing the finances of tech start-up growth curve
A. Strategic objective is size
1) Most tech companies’ strategic objective is to become large, with size
defined as the number of users.
(a) Facebook was five years old in 2009 when it generated its first
dollar of profit. At that time, it was valued at $6.5 billion. It spent
the first five years focusing on one goal – obtaining users.
(b) Amazon was founded in 1994 and went public in 1997. Although
it generated profits between 2000 and 2010, it was not until 2018
that the company began generating profits in the billions which
correlated with its trillion dollar value. Prior to that point,
Amazon’s meager profits – and its losses – were ignored by the
market.
The company invested its profits over its first 20 years
back into the company to generate more users.
(c) Uber was founded in 2009 and has not yet generated profit. The
company went public in 2019 and dropped in value during the
year to $46 billion in late 2019.
(d) What tech companies have in common is the need for
exponential user growth. The existence of users makes the
company attractive to non-users. The model is for 2 users to
generate 4 users, who generate 8 users, then 16, 32, 64, 128,
etc.

BV 206: Valuing Small and Medium-Sized Companies Chapter 3 - Managing Growth in an SME
©2020 The Saudi Authority for Accredited Valuers (TAQEEM) 140
(e) In the new economy data has become the new universal
currency. Users are, in effect, equivalent to data.
2) Tech markets are characterized by a small number of very large,
dominant companies with a few small upstarts trying to change the
market paradigm.
(a) Unlike in other industries, the lack of imminent, or even medium-
term profitability is tolerated by the market as long as the
company is building scale.
As was discussed in BV 202, the market multiples for
these tech companies in the public market are driven by
expected growth, not profits.
Amazon appears to have achieved success in this
market. It dominates retail in the western world,
having destroyed or damaged numerous bricks
and mortar retailers. This became possible by
accumulating millions of users to its online
retailing site.
Uber, on the other hand, though it dominates
some markets, is struggling since there are
several competing companies (Lyft, Ola, Didi,
Taxify, Careem) which are legitimate challengers
for scale in the market.
The difference is in the competitive advantage.
Amazon’s logistical software and fulfillment
capacity was more difficult to replicate than Uber’s
driver platform,
B. Cost analysis during the growth phase
1) Variable vs. fixed costs
(a) Tech companies are characterized by a significant amount of up-
front fixed costs which is the cost of building the online platform
or software.
(b) After the platform is built, the variable costs are mostly the
amounts paid to acquire users.
(c) The first objective in the growth curve is to reach a breakeven
point. Breakeven is reached when the firm is generating neither
losses nor profits.

BV 206: Valuing Small and Medium-Sized Companies Chapter 3 - Managing Growth in an SME
©2020 The Saudi Authority for Accredited Valuers (TAQEEM) 141
(d) Example
A breakeven analysis for a traditional company is shown
below.
The company sells 600,000 units at SAR 100 per
unit
Its fixed costs are SAR 15.6 million
Total variable costs at the given level of activity
are SAR 21.9 million, or 36.50 per unit.
The breakeven point is the point at which, for a
given level of sales the company will cover its
costs and, with the next unit sold begin to
generate profit.
Measured in units, the breakeven point is fixed
costs in riyals divided by the contribution margin,
which equals sales per unit minus variable costs
per unit.
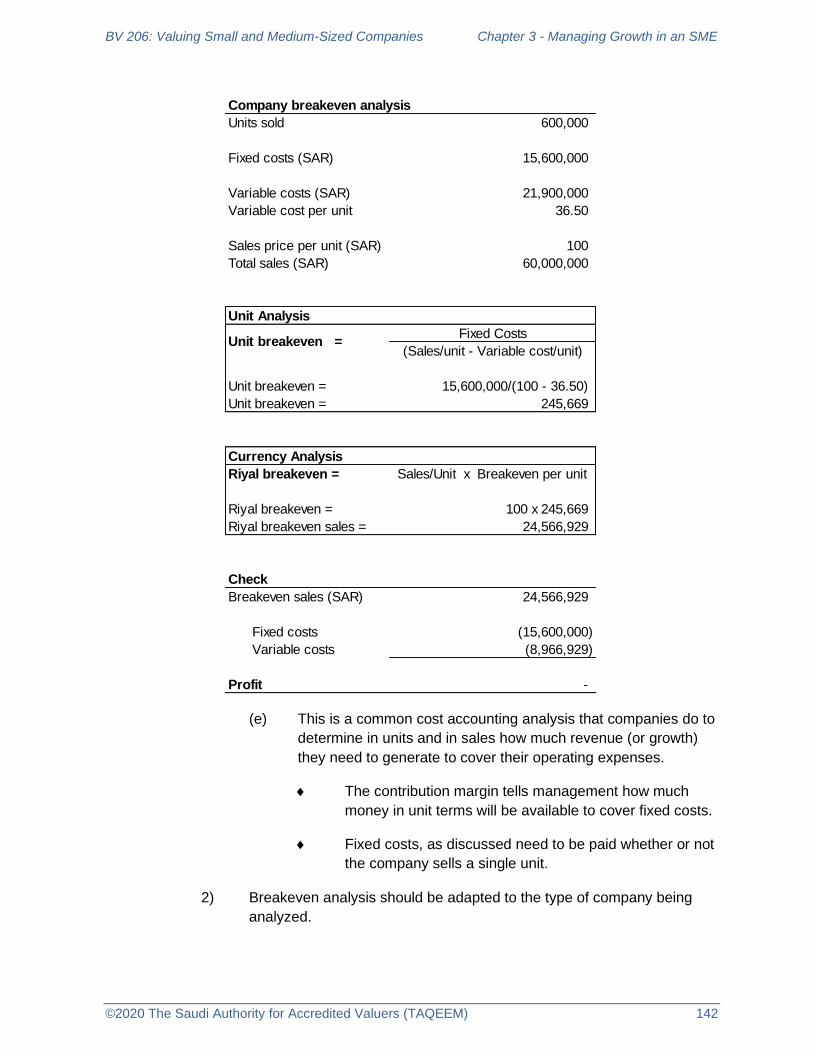
BV 206: Valuing Small and Medium-Sized Companies Chapter 3 - Managing Growth in an SME
©2020 The Saudi Authority for Accredited Valuers (TAQEEM) 142
(e) This is a common cost accounting analysis that companies do to
determine in units and in sales how much revenue (or growth)
they need to generate to cover their operating expenses.
The contribution margin tells management how much
money in unit terms will be available to cover fixed costs.
Fixed costs, as discussed need to be paid whether or not
the company sells a single unit.
2) Breakeven analysis should be adapted to the type of company being
analyzed.
Company breakeven analysis
Units sold 600,000
Fixed costs (SAR) 15,600,000
Variable costs (SAR) 21,900,000
Variable cost per unit 36.50
Sales price per unit (SAR) 100
Total sales (SAR) 60,000,000
Unit Analysis
Fixed Costs
(Sales/unit - Variable cost/unit)
Unit breakeven = 15,600,000/(100 - 36.50)
Unit breakeven = 245,669
Currency Analysis
Riyal breakeven = Sales/Unit x Breakeven per unit
Riyal breakeven = 100 x 245,669
Riyal breakeven sales = 24,566,929
Check
Breakeven sales (SAR) 24,566,929
Fixed costs (15,600,000)
Variable costs (8,966,929)
Profit -
Unit breakeven =
BV 206: Valuing Small and Medium-Sized Companies Chapter 3 - Managing Growth in an SME
©2020 The Saudi Authority for Accredited Valuers (TAQEEM) 143
(a) Tech companies’ largest fixed cost is the development of its
technology. Once completed, it becomes a sunk cost. It may be
adapted in ensuing years, but the most significant cost is
completed.
Amazon’s technology platform was completed long ago.
Significant fixed costs continue in its fulfillment centers,
but the technology, although updated, does not have to
be built from scratch each year.
Many tech firms have low labor costs but high costs in
robotics and automation. This shifts costs from variable
to semi-variable or fixed.
3) Tech companies focus on the cost to attain new users. Gaining market
share is the prime objective. To gain market share, companies may
offer the product for free or at a reduced price. In some cases cash
incentives are offered to the user to subscribe.
(a) Companies that succeed are sometimes the ones with more
cash to survive, not the ones with the better technology.
Apple MACs are generally seen as the better product but
Microsoft PCs are prevalent partially due to the lower
cost. Microsoft built a market with a less expensive
machine and hoped that price and switching costs would
maintain the market share.
(b) The quality of the users is equally important
Quality is measured by activity, or how often the user
logs on.
Also measured by turnover. Is growth measured in larger
numbers of new users (who do not renew the following
year), or is the company building on a base of loyal
repeat users?
4) Customer Acquisition Cost & Lifetime Value
(a) Tech companies analyze success in new customers by using a
simple arithmetical tool called customer acquisition cost (CAC)
and lifetime value.
Customer acquisition costs is the total cost paid to
acquire customers (advertising, discounts, sales force,
etc.) divided by the number of customers acquired.
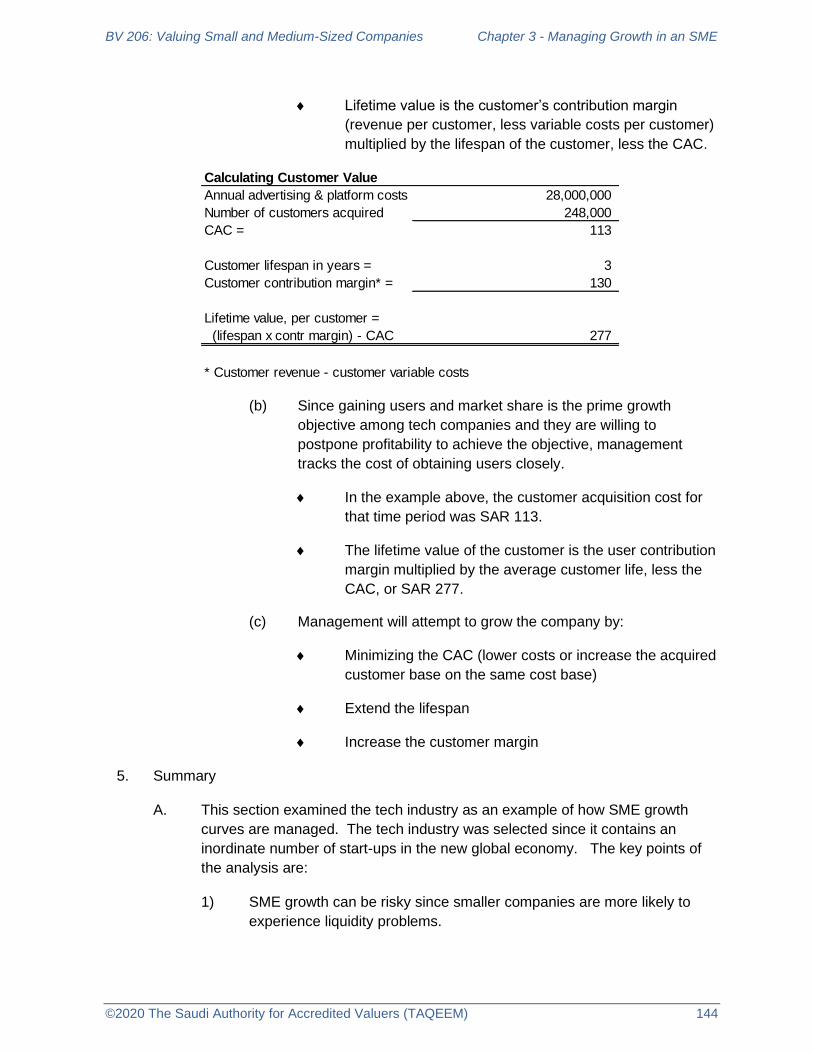
BV 206: Valuing Small and Medium-Sized Companies Chapter 3 - Managing Growth in an SME
©2020 The Saudi Authority for Accredited Valuers (TAQEEM) 144
Lifetime value is the customer’s contribution margin
(revenue per customer, less variable costs per customer)
multiplied by the lifespan of the customer, less the CAC.
(b) Since gaining users and market share is the prime growth
objective among tech companies and they are willing to
postpone profitability to achieve the objective, management
tracks the cost of obtaining users closely.
In the example above, the customer acquisition cost for
that time period was SAR 113.
The lifetime value of the customer is the user contribution
margin multiplied by the average customer life, less the
CAC, or SAR 277.
(c) Management will attempt to grow the company by:
Minimizing the CAC (lower costs or increase the acquired
customer base on the same cost base)
Extend the lifespan
Increase the customer margin
5. Summary
A. This section examined the tech industry as an example of how SME growth
curves are managed. The tech industry was selected since it contains an
inordinate number of start-ups in the new global economy. The key points of
the analysis are:
1) SME growth can be risky since smaller companies are more likely to
experience liquidity problems.
Calculating Customer Value
Annual advertising & platform costs (SAR) 28,000,000
Number of customers acquired 248,000
CAC = 113
Customer lifespan in years = 3
Customer contribution margin* = 130
Lifetime value, per customer =
(lifespan x contr margin) - CAC 277
* Customer revenue - customer variable costs

BV 206: Valuing Small and Medium-Sized Companies Chapter 3 - Managing Growth in an SME
©2020 The Saudi Authority for Accredited Valuers (TAQEEM) 145
2) Growth must be analyzed within the specific industry environment
(a) Examine the interaction of fixed and variable costs as the
company grows
(b) Basic cost accounting procedures can help management avoid
pitfalls.
B. Growth involves the acquisition and retention of customers. Managing growth
requires that the manager be familiar with at least basic tools for valuing a
customer list so that the company can obtain quality customers that maintain
longer business relationships.

BV 206: Valuing Small and Medium-Sized Companies Chapter 3 - Managing Growth in an SME
©2020 The Saudi Authority for Accredited Valuers (TAQEEM) 146
IV. Appendix A - Chapter Review Questions
1. Management is confident that the accounts payable turnover ratio will be 5.5 for each
of the next three years, 2020, 2021, and 2022. What is the project accounts payable
balance in 2022?
A. 3,350,909
B. 1,836,364
C. 2,290,909
D. 1,060,000
2. How can a company grow in value without increasing profits?
A. Increase sales
B. Increase debt
C. Expand the workforce
D. Lower the company’s risk factors
3. Bank of America structures its lending department around long-term corporate loans,
charging monthly fees in a high but acceptable range, with ancillary products such as
offering line of credit financing and money market accounts for cash management
which appeal to mid-sized corporations. Which strategy is Bank of America using?
A. Focus strategy
B. Price leader strategy
C. Separation strategy
D. Product differentiation strategy
4. Which of the following company characteristics best represents a real long-term
competitive advantage?
A. Above-market profitability
Test Company
A/P (SAR) 12/31/2020 12/31/2021 12/31/2022
Revenue 14,970,000 15,500,000 18,430,000
Cost of Sales 9,540,000 10,100,000 12,600,000
Gross Profit 5,430,000 5,400,000 5,830,000

BV 206: Valuing Small and Medium-Sized Companies Chapter 3 - Managing Growth in an SME
©2020 The Saudi Authority for Accredited Valuers (TAQEEM) 147
B. A retail location adjacent to a new housing development
C. The recent hiring of a world-renowned expert in the company’s field
D. A newly issued patent on an influenza drug
5. Which of the following represents balance sheet accounts that should be included in
the calculation of operating working capital?
A. Accounts receivable, inventory, accounts payable
B. Cash, accounts receivable, building improvements
C. Inventory, Accounts payable, current portion of long-term debt
D. Cash, prepaid assets, equity
Answers: 1-C, 2-D, 3-A, 4-D, 5-A
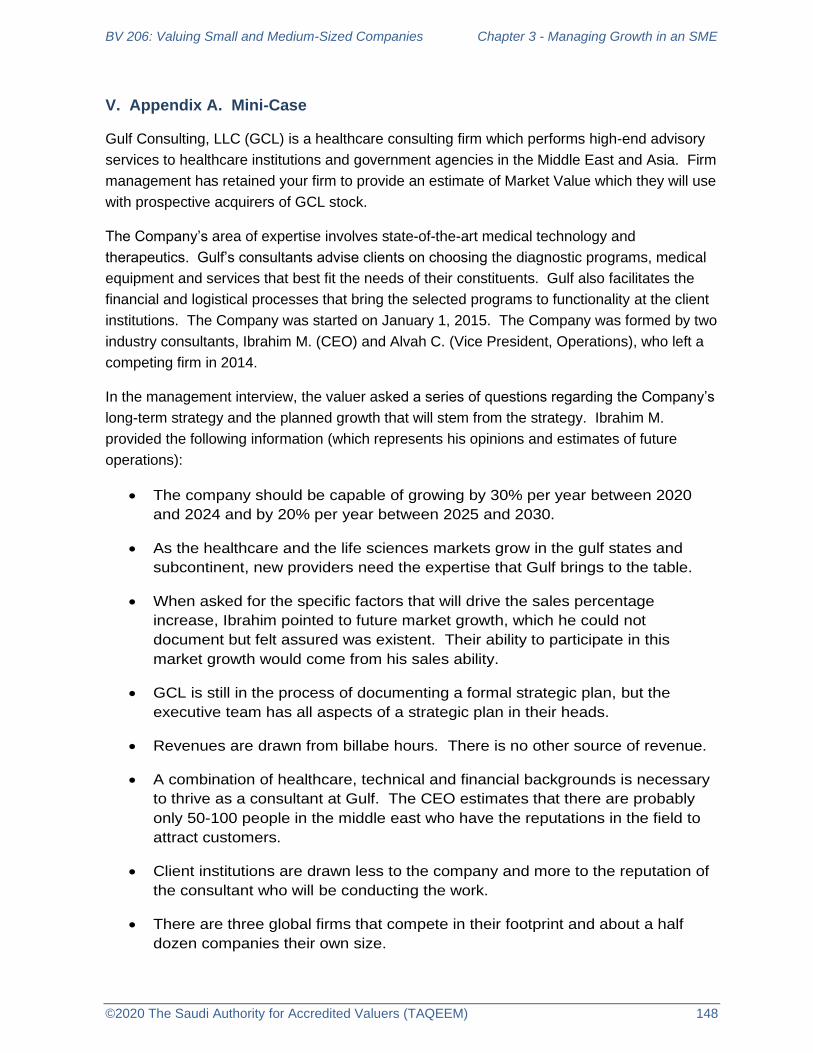
BV 206: Valuing Small and Medium-Sized Companies Chapter 3 - Managing Growth in an SME
©2020 The Saudi Authority for Accredited Valuers (TAQEEM) 148
V. Appendix A. Mini-Case
Gulf Consulting, LLC (GCL) is a healthcare consulting firm which performs high-end advisory
services to healthcare institutions and government agencies in the Middle East and Asia. Firm
management has retained your firm to provide an estimate of Market Value which they will use
with prospective acquirers of GCL stock.
The Company’s area of expertise involves state-of-the-art medical technology and
therapeutics. Gulf’s consultants advise clients on choosing the diagnostic programs, medical
equipment and services that best fit the needs of their constituents. Gulf also facilitates the
financial and logistical processes that bring the selected programs to functionality at the client
institutions. The Company was started on January 1, 2015. The Company was formed by two
industry consultants, Ibrahim M. (CEO) and Alvah C. (Vice President, Operations), who left a
competing firm in 2014.
In the management interview, the valuer asked a series of questions regarding the Company’s
long-term strategy and the planned growth that will stem from the strategy. Ibrahim M.
provided the following information (which represents his opinions and estimates of future
operations):
• The company should be capable of growing by 30% per year between 2020
and 2024 and by 20% per year between 2025 and 2030.
• As the healthcare and the life sciences markets grow in the gulf states and
subcontinent, new providers need the expertise that Gulf brings to the table.
• When asked for the specific factors that will drive the sales percentage
increase, Ibrahim pointed to future market growth, which he could not
document but felt assured was existent. Their ability to participate in this
market growth would come from his sales ability.
• GCL is still in the process of documenting a formal strategic plan, but the
executive team has all aspects of a strategic plan in their heads.
• Revenues are drawn from billabe hours. There is no other source of revenue.
• A combination of healthcare, technical and financial backgrounds is necessary
to thrive as a consultant at Gulf. The CEO estimates that there are probably
only 50-100 people in the middle east who have the reputations in the field to
attract customers.
• Client institutions are drawn less to the company and more to the reputation of
the consultant who will be conducting the work.
• There are three global firms that compete in their footprint and about a half
dozen companies their own size.

BV 206: Valuing Small and Medium-Sized Companies Chapter 3 - Managing Growth in an SME
©2020 The Saudi Authority for Accredited Valuers (TAQEEM) 149
• The company’s most renowned and productive consultant, Sayed K. resigned
during 2019. The company has not yet replaced him but is looking for
candidates.
• Gulf uses mainly full-time consultants but has some employee consultants who
work part-time. Subcontractors are used as needed with assignments that
cannot be covered by full-time personnel.
• Production statistics by billable hour for the last four years are shown below as
well as projected year-end hours by employee for 2020. Note that these
projections were made by management.

BV 206: Valuing Small and Medium-Sized Companies Chapter 3 - Managing Growth in an SME
©2020 The Saudi Authority for Accredited Valuers (TAQEEM) 150
• The income statements and balance sheets are shown below:
Gulf Consultants, LLC
Employee Production Analysis - Billable Hours
2016 2017 2018 2019 2020P
Employees
Ahmed R. - - - - 295
Tariq L. - - - 122 -
Horvald P. - - 289 1,459 857
Grendel M. 1,424 1,133 1,641 1,809 905
Francois P. 834 939 592 - -
Mohammed M. - - - - 58
Michel N. 1,541 1,518 1,969 1,967 1,706
Khaled P. 1,284 288 - - -
Gunther S. 397 825 939 1,049 1,716
Turki M. - 215 - 596 266
Noora M. - 243 1,787 1,580 1,692
Sayed K. 1,942 1,341 1,575 1,907 581
Abdullah S. 1,593 1,437 1,310 1,358 1,289
Merrick T. - - 628 395 254
Abdul R. - - 949 879 2,393
Sala R. 780 - - - -
Total Empl Hours Billed 9,795 7,939 11,679 13,121 12,012
Subcontractors
Subcontractor 1 - - 240 - -
Subcontractor 2 227 - 48 - -
Subcontractor 3 - - - - 185
Subcontractor 4 - - 74 - -
Subcontractor 5 298 396 - - -
Subcontractor 6 1,398 677 59 6 214
Subcontractor 7 620 411 703 6 -
Subcontractor 8 - - - 2 -
Subcontractor 9 - 23 60 - -
Subcontractor 10 - - - 11 -
Subcontractor 11 - - 91 6 -
Subcontractor 12 - - 76 79 108
Subcontractor 13 - - - 1,978 262
Subcontractor 14 - 195 36 - -
Subcontractor 15 - - - 779 828
Total Sub Hours Billed 2,543 1,702 1,387 2,867 1,596
Total hours billed 12,338 9,641 13,066 15,988 13,608
Average rate per hour 789.41 933.75 1,025.15 1,164.97 n/a

BV 206: Valuing Small and Medium-Sized Companies Chapter 3 - Managing Growth in an SME
©2020 The Saudi Authority for Accredited Valuers (TAQEEM) 151
Gulf Consultants, LLC
Historical Income Statements (SAR)
Revenue 2015 2016 2017 2018 2019 2015 2016 2017 2018 2019
Service fee 8,899,815 9,739,766 9,002,318 13,394,651 18,625,489 100.0% 100.0% 100.0% 100.0% 100.0%
Reimbured expenses 1,149,165 1,182,739 1,132,043 1,304,066 1,498,013 12.9% 12.1% 12.6% 9.7% 8.0%
Total Revenue 10,048,980 10,922,505 10,134,360 14,698,718 20,123,501 112.9% 112.1% 112.6% 109.7% 108.0%
General and Admin Expenses
Salaries & wages 4,094,858 6,231,799 7,052,861 7,000,103 7,115,846 46.0% 64.0% 78.3% 52.3% 38.2%
Employee benefit programs 606,098 824,078 944,348 976,804 1,054,069 6.8% 8.5% 10.5% 7.3% 5.7%
Outside services 1,029,825 462,195 287,884 559,463 1,563,484 11.6% 4.7% 3.2% 4.2% 8.4%
Project overhead 146,636 14,929 6,465 18,731 246,525 1.6% 0.2% 0.1% 0.1% 1.3%
Reimbursed expenses 980,625 1,127,959 1,127,134 1,197,810 1,441,853 11.0% 11.6% 12.5% 8.9% 7.7%
Management fee - - - 1,336,110 1,928,310 0.0% 0.0% 0.0% 10.0% 10.4%
Office expense 86,576 157,466 186,154 226,451 359,149 1.0% 1.6% 2.1% 1.7% 1.9%
Travel & entertainment 315,038 471,506 488,895 1,001,295 1,019,516 3.5% 4.8% 5.4% 7.5% 5.5%
Training 80,494 128,610 79,628 80,164 109,504 0.9% 1.3% 0.9% 0.6% 0.6%
Miscellaneous 65,175 88,001 57,713 135,761 122,074 0.7% 0.9% 0.6% 1.0% 0.7%
Total G&A Expenses 7,405,324 9,506,543 10,231,080 12,532,691 14,960,329 83.2% 97.6% 113.6% 93.6% 80.3%
EBITDA 2,643,656 1,415,963 (96,720) 2,166,026 5,163,173 29.7% 14.5% -1.1% 16.2% 27.7%
Depreciation - - 17,460 - - 0.0% 0.0% 0.2% 0.0% 0.0%
Operating income 2,643,656 1,415,963 (79,260) 2,166,026 5,163,173 29.7% 14.5% -0.9% 16.2% 27.7%
Percent of Service Fees
Gulf Consultants, LLC
Historical Balance Sheets (SAR)
ASSETS 2015 2016 2017 2018 2019 2015 2016 2017 2018 2019
Current Assets
Cash 2,025,731 2,203,988 4,083,435 4,351,868 5,975,933 43.5% 41.8% 75.5% 64.9% 57.9%
Accounts receivable 2,064,705 3,065,374 1,159,448 1,750,196 3,920,070 44.3% 58.2% 21.4% 26.1% 38.0%
Due from employee 569,520 - 168,750 600,000 393,750 12.2% 0.0% 3.1% 9.0% 3.8%
Total Current Assets 4,659,956 5,269,361 5,411,633 6,702,064 10,289,753 100.0% 100.0% 100.0% 100.0% 99.7%
Fixed Assets, net
Buildings and other depreciable assets - - 17,460 17,460 50,153 0.0% 0.0% 0.3% 0.3% 0.5%
Less: accumulated depreciation - - (17,460) (17,460) (17,460) 0.0% 0.0% -0.3% -0.3% -0.2%
Net property, plant & equip - - - - 32,693 0.0% 0.0% 0.0% 0.0% 0.3%
TOTAL ASSETS 4,659,956 5,269,361 5,411,633 6,702,064 10,322,445 100.0% 100.0% 100.0% 100.0% 100.0%
LIABILITIES & EQUITY
Current Liabilities
Accounts payable 56,006 - 375 10,744 2,019,390 1.2% 0.0% 0.0% 0.2% 19.6%
Other current liab - - 265,748 287,828 310,834 0.0% 0.0% 4.9% 4.3% 3.0%
Total Current Liabilities 56,006 - 266,123 298,571 2,330,224 1.2% 0.0% 4.9% 4.5% 22.6%
Total Liabilities 56,006 - 266,123 298,571 2,330,224 1.2% 0.0% 4.9% 4.5% 22.6%
Shareholder Equity
Retained earnings 4,603,950 5,269,361 5,145,510 6,403,493 7,992,221 98.8% 100.0% 95.1% 95.5% 77.4%
Total Equity 4,603,950 5,269,361 5,145,510 6,403,493 7,992,221 98.8% 100.0% 95.1% 95.5% 77.4%
TOTAL LIABILITIES & CAPITAL 4,659,956 5,269,361 5,411,633 6,702,064 10,322,445 100.0% 100.0% 100.0% 100.0% 100.0%
Percent of Total Assets
BV 206: Valuing Small and Medium-Sized Companies Chapter 3 - Managing Growth in an SME
©2020 The Saudi Authority for Accredited Valuers (TAQEEM) 152
Questions:
1. What value drivers will allow GCL to achieve its planned growth?
2. Which components, if any, is GCL missing from a strategic plan?
3. Given the spreadsheets in File “Gulf.Consultants”, and using the yellow-shaded cells,
project revenues and profits for GCL over the next five years given the following
additional information:
A. The valuation date is December 31, 2019. All information provided above is
through 12/31/19.
B. Management expects that the maximum billable rate for its consultants will be
SAR 1,200 per hour in the future.
C. Projected billable hours for 2020 are the opinion of management, based on the
hiring and the success of two new full-time consultants as well as the continued
success of existent consultants.
D. After 2020 assume the company is able to add two consultants per year, net.
4. List the questions that you would ask of GCL’s management team if you were actually
conducting this valuation.

BV 206: Valuing Small and Medium-Sized Companies Chapter 4 - Calculating the Cost of Capital of SME’s
©2020 The Saudi Authority for Accredited Valuers (TAQEEM) 153
Chapter 4. Calculating the Cost of Capital of
SMEs
I. Chapter Overview
1. Overview of the elements of the cost of capital
2. Common mistakes in SME valuations
3. Survivability and Sustainability
4. Risk measurement
A. Size risk
B. Total beta
5. Capital structure
A. Target or actual
B. Changing capital structure over time
6. The Discounted Cash Flow Model
A. Terminal value
B. Sustainability and survivability
II. Overview of the cost of capital
1. The elements of the cost of capital were introduced in BV 201 and 202 and were
reviewed again in Chapter 1. Key terms that should be familiar:
A. Risk-free rate
B. Systematic risk and beta
C. Equity risk premium
D. Unsystematic risk
1) Size risk premium
2) Specific risk premium
E. Cost of equity
BV 206: Valuing Small and Medium-Sized Companies Chapter 4 - Calculating the Cost of Capital of SME’s
©2020 The Saudi Authority for Accredited Valuers (TAQEEM) 154
F. Cost of debt
G. Capital structure
H. Weighted average cost of capital
I. Discounted cash flow model
1) Discrete forecast
2) Residual or Terminal Value
III. Common mistakes in SME Valuations
1. Focus on forecasting revenue and profits only
A. No attention given to specific expense forecast
B. No attention given to reinvestment requirements
2. Short-term forecasts
A. Since SMEs are more volatile and may expect erratic short-term operations,
many valuers cut short the discreet forecast. This is not a valid way to deal with
the volatility.
B. With private equity and venture valuations, the discreet forecast is usually set to
match the investor’s desired holding period, not the time period over which the
subject company will reach stabilization.
3. Using market multiples in the residual calculation
A. This is common in private equity and venture capital analyses. A multiple of
EBITDA or revenues three years out from the valuation date based on current
market multiples is questionable.
1) There is no analysis to support that the SME will be stable at end of
discreet forecast.
2) There is no analysis to support that the SME will be comparable to the
industry source from which the multiple was derived.
3) There is no support that the industry multiple at the valuation date will
equal the industry multiple at the time of the terminal year calculation.
4) There is no support that the quantification of the multiple is valid.

BV 206: Valuing Small and Medium-Sized Companies Chapter 4 - Calculating the Cost of Capital of SME’s
©2020 The Saudi Authority for Accredited Valuers (TAQEEM) 155
4. All risks are captured in the discount rate
A. While it is true that basic valuation principles teach that growth is reflected in
the revenues or cash flows (the numerator) and risk is reflected in the cost of
equity or capital (the denominator) it is very difficult to capture all SME risk in
the discount rate.
1) Volatility of earnings
2) Sustainability of earnings
3) Survivability
5. Use of arbitrary benchmarks to apportion value among fractional interests
A. Discounts for lack of control and marketability were covered in 201 and 204.
B. Analysts too often use average discounts or benchmarks from empirical studies
without comparing the subject interest against the data points in the study.
IV. Sustainability and Survivability
1. As was discussed in the prior section, only 20% of new companies survive the first five
years of operation. When valuing an SME in its start-up phase, the high risk of failure
must be calculated.
2. As discussed in Chapter 2, venture capital firms account for the survival risk in their
high expected return rates.
A. The expectation among VC firms that many of their investments will fail to
return anything (i.e. the subject company failed) is reflected in a comparison of
the expected rate of return to the actual rates of return in VC firms:
Scherlis &
Stage of Development Plummer Sahlman Bygrave
Seed-stage 50% - 70% 50% - 70% 60% - 80%
Early-stage 40% - 60% 40% - 60% 40%
Expansion-stage 35% - 50% 30% - 50% 30%
Later-stage 25% - 35% 20% - 30% 25%
Venture Capital Expected Rates of Return

BV 206: Valuing Small and Medium-Sized Companies Chapter 4 - Calculating the Cost of Capital of SME’s
©2020 The Saudi Authority for Accredited Valuers (TAQEEM) 156
1) When VC firms invest, they assume ownership percentages based on
expected rates of return of 25% to 70%. The actual returns though
average in the 10% to 17% percent range.
(a) These returns rates represent total returns from a portfolio, not
returns on individual companies.
2) The difference in rates illustrates that survival risk is built into the VC
expected rates of return.
3) A high discount rate lowers the pre-money value of the firm. The VC
investment therefore becomes a larger percentage of the post-money
valuation.
3. Aswath Damodaran, in his book The Dark Side of Valuation, discusses problems with
early-stage valuations, especially in venture capital analyses:
A. Revenues and profits are forecast with no attention to forecasting expenses
and reinvestment (discussed in Chapter 3).
B. Projection periods are often shortened to three years to match an investor’s
holding period or to allow using a market multiple in the residual calculation.
1) It is unlikely the ESC will reach a stable level after only three years.
2) The VC rates of return used to discount the years in the discrete
forecast include a risk of failure, which remains constant. In fact, the
survivability factor actually increases each year the company remains in
business, meaning that the longer a company remains in operation, the
better its chance for long-term survial (which decreases risk).
(a) The discount rate, especially in ESCs, will therefore change
each year.
C. Using a post-money value is valid only if the VC’s invested cash remains on the
company’s balance sheet for reinvestment and paying operating expenses,
which support growth. If the money is paid out in management fees or
Stage of Development 5 -year 10-year 20-year
Seed-stage 5.0% 32.9% 21.4%
Balanced VC 11.9% 14.4% 14.7%
Later-stage VC 11.1% 8.5% 14.5%
All VC firms 8.8% 16.6% 16.9%
Damodaran, "Valuing Young, Start-up, Growth Companies: Estimation Issues" NYU, Stern
Returns Earned by VC Firms

BV 206: Valuing Small and Medium-Sized Companies Chapter 4 - Calculating the Cost of Capital of SME’s
©2020 The Saudi Authority for Accredited Valuers (TAQEEM) 157
distributions, which is often the case with private equity firms, then the post-
money valuation (and the percentage ownerships derived from it) is invalid.
4. Damodaran: Two DCF Models for ESCs
A. Top down model – Discussed in Chapter 3 as the Sales Forecast
1) Define total market – size at valuation date and its evolution in the
foreseeable future
2) Define subject’s market share and its growth or decline over time
3) Project sales
4) Project income statement expenses that support sales
5) Project reinvestment in working capital and fixed assets
6) Project equity and/or debt capital that needs to be raised.
7) Reinvestment sanity check
(a) A common flaw in this method is a disconnect between the
amounts invested in working capital and fixed assets and the
sales forecast. To check, Damodaran advises calculating a
return on capital and checking it against industry norms
(discussed in Chapter 3 in context of financial ratio projection).
Example:
In the above example, the analyst projected a total
investment (upfront investment, working capital and
capex) of SAR 3,215,000 between 2020 and 2027. The
projected NOPAT in 2027 is SAR 185,000, for a return on
Projected NOPATReturn on Capital =
Total Capital Invested
Imputed Return on Capital (SAR)
2020 2021 2022 2023 2024 2025 2026 2027
Initial Investment 100,000
Working Capital Investment 75,000 80,000 90,000 110,000 125,000 150,000 160,000
Capital Investment 25,000 150,000 200,000 400,000 450,000 500,000 600,000
Total Invested 100,000 100,000 230,000 290,000 510,000 575,000 650,000 760,000
Cumulative Investment 3,215,000
Projected NOPAT, 2027 = 185,000
Projected ROIC = 5.75%
Industry ROIC = 14.00%

BV 206: Valuing Small and Medium-Sized Companies Chapter 4 - Calculating the Cost of Capital of SME’s
©2020 The Saudi Authority for Accredited Valuers (TAQEEM) 158
invested capital ratio of 5.75%. The industry norm (taken
from industry surveys) is 14.0%.
Barring some non-recurring issue with profitability in
2027, the disconnect in ROIC (5.75% versus 14.0%)
indicates that the projected investment either is not
justified or is overstated by the analyst.
The assumptions underlying reinvestment should be
revisited since the profits being generated at the end of
the forecast do not justify the amounts being invested.
B. Bottom-up Approach
1) This method was discussed in Chapter 2 in the context of an analysis of
projecting unit sales given varying capacity levels.
2) It is better-suited with companies that will have difficulty raising capital or
companies that are dependent on a key person such as professional
practices.
V. Calculating the Cost of Equity in ESCs
1. The Risk-free Rate
A. The risk-free rate was discussed at length in BV 201 and 202.
B. The rate represents the return the investor could obtain without accepting any
risk.
1) The yield to maturity on long-term government bonds is usually applied
as the risk-free rate. (technically, even government bonds bear risk, but
since the government can print money, they are considered risk-free).
2) The risk-free rate is a variable that will not change whether the subject
company is an established operation or a start-up company.
2. Beta
A. Measures systematic risk – the concept of the beta was introduced in BV 202.
It captures the stock’s systematic, or non-diversifiable risk. An assumption of
the capital asset pricing model (CAPM) is that all diversifiable risk has been
diversified away in a portfolio of stocks. All that is left is the non-diversifiable
risk, which is captured in the beta.
1) Non-diversifiable risk is the risk that all companies in the economy face,
such as climate change, world war, pandemics, etc.

BV 206: Valuing Small and Medium-Sized Companies Chapter 4 - Calculating the Cost of Capital of SME’s
©2020 The Saudi Authority for Accredited Valuers (TAQEEM) 159
2) A key assumption is that a good proxy for this systematic risk is a
stock’s volatility as measured against the market volatility. The beta is
measured as:
3) Since valuers are deriving a cost of equity for a single stock – not a
diversified portfolio of stocks – they must account for the diversifiable
risk. This requires the addition of the specific risk premium (also
referred to as Alpha) to the CAPM.
4) The market beta therefore only measures the additional market risk that
the company adds to a diversified portfolio.
5) Obviously an early-stage private company has no published beta and
the valuer may have a difficult time applying an industry beta to a small
company.
6) It is also difficult to esimate specific risk for an ESC. Quantifying specific
risk has been a long-term goal of the valuation profession.
B. Total beta
1) First presented by Aswath Damodaran, the total beta estimates total
risk, or both systematic and unsystematic risk.
2) His observation was simply that total risk (both systematic and
unsystematic) is captured in the ratio of a stock’s standard deviation of
returns over the market’s standard deviation of returns.
3) By algebraically manipulating the formula above, Damodaran expresses
total beta as follows:
IF:
σy
σx Where:
βm = Market beta
R = correlation coefficient (i.e. how much of the stock's
performance that is explained by the market's performance)
σy = standard deviation of a stock's returns
σx = standard deviation of the market's returns
βm = R
σy
σx
βm = R

BV 206: Valuing Small and Medium-Sized Companies Chapter 4 - Calculating the Cost of Capital of SME’s
©2020 The Saudi Authority for Accredited Valuers (TAQEEM) 160
THEN:
4) Damodaran calculates and updates total beta for 106 different industries
in the U.S. A subset of his latest data as of January, 2020 on total beta
is shown below:
5) Theoretically, the valuer could insert the levered total beta (or the
unlevered total beta, relevered with a target capital structure) into the
CAPM in place of the market beta. This would capture all unsystematic
and systematic risk and remove the need for a separate subjective
measurement of specific risk.
6) An example of the cost of equity using total beta, assuming a risk-free
rate of 3.0% and an ERP of 5.0% is shown below:
βm
RTotal Beta =
Total Betas By Industry Sector
Aswath Damodaran
Advertising 47 0.93 1.44 17.51% 5.34 8.22
Apparel 51 0.83 1.06 22.58% 3.67 4.67
Auto & Truck 13 0.53 1.10 30.21% 1.74 3.63
Banks (Regional) 611 0.43 0.57 30.58% 1.41 1.85
Beverage (Soft) 34 1.09 1.22 18.95% 5.76 6.43
Building Materials 42 1.02 1.23 38.84% 2.62 3.17
Chemical (Basic) 43 0.99 1.37 24.03% 4.13 5.69
Engineering/Construction 54 1.33 1.60 31.83% 4.16 5.02
Farming/Agriculture 31 0.63 0.89 25.10% 2.50 3.56
Food Processing 88 0.70 0.88 19.31% 3.61 4.53
Food Wholesalers 17 0.66 0.87 24.48% 2.69 3.55
Household Products 127 0.94 1.03 16.50% 5.68 6.24
Information Services 69 1.03 1.09 35.68% 2.89 3.06
Oil/Gas (Production and Exploration) 269 1.08 1.48 21.54% 5.00 6.86
Restaurant/Dining 77 0.75 0.97 22.61% 3.33 4.30
Retail (General) 18 0.95 1.14 32.60% 2.90 3.51
Retail (Grocery and Food) 13 0.35 0.59 16.34% 2.11 3.60
Total Market 7053 0.83 1.13 26.26% 3.16 4.30
Total Market (without financials) 5878 1.01 1.21 25.37% 3.99 4.77
as of January, 2020
IndustryAverage Correlation
with the Market
Average
Leveraged Beta
Total Unlevered
Beta
Total Levered
Beta
Avg. Unlevered
Beta# Firms

BV 206: Valuing Small and Medium-Sized Companies Chapter 4 - Calculating the Cost of Capital of SME’s
©2020 The Saudi Authority for Accredited Valuers (TAQEEM) 161
(a) The chart shows a changing cost of equity for the same
company as it grows between 2020 and 2029.
(b) This example assumes a changing risk profile as shown by the
changing market correlation, discussed further below. An
evolving risk profile is the norm for ESCs.
7) There are several challenges with the application of total beta:
(a) The total betas measured above are for industries, not
companies. Therefore, the valuer cannot assume that the 2.84
beta for the farming industry can be applied to a farming
company in the United States.
(b) The total betas measured above are for industries in the United
States. We cannot assume that the data transfers to other
countries.
(c) Some of the industry measurements may not include enough
companies to warrant application.
(d) Note that many of the industry total betas reflected on the table
on the prior page would yield costs of equity well above normally
accepted ranges for the cost of equity, given Damodaran’s
estimated equity risk premium as of 2020. For example, a food
processor’s cost of equity would equal:
Ke = 3.0% + 4.53(5.43%)
= 27.6%
Cost of Equity Using Total Beta
Aswath Damodaran Market Cost of
# Firms Market β Correlation (R) Total β Equity
2020 1.15 0.40 2.88 17.4%
2021 1.15 0.40 2.88 17.4%
2022 1.15 0.50 2.30 14.5%
2023 1.15 0.50 2.30 14.5%
2024 1.15 0.65 1.77 11.8%
2025 1.15 0.65 1.77 11.8%
2026 1.15 0.80 1.44 10.2%
2027 1.15 0.80 1.44 10.2%
2028 1.15 0.80 1.44 10.2%
2029 1.15 0.80 1.44 10.2%
Damodaran Example. Assuming risk-free rate of 3% and ERP of 5%

BV 206: Valuing Small and Medium-Sized Companies Chapter 4 - Calculating the Cost of Capital of SME’s
©2020 The Saudi Authority for Accredited Valuers (TAQEEM) 162
While not outside the realm of possibility since it includes
systematic and unsystematic risk (i.e. no need for additional size
or specific risk premium), it is near VC rates of return. Other
total betas for mature industries (advertising, household
products, building materials) would yield return rates in the
35.0% to 50.0% range.
8) Damodaran indicates that total beta is appropriate for an investor who is
100% invested in his or her business and has no other investments.
(a) As venture capitalists gain ownership, or as ownership becomes
more diversified with professional investors who have broad-
based investments in the overall market, the total beta should be
replaced with the traditional market beta.
Note that Damodaran does not automatically assume that
owners are 100% invested in solely the subject company,
as has been assumed in the presentation of prior
valuation courses. He assumes that companies are
larger and owned in diversified portfolios unless
otherwise documented.
9) Two researchers, Peter Butler and Keith Pinkerton, took Damodaran’s
simple concept and developed it into a more complicated model for
application in private company valuation. This model generated a great
deal of debate during 2005 through 2010.
(a) The model is used to develop a total cost of equity and company
specific risk premiums. Even today it generates mixed
acceptance by valuation practitioners.
Damodaran has generally stayed out of the controversy,
stating that his original observation, and his updated
industry calculations, stand on their own merits.
(b) The Butler-Pinkerton Model is available from BVResources.com.
It has approximately 100 subscribers, a fairly low usage level
among U.S. valuation practitioners.
See: https://www.bvresources.com/products/butler-
pinkerton-calculator.
3. Equity Risk Premium
A. The equity risk premium is a constant whether valuring small or large
companies. The derivation of the ERP, whether it is an historical measurement
BV 206: Valuing Small and Medium-Sized Companies Chapter 4 - Calculating the Cost of Capital of SME’s
©2020 The Saudi Authority for Accredited Valuers (TAQEEM) 163
or supply-side measurement, and its estimation in different countries, was
covered in BV 202 and 204.
1) The equity risk premium is the return required by investors for investing
in large cap equity stocks above the risk free rate.
4. Specific Company Risk
A. Company specific risk is what has been referred to as unsystematic risk in this
outline. It represents the risk that would mostly get diversified away in a stock
portfolio. The application of the total beta, discussed above, is one way of
dealing with specific risk.
1) Since we assume the investor has only a single investment – the
subject company being appraised – then we do not assume that the
unsystematic risk has been diversified and therefore must be separately
accounted for.
(a) Most specific risk can be accounted for as size risk, which is
discussed in a separate section, below.
2) It should be noted that under some circumstances, specific risk may be
left out of the analysis.
(a) Damodaran only considers specific risk if the client answers the
description above – that the company is owned by a shareholder
or shareholders who do not own other investments.
(b) If the subject company is owned as part of a professionally
diversified stock portfolio however, and the assignment is to
value the company as part of that portfolio, then the specific
company risk may not be included in the CAPM.
VI. Measuring Size Risk
1. Size Studies in the United States
A. Duff & Phelps Size Premium Studies
1) These studies were introduced in BV 202 and 204 and are briefly
reviewed here.
2) Research from U.S. academics and practitioners going back to the
1960s shows a relationship between size and historical equity returns.
The international financial services firm, Duff & Phelps, has most
recently conducted comprehensive studies of the size effect in the
United States.

BV 206: Valuing Small and Medium-Sized Companies Chapter 4 - Calculating the Cost of Capital of SME’s
©2020 The Saudi Authority for Accredited Valuers (TAQEEM) 164
(a) The relationship between size and returns is negative. As size
decreases, required rates of return increase.
(b) The size to risk relationship is linear and consistent year to year
over all definitions of size. Given the breadth and robustness of
the studies’ results, it is difficult to deny that the smaller a
company is in the U.S. market, the riskier it is.
3) If the size premium studies are relevant in the United States, why can’t
they be automatically used in other countries?
(a) Market forces in other countries will differ depending on the type
of economic system.
For example, China has a form of state-influenced
capitalism. A small company there might be a state
owned enterprise, or, if privately-owned, might enjoy
government protections that a similar company would not
get in the U.S., depending on how that company fits into
the objectives of the Chinese Communist Party.
4) Opinions differ on how firm size should be defined with the assumption
that market capitalization (number of outstanding shares x price per
share) is an adequate proxy.
(a) Duff & Phelps, in order to avoid academic arguments over size
definition, includes both market and accounting-based
determinants of size, including: 1) market capitalization; 2) book
value of equity; 3) 5-year average net income; 4) market value of
invested capital; 5) total assets; 6) 5 -year average EBITDA; 7)
sales; 8) number of employees.
(b) The D&P annual publication includes two sets of studies on each
of the eight size definitions above. (the study results are no
longer published in book form but are available through online
subscription.)
https://www.duffandphelps.com/insights/publications/cost-of-capital
The first set of eight studies present the data as the
“Premia Over the Risk-Free Rate”. These size premiums
are used by valuers who are applying the “Build-Up”
model which excludes beta and derives the cost of equity
by adding the risk-free rate, the ERP, and specific risk.

BV 206: Valuing Small and Medium-Sized Companies Chapter 4 - Calculating the Cost of Capital of SME’s
©2020 The Saudi Authority for Accredited Valuers (TAQEEM) 165
Since this study set includes the ERP in the
premium, the size premium is added to the risk-
free rate to arrive at the cost of equity.
The second set of studies provides the “Premia Over the
CAPM” meaning that it should be used in the capital
asset pricing model as a proxy for all, or most, of the
specific risk. This set of studies use the same eight
definitions of size.
5) An example of how the Studies are used is shown below. The data is
abridged and taken from an older study for copyright reasons.
(a) Three of the eight studies are shown below. The valuer would
normally use all eight studies, or as many of them are relevant.
(b) The studies are used in both the income and market approach.
In the income approach, the valuer would locate the
subject company in the appropriate portfolio and consult
the corresponding smoothed size premium.
In the case below, the subject fell in portfolio 24 in
each study. A size premium for the CAPM might
justifiably be in the 5.5% range.
Duff & Phelps provides the regression equation
for each study to pinpoint the subject on the scale
and avoid approximation with the following:
(Premium = Constant – X coefficient * Log (subject operating metric)
In the market approach, the valuer can use the Studies to
calculate a risk adjustment to a guideline public company
multiple:
Assume the GPC falls into portfolio #5 and the relevant
size premium for that GPC is 2.25%. The subject
company’s size premium is 5.50%, with a differential of
3.25%.
As discussed in 202, the guideline company’s multiple
would be inverted, the differential of 3.25% would be
added to the inversion, and then that new cap rate would
be inverted back.

BV 206: Valuing Small and Medium-Sized Companies Chapter 4 - Calculating the Cost of Capital of SME’s
©2020 The Saudi Authority for Accredited Valuers (TAQEEM) 166
Average Mkt
Value Smoothed Premium
Portfolio ($ millions) Over CAPM
1 178,744 -1.07%
2 53,000 0.29%
3 32,537 0.84%
4 24,601 1.16%
5 17,777 1.52%
. . .
. . .
. . .22 868 4.91%
23 639 5.25%
24 412 5.74%
25 132 7.03%
Average
Total Assets Smoothed Premium
Portfolio ($ millions) Over CAPM
1 149,065 0.71%
2 47,360 1.57%
3 33,350 1.84%
4 24,076 2.08% Mkt Value = 5.7%
5 16,808 2.35%
. . . Assets = 5.2%
. . .
. . . Sales = 5.1%
22 745 4.70%
23 585 4.88%
24 392 5.19%
25 132 6.01%
Average Sales Smoothed Premium
Portfolio ($ millions) Over CAPM
1 120,333 1.52%
2 40,618 2.18%
3 22,774 2.54%
4 16,014 2.75%
5 12,063 2.93%
. . .
. . .
. . .22 711 4.65%
23 552 4.81%
24 371 5.05%
25 120 5.74%
BV 206: Valuing Small and Medium-Sized Companies Chapter 4 - Calculating the Cost of Capital of SME’s
©2020 The Saudi Authority for Accredited Valuers (TAQEEM) 167
Assume the GPC multiple is 9.0x
Its cap rate is therefore 11.11%. Assuming no
other differences, we would add the size premium
differential of 3.25% to get 14.36% (11.11% +
3.25%).
The 14.36% is inverted back to a revised multiple
of 6.96x.
The guideline company is larger and less risky
because of its larger size. The studies quantify
that size risk differential as 3.25%. If we add this
to the guideline company’s cap rate and invert
back, the result is the relevant market multiple for
the smaller, more risky subject company.
6) Problems with the U.S. Size Study
(a) Although the data is linear and consistent over time, it applies to
the U.S. markets only.
(b) The data cannot with confidence be transferred to other markets
in other countries.
2. European Size Premium Studies
A. A risk premium study similar to the D&P U.S. study has been conducted in the
European markets by Professor Erik Peek of the Rotterdam School of
Management, Erasmus University, in conjunction with Duff & Phelps.
1) The European studies do not establish the same linear relationship
between size and risk in the European market as is seen in the U.S.
studies.
2) However, there is a consistent indication of size risk in the smallest
portfolio of companies.
B. Peeks studied the following 17 countries: Austria, Belgium, Denmark, Finland,
France, Germany, Greece, Ireland, Italy, Luxembourg, The Netherlands,
Norway, Portugal, Spain, Sweden, Switzerland, the United Kingdom.
1) These countries have largely behaved as an integrated market over the
past 25 years.
(a) However, the European countries do not have the same degree
of integration as the U.S. market.

BV 206: Valuing Small and Medium-Sized Companies Chapter 4 - Calculating the Cost of Capital of SME’s
©2020 The Saudi Authority for Accredited Valuers (TAQEEM) 168
Two of the 17 countries above, Norway and Switzerland,
are not in the European Union.
13 other countries that are not in Peek’s studies are in
the European Union.
(b) Data in the U.S. market goes back to 1926. Similar
comprehensive market data does not exist for the European
countries. The European Size study looks at returns from 1990
onward.
The European Study relies on the Worldscope and
Datastream databases. Worldscope provides accounting
data on companies and Datastream provides market and
return data. Not all companies are on both databases.
(c) The European Study excludes the following companies:
Companies in the financial services industries
Firms that traded on less then 5% of the trading days in a
year
Firms with less than three years of price history
Firms with sales less than €1 million in any of the three
prior years
Firms with high financial risk, with financial risk defined
as:
Negative book equity in any of the three prior
years
Negative 3-year average EBITDA, EBIT, or net
income in any of the three prior years
These high financial risk firms are excluded from the
main study but are included in a separate presentation.
The study included 40,786 companies:
All firms studied 79,773
Less:
Start-up firms (21,699)
Thinly traded firms (1,295)
Hi-risk firms (15,993)
Lo-risk firms in study 40,786

BV 206: Valuing Small and Medium-Sized Companies Chapter 4 - Calculating the Cost of Capital of SME’s
©2020 The Saudi Authority for Accredited Valuers (TAQEEM) 169
(d) The objective of excluding so many smaller companies with
these risks is to see if size risk existed in small – but healthy –
companies that would typically exist in stock portfolios.
(e) The companies in the study are not evenly spread over the 17
countries. About 60% of the Study focuses on just three
countries: the UK, France and Germany:
(f) Similar to the U.S. Studies, current data is not available for
reprint in these materials but is available online. A recent study
on the European size premium risk is shown below.
(g) There is only one definition of size, market capitalization. The
consolidated markets are presented in ten different portfolios
Country % Companies
UK 32.7%
France 15.7%
Germany 11.0%
Switzerland 5.0%
Sweden 4.7%
Italy 4.5%
Netherlands 4.4%
Greece 4.3%
Denmark 3.3%
Spain 3.2%
Finland 2.7%
Norway 2.4%
Belgium 2.3%
Austria 1.5%
Ireland 1.1%
Portugal 1.1%
Luxembourg 0.1%
European Size Premium Study
Professor Erik Peek/Duff & Phelps
2014
Average Mkt
Value Premium Premium
Portfolio (€ millions) Over Risk-free Over CAPM
1 161,452 4.53% 0.57%
2 3,838 5.88% 1.36%
3 1,262 5.82% 1.12%
4 505 6.38% 1.86%
5 227 6.44% 2.00%
6 120 6.92% 2.61%
7 67 8.08% 3.90%
8 37 7.51% 3.03%
9 19 10.11% 5.63%
10 8 16.49% 11.10%
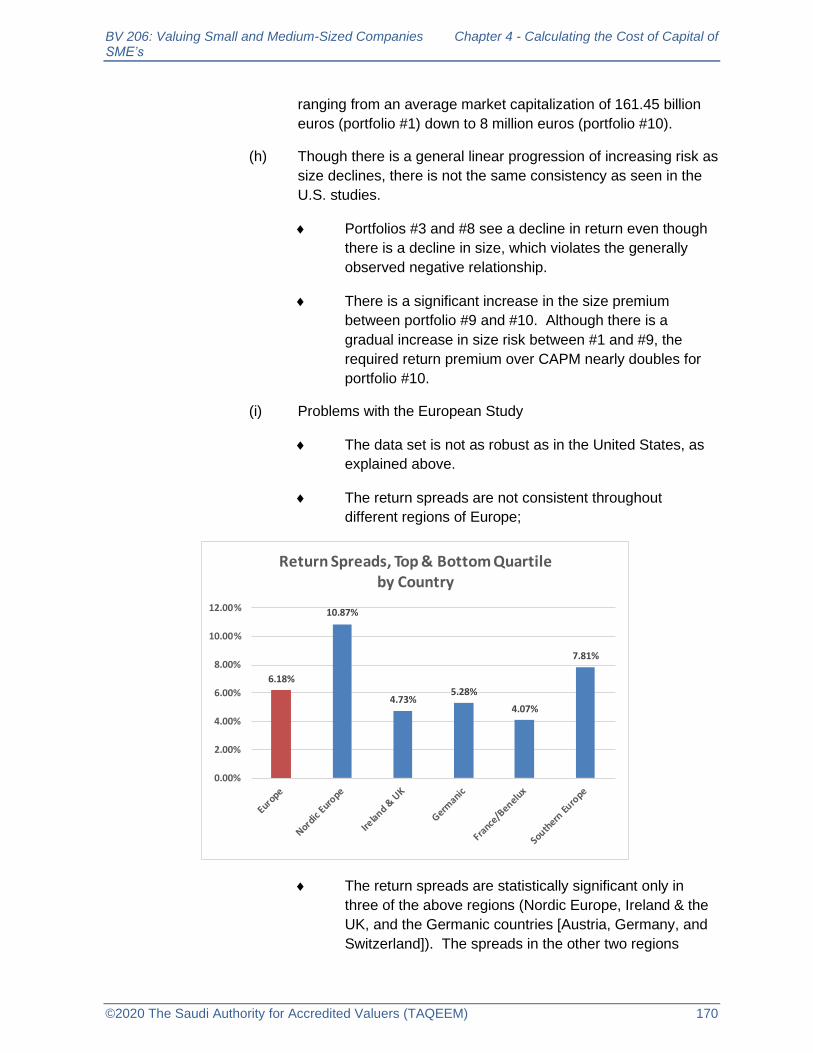
BV 206: Valuing Small and Medium-Sized Companies Chapter 4 - Calculating the Cost of Capital of SME’s
©2020 The Saudi Authority for Accredited Valuers (TAQEEM) 170
ranging from an average market capitalization of 161.45 billion
euros (portfolio #1) down to 8 million euros (portfolio #10).
(h) Though there is a general linear progression of increasing risk as
size declines, there is not the same consistency as seen in the
U.S. studies.
Portfolios #3 and #8 see a decline in return even though
there is a decline in size, which violates the generally
observed negative relationship.
There is a significant increase in the size premium
between portfolio #9 and #10. Although there is a
gradual increase in size risk between #1 and #9, the
required return premium over CAPM nearly doubles for
portfolio #10.
(i) Problems with the European Study
The data set is not as robust as in the United States, as
explained above.
The return spreads are not consistent throughout
different regions of Europe;
The return spreads are statistically significant only in
three of the above regions (Nordic Europe, Ireland & the
UK, and the Germanic countries [Austria, Germany, and
Switzerland]). The spreads in the other two regions
6.18%
10.87%
4.73%5.28%
4.07%
7.81%
0.00%
2.00%
4.00%
6.00%
8.00%
10.00%
12.00%
Return Spreads, Top & Bottom Quartile by Country

BV 206: Valuing Small and Medium-Sized Companies Chapter 4 - Calculating the Cost of Capital of SME’s
©2020 The Saudi Authority for Accredited Valuers (TAQEEM) 171
(France-Belgium-Luxembourg, and southern Europe
[Spain, Italy, Portugal & Greece]) are not statistically
significant from zero.
C. Conclusions
1) These size premium studies provide statistical proof that some (maybe
all) markets perceive higher risk as the companies’ size decreases.
(a) There is not statistical proof though that all markets perceive size
risk in the same way, or that the size risk perception is uniform
throughout all regions of the world.
(b) The lack of proof does not mean that size risk does not exist
throughout the entire world. Unfortunately, since historical
market data is insufficient for the type of analyses that need to
be completed, we cannot state such a conclusion.
2) What relevance do these studies have for the KSA market, if any?
(a) It is reasonable to conclude that investors in KSA would behave
in a similar fashion to investors throughout the United States and
throughout Europe – that smaller companies are riskier and
because of that investors would require higher returns to
compensate them for the higher risk.
(b) The issue is how to quantify the size premium. The data
available from the Tadawul is not sufficient to complete a robust
size premium study. Therefore, the valuer in KSA cannot have
the same confidence level to add a size premium of x% to the
CAPM as a valuer in the U.S. can.
(c) It is not uncommon for valuers outside the U.S. to use the U.S.
size premium studies under the assumption that investors in
their region would make the same perception.
While this practice may or may not be unreasonable, the
valuer must understand that there is no statistical
evidence to support using U.S. size premiums outside the
United States.
VII. Calculating the Cost of Capital
1. Weighted average cost of capital (WACC)
A. Cost of equity

BV 206: Valuing Small and Medium-Sized Companies Chapter 4 - Calculating the Cost of Capital of SME’s
©2020 The Saudi Authority for Accredited Valuers (TAQEEM) 172
1) The cost of equity was derived in the prior section. Theoretically, the
cost of equity may change throughout a discrete forecast, especially
with an early-stage company.
(a) As the company survives each year, its overall survivability
increases and risk declines.
(b) As the company takes on more debt, its equity risk increases
with higher financial risk until the most efficient capital structure
is attained.
(c) Given this, the cost of equity and the WACC should theoretically
change each year in the forecast.
Most practitioners use a uniform WACC throughout the
DCF, even with early stage companies. This is not best
practice. There are benefits and drawbacks to this
practice:
Benefit - It is simpler, easier to understand and
easier to explain;
Benefit – avoids the potential for making an error
in subjective judgment.
Drawback – can be demonstrated as, at best, an
oversimplification.
This is acceptable for a stable company, but it becomes
less defendable in a rapidly changing ESC.
B. Cost of debt
1) The cost of debt reflects the rate at which the company can borrow
funds at the valuation date.
(a) It reflects both the current interest rate in the market as well as
the subject company’s default risk.
(b) For early-stage companies, the cost of debt may not be a central
issue since the companies are not eligible for debt financing, or
have management that opts not to use debt.
For larger companies, the debt rate used is observed
from its yield on current bonds issued by the firm or an
average rate of the different bonds issued.

BV 206: Valuing Small and Medium-Sized Companies Chapter 4 - Calculating the Cost of Capital of SME’s
©2020 The Saudi Authority for Accredited Valuers (TAQEEM) 173
If there are no bonds, then a synthetic rate may be
obtained by consulting a bond rating index such as S&P,
Moody’s or Fitch. These bond rating agencies publish
debt rates for each class of bond from “Best” (bonds
rated Aaa, AAA, or AAA, by Moody’s, S&P, or Fitch,
respectively) down to “Junk” ratings (Caa3, CCC- or
CCC, by Moody’s, S&P or Fitch).
2) The cost of debt in the market is pre-tax. Since the interest on the debt
is deductible (in jurisdictions which levy a corporate tax), the cost of debt
expressed in the WACC must be stated net of tax.
(a) If the interest rate is 6.0% and the tax rate is 20%, then the cost
of debt in the WACC is 4.8% (6.0% * (1 – 20%)).
C. Weighted average cost of capital
1) Which capital structure?
(a) With small companies, some practitioners use the existing
capital structure especially if the company is not likely to grow or
if management intends to fund growth only with equity funding.
(b) Some practitioners impose the target, or market capital structure.
This is theoretically appropriate, especially with larger, more
diverse companies. It is more defendable if the assumption is an
industry buyer will impose the target capital structure on the
company.
(c) Small companies that anticipate significant growth over the
discrete forecast will likely see a changing WACC. It is difficult
to support keeping the WACC constant in such a situation,
especially if management is anticipating adding debt to fund
growth.
2) The WACC Model

BV 206: Valuing Small and Medium-Sized Companies Chapter 4 - Calculating the Cost of Capital of SME’s
©2020 The Saudi Authority for Accredited Valuers (TAQEEM) 174
(a) The example below illustrates the application of the WACC
assuming a constant capital structure of 5% debt and 95%
equity.
WACC = (Ke * We) + (Kp *Wp) + (Kd[1 - t] * Wd)
Where:
Ke = Cost of common equity
We = Weight of common equity FV in capital structure
Kp = Cost of preferred equity
Wp = Weight of preferred equity FV in capital structure
Kd = Cost of debt
t = Company tax rate
Wd = Weight of debt FV in capital structure
Exhibit WACC-1
ABC Company
Discounted Cash Flow Analysis (SAR)
Assumptions
Business Risk Index 1.10
Risk-Free Rate 3.0%
Equity Risk Premium 5.0%
Size Risk Premium 4.0%
Specific Risk Premium 1.0%
Perpetuity Growth Rate 4.0%
Tax Rate 21.0%
Unlevered Cost of Equity 13.5%
2020 2021 2022 2023 2024 Perpetuity
Invested capital cash flow 9,700,000 13,400,000 19,800,000 25,000,000 31,000,000 32,240,000
% Debt Capital 5% 5% 5% 5% 5% 5%
% Preferred Capital 0% 0% 0% 0% 0% 0%
% Common Capital 95% 95% 95% 95% 95% 95%
After-Tax Cost of Debt 4.7% 4.7% 4.7% 4.7% 4.7% 4.7%
Cost of Preferred 0.0% 0.0% 0.0% 0.0% 0.0% 0.0%
Levered Cost of Common 13.73% 13.73% 13.73% 13.73% 13.73% 13.73%
WEIGHTED COST OF CAPITAL 13.28% 13.28% 13.28% 13.28% 13.28% 13.28%
Cash Flow in Period 100.00%
Period to Discount 0.50 1.50 2.50 3.50 4.50
PV of Inv. Cap. Cash Flow 9,113,738 11,114,227 14,497,372 16,158,972 17,688,257
Perpetuity Value at start of 2025 347,441,873
PV of Perpetuity 198,246,494
FV of Invested Capital 266,819,060
BV 206: Valuing Small and Medium-Sized Companies Chapter 4 - Calculating the Cost of Capital of SME’s
©2020 The Saudi Authority for Accredited Valuers (TAQEEM) 175
(b) The spreadsheets in this example are contained in the student
handout file.
3) In Exhibit WACC-1, the valuer kept the capital structure at the original
mix of 5% debt and 95% equity.
(a) The cost of debt remains at a constant 4.7%, net of the tax
benefit.
(b) The unlevered cost of equity was relevered with the assumed
capital structure of 5%/95%, using the Hamada formula.
(c) The levered beta of 1.042 is used in the CAPM to calculate the
levered cost of equity, which is 13.73%.
(d) The WACC is therefore a constant 13.28% resulting in an
invested capital value of SAR 266.8 million.
4) It is unrealistic though to assume that both the cost of debt and the cost
of equity will remain the same throughout the discrete forecast with the
company growing so quickly and with the additional debt burden.
(a) In Exhibit WACC-1 above, sales are projected to triple within the
next four years. It will be difficult to achieve this growth without
additional investment and a changing capital structure.
(b) Survival risk declines each year that the company remains in
business.
(c) If debt financing is added to support growth, the cost of equity
will increase since the shareholders carry more financial risk.
(d) It is unlikely that the debt interest rate will remain the same as
additional tranches of debt are added.
5) Exhibit WACC-1 can be refined to allow for additional debt, a changining
capital structure, and changing rates of return.
D. Exhibit WACC-2 below contains the same forecast of invested capital cash flow
as in WACC-1, but the valuer also projected the company’s capital structure
and the changing cost of equity and debt.
βL = βU(1 + (1 - t)(D/E))

BV 206: Valuing Small and Medium-Sized Companies Chapter 4 - Calculating the Cost of Capital of SME’s
©2020 The Saudi Authority for Accredited Valuers (TAQEEM) 176
(a)
2) The valuer includes a capital structure analysis in which a multiple of
free cash equal to 7.0x was taken from the market and used to project
future invested capital values.
3) Management provided the expected debt levels in each year of the
forecast.
Exhibit WACC-2
ABC Company
Discounted Cash Flow Analysis
Assumptions
Business Risk Index 1.10
Risk-Free Rate 3.0%
Equity Risk Premium 5.0%
Size Risk Premium 4.0%
Specific Risk Premium 1.0%
Perpetuity Growth Rate 4.0%
Tax Rate 21.0%
Unlevered Cost of Equity 13.5%
2020 2021 2022 2023 2024 Perpetuity
Invested capital cash flow 9,700,000 13,400,000 19,800,000 25,000,000 31,000,000 32,240,000
% Debt Capital 3.7% 10.7% 18.0% 20.0% 27.6% 27.6%
% Preferred Capital 0.0% 0.0% 0.0% 0.0% 0.0% 0.0%
% Common Capital 96.3% 89.3% 82.0% 80.0% 72.4% 72.4%
After-Tax Cost of Debt 4.7% 5.1% 5.3% 5.5% 5.7% 5.7%
Cost of Preferred 0.0% 0.0% 0.0% 0.0% 0.0% 0.0%
Levered Cost of Common 13.7% 14.0% 14.5% 14.6% 15.2% 15.2%
WEIGHTED COST OF CAPITAL 13.34% 13.07% 12.81% 12.78% 12.55% 12.55%
Cash Flow in Period 100.00%
Period to Discount 0.50 1.50 2.50 3.50 4.50
PV of Inv. Capital Cash Flow 9,111,398 11,144,882 14,648,435 16,413,269 18,208,197
Perpetuity Value at start of 2025 376,974,432
PV of Perpetuity 221,420,150
FV of Invested Capital 290,946,330
ABC Company
Capital Structure Analysis
2020 2021 2022 2023 2024
Projected Inv. Cap. Flow 9,700,000 13,400,000 19,800,000 25,000,000 31,000,000
Projected EBITDA multiple 7.0x 7.0x 7.0x 7.0x 7.0x
Projected MVIC 67,900,000 93,800,000 138,600,000 175,000,000 217,000,000
Preferred Stock - - - -
Total Debt 2,500,000 10,000,000 25,000,000 35,000,000 60,000,000
Assumed FV of Equity 65,400,000 83,800,000 113,600,000 140,000,000 157,000,000
Interest Rate, Pre-tax 6.0% 6.5% 6.8% 7.0% 7.3%
After-tax cost of debt 4.7% 5.1% 5.3% 5.5% 5.7%
CAPITALIZATION %:
Debt 3.7% 10.7% 18.0% 20.0% 27.6%
Preferred Equity 0.0% 0.0% 0.0% 0.0% 0.0%
Common Equity 96.3% 89.3% 82.0% 80.0% 72.4%
Total 100.0% 100.0% 100.0% 100.0% 100.0%

BV 206: Valuing Small and Medium-Sized Companies Chapter 4 - Calculating the Cost of Capital of SME’s
©2020 The Saudi Authority for Accredited Valuers (TAQEEM) 177
(a) Given future total invested capital and the value of debt, the
value of future equity levels could be estimated, and the
resultant changing capital structure is derived.
(b) As is seen the capital structure evolves from 4% debt and 96%
equity to 28% debt and 72% equity.
(c) The valuer also projected an increasing cost of debt since the
additional tranches of debt will cause higher cost of debt.
A banker will lend at a relatively lower rate if the company
has no external debt. Subsequent bankers will require a
higher interest rate since the company has existing debt
to service.
(d) The unlevered beta is relevered each year with a different capital
structure. As would be expected the cost of equity increases
from 13.75% in 2020 to 15.2% in 2024.
(e) The after-tax cost of debt also increases, from 4.7% to 5.7% due
to the higher levels of debt.
(f) Despite the higher costs of equity and debt, the WACC declines
due to the higher mixture of debt in the capital structure.
This illustrates the theoretical point that the company’s
invested capital will be worth more as the company
moves toward an ideal capital structure.
(g) Under this model the company’s invested capital is worth 290.9
million, 24.0 million higher than the example in Exhibit WACC-1.
This shows how a simplifying assumption such as a
constant WACC can lead to an erroneous value,
especially in a company that is undergoing a rapid
change in capital structure.
E. The example above in Exhibit WACC-2 can be further refined to capture the
cumulative cost of capital.
1) The cumulative cost of capital discounts each year’s cash flow by a
discount rate that captures all of the risk in each preceding year of the
model.
2) For example, the valuer discounted 31,000,000 in cash flow in year
2024 by a discount rate of 12.55% in Exhibit WACC-2 above. The
problem is that the 12.55% represents the risk in 2024 only. It does not
include the risk of the preceding years which is higher.

BV 206: Valuing Small and Medium-Sized Companies Chapter 4 - Calculating the Cost of Capital of SME’s
©2020 The Saudi Authority for Accredited Valuers (TAQEEM) 178
(a) For example, standing in 2020, the investor doesn’t know that
the company will survive until 2024; the last chapter discussed a
survivability issue in which 80% of small businesses do not
survive until their 5th year. The investor captures this
survivability risk in the first years of the forecast.
(b) The rate of 12.55% in 2024 though does not include the
survivability risk (as well as other risks in 2020, 2021, 2022, and
2023). The investor in 2020 does not have the comfort of
knowing that the company will be there to generate 31 million in
cash flow in 2024.
(c) Exhibit WACC-3 addresses this issue by discounting each year’s
cash flow by the cumulative WACC instead of that year’s WACC.
(d) Each year captures the cost of capital in that year, plus all prior
years. So 2021 equals 13.4 million divided by
((1.1307)*(1.1334)). Etc.
Exhibit WACC-3
ABC Company
Discounted Cash Flow Analysis
Assumptions
Business Risk Index 1.10
Risk-Free Rate 3.0%
Equity Risk Premium 5.0%
Size Risk Premium 4.0%
Specific Risk Premium 1.0%
Perpetuity Growth Rate 4.0%
Tax Rate 21.0%
Unlevered Cost of Equity 13.5%
2020 2021 2022 2023 2024 Perpetuity
Invested capital cash flow 9,700,000 13,400,000 19,800,000 25,000,000 31,000,000 32,240,000
% Debt Capital 3.7% 10.7% 18.0% 20.0% 27.6% 27.6%
% Preferred Capital 0.0% 0.0% 0.0% 0.0% 0.0% 0.0%
% Common Capital 96.3% 89.3% 82.0% 80.0% 72.4% 72.4%
After-Tax Cost of Debt 4.7% 5.1% 5.3% 5.5% 5.7% 5.7%
Cost of Preferred 0.0% 0.0% 0.0% 0.0% 0.0% 0.0%
Levered Cost of Common 13.7% 14.0% 14.5% 14.6% 15.2% 15.2%
WEIGHTED COST OF CAPITAL 13.34% 13.07% 12.81% 12.78% 12.55% 12.55%
Cash Flow in Period 100.00%
Period to Discount 1.00 2.00 3.00 4.00 5.00
PV of Inv. Capital Cash Flow 8,558,513 10,456,311 13,695,860 15,333,853 16,893,459
Perpetuity Value at start of 2025 376,974,432
PV of Perpetuity 205,432,328
FV of Invested Capital 270,370,325
31,000,000/((1.1255)*(1.1278)*(1.1281)*(1.1307)*(1.1334))

BV 206: Valuing Small and Medium-Sized Companies Chapter 4 - Calculating the Cost of Capital of SME’s
©2020 The Saudi Authority for Accredited Valuers (TAQEEM) 179
(e) For presentation purposes, the above model assumes end of
year discounting. Mid-year discounting can be applied simply by
raising each parenthetical element to the mid-year factor (0.5).
(f) Note that the residual value of 376,974,432 is discounted by the
same denominator as the year 2024 cash flow.
(g) The resultant invested capital value of 270.37 million is
approximately 20.0 million less than the value calculated in
Exhibit WACC-2. This is so since each year’s individual
calculation in WACC-2 underestimates the risk since it assumes
the company survives to that point when in fact, an investor in
2020 cannot know that.
VIII. Summary
1. Deriving a cost of capital for an SME or ESC involves the same challenges as any
larger company. The risk-free rate and the ERP are constants in each analysis,
though there is much discussion on where each variable is sourced.
2. The main challenge with smaller companies is with the quantification of specific risk.
A. Damodaran suggests the application of Total Beta, which captures specific risk
in the beta, eliminating the need for a separate subjective assessment. There
are problems with Total Beta though and it does not enjoy widespread
application in best practice.
B. Size risk studies do enjoy widespread application since they can quantify most
or all specific risk even in very small companies. The challenge with these
studies though is that they are less available outside the United States.
3. The valuer should assess a changing capital structure in a discrete forecast rather than
simply applying a static rate of return, especially with rapidly growing early-stage
companies.
A. Changing debt levels will change the capital structure and the WACC.
B. Declining survivability risk will change the cost of equity.
C. If the WACC or cost of equity changes in the discrete forecast, the valuer
should discount future years at the cumulative cost of capital, not that individual
year’s cost of capital.
BV 206: Valuing Small and Medium-Sized Companies Chapter 4 - Calculating the Cost of Capital of SME’s
©2020 The Saudi Authority for Accredited Valuers (TAQEEM) 180
IX. Appendix A – Chapter Review Questions
1. Given the following information, calculate the relevant Total Beta.
1) Market beta = 1.1
2) Standard deviation of stock returns = 1.7
3) R factor = .75
A. 0.83
B. 1.57
C. 1.47
D. 2.26
2. A valuer projected net equity cash flows after accounting for future investments in
working capital and capital assets. A good way to check the reasonableness of the
future investment amounts is which of the following?
A. Calculate the future days receivables, days inventory, and days payable ratios
to ensure the ratios remain constant throughout the forecast period.
B. Compare the amount invested in fixed assets to the projected depreciation
expense to make sure they are consistent.
C. Ensure that the investment amounts are included below the net income line
since they are non-taxable.
D. Calculate a return on investment by dividing net operating income by the total
amount invested and comparing that ratio to an industry norm.
3. A firm’s cost of debt is a function of which of the following two variables?
A. Market interest rate and default risk
B. Standard deviation of stock returns and standard deviation of market returns
C. Liquidity risk and times interest earned ratio
D. Cost of equity and cost of preferred stock

BV 206: Valuing Small and Medium-Sized Companies Chapter 4 - Calculating the Cost of Capital of SME’s
©2020 The Saudi Authority for Accredited Valuers (TAQEEM) 181
4. Using a cumulative cost of capital calculation, what is the rounded present value at the
beginning of 2020 of the 2021 future cash flow of 4,765,000? (use end-of-year
discounting)
A. 3,718,000
B. 3,727,000
C. 3,963,000
D. 7,468,000
5. One flaw in the European size risk premium studies relative to the U.S. risk premium
studies is:
A. The European studies are based on data that goes back to 1926.
B. The European studies are based on returns from stock markets that are
interactive but not totally consolidated.
C. The U.S. studies include companies that are larger and more robust relative to
the European markets.
D. The European studies rely on eight definitions of size whereas the U.S. studies
capture one consolidated definition of size.
6. The fact that actual venture capital returns are well below required rates of return is
indicative of the fact that:
A. Venture capitalists care less about stated returns than about up front payments
B. Economic conditions among ESCs are generally in decline
C. Venture capital required rates of return are too optimistic
D. Many VC investments do not survive to generate returns.
Answers: 1-C, 2-D, 3-A, 4-A, 5-B, 6-D
2020 2021
Invested capital cash flow 4,250,000 4,765,000
WEIGHTED COST OF CAPITAL 13.34% 13.07%
Period to Discount 1.00 2.00

BV 206: Valuing Small and Medium-Sized Companies Chapter 5 - Legal Agreements
©2020 The Saudi Authority for Accredited Valuers (TAQEEM) 182
Chapter 5. Legal Agreements
I. Introduction
1. Introduction
A. Legal agreements – legal agreements can play a significant role in the
formation and protection of a start-up company. All agreements, regardless of
type, are subject to the laws of the local government.
1) Agreements can take many forms. Each type of agreement is intended
to protect a different aspect of the business or ownership. Types of
agreements include:
(a) Shareholder agreements
(b) Buy-Sell agreements
(c) Employment agreements
(d) Non-compete agreements
(e) Supply agreements
(f) Non-disclosure agreements
(g) Indemnity agreements
(h) Lease agreements
B. Each of the above agreements can affect the value of a closely-held business,
either directly or indirectly. The valuer should review all legal agreements that
bind the subject company or its owners.
1) Would a buyer of the company be subject to the same agreement?
C. This chapter focuses on a conflict that may occur between Market Value and a
legally determined value imposed by the courts (there is no IVS defined term for
legal value). The valuer may often find himself or herself in a situation where
the Market Value determined through the methods discussed in the prior
courses is rendered moot by a legal agreement signed by the shareholders that
increases or decreases the relevant value above or below Market Value.
1) To further complicate matters, a legally determined value may only be
relevant in a legal context such as a lawsuit while the Market Value of
the same company at the same valuation date may prevail for another
purpose such as a transaction.
BV 206: Valuing Small and Medium-Sized Companies Chapter 5 - Legal Agreements
©2020 The Saudi Authority for Accredited Valuers (TAQEEM) 183
II. Legal Agreements
1. Shareholder Agreements
A. Shareholder Agreements detail the covenants between, and protections for, the
company’s owners under a wide array of circumstances. These legal
documents usually have a broad scope and often include provisions for buying
and selling stock which are separately described below (see Buy-Sell
Agreements). Most sharholder agreements cover the following items:
1) Formation of the Company, its name, and identification of the owners
2) Identification of the executives or managers, their operational authorities
and limitations on those authorities
3) Defined terms – Certain terms are specifically defined and capitalized
throughout the document. The valuer must understand these terms and
their specific meaning within the confines of the Agreement.
4) Capital contributions, shares issued, and terms under which additional
shares can be created
5) Allocation of profit and losses; terms under which distributions can be
made
6) Record keeping; shareholders’ access to the books and records of the
company
7) Provision for the sale of company stock
(a) Restrictions on transfer
(b) Allowed transfers under each departure scenario (death,
disability, withdrawal, etc.)
(c) Right of first refusal – the Company and its shareholders usually
reserve the right to purchase a departing owner’s stock prior to
its exposure for sale in the market.
(d) Purchase price – formula for valuation under each transfer
scenario
(e) Payment terms for purchase price under each scenario
(f) Provisions for dissolution or liquidation of the company
(g) Procedures for Board meetings and minutes
(h) Provisions for voting rights

BV 206: Valuing Small and Medium-Sized Companies Chapter 5 - Legal Agreements
©2020 The Saudi Authority for Accredited Valuers (TAQEEM) 184
(i) Indemnification of managers
B. The valuer should read the entire Shareholder Agreement and understand any
provisions that could affect the valuation. If necessary, a legal opinion from a
licensed attorney may be necessary. The most common provisions that affect
valuation include:
1) Restrictions on the transfer of shares
(a) The Agreement may ban all shareholders from selling their
shares outside the company unless certain provisions are met.
These provisions may vary according to the wishes of the
existing shareholders.
(b) This may affect the marketability of shares which could be
captured in either the discount rate or the discount for lack of
marketability.
2) Purchase price
(a) Many agreements have a formula for determining value. The
valuer must determine if the formula reflects economic reality
(i.e. it is a valid proxy for Market Value).
If the valuation formula does not reflect Market Value, the
valuer must assess if local laws require the terms of the
agreement to be imposed on the valuation. (See the
discussion in Buy-Sell Agreements below).
(b) There may be different formulas for determining value for the
different departure scenarios.
2. Buy-Sell Agreements
A. Buy-Sell Agreements are narrowly focused documents, outlining the
circumstances under which investors can buy into the company and under
which existing shareholders can sell their shares. As outlined above, many
companies do not have separate buy-sell agreement since the buy-sell
provisions are covered in a shareholder agreement. Buy-sell agreements
provide clarity regarding the transfer of stock under many circumstances,
including the following shareholder departure scenarios:
1) Death
2) Disability
3) Retirement

BV 206: Valuing Small and Medium-Sized Companies Chapter 5 - Legal Agreements
©2020 The Saudi Authority for Accredited Valuers (TAQEEM) 185
4) Voluntary withdrawal
5) Termination for cause
B. Generally, the departure terms for death, disability, or retirement, tend to be
more favorable than terms for voluntary withdrawal or termination.
1) Shareholders assume that they will depart the company at some point
under any of the above circumstances except one – termination with
cause. Therefore, they usually seek to protect themselves from a
situation in which one shareholder may need to be forced out of the
company due to poor performance, arrest and imprisonment, etc. and at
the same time allow provisions for themselves or their heirs at the end of
their careers.
C. The purpose of the Buy-Sell is to protect all shareholders from the risk of
disagreements when the above circumstances occur. The documents are
constructed by attorneys working with company owners to provide the following:
1) A mechanism for transition of stock without interrupting business
operations
2) Protections for a shareholder who wish to leave the business
3) Protections for minority owners
4) Prevent a majority shareholder from selling the business without the
consent of all shareholders
5) The means for dispute resolution if a disagreement arose regarding the
transfer of stock
6) Valuation formulas for the price of the stock under each departure
scenario
7) Provide a payout scheme for the value of the transferred stock
D. Restrictions on Transfer
1) The excerpt below contains a common restriction on the transfer of
shares:

BV 206: Valuing Small and Medium-Sized Companies Chapter 5 - Legal Agreements
©2020 The Saudi Authority for Accredited Valuers (TAQEEM) 186
“Except as otherwise provided in this Agreement, no shareholder shall voluntarily
or involuntarily sell, assign, encumber, or otherwise transfer all or any portion of
his shareholder interest. Allowable transfers may occur under the following
conditions: death, disability, volunatary withdrawal or termination of
employment, each of which is outlined below:
(a) Death – The Company shall purchase from the deceased shareholder’s
representative the deceased shareholder’s entire interest at a purchase price equal
to the Appraised Value.
(b) Disability – The Company shall have the option, but not the obligation, to
purchase the disabled shareholder’s interest at a purchase price equal to the
Appraised Value for one year after the date of the Disability. After one year, the
disabled shareholder shall have the option to sell his shares to a buyer of his
choosing.
(c) Retirement – The Company shall purchase from the retiring shareholder his
entire interest at a purchase price equal to the Appraised Value.
(c) Voluntary Withdrawal – Upon the voluntary withdrawal of a shareholder,
the Company shall be obligated to purchase all, but not less than all, of the
shareholder’s stock at a purchase price equal to the following formula:
Shareholder’s shares/Total share outstanding multiplied by the
Company’s net book value as of the fiscal year end
(d) Termination of Employment – Upon the termination of a Shareholder’s
employment with cause, the shareholder shall be paid a purchase price equal to
the Shareholder’s capital account as of the date of termination.”
Definition of Appraised Value - The Appraised Value shall be determined as
follows: The departing shareholder and the Company shall each retain valuation
experts who will complete separate valuations of the Market Value of the
Company's stock as of the date of departure. If those valuations are within 10%
of each other, the Appraised Value shall equal the midpoint between the two
appraised values. If the valuations are more than 10% of each other's appraised
values, a third valuation expert shall be selected by agreement between the
shareholder and the Company. If the third appraiser's opinion of value is
between the two prior valuations, the Appraised Value shall equal the third
appraiser's opinion of value. If the third appraiser's opinion of value is not
between the two earlier appraisals, then the Appraised Value shall equal the
midpoint between the third appraiser's opinion of value and the nearest opinion
of value from the first two appraisals."

BV 206: Valuing Small and Medium-Sized Companies Chapter 5 - Legal Agreements
©2020 The Saudi Authority for Accredited Valuers (TAQEEM) 187
2) The above definition of value allows for Market Value only in the
circumstances of death, disability, and retirement. This is not unusual
since all shareholders see themselves as leaving the company in one of
these ways and create departure terms that will favor them or their
beneficiaries when the time comes.
(a) The purchase price though is potentially far less if the
shareholder departs the company voluntarily before retirement or
is terminated by the other partners with cause.
Most shareholders want to create barriers to departure
for other shareholders since high turnover usually
damages the value of the company. In the example
above, a shareholder who quits the firm (voluntary
withdrawal) is not able to extract his or her market value.
Rather, he or she receives his pro rata value of the
company’s book value. In a going concern company, this
value will usually be less than Market Value.
In the case of termination, the shareholder receives
whatever cash is in his capital account. There is no
avenue by which the shareholder can receive the market
value of his shares or even a pro rate share of the
balance sheet equity.
3) It is not unusual to see Buy-Sell agreements in which the purchase price
for shares simply equals the departing shareholder’s pro rata interest in
the net book value (book assets minus book liabilities) as of the most
recent fiscal year end. This is the case since the remaining
shareholders do not want to pay out large sums to departing owners
regardless of the terms of departure.
(a) In the case of death or disability, they protect themselves
alternatively through life insurance policies payable to their heirs
(in the case of death) or disability policies which pay them their
salaries for a defined period of time.
(b) Companies can take out life/disability insurance policies on
shareholders to finance buyouts when needed.
E. Restrictions may also define rights of first refusal
1) Under the usually rare circumstances in which a shareholder is free to
sell his shares to investors from outside the company at an externally
negotiated price, the company usually reserves the following rights:

BV 206: Valuing Small and Medium-Sized Companies Chapter 5 - Legal Agreements
©2020 The Saudi Authority for Accredited Valuers (TAQEEM) 188
(a) Before the shareholder consummates the external deal, the
Company has a right to acquire the stock at the externally
agreed price.
(b) If the company declines to acquire the stock, the shares must
then be offered to the remaining shareholders individually who
can decide to buy shares at the external price in conjunction with
their pro rata interest in the company.
(c) If both the company and the remaining shareholders decline to
acquire the stock, then the exiting shareholder can then
consummate the sale externally.
However, even in the case of an external sale, the
company usually retains the right to accept or refuse the
external investor seeking to buy into the company (this
acceptance or rejection of the individual would normally
occur prior to the exiting shareholder beginning
negotiations with the individual).
F. The Valuer’s Responsibilities
1) The valuer must determine if the terms of the Buy-Sell Agreement are
relevant and binding to the Purpose of the valuation in which the valuer
is engaged.
(a) If the Agreement’s terms are binding, then the valuer must
determine the value that results from the formula in the
Agreement.
This may entail simply consulting other expert’s reports
who were retained to determine value.
If another formula is relevant then the valuer must apply
the formula to determine value.
The valuer must be familiar with the laws of the local
jurisdiction. The shareholder may have protections under
the law that supersede the terms of the Agreement.
(b) Example #1:
Three shareholders, Abdullah, Muhammed, and Tariq
each own 33.3% of ABC Company. They each signed a
Buy-Sell Agreement which states that if a shareholder is
terminated with cause, the purchase price for his 33.3%
would be the amount in his capital account.

BV 206: Valuing Small and Medium-Sized Companies Chapter 5 - Legal Agreements
©2020 The Saudi Authority for Accredited Valuers (TAQEEM) 189
Abdullah and Muhammed got together and voted to
terminate the employment of Tariq on June 30, 2019. As
of that date, Tariq’s capital account consisted of SAR
9,500, which was paid out to him. You estimate that the
market value of the company as of June 30, 2019 was
SR 1.5 million.
On September 1, 2019, Tariq filed a lawsuit in Saudi
court claiming that Abdullah and Muhammed conspired
with each other to steal the rightful value of Tariq’s
shares which are worth SR 500,000.
Since each shareholder signed the Agreement and it
complies with Saudi law, you determine that it is binding
on the shareholders. Given this, what is the value of
Tariq’a one-third interest? SR 9500 or SR 500,000?
The answer to this question is not a financial matter. It is
a legal issue. The valuer is neither an attorney nor a
judge and should not be pressured by a client into
opining on matters of law. In a case like this the valuer
should provide two values, the first value equal to the
Market Value of the firm if the Saudi Court decides that
the Buy-Sell Agreement is not relevant to the lawsuit, and
the other value equal to the capital account value in
compliance with the Buy-Sell agreement if the Court rules
that way.
(c) Example #2:
Assume the same shareholders in ABC Company with
the same one-third interests.
Tariq is sued by an outside party in a legal matter that is
unrelated to ABC Company. However, if Tariq is held
liable for damages in the lawsuit then he would potentially
have to pay the plaintiff SAR 1,000,000. The Court has
requested a valuation of Tariq’s interest in ABC Company
to determine his ability to pay the damages.
The Buy-Sell Agreement states that if Tariq voluntarily
departed from ABC, he would receive one-third of the
December 31, 2018 net equity, which was SR 55,000.
Tariq’s attorneys argue that the most that he can
contribute to damages from his ownership interest is

BV 206: Valuing Small and Medium-Sized Companies Chapter 5 - Legal Agreements
©2020 The Saudi Authority for Accredited Valuers (TAQEEM) 190
therefore SR 55,000. You have valued the Market Value
of his interest at SR 500,000.
Like Example #1, the value in this case is a legal
determination that is a matter for the Court to
decide. The valuer should provide the Court with
two options, the Market Value and the Buy-Sell
value.
The legal issue at hand is somewhat more
ambiguous than in Example #1. If the Court
decides that Tariq can afford to pay at least SAR
500,000 from his stock holdings, then he would
likely have to liquidate the stock. If he liquidated,
then the Buy-Sell Agreement would come into
play and Tariq would only receive SR 55,000.
There is a difference between Market Value and
liquidity. Nevertheless, the valuer’s job is to
provide values under each assumption, not to
make legal conclusions.
2) Other Valuation Formulas
(a) There is no rule or guideline for the valuation formulas that
shareholders may insert into a Buy-Sell or Shareholder
Agreement. Shareholders may seek professional input but often
just create a formula that has no relevance to Market Value or
economic reality. This may be intentional, as seen above in the
cases of voluntary withdrawal and termination.
Consider the following formula:
"Value shall be determined by the Company's accountant and shall be the sum of
the following factors:
(a) The net book value of the Company's assets as of the most recent fiscal year
end with the exception of the Company's fixed assets and goodwill determined in
accordance with International Financial Reporting Standards (IFRS).
(b) The net book value of the Company's liabilities determined under IFRS.
(c) An amount equal to 40% of net book value of the Company's fixed assets as
determined in accordance with IFRS.
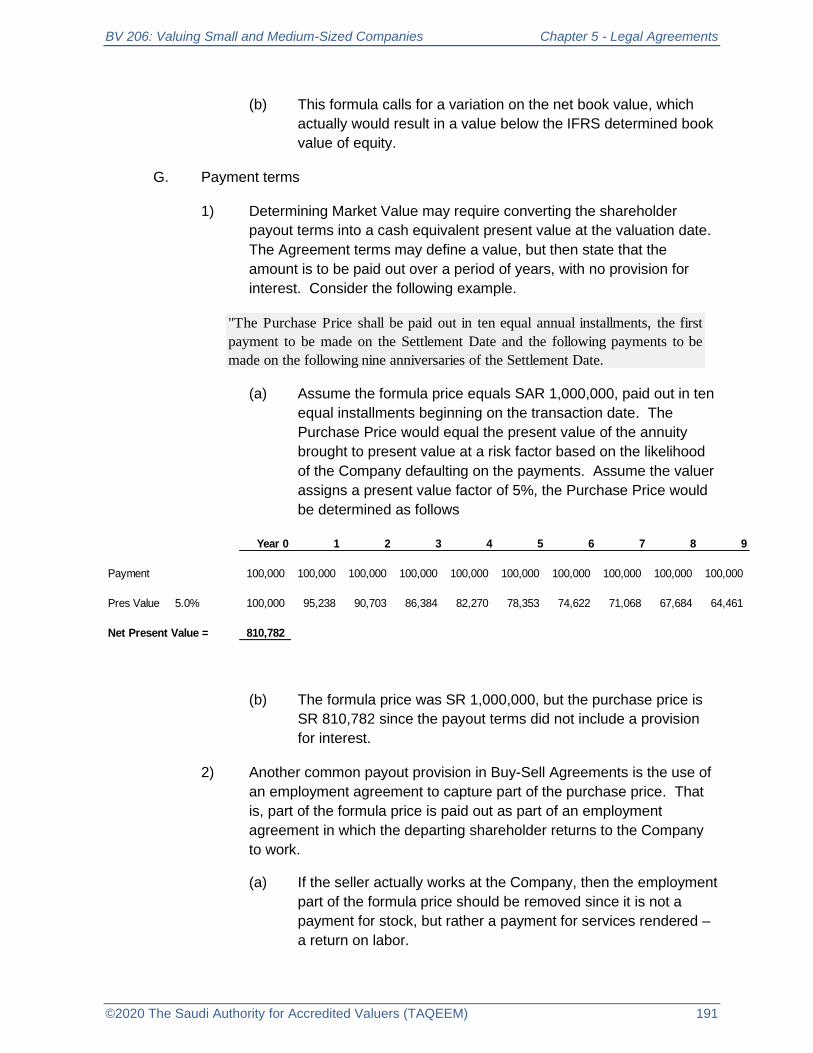
BV 206: Valuing Small and Medium-Sized Companies Chapter 5 - Legal Agreements
©2020 The Saudi Authority for Accredited Valuers (TAQEEM) 191
(b) This formula calls for a variation on the net book value, which
actually would result in a value below the IFRS determined book
value of equity.
G. Payment terms
1) Determining Market Value may require converting the shareholder
payout terms into a cash equivalent present value at the valuation date.
The Agreement terms may define a value, but then state that the
amount is to be paid out over a period of years, with no provision for
interest. Consider the following example.
(a) Assume the formula price equals SAR 1,000,000, paid out in ten
equal installments beginning on the transaction date. The
Purchase Price would equal the present value of the annuity
brought to present value at a risk factor based on the likelihood
of the Company defaulting on the payments. Assume the valuer
assigns a present value factor of 5%, the Purchase Price would
be determined as follows
(b) The formula price was SR 1,000,000, but the purchase price is
SR 810,782 since the payout terms did not include a provision
for interest.
2) Another common payout provision in Buy-Sell Agreements is the use of
an employment agreement to capture part of the purchase price. That
is, part of the formula price is paid out as part of an employment
agreement in which the departing shareholder returns to the Company
to work.
(a) If the seller actually works at the Company, then the employment
part of the formula price should be removed since it is not a
payment for stock, but rather a payment for services rendered –
a return on labor.
"The Purchase Price shall be paid out in ten equal annual installments, the first
payment to be made on the Settlement Date and the following payments to be
made on the following nine anniversaries of the Settlement Date.
Year 0 1 2 3 4 5 6 7 8 9
Payment 100,000 100,000 100,000 100,000 100,000 100,000 100,000 100,000 100,000 100,000
Pres Value 5.0% 100,000 95,238 90,703 86,384 82,270 78,353 74,622 71,068 67,684 64,461
Net Present Value = 810,782

BV 206: Valuing Small and Medium-Sized Companies Chapter 5 - Legal Agreements
©2020 The Saudi Authority for Accredited Valuers (TAQEEM) 192
(b) However, if the departing shareholder is not expected to work to
earn the employment agreement provision, then it should be
included in the formula price.
In taxing jurisdictions, employment agreements are
common since the Company can deduct the payments on
its income statement and thus lower taxable income.
(c) These payments, called earnouts, are paid over the years after
the transaction. If the valuer determines the payments are
salary for services actively rendered, then they are not part of
the transaction price. If the departing shareholder does not have
to work to earn the payments though, then they should be
factored into the purchase price.
3. Employment Agreements
A. Employment agreements in Saudi Arabia come under the jurisdiction of two
legal structures:
1) The Labour Law and its implementing regulations – approved by Royal
Decree in 2005 and subsequent amendments thereafter
2) Nitaqat – Also referred to as the Saudization Program
B. The Labour Laws
1) Components of the Saudi Labour Laws
(a) Written contract – All employees must be provided with a written
contract. While the contract may be presented in multiple
languages, the official contract must be in Arabic; the Arabic
version will control all disputes that arise from the contract.
(b) There are two forms of employment contracts under the Labour
Law:
Term contracts
Fixed term contracts – contracts that last from one
to four years.
Indefinite term contracts – contracts that exceed
four years
◼ Indefinite contracts are contracts that may
not have terms for renewal but have been
renewed at least three times.

BV 206: Valuing Small and Medium-Sized Companies Chapter 5 - Legal Agreements
©2020 The Saudi Authority for Accredited Valuers (TAQEEM) 193
◼ In practice, indefinite contracts apply only
to Saudi Nationals since foreign workers
visas will expire prior to term.
Project-based contracts
The project-based contract lasts for the term of
the project for which the employee’s services
have been retained.
(c) Employee contracts include the following provisions
Hours worked and Vacation
48-hour work week (with the exception of
Ramadan when the work week is reduced to 36
hours)
The number of work hours per day may be higher
or lower depending on the employee category or
industry. No worker is allowed to work more than
11 hours per day.
Employees are entitled to 21 days of leave time
for their first five years of employment and 30
days thereafter.
If employees work above the normal work week,
they will be paid overtime pay at a time and one-
half rate.
Severance (end-of-service) payments – severance
payments may be due depending on the employment
category. Generally, severance payments are due based
on length of service:
One half month’s wage for each year of
employment up to five years.
One full month’s wage for each year of
employment above five years.
Severance payments may vary depending on the
nature of the employee’s departure. If the
employee resigns, the full severance would only
be paid if the term of service is at least ten years.

BV 206: Valuing Small and Medium-Sized Companies Chapter 5 - Legal Agreements
©2020 The Saudi Authority for Accredited Valuers (TAQEEM) 194
Probation – An employee will have a probationary period
of between 90 and 180 days, as specified in the
employment agreement. During this period either the
employer or employee may terminate the employment
(unless otherwise specified) without compensation or
severance payments.
Employer work policies – employers are allowed to
maintain their own employment manuals and internal
policies as long as those policies do not conflict with the
Labour Law. The policies must be communicated to the
employee.
Disciplinary actions against employee
All forms of potential disciplinary actions must be
written down in the employer work policies and
communicated to the employee. Other than minor
infractions, employees must be informed in writing
of both warnings and actual disciplinary actions.
Employees must be given a chance to defend
themselves in writing and all related
communications must be recorded and included
in the employee’s work file.
Discipline will depend on the infraction but might
include suspension of pay for a period of time,
suspension of services, fines, or termination of
employment.
Termination of employment – Termination without cause
is not specifically addressed in the Labour Law but is
assumed to be outside legal practice due to the
restrictions placed upon termination with cause.
Termination with cause is restricted to the following
situations:
Mutual consent of employer and employee
The end of an employment contract
Employee reaches retirement age
An unforeseen event occurs – An unforeseeable
event that prevents the contract from being
fulfilled, such as illness, an act of nature, etc.

BV 206: Valuing Small and Medium-Sized Companies Chapter 5 - Legal Agreements
©2020 The Saudi Authority for Accredited Valuers (TAQEEM) 195
The company closes or the related project is
closed for business reasons.
Terminated employees should receive a notice of
termination either 30 or 60 days prior to
termination, depending on the type of position.
Termination of employment with cause without notice –
Under certain circumstances the Labour Law allows for
an employee’s termination with no notice. These reasons
are with cause.
The employee assaults employer
The employee willfully and knowingly fails to obey
instructions
The employee fails to obey code of conduct,
committing misconduct or acting dishonestly.
The employee willfully commits an act that results
in a material loss to the employer.
The employee lies on his application or commits
an act of forgery.
The employee’s termination occurs during
probation.
The employee is absent for more than 30 days in
one year or for more than 15 consecutive days,
provided that the employer issues a warning prior
to termination.
The employee unlawfully commits an act for his
personal gain.
The employee steals or conveys company trade
secrets or intellectual property.
Redundancy – Employees may be terminated for
redundancy reasons, including the closure of the
company or division in which the employee works.
Compensation for wrongful termination – If it is
determined that a terminated employee was dismissed
wrongfully, then the employee will be awarded damages

BV 206: Valuing Small and Medium-Sized Companies Chapter 5 - Legal Agreements
©2020 The Saudi Authority for Accredited Valuers (TAQEEM) 196
which are prescribed in the Labour Law according to the
type of position and the length of service.
Non-Compete Clause – The Labour Law allows for a
non-compete clause and a non-solicitation clause that
last for a maximum of two years’ time. These clauses are
conditioned on specific circumstances to be enforceable.
Transferability – Under Saudi law, when a company is
sold or ownership transferred, the new owners are bound
by the existing employee contracts. Prior to completing a
deal, the buyers should perform due diligence on the
contracts, especially in regards to payment obligations
under severance packages.
Jurisdiction over disputes – Labor disputes are overseen
under the Ministry of Labour. All disputes first go before
the Local Commission for the Settlement of Labour
Disputes. Local Labour offices try to settle disputes
informally. If unsuccessful, the disputes go through the
First and then Higher Commissions for Labour Disputes.
C. Nitaqat
1) The Nitaqat, or Saudisation laws are intended to increase employment
among Saudi Nationals. Under this program certain types of jobs can
only be filled by Saudi nationals, including human resource personnel,
receptionists, treasurers, security guards, etc.
2) The system’s requirements are based on the type of company and its
industry:
(a) The type of primary business activity
(b) Size of the company’s workforce
(c) Saudization percentage – number of required employees who
must be Saudi nationals
3) Companies are color-coded depending on the amount of Saudi citizens
employed. Depending on the color rating, the company may have
advantages or disadvantages within the Labour Laws and its abilities to
sponsor visas for foreign workers, hire and fire workers, etc.:
(a) Platinum – 40% Saudi
(b) Green – 12% Saudi (green category has 3 sub-levels)

BV 206: Valuing Small and Medium-Sized Companies Chapter 5 - Legal Agreements
©2020 The Saudi Authority for Accredited Valuers (TAQEEM) 197
(c) Yellow – 7% Saudi
(d) Red – 4% Saudi
4) The Saudization Program is a complicated system. It is easier and
cheaper for companies to hire foreign nationals in many types of
positions. Hence, companies have resisted the program by either
ignoring the Nitaqat requirements or by using loopholes. The Ministry of
Labour inspects companies on a routine basis to ensure compliance.
4. Non-compete Agreements
A. Non-compete agreements are discussed in Chapter 1, Section D. Valuation
models for appraising non-compete agreements are also presented in Chapter
1 of this course as well as in BV 205.
B. Non-compete agreements can be integral to the success of a company,
especially an early stage company. The shareholders and employees should
be incentivized to remain at the company, committed to its growth and success.
For this reason, owners often try to restrict the sale of shares of its owners and
to restrict their ability to work for a competitor or to go out and form their own
business.
C. Requiring employees to sign non-compete agreements though is a
controversial area of business management and law.
1) Unlike shareholders, employees do not receive a return on ownership in
the form of dividends or stock growth.
2) Employees receive no consideration in return for signing a non-compete
(unlike shareholders who receive stock in the company, or consideration
for the company they’ve sold). In tight labor markets, employers would
argue that the job itself is adequate consideration for signing the non-
compete.
3) As a result, the legal enforcement of non-compete agreements among
employees varies by country and in some countries, by different
jurisdictions with a country.
4) Many companies, in fact, are restraining employees from marketing their
skill sets, at times referred to in a legal environment as ‘restraint of
trade.’
D. Non-Compete Agreements in Saudi Arabia
1) Non-compete agreements are usually contained as clauses with the
Employment Contract and not as a separate agreeement. Under the

BV 206: Valuing Small and Medium-Sized Companies Chapter 5 - Legal Agreements
©2020 The Saudi Authority for Accredited Valuers (TAQEEM) 198
Labour Law of 2005, Article 83 states that if an employee becomes
familiar with trade secrets or customer lists through the nature of his
employment, then the employer has the right to require they not work for
a competing company.
(a) Generally, the maximum term of such a non-compete is two
years.
(b) There is little case law in Saudi Arabia, or development of the
Labour Law within the Kingdom, to prohibit abuse of non-
competes by employers.
There are cases of employers requiring employees to
sign a non-compete agreement upon the employee’s
notification of resignation. If the employee does not sign,
then the employer threatens to withhold severance
payments and final salary payments.
Unless the original employment agreement contains a
non-competition agreement, then usually such threats will
not be upheld in Saudi courts.
(c) Without a counterbalance in the law to protect employees,
unscrupulous employers theoretically would have the ability to
restrain the trade of their workforce. That means that any
employee who seeks to better his or her career through a higher
salary or a job with more challenging responsibility would be
prohibited from doing so simply because they are privy to
company secrets.
(d) Most jurisdictions in the United States are hesitant to enforce
non-compete agreements with employees, calling such
agreements restraint of trade. The key element in such cases is
whether the employee was paid consideration (higher salary,
signing bonus, etc.) in return for signing. Otherwise, the Courts
tend to rule that non-owning employees must be allowed to
advance in their careers unchecked by non-competes.
The issue of trade secrets is dealt with through non-
disclosure agreements, which are common. If an
employee violates an employer’s confidence by providing
trade secrets to a new employer the Courts would rule
against the employee, the violation should be against a
non-disclosure agreement, not a non-compete
agreement.

BV 206: Valuing Small and Medium-Sized Companies Chapter 5 - Legal Agreements
©2020 The Saudi Authority for Accredited Valuers (TAQEEM) 199
5. Supply Agreements, Customer Contracts, etc.
A. There are numerous other types of legal contracts that can affect the value of
the company. Most ESCs are not mature enough to be signatories to such
legal documents, but the valuer must perform due diligence on any contracts
that exist since they can affect value.
B. Supply Agreements
1) A supply agreement may be between the subject company and its
supplier of goods or services, or it may be between the subject company
and it customers.
(a) A supply agreement which locks in prices that a company pays
for raw materials should be evaluated in terms of the length of
the contract and a market projection for pricing of those raw
materials.
It is usually difficult to obtain pricing forecasts for raw
materials especially if they are volatile.
If the company has a contract to purchase raw materials
at a price below market then the valuer may be able to
book an asset which reflects the present value of the
savings between the contract price and the market price
over the length of the contract (see example under leases
below).
Conversely, the valuer may book a liability if the company
were paying above market prices as per the contract.
If a supportable forecast for market pricing cannot be
found, then the valuer may consider lowering the
company’s discount rate if it is paying below market
prices or increasing it if paying above market.
C. Customer contracts
1) Any contract which obligates a customer to purchase materials or
services from a company represents a potential intangible asset
depending on the terms of the contract and its length.
2) Customer contracts are normally more valuable than basic customer
relationships since the business is guaranteed over a period of time, as
opposed to a customer relationship in which the customer can sever the
relationship at any time.

BV 206: Valuing Small and Medium-Sized Companies Chapter 5 - Legal Agreements
©2020 The Saudi Authority for Accredited Valuers (TAQEEM) 200
3) It is unusual for a company to have material customer contracts that last
more than six months to a year. Customers are usually not incentivized
to enter such contracts unless the price is below market or the
availability of the good or service is rare enough to make alternate
supply chains unreliable.
D. Lease Agreements
1) Lease agreements are the most common legal contract that companies
sign. If the company does not own its real estate then a lease is
typically signed which specifies a lease rate over a rental period, usually
three to five years for its business properties. The contract length could
be longer though if the real estate market is active and available space
limited.
2) As per the discussion above, lease agreements may involve above or
below market rental rates. It is more common for the valuer to find and
document market lease rates which can be used to determine the value
of a lease.
(a) In many places around the world, the COVID-19 pandemic has
caused high volatility in the commercial real estate market.
Market lease rates have generally declined since many lessees
have either gone out of business or have sent their employees
home to quarantine. This has caused a wave of renegotiations
in the market.
3) Example: KPMG leases 10,000 meters of office space in the Riyadh
central business district (CBD) for 1,500 SAR per square meter. The
company signed a lease on January 1, 2017 for 5 years, locking in the
lease rate. As of December 31, 2018, lease rates for similar office
space in Riyadh CBD declined due to additional office space supply
coming on line. Market rates as of December, 2018 were 1,100 for
similar space.
(a) How should the valuer handle this rate change in the valuation?
The valuer calculates the amount of above market
payments over the remainder of the lease:

BV 206: Valuing Small and Medium-Sized Companies Chapter 5 - Legal Agreements
©2020 The Saudi Authority for Accredited Valuers (TAQEEM) 201
(b) In this circumstance the company has an off-balance sheet
liability of SAR 11.16 million which represents the present value
of the above-market payments (SAR 1,500 versus SAR 1,100)
over the remaining three years of the lease.
In short, if the company were not tied to the lease, it
would enter the market and lease new space at SAR
1,100 per meter.
(c) Although this can happen, it is more likely that the lessee would
enter a bargain with the lessor and negotiate the rate down
closer to market. Although the lessor has no obligation to accept
a lower rate, the lessor also fears that the lessee might move out
of the space at the end of three years. It is more important to the
lessor to maintain a positive relationship with its lessees over the
long term.
Lease Liability Calculation
Currency in SAR 2019 2020 2021
Lease obligation 15,000,000 15,000,000 15,000,000
Lease at market rates 11,000,000 11,000,000 11,000,000
Payments above market 4,000,000 4,000,000 4,000,000
Discount at 5.0% 3,903,600 3,717,715 3,540,681
Lease Liability = 11,161,995
Notes:
Lease obligation = 10,000,000 meters x 1,500 per meter rate.
Lease at market = 10,000,000 meters x 1,100 per meter rate.

BV 206: Valuing Small and Medium-Sized Companies Chapter 5 - Legal Agreements
©2020 The Saudi Authority for Accredited Valuers (TAQEEM) 202
III. Chapter Review Questions
1. Which of the following statements is the most accurate description of how a purchase
price provision in a Buy-Sell Agreement should be handled by the valuer in a Market
Value assignment?
A. Since the Buy-Sell Agreement is binding upon all shareholders and represents
what they would receive upon departure, the Market Value must equal the
purchase price provision.
B. The purchase price provision should be weight-averaged with other approaches
to value depending on the reliability of the formula.
C. The purchase price provision should be presented in the report as the Buy-Sell
Agreement determination of value separate from the valuer’s opinion of Market
Value based on traditional valuation approaches.
D. Since the purchase price formula has no basis in the valuation body of
knowledge it should be ignored in a Market Value assignment.
2. A 45-year old shareholder in an accounting firm has decided to leave his firm in Jeddah
to set up a new accounting practice in Dammam. The shareholder agreement has
different purchase price formulas for each possible departure scenario. The departure
scenario that would most likely provide the shareholder with the highest economic
outcome would be the provision for:
A. Voluntary withdrawal
B. Retirement
C. Termination with cause
D. Termination without cause
3. Globally, many buyers try to move a portion of the purchase price to an employment
contract in which the seller remains as an employee of the merged company. The
main reason for doing this is:
A. To make a portion of the purchase price tax deductible
B. To ensure that the seller does not set up a competing company
C. To add expertise to the existing staff
D. To effectively lower the purchase price to avoid government regulators

BV 206: Valuing Small and Medium-Sized Companies Chapter 5 - Legal Agreements
©2020 The Saudi Authority for Accredited Valuers (TAQEEM) 203
4. DEF Corporation has two years remaining on a lease in which it pays 1,000 SAR per
square meter for 3,000 square meters. The valuer discovers that the market rate for
similar office space has increased to 1,200 SAR per square meter. What adjustment
should be made to the balance sheet assuming a 5.0% discount rate?
A. A lease liability of SAR 1.67 million
B. A lease asset of SAR 1.67 million
C. An lease liability of SAR 1.14 million
D. A lease asset of SAR 1.14 million
5. Under Saudi Labour Law, the two types of employment contracts are:
A. Fixed term contracts and indefinite term contracts
B. Saudi national contracts and foreign national contracts
C. Term contracts and project-based contracts
D. Severance contracts and probation contracts
Answers: 1-C, 2-B, 3-A, 4-D, 5-C

BV 206: Valuing Small and Medium-Sized Companies Chapter 6 - Sensitivity Analyses and Common Errors in Valuation
©2020 The Saudi Authority for Accredited Valuers (TAQEEM) 204
Chapter 6. Sensitivity Analyses and Common
Errors in Valuation
I. Introduction
1. This chapter addresses the components of a valuation quality control program that
should be a part of every valuation firm.
2. The issue of quality control is not exclusive to early-stage companies or small to
medium sized entities. A sound quality control program should be the last step of
every valuation report.
3. The concepts, procedures and common mistakes discussed below potentially apply to
every business valuation.
4. Optimally, the valuer(s) who conduct the valuation analysis should not be part of the
quality control process, other than to address questions and critiques, and to complete
the editing process.
A. Many of the larger valuation firms have departments which are dedicated to
completing valuation reviews. No valuation report leaves the firm without being
signed off by the quality control personnel.
5. Prior to considering sensitivity analyses, we will first review some of the more common
mistakes made in business valuation.
A. There are an infinite number of possible arithmetical, theoretical, and
judgmental errors that could exist in a draft valuation report. The list below is
not exhaustive, but rather reflects the more common mistakes that are seen by
reviewers.
II. Common Errors in Business Valuation
1. The valuation analysis and report do not comply with International Valuation Standards
A. If the valuer is not familiar with IVS then the Standards should be reviewed and
applied to the valuation report prior to issuance.
B. A checklist containing key IVS mandatory requirements should be created and
applied to each report.

BV 206: Valuing Small and Medium-Sized Companies Chapter 6 - Sensitivity Analyses and Common Errors in Valuation
©2020 The Saudi Authority for Accredited Valuers (TAQEEM) 205
2. The valuation lacks a sufficient analysis of the qualitative and quantitative factors that
support a growth and risk assessment.
A. Most of the material covered in BV 201 discusses the research and analysis
(Data Gathering, Data Analysis), that should be presented in a valuation
narrative, including:
1) Company analysis
(a) History, operations, customers, competition, management,
personnel, and physical facility, SWOT analysis
2) Macroeconomic and microeconomic analysis
(a) Many firms create a boilerplate economic section that gets
inserted into each report. This is not appropriate unless the
economic analysis is tied to the subject company.
3) Industry analysis
(a) Industry size (in currency and number of companies), breakdown
of large versus small players, terms of competition (price versus
quality), growth prospects, major components of risk, Porter
Analysis
4) Financial analysis
(a) The analysis must be analytical, leading to a support for, or
conclusion of, growth and risk factors. It should not be a
descriptive narrative of numbers that can be easily observed on
a spreadsheet.
5) The common critique that is made about these omissions (perhaps the
most common mistake made in valuation reports) is that the discount
rate and the growth rate lack support. Each of the above areas of
valuation analysis should be linked to the subject company’s risk
assessment and/or its growth potential.
3. A relevant valuation approach has been omitted
A. Appraisers often neglect to apply the market approach using the assumption
that GPCs would be too large or too diverse to be comparable, or the local
market is not diverse enough.
1) Each valuation approach should always be pursued and if not used,
notes as to why it was omitted should be placed in the file.
BV 206: Valuing Small and Medium-Sized Companies Chapter 6 - Sensitivity Analyses and Common Errors in Valuation
©2020 The Saudi Authority for Accredited Valuers (TAQEEM) 206
2) In reality, many appraisers do not pursue the market approach since it is
time consuming and expensive. Obviously, this is not a valid reason to
omit a market approach.
3) The cost approach is often omitted, usually with valid reasons. The cost
approach may not be relevant with companies that generate material
cash flow.
(a) If the cost approach is applied, each asset class should be
restated to its market value at the valuation date, if necessary
using the services of tangible asset appraisers.
4. The valuation contains multiple versions of the same approach
A. Applying both a capitalization method and a discounted earnings method
1) There are reasons why one of these methods will be preferable to the
other. Hence, both should not be in the same report.
B. Using both an invested capital and an equity model
1) Same explanation. One of these models is preferable to the other in
each case.
5. Income approach common mistakes
A. Use of an equity cash flow discount rate with an income stream that is not
equtiy cash flow
B. Use of net income as a proxy for cash flow when cash flow will be materially
different from net income
1) This usually occurs because the valuer either has not obtained enough
information to project the balance sheet, or lacks the accounting
background to complete such an exercise.
C. Failure to properly account for working capital, capital expenditures,
depreciation, and debt principal when calculating equity cash flow
D. Forgetting to unlever and relever a beta with the target capital structure
E. Use of an equity risk premium based on historical observations
1) The equity risk premium should be forward-looking metric, which can be
obtained from numerous sources.
F. Failure to account properly for size and specific risk

BV 206: Valuing Small and Medium-Sized Companies Chapter 6 - Sensitivity Analyses and Common Errors in Valuation
©2020 The Saudi Authority for Accredited Valuers (TAQEEM) 207
G. Failure to account for country risk
H. Applying an inappropriate capital structure in the WACC derivation
I. Using book values to estimate capital structure rather than market values
J. Discounting an invested capital income stream with an equity discount rate and
vice versa
K. Allowing an inconsistency between the capital structure used to determine the
WACC and the actual capital structure inherent in the opined values for equity
and debt
L. Terminal Value errors
1) Allowing depreciation to be equal to, or greater than, capital
expenditures into perpetuity
2) Using a long-term growth rate greater than the sum of population growth
and inflation
3) Projecting a profit margin into perpetuity that is materially higher than
industry norms
6. There is a material difference between results in the income approach and market
approach
A. This issue was covered in both BV 201 and 202. If there is a large difference
between the two approaches, then the valuer’s perception of market conditions
differs from the investment community’s perception. This is untenable.
B. The cause of the variation is usually a difference in growth assessment
between the income approach and growth embedded in the multiples in the
market approach.
C. As discussed in BV 201, the growth rate embedded in the market multiple
should be extracted for each guideline company.
1) An example of the extraction of the growth in the market multiple is
shown below. The process involves the following steps.
(a) Calculate each GPC’s WACC
(b) Calculate each GPC’s NOPAT
(c) Calculate each GPC’s invested capital value (or equity value if
using an equity method)
(d) Calculate each GPC’s NOPAT multiple

BV 206: Valuing Small and Medium-Sized Companies Chapter 6 - Sensitivity Analyses and Common Errors in Valuation
©2020 The Saudi Authority for Accredited Valuers (TAQEEM) 208
(e) Calculate each GPC’s capitalization rate (1 divided by the
NOPAT multiple)
(f) Since the capitalization rate equals the discount rate minus
growth, then the growth factor equals the discount rate minus the
capitalization rate.
D. If there is a material difference in growth rate among the GPCs:
Guideline Public Company
Derivation of Growth Rate in Multiple
1. Calulate the WACC
Beta 1.10
Risk-Free Rate 2.6%
Market Risk Premium 5.5%
Size Premium 2.10%
Cost of Common Equity 10.8%
Cost of Debt 5.5%
Tax rate 21.0%
After-Tax Cost of Debt 4.3%
% Common Equity in Capital Structure 73.0%
% Debt in Capital Structure 27.0%
Weighted Cost of Capital 9.0%
2. Calulate NOPAT
EBITDA 15,525,000$
Depreciation 1,490,000
Net Operating Profit 14,035,000
Tax Rate 21.0%
Taxes 2,947,350
Net Operating Profit After-Tax (NOPAT) 11,087,650
3. Calulate the GPC's Invested Capital Value
# of outstanding shares (millions) 18,875,000
Price per share 7.65$
Market value of equity 144,393,750
Market value of long term debt 55,000,000
Total Company Value 199,393,750$
4. Derive the Growth Rate
NOPAT Multiple 17.98x = 199,393,750/11,087,650
Implied Market Capitalization Rate 5.56% = 1/17.93
Weighted Cost of Capital 9.02% from above calc
Implied Market Growth Rate 3.46% = 9.02% - 5.56%

BV 206: Valuing Small and Medium-Sized Companies Chapter 6 - Sensitivity Analyses and Common Errors in Valuation
©2020 The Saudi Authority for Accredited Valuers (TAQEEM) 209
1) Are the GPCs similar to each other?
2) How do the growth rates among the GPCs compare to the growth rates
revealed during the independent industry research?
3) Can the variance in growth rates be explained by factors within the
individual companies?
E. If the GPCs are similar to each other and to the subject company but there is a
large difference in rates between the GPCs and the subject company:
1) The valuer should have adjusted for the differences in growth between
the subject and the GPC in the market multiple adjustment process, as
covered in BV 201.
2) Remember that the GPC market multiples represent a long term rate
which captures both short term and long term growth. The derived
market multiples might be above what would be considered a ceiling
long-term growth rate. This is because the market likely sees
hypergrowth in the short term.
7. Lack of support for a discount for lack of control (DLOC) and/or a discount for lack of
marketability (DLOM)
A. Support for these discounts was discussed in BV 204.
B. There is little empirical data in the market that can support the discount for lack
of control.
C. There are multiple sources and analyses that can be pursued to support the
lack of marketability.
8. Confusing the DLOC with the DLOM
A. The DLOC accounts for purchase disincentives related to the inability to control
the operations of the company.
B. The DLOM accounts for purchase disincentives related to the inability to readily
liquidate the minority holding in the market.
C. Both discounts are relevant to a minority interest.
1) Some appraisers believe that a DLOM should be applied to a control
interest in a closely-held company. This is not considered best practice
since a control shareholder can ensure liquidity with cash flows during
the period of illiquidity.
D. The discounts are applied sequentially, not in unison.

BV 206: Valuing Small and Medium-Sized Companies Chapter 6 - Sensitivity Analyses and Common Errors in Valuation
©2020 The Saudi Authority for Accredited Valuers (TAQEEM) 210
9. Double-counting risk by increasing the discount rate to account for the risk of owning a
minority interest and then taking a significant discount for lack of control and lack of
marketability
A. The valuer should have a list of factors that contribute to the discount rate and a
separate list of factors that contribute to the DLOM.
III. Sensitivity Analysis and Reconciliation of Values
1. After completing the valuation approaches, the final step in the process is to evaluate
the merits of each analysis and conclude at a final opinion of value.
2. At this point, the valuer should already understand the strengths and weaknesses of
each approach that was applied and may have decided how much weight to
appropriate to the income approach, market approach, and cost approach if each was
applied.
3. In some cases, each approach may seem equally strong (or equally weak) and further
analysis is necessary to reconcile the value indications into a final opinion.
A. Sensitivity Analyses are used to assess the potential weakness of an approach.
There is no fundamental principle that states that an approach to value is less
valid by virtue of the fact that it is highly sensitive to changes in its input
variables. Valuers though are usually less comfortable with a highly sensitive
valuation approach since small (and reasonable) changes in their inputs can
lead to material swings in value.
1) This can be awkward in all situations but is especially difficult in litigation
cases where an opposing attorney capitalizes on the sensitivity of the
outcome to small changes in the inputs.
4. Example
A. In the following case, a valuer applied the income approach to value an early-
stage software engineering firm. The Company is four years old and has
achieved commercial operations. Management expects the firm to grow
rapidly, and, judging from the firm’s success to date, the valuer agreed that
rapid growth in the short term is supportable. The DCF model below has equity
cash flows growing at a compound annual growth rate of 29.5 percent, a very
aggressive growth to be sustained over a ten year period. The input variables
in the model are as follows:
1) Beta = 1.0
2) Risk-free rate = 1.9%
3) ERP = 5.5%
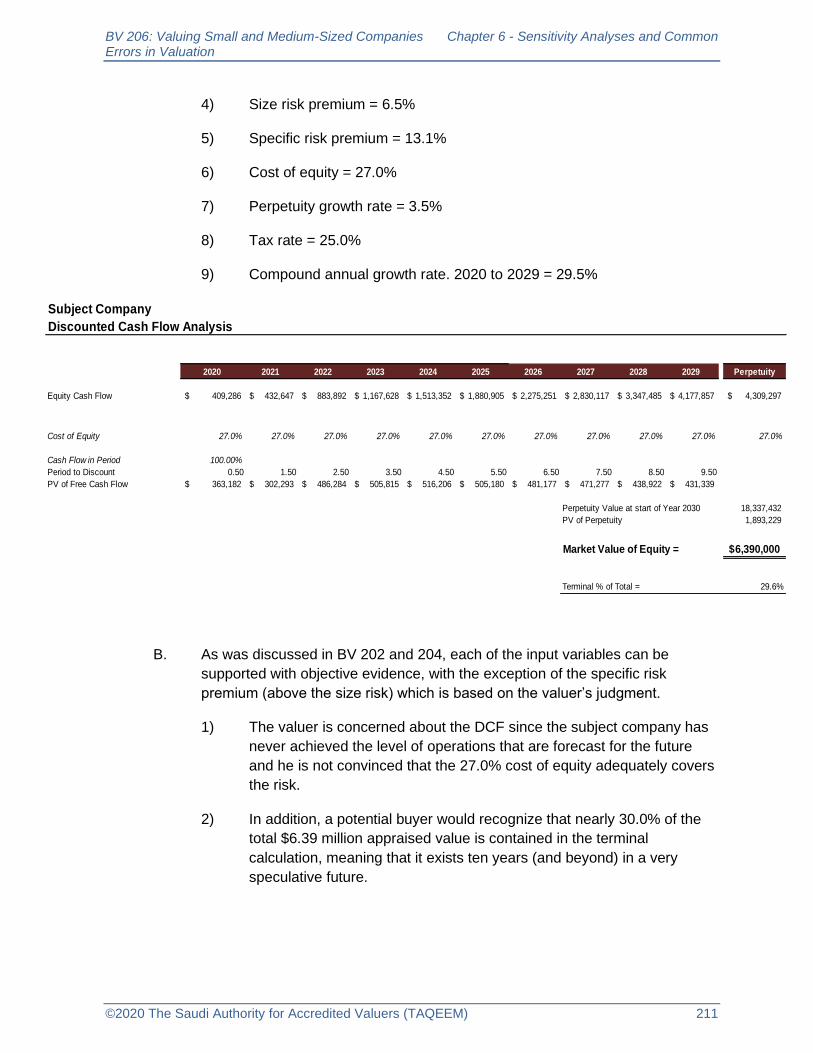
BV 206: Valuing Small and Medium-Sized Companies Chapter 6 - Sensitivity Analyses and Common Errors in Valuation
©2020 The Saudi Authority for Accredited Valuers (TAQEEM) 211
4) Size risk premium = 6.5%
5) Specific risk premium = 13.1%
6) Cost of equity = 27.0%
7) Perpetuity growth rate = 3.5%
8) Tax rate = 25.0%
9) Compound annual growth rate. 2020 to 2029 = 29.5%
B. As was discussed in BV 202 and 204, each of the input variables can be
supported with objective evidence, with the exception of the specific risk
premium (above the size risk) which is based on the valuer’s judgment.
1) The valuer is concerned about the DCF since the subject company has
never achieved the level of operations that are forecast for the future
and he is not convinced that the 27.0% cost of equity adequately covers
the risk.
2) In addition, a potential buyer would recognize that nearly 30.0% of the
total $6.39 million appraised value is contained in the terminal
calculation, meaning that it exists ten years (and beyond) in a very
speculative future.
Subject Company
Discounted Cash Flow Analysis
2020 2021 2022 2023 2024 2025 2026 2027 2028 2029 Perpetuity
Equity Cash Flow 409,286$ 432,647$ 883,892$ 1,167,628$ 1,513,352$ 1,880,905$ 2,275,251$ 2,830,117$ 3,347,485$ 4,177,857$ 4,309,297$
Cost of Equity 27.0% 27.0% 27.0% 27.0% 27.0% 27.0% 27.0% 27.0% 27.0% 27.0% 27.0%
Cash Flow in Period 100.00%
Period to Discount 0.50 1.50 2.50 3.50 4.50 5.50 6.50 7.50 8.50 9.50
PV of Free Cash Flow 363,182$ 302,293$ 486,284$ 505,815$ 516,206$ 505,180$ 481,177$ 471,277$ 438,922$ 431,339$
Perpetuity Value at start of Year 2030 18,337,432
PV of Perpetuity 1,893,229
Market Value of Equity = 6,390,000$
Terminal % of Total = 29.6%

BV 206: Valuing Small and Medium-Sized Companies Chapter 6 - Sensitivity Analyses and Common Errors in Valuation
©2020 The Saudi Authority for Accredited Valuers (TAQEEM) 212
3) The valuer therefore decided to do an analysis by changing the equity
discount rate and changing the growth rate to see how sensitive the
resultant value is to a change in the inputs.
4) The valuer created three sets of inputs, one each for a 2.0 percent
perpetuity growth, a 3.5% perpetuity growth, and a 5.0 perpetuity
growth. Each growth rate covers discount rates varying from a low of
23.0% to a high of 37%.
(a) The range of discount rate inputs comprised what the valuer
believed would be the reasonable range of realistic possibilities
of risk assessment given the subject company’s profile and the
forecast.
Discount
Rate
23.0% 8,160,000 34.7%
25.0% 7,110,000 -12.9% 31.2%
27.0% 6,260,000 -12.0% 28.0%
29.0% 5,560,000 -11.2% 25.2%
31.0% 4,980,000 -10.4% 22.6%
33.0% 4,490,000 -9.8% 20.3%
35.0% 4,070,000 -9.4% 18.3%
37.0% 3,720,000 -8.6% 16.4%
% change % in Terminal
Growth Rate = 2.0%
Equity Value
Discount
Rate
23.0% 8,420,000 36.7%
25.0% 7,230,000 -14.1% 33.0%
27.0% 6,390,000 -11.6% 29.6%
29.0% 5,660,000 -11.4% 26.6%
31.0% 5,050,000 -10.8% 23.8%
33.0% 4,550,000 -9.9% 21.4%
35.0% 4,120,000 -9.5% 19.2%
37.0% 3,760,000 -8.7% 17.2%
Growth Rate = 3.5%
Equity Value % change % in Terminal
Discount
Rate
23.0% 8,730,000 38.9%
25.0% 7,510,000 -14.0% 34.9%
27.0% 6,550,000 -12.8% 31.3%
29.0% 5,780,000 -11.8% 28.1%
31.0% 5,140,000 -11.1% 25.1%
33.0% 4,620,000 -10.1% 22.5%
35.0% 4,170,000 -9.7% 20.2%
37.0% 3,800,000 -8.9% 18.1%
Growth Rate = 5.0%
Equity Value % change % in Terminal

BV 206: Valuing Small and Medium-Sized Companies Chapter 6 - Sensitivity Analyses and Common Errors in Valuation
©2020 The Saudi Authority for Accredited Valuers (TAQEEM) 213
5) The valuer made the following observations:
(a) Value declines by higher percentages at the lower discount rates
as the cost of equity is increased.
For example, under the 2.0 growth rate scenario, value
dropped by 12.9% when the rate was increased from
23.0% to 25%, but only dropped by 8.6% when the rate
was increased from 35.0% to 37.0%.
(b) Higher growth rates in the terminal value make the appraised
values more sensitive to changes in the discount rate.
(c) The higher discount rates under all growth scenarios yield
significantly lower components of value in the terminal year
calculation.
For example, under the 2.0% growth scenario, a 23.0%
discount rate yielded a terminal value which comprised
34.7 percent of the total value, while a 37.0% discount
rate yielded only 16.4% in the terminal calculation.
(d) The values are not very sensitive to the different terminal year
growth rates. There is a narrow window of acceptable growth
rates that can be used into perpetuity.
(e) The values are very sensitive to changes in the discount rate,
especially increments in the 23% to 31% range, which lower
value by 10.0% to 15.0% at each increment.
6) Conclusions:
(a) A prospective buyer has solid ground on which to argue for a
lower value. With an appraised value of $6.39 million, the buyer
can point out that having nearly a third of total value housed in
the terminal calculation is way too speculative with an unproven
early stage company. This argument is supported by the fact
that the one-third terminal value won’t occur until years 10
through perpetuity, which is extremely speculative.
(b) A buyer would also argue that the discount rate is too
speculative and could just as easily be in the 31.0% to 35.0%
range with a company forecast to grow by a CAGR of 29.5
percent over the next ten years.
A real buyer in this scenario would be well advised to
counter the appraised value by arguing for a 33.0%

BV 206: Valuing Small and Medium-Sized Companies Chapter 6 - Sensitivity Analyses and Common Errors in Valuation
©2020 The Saudi Authority for Accredited Valuers (TAQEEM) 214
discount rate which not only yields a value that is nearly
30% lower ($4.55 million versus $6.39 million) but also
includes only 21.4 percent of the total in the terminal
year.
The buyer would be helped by the fact that there is no
objective evidence to support the specific premium of
13.0 percent versus 19.0 percent.
5. Sensitivity analyses can also be completed in the market approach by simply changing
the multiples upward and downward within a reasonable range that is suggested by the
guideline companies.
A. The analysis would be constrained by the observations made during the
comparison of the subject to the GPCs. If, for example, the subject company is
closer to a subset of the GPCs then the range of multiples would be limited to
the subset’s multiple range.
B. If there is a wide range of multiples among the GPCs it is not advisable to
complete a sensitivity throughout the entire range. Such a case suggests that
the GPCs are either not comparable to each other, or not comparable to the
subject company. The valuer should try to focus in one group of the
comparables.
C. Example
1) Assume the software engineering company in the above example is
compared to eleven guideline companies, with the results shown below
(after adjustments only for a difference in size between the subject
company and the GPCs)

BV 206: Valuing Small and Medium-Sized Companies Chapter 6 - Sensitivity Analyses and Common Errors in Valuation
©2020 The Saudi Authority for Accredited Valuers (TAQEEM) 215
2) The valuer removed an outlier from both multiples (Simulations Plus
from the sales multiple and QAD from the EBITDA multiple) and
selected multiples at or near the median. The propriety of this decision
assumes that the subject company lies at the median of the GPCs in
terms of risk profile and growth. The market approach values fall just
below and just above the income approach value, which was
$6,390,000.
Subject Company
Regression Analysis - Sales Multiple
MVIC/LTM Sales MVIC/LTM EBITDA
CommVault Systems, Inc. 3.20 28.61
Open Text Corp. 3.27 8.97
NetScout Systems, Inc. 1.95 16.30
National Instruments Corporation 3.02 16.84
Simulations Plus, Inc. 11.71 28.01
GlobalSCAPE, Inc. 2.28 10.52
QAD, Inc 2.45 289.44
MicroStrategy, Inc. 0.84 6.84
Altair Engineering, Inc. 3.30 33.23
Pegasystems, Inc. 1.39 7.84
Progress Software Corp 3.77 10.74
All Statistics
Average 3.38 41.58
Median 3.02 16.30
Standard deviation 2.90 82.72
Coefficient of Variation 0.86 1.99
Statistics With Outliers Removed
Average 2.55 16.79
Median 2.74 13.52
Standard deviation 1.20 27.01
Coefficient of Variation 0.47 1.61
Note: shaded cells are outliers
Valuer's Conclusion
MVIC/ 2020 Sales 2,250,000$
MVIC/Sales multiple 2.75x
Indicated Value 6,187,500$
MVIC/ 2020 EBITDA 545,000$
MVIC/EBITDA multiple 13.00x
Indicated Value 7,085,000$

BV 206: Valuing Small and Medium-Sized Companies Chapter 6 - Sensitivity Analyses and Common Errors in Valuation
©2020 The Saudi Authority for Accredited Valuers (TAQEEM) 216
3) The coefficient of variation statistic shows that the sales multiples are
more tightly clustered than the EBITDA multiples, which can easily be
discerned by just be looking at the range in each array. The valuer
should consider this as one factor in deciding whether or not to use the
EBITDA multiple, and how much weight to appropriate to it.
4) The valuer conducted two sensitivity analyses, one each for the sales
and EBITDA multiple, showing an array of multiples applied to an array
of operating metrics which the valuer judged would be within the range
of reasonableness.
5) The actual value is shown in bold. The range in values in the above
sensitivity is about three times, meaning that the highest outcome is
about three times the lowest.
(a) If the array of multiples and sales levels are all within the range
of possibility (meaning that given the facts of the case, a valuer
could potentially support choosing a sales level as low as $1.75
million or as high as $2.75 million, and/or select a multiple as low
as 1.75x or as high as 3.5x) then the sensitivity analysis above is
fairly extreme, showing a range not only of three times, but also
increments over 10.0 percent in the options just below and
above the chosen value.
1,750,000$ 2,000,000$ 2,250,000$ 2,500,000$ 2,750,000$
MVIC/Sales
1.75x 3,062,500 3,500,000 3,937,500 4,375,000 4,812,500
2.00x 3,500,000 4,000,000 4,500,000 5,000,000 5,500,000
2.25x 3,937,500 4,500,000 5,062,500 5,625,000 6,187,500
2.50x 4,375,000 5,000,000 5,625,000 6,250,000 6,875,000
2.75x 4,812,500 5,500,000 6,187,500 6,875,000 7,562,500
3.00x 5,250,000 6,000,000 6,750,000 7,500,000 8,250,000
3.25x 5,687,500 6,500,000 7,312,500 8,125,000 8,937,500
3.50x 6,125,000 7,000,000 7,875,000 8,750,000 9,625,000
Sales Levels
Sales Multiple Sensitivity
500,000$ 525,000$ 545,000$ 575,000$ 600,000$
MVIC/EBITDA
9.00x 4,500,000 4,725,000 4,905,000 5,175,000 5,400,000
10.00x 5,000,000 5,250,000 5,450,000 5,750,000 6,000,000
11.00x 5,500,000 5,775,000 5,995,000 6,325,000 6,600,000
12.00x 6,000,000 6,300,000 6,540,000 6,900,000 7,200,000
13.00x 6,500,000 6,825,000 7,085,000 7,475,000 7,800,000
14.00x 7,000,000 7,350,000 7,630,000 8,050,000 8,400,000
15.00x 7,500,000 7,875,000 8,175,000 8,625,000 9,000,000
16.00x 8,000,000 8,400,000 8,720,000 9,200,000 9,600,000
EBITDA Levels
EBITDA Multiple Sensitivity

BV 206: Valuing Small and Medium-Sized Companies Chapter 6 - Sensitivity Analyses and Common Errors in Valuation
©2020 The Saudi Authority for Accredited Valuers (TAQEEM) 217
6) The above sensitivity shows a range of a little over two times ($4.5
million to $9.6 million), a tighter array than the sales multiple.
7) The increments are also lower with the next highest and lowest values
around the chosen value at a 3.0% to 8.0% differential range.
8) The analyses above therefore show that the EBITDA multiple data is
somewhat less sensitive to the chosen increments than the sales data.
However, it should be noted that the sales mutliples themselves are
more closely clustered than the EBITDA multiples (as seen in the
coeficient of variation) which may give the valuer greater confidence in
the final weighting.
6. Sensitivity analyses offer little insight into the legitimacy of the multiple itself. That
analysis is made by looking at the substance of the comparison between the subject
company and the GPCs, and also by comparing the GPCs to each other. A high
sensitivity may simply mean that the arrays chosen may not be reasonable.
A. Sensitivity analyses provide a comfort level when weighting different
apporaches and methodologies. These analyses may be one of many factors
considered in the decision to include or exclude an approach to value.

BV 206: Valuing Small and Medium-Sized Companies Chapter 6 - Sensitivity Analyses and Common Errors in Valuation
©2020 The Saudi Authority for Accredited Valuers (TAQEEM) 218
IV. Chapter Review Questions
1. When the results of an income approach and market approach are widely divergent,
the valuer should:
A. Average the two approaches to determine a final conclusion of value.
B. Convert the income market multiple used to a capitalization rate and compare
to the capitalization rate used in the income approach to identify the
inconsistency in assumptions.
C. Rely on the income approach since in most public markets there are few truly
comparable guideline companies.
D. Choose one approach or the other since one of them is, by definition,
inaccurate.
2. A valuer completed a valuation that yielded the following results:
Income approach capitalization method SAR 28,500,000
Income approach DCF SAR 26,500,000
Market approach SAR 39,000,000
Cost approach SAR 14,100,000
Conclusion of Value SAR 27,000,000
One of the mistakes that the valuer committed in this analysis is:
A. Given the array of results, a value closer to SAR 33,000,000 is warranted.
B. The cost approach is invalid in a company that has goodwill value.
C. The market approach methodology is not identified
D. There is no reason to include two forms of the income approach

BV 206: Valuing Small and Medium-Sized Companies Chapter 6 - Sensitivity Analyses and Common Errors in Valuation
©2020 The Saudi Authority for Accredited Valuers (TAQEEM) 219
3. The point of conducting a sensitivity analysis is:
A. To determine the validity of a valuation approach
B. To reconcile the different approaches to value
C. To provide the valuer with a comfort level with the approach to value and the
inputs applied therein
D. To provide an indication that another approach to value should be added to the
analysis.
Answers: 1-B, 2-D, 3-C


