61
BXP Investor Update Nareit REITWeek 2021 June 8-10, 2021

BXP Investor Update
Nareit REITWeek 2021 June 8-10, 2021
2
Except as otherwise expressly indicated, all data is as of March 31, 2021.
Forward-Looking StatementsThis presentation contains forward-looking statements within the meaning of the federal securities laws. Please refer to the Appendixfor information on how to identify these statements, as well as risks and uncertainties, including the impact of the COVID-19 pandemic and related governmental actions and changes in economic conditions that could cause the Company’s actual results to differ materially from those expressed or implied by the forward-looking statements. The Company does not intend, nor does it undertake a duty, to update any forward-looking statements, except as may be required by law.
Use of Non-GAAP Financial Measures and Other DefinitionsThis presentation contains certain non-GAAP financial measures within the meaning of Regulation G and other terms that have particular definitions when used by the Company. The Company’s definitions may differ from those used by other companies and, therefore, may not be comparable. The definitions of these terms and, if applicable, the reasons for their use and reconciliations to the most directly comparable GAAP measures are included in the Appendix.

3
The largest publicly-traded developer, owner and manager of Class A office properties in the U.S.
BXP Quick Facts
1. Includes 100% of consolidated and unconsolidated properties.
2. See Appendix.
3. Excludes residential and hotel properties. Calculation is based on BXP’s Share of Annualized Rental Obligations. See Appendix4. Represents proforma square footage which includes 3.3M SF of stabilized portfolio, 1.9M SF of current and planned life sciences redevelopments and 4.0M SF of future potential development opportunities. Represents 100% of consolidated and
unconsolidated properties. Actual square footage may differ materially depending on the outcome of the permitting and entitlement processes for each project. As of June 7, 2021.
5. FTSE Nareit All REITs Index.
S&P 500Company
$2.7 BillionBXP’s Share of
AnnualizedRevenue2
196Properties1
51.6MSquare Feet Owned1
Top 5% Sustainanalytics
Global Universe
3.9%Dividend Yield
4.3MSquare Feet Currently under Development /
Redevelopment1
$1.6BBXP’s Share of
Annualized EBITDAre2
1021% Total Return
Since 1997 IPO
• 1.8x S&P 500• 1.5x REIT Index5
8-YearWeighted-average lease
term3
9.2MSquare Foot Life
Sciences Portfolio4

4
NOI by Region Q1 20113
Strategically capitalizing on growth regions and sectors
BXP: A History of Deploying Capital to Drive Growth:
• Dispositions 11M SF (2010-Q1 2021)
- Washington, DC; Suburban Maryland and Suburban Virginia (4.3M SF)
- New York, NY (3M SF)
• Acquisitions 10M SF (2010-Q1 2021)
- Boston/Waltham, MA (4M SF)
- Los Angeles, CA (2.7M)
• Development deliveries 13M SF (2010-Q1 2021)
- Boston and Waltham, MA (4M SF)
- San Francisco/Oakland, CA (2.6M SF)
- Reston, VA (1.7M SF)
NOI by Region Q1 20213
TAMI & Life Science Growth 2011-20214
Acquisitions, Developments & Dispositions
1. 2021 includes acquisition, disposition and development delivery activity through March 31, 2021 as well as projected development deliveries through Q4 2021 as detailed on slide 22.
2. 2022-2024 includes projected development deliveries as detailed on slide 22. See Appendix for information on forward–looking statements
3. Excluding termination income. See Appendix.4. Represents 100% of Consolidated and Unconsolidated Annualized Rental Obligations from tenants in the technology, media, life sciences and healthcare sector for the fourth first quarter of each year from Q1 2011 through Q1 2020

5
Focus on Gateway Regions with Favorable Supply/Demand and Rent Growth
BXP Markets:
BXP square feet1 5.8M
% of BXP’s Share of NOI2
8%
BXP square feet1 8.2M
% of BXP’s Share of NOI2 22%
SAN FRANCISCO
22%
WASH.DC6%
BOSTON33%
BXP square feet1 11.8M
% of BXP’s Share of NOI2
28%
BXP square feet1 2.3M
% of BXP’s Share of NOI2 4%
BXP square feet1 15.5M
% of BXP’s Share NOI2
33%
BXP square feet1 3.7M
% of BXP’s Share of NOI2
6%
NEW YORK28%
RESTON and North
VA8%
LOS ANGELES
3%
1. Includes 100% of consolidated and unconsolidated joint venture properties.2. Excludes termination income. See Appendix.

6
Technology & Media20%
Life Sciences6%
Legal Services22%
Government/Public Administration
1%
Retail6%
Other Professional
Services7%
Other2%
Financial Services, other17%
Commercial & Investment Banking
8%
Real Estate & Insurance
7%
Manufacturing 4%
Broad Portfolio Balanced Across Established and Growth Sectors
BXP Tenant Base:
Industry Diversification1
1. Represents industry diversification percentages based on BXP’s Share of Annualized Rental Obligations. See Appendix.2. See Appendix.3. Represents weighted-average remaining lease term of top 20 tenants
Top 20 Tenants% of BXP’s Share ofAnnualized Rental
Obligations2
Years of Remaining Lease Term By
Annualized Rental Obligations3
salesforce.com 3.6% 10.8
Arnold & Porter Kaye Scholer 3.0% 13.2
Akamai Technologies 2.2% 13.6
Biogen 1.8% 5.6
Shearman & Sterling 1.6% 12.6
Kirkland & Ellis 1.6% 16.2
Ropes & Gray 1.5% 9.3
WeWork 1.4% 12.4
Google 1.4% 16.4
Weil Gotshal & Manges 1.2% 13.1
Microsoft 1.2% 10.7
Wellington Management 1.2% 6.2
Millennium Management 1.2% 9.8
US Government 1.1% 4.6
Aramis (Estee Lauder) 1.1% 16.3
Morrison & Foerster 0.9% 9.4
O’Melveny & Myers 0.9% 3.7
Bank of America 0.9% 14.7
Mass Financial Services 0.8% 6.9
Under Armour 0.8% 13.0
Total top 20 29.4% 11.23

7
1. Calculated as BXP’s Share of Annualized Revenue from Parking, Hotel and Retail in Q4 2020 as compared to BXP’s Share of Annua lized Revenue from Parking, Hotel and Retail in Q4 2019.2. Represents BXP’s Share of Estimated Total Investment, including income (loss) and interest carry during development. For add itional information, refer to the “Active Development Pipeline” page of this presentation.3. Includes leases with future commencement dates. As of May 8, 20214. Represents BXP’s Share. For additional detail please refer to the slide “Projected NOI from Developments Enhance Growth” in this presentation.5. Calculations assume a projected weighted-average stabilized BXP’s Share of NOI—cash yield of 6.7%, with a $1 per foot management fee deduction, on BXP’s Share of total budgeted costs, which is then valued at a 4.5% cap rate. For additional detail please refer to the slide “Projected NOI from Developments Enhance Growth” in this presentation.6. See appendix.7. Represents cash, cash equivalents, cash held in escrow and availability under revolving line of credit as of March 31, 2021.
BXP Today
Positioned
for Growth
• Signed 592k SF of leases in Q1 despite pandemic− 84% of pre-pandemic leasing volume in Q1 2020
Leasing momentum:
• Parking, hotel and retail = ~$130M1 of revenue loss, expected to return as vaccination distributions continue
Predictable return of ancillary revenue streams:
• Existing $2.0B pipeline of office developments2, 86% pre-leased3
• Additional $558M of current life sciences development/ redevelopments
• Total Development Pipeline projected to add $234M Cash NOI upon stabilization4
− $1.6B Projected value creation through 20245
Growth from development:
• Track record of growth– 7% average annual FFO growth 2015-20196
• Modest lease expirations next 3 years
• Positive historical mark/market− 20% average annual mark/market in net rents
Q1 2016-Q1 2021
A resilient portfolio of high-quality assets
• $2.4B liquidity7
• History of selling mature assets and redeploying capital into new growth opportunities
A proven track record of intelligent capital allocation

8
1M SF of New Leasing, New Life Sciences Acquisitions
BXP News
• Acquired 153 & 211 Second Avenue, Waltham, MA
• Started four redevelopment/ developments: 920,000 SF2
• Secured an additional 1.4M SF of entitlements in Cambridge, MA
New LeasingReflects tenant demand for
Class A office
Growing Life SciencesNew acquisition, development starts
and entitlements
1. Includes leases with future commencement dates
2. Includes 100% of consolidated and unconsolidated properties.
Recent large, long-term new leases
Entertainment Media Company
351,000 sf
Social media Company 140,000 sf
BCG 98,000 sf
Metron 77,000 sf
Roku 72,000 sf
Leidos 72,000 sf
Net App 35,000 sf
592,000 SF1
of leasingQ11.0M SF1 of leasing
QTD Q2

BXP Life Sciences

10
9.2M1 Square Feet of Current and Future Life Sciences Tenants
BXP Life Sciences:
~3.3M SF Stabilized Portfolio• Leased to 85+ tenants
~1.9M SF of lab conversions• Current:
• 200 West Street, Waltham, MA
• 880 Winter Street, Waltham, MA
• 180 CityPoint, Waltham MA
• 751 Gateway, South San Francisco, CA
• Future:
• Eight additional properties
~4.0M SF of future development
• Waltham, MA
• Cambridge, MA
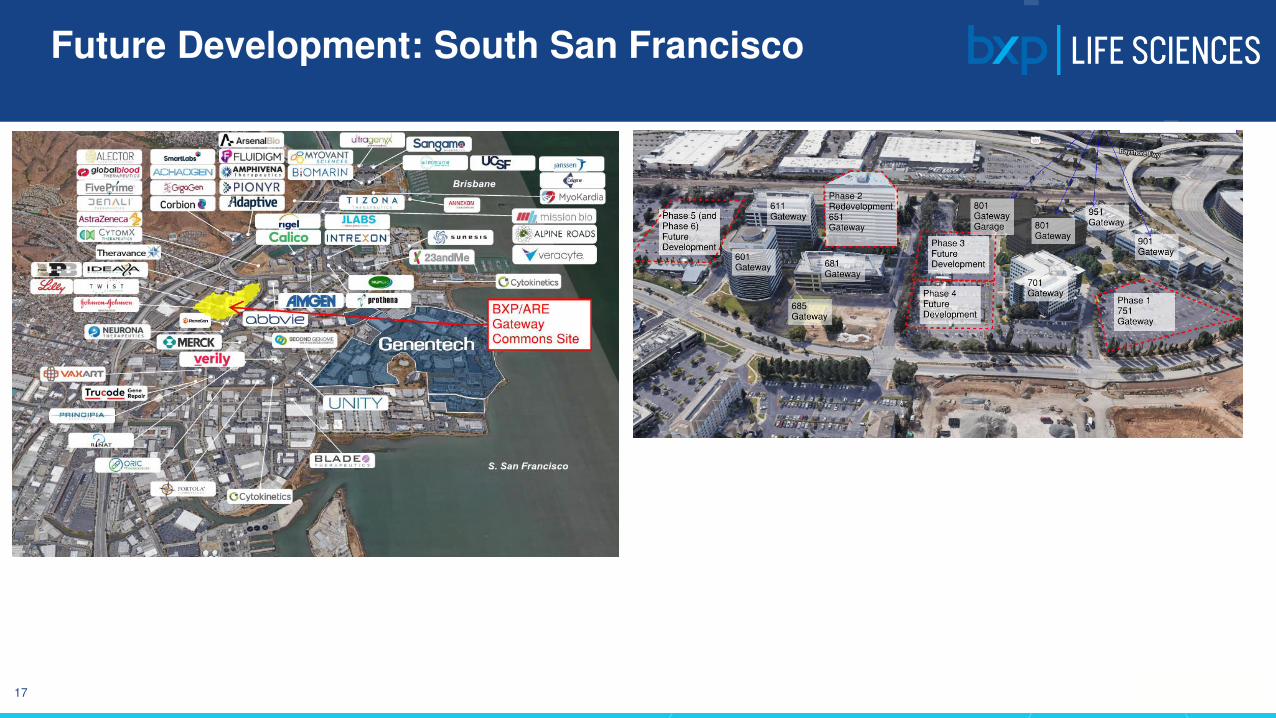
• South San Francisco, CA (Gateway Phase 2+)
• Princeton, NJ
1. Represents proforma square footage which includes 3.3M SF of stabilized portfolio, 1.8M SF of current and planned life sciences redevelopments and 4.0M SF of future potential development opportunities. Represents 100% of consolidated and unconsolidated properties. Actual square footage may differ materially depending on the outcome of the permitting and entitlement processes for each project.. As of June 7, 2021.

11
A Proven Track Record of Success
BXP Life Sciences:
1. Represents 100% of Consolidated and Unconsolidated Annualized Rental Obligations from tenants in the life sciences and healthcare sector for the fourth quarter of each year from Q4 2015 through Q4 2020
mill
ion
s
$100
$110
$120
$130
$140
$150
$160
$170
$180
$190
$200
2015 2016 2017 2018 2019 2020
BXP Life Sciences 2015-20201
8%CAGR
mill
ions

12
New Acquisition: 153 & 211 Second Avenue, Waltham

13
$560M investment1 with ~8% projected returns2
1. Represents estimated total investment, including income (loss) and interest carry during development. BXP’s Share.2. There can be no assurance that the Company will be successful in leasing the properties on the expected schedule or at the assumed rental rates and there can be no assurance that the Company meets its projected returns.
880 Winter Street
• Redevelopment
• Waltham, MA
• 224,000 SF
• Ownership 100%
• Projected investment: $108M1
• Initial occupancy: Q3 2023
751 Gateway
• Ground up development
• South San Francisco, CA
• 229,000 SF
• Ownership 49%
• Projected investment: $128M1
• Initial occupancy: Q1 2023
• Part of 1.1M SF life sciences campus development
• Entitlements in process for additional 1M SF
180 CityPoint
• Ground up development
• Waltham, MA
• 329,000 SF
• Ownership 100%
• Projected investment: $275M1
• Initial occupancy: Q1 2024
200 West Street
• Redevelopment
• Waltham, MA
• 138,000 SF
• Ownership 100%
• Projected investment: $48M1
• Initial occupancy: Q4 2021
920,000 SF of Redevelopment/Developments in Life Sciences:
14
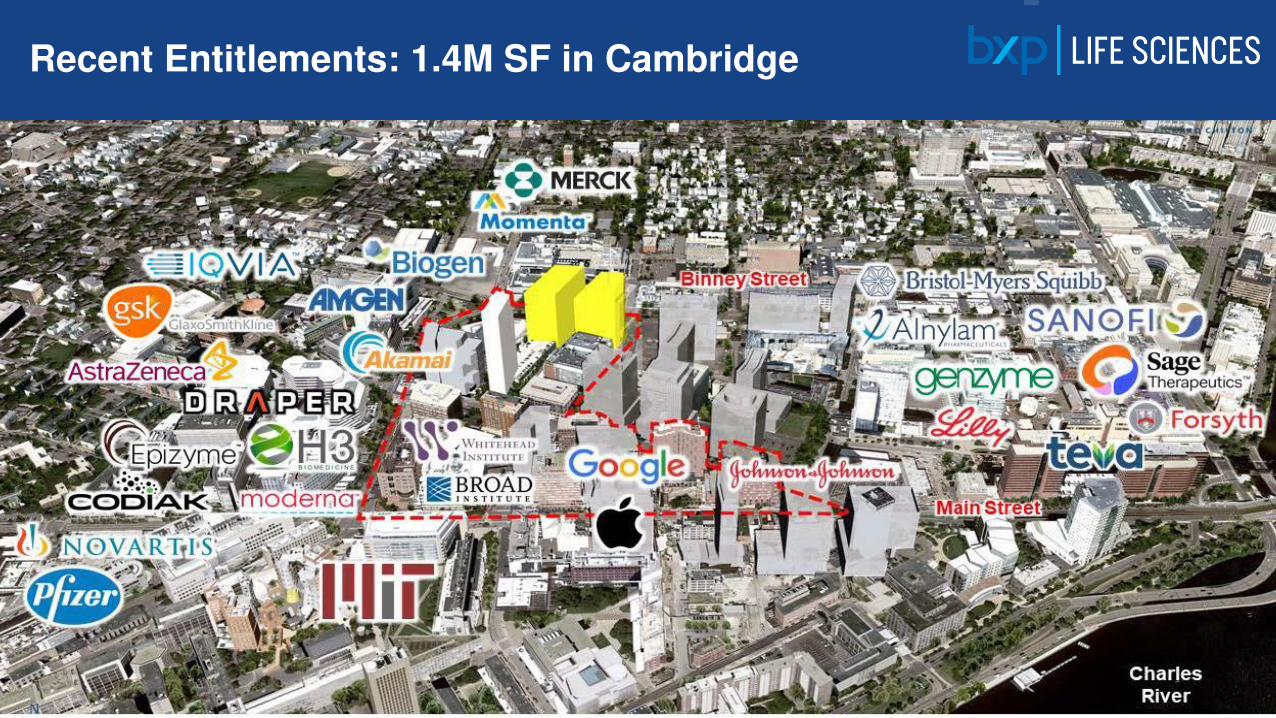
Recent Entitlements: 1.4M SF in Cambridge

15
Recent Entitlements in Cambridge
• #1 life sciences cluster in the US (15M SF)
• 1,000,000 SF commercial
• 400,000 SF residential
• Located in the middle of Kendall Square, adjacent to MIT and Google campuses
16
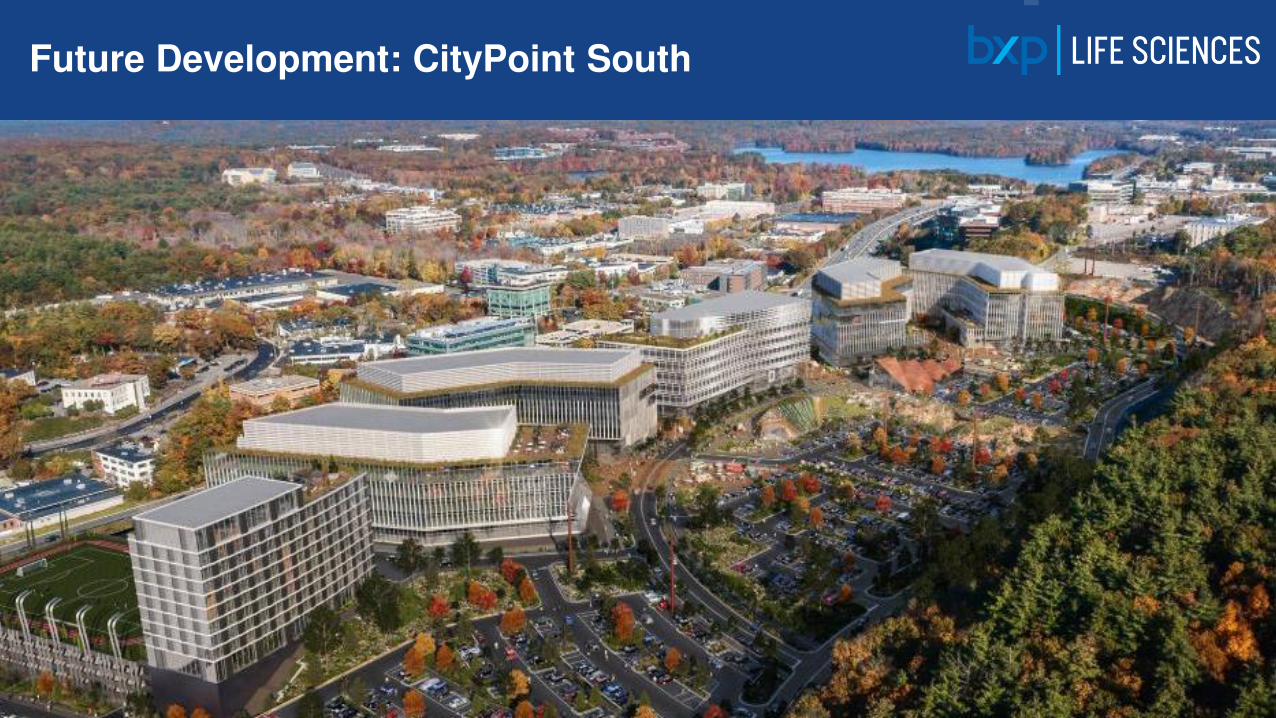
Future Development: CityPoint South
17
Future Development: South San Francisco

BXP: Growth Profile
19
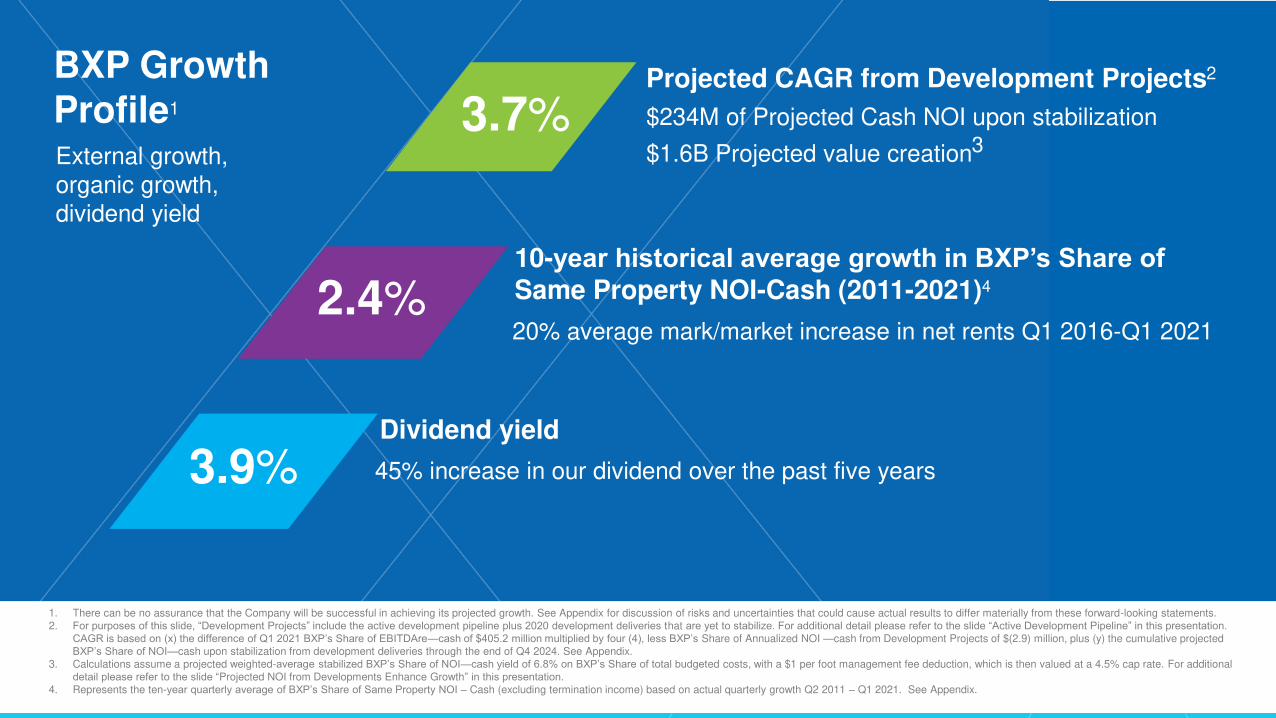
BXP Growth Profile1
External growth, organic growth, dividend yield
3.7%Projected CAGR from Development Projects2
$234M of Projected Cash NOI upon stabilization
$1.6B Projected value creation3
2.4%10-year historical average growth in BXP’s Share of Same Property NOI-Cash (2011-2021)4
20% average mark/market increase in net rents Q1 2016-Q1 2021
3.9%Dividend yield
45% increase in our dividend over the past five years
1. There can be no assurance that the Company will be successful in achieving its projected growth. See Appendix for discussion of risks and uncertainties that could cause actual results to differ materially from these forward-looking statements.2. For purposes of this slide, “Development Projects” include the active development pipeline plus 2020 development deliveries that are yet to stabilize. For additional detail please refer to the slide “Active Development Pipeline” in this presentation.
CAGR is based on (x) the difference of Q1 2021 BXP’s Share of EBITDAre—cash of $405.2 million multiplied by four (4), less BXP’s Share of Annualized NOI —cash from Development Projects of $(2.9) million, plus (y) the cumulative projected BXP’s Share of NOI—cash upon stabilization from development deliveries through the end of Q4 2024. See Appendix.
3. Calculations assume a projected weighted-average stabilized BXP’s Share of NOI—cash yield of 6.8% on BXP’s Share of total budgeted costs, with a $1 per foot management fee deduction, which is then valued at a 4.5% cap rate. For additional detail please refer to the slide “Projected NOI from Developments Enhance Growth” in this presentation.
4. Represents the ten-year quarterly average of BXP’s Share of Same Property NOI – Cash (excluding termination income) based on actual quarterly growth Q2 2011 – Q1 2021. See Appendix.

20
$2.0B Active Office Developments1 – 86% pre-leased2
7750 Wisconsin Avenue, Bethesda, MD100% pre-leased. Tenant: Marriott
Reston Next, Reston, VA85% pre-leased. Primary tenant: Fannie Mae
100 Causeway Street, Boston, MA94% pre-leased. Primary tenant: Verizon
2100 Pennsylvania Avenue, Washington, DC56% pre-leased. Primary tenant: WilmerHale
325 Main Street, Cambridge, MA90% pre-leased. Primary tenant: Google
1. As of May 8, 2021. Includes leases with future commencement dates
3.3M SF Active Office Developments – 86% pre-leased1

21
59,000 SF World-Class Observatory at the top of the Prudential Tower
Other Development Starts:
• Redevelopment of prior restaurant
• 50-52 floor of Prudential Tower, Boston, MA
• 59,000 SF
• 11,000 SF of outdoor space
• Will be Boston’s only observatory
• Dramatic, 360-degree outdoor viewing deck
• Transformative addition to the Prudential Center
• Expected opening date: 2023

22
$2.7 Billion Active Development Pipeline1
1. Represents BXP’s Share of estimated total cost, including income (loss) and interest carry on debt and equity investment during development. See Appendix.2. Data as of May 8, 2021. Includes leases with future commencement dates.3. Excludes observatory.
1
Project Name - Key Tenant Location Square FeetBXP’s
Ownership Percentage
Estimated Total Investment
(BXP’s Share)1
Estimated Investment
PSF1
Percent Leased2
Actual/Est. Initial
Occupancy
OFFICE
100 Causeway Street - Verizon Boston, MA 632,000 50% $267,300,000 $846 94% Q3 2021
Reston Next - Fannie Mae Reston, VA 1,062,000 100% $715,300,000 $674 85% Q1 2022
7750 Wisconsin Avenue - Marriott (International HQ) Bethesda, MD 734,000 50% $198,900,000 $542 100% Q2 2022
325 Main Street - Google Cambridge, MA 420,000 100% $418,400,000 $996 90% Q3 2022
2100 Pennsylvania Avenue - WilmerHale Washington, DC 480,000 100% $356,100,000 $742 56% Q3 2022
Total Office Properties under Construction 3,328,000 $1,956,000,000 $740 86%
LAB/LIFE SCIENCES
200 West Street - Translate Bio Waltham, MA 138,000 100% $47,800,000 $346 100% Q4 2021
751 Gateway South San Francisco, CA 229,000 49% $127,600,000 $1,137 - Q1 2023
880 Winter Street Waltham, MA 224,000 100% $108,000,000 $482 - Q3 2023
180 CityPoint Waltham, MA 329,000 100% $274,700,000 $835 - Q1 2024
Total Lab/LifeSciences Properties Under Construction and Redevelopment 920,000 $558,100,000 $695 15%
OTHER
The Prudential Center Observatory (Redevelopment) Boston, MA 59,000 100% $182,300,000 $3,090 N/A Q2 2023
Total Properties Under Construction and Redevelopment 4,307,000 $2,696,400,000 $769 71%3
23
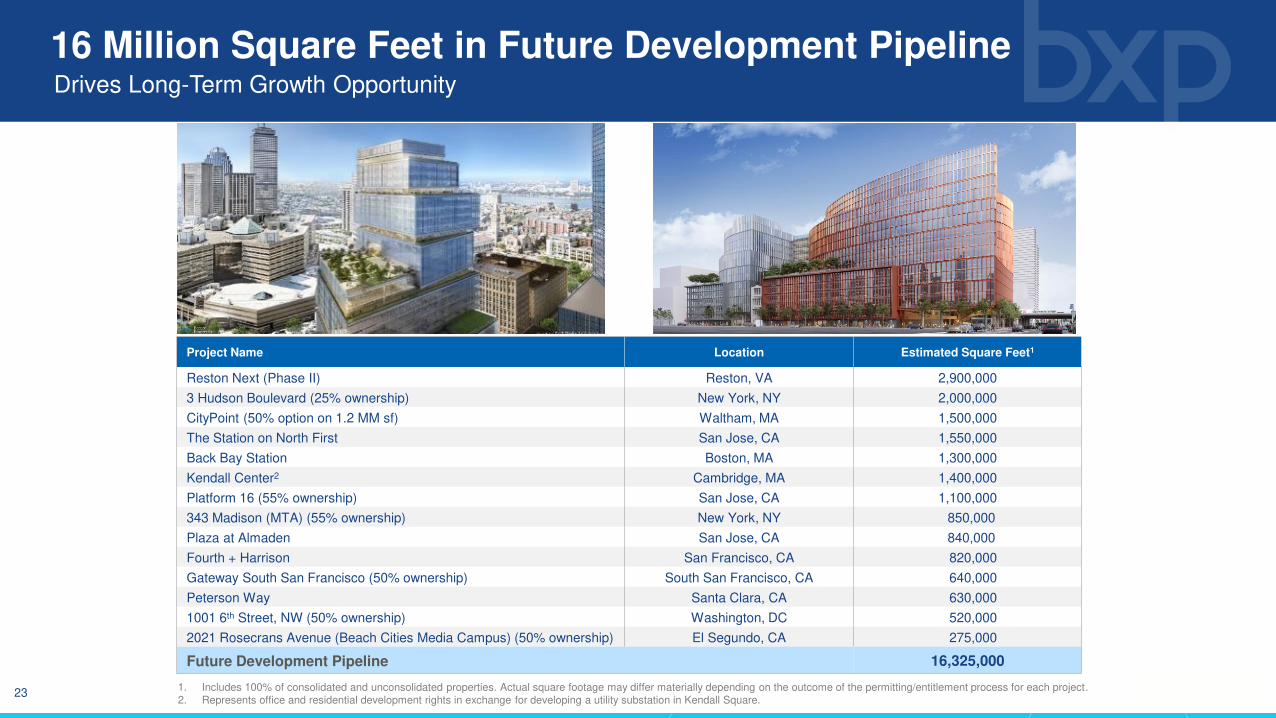
Drives Long-Term Growth Opportunity
16 Million Square Feet in Future Development Pipeline
Back Bay Station Fourth + Harrison
1. Includes 100% of consolidated and unconsolidated properties. Actual square footage may differ materially depending on the outcome of the permitting/entitlement process for each project.2. Represents office and residential development rights in exchange for developing a utility substation in Kendall Square.
Project Name Location Estimated Square Feet1
Reston Next (Phase II) Reston, VA 2,900,000
3 Hudson Boulevard (25% ownership) New York, NY 2,000,000
CityPoint (50% option on 1.2 MM sf) Waltham, MA 1,500,000
The Station on North First San Jose, CA 1,550,000
Back Bay Station Boston, MA 1,300,000
Kendall Center2 Cambridge, MA 1,400,000
Platform 16 (55% ownership) San Jose, CA 1,100,000
343 Madison (MTA) (55% ownership) New York, NY 850,000
Plaza at Almaden San Jose, CA 840,000
Fourth + Harrison San Francisco, CA 820,000
Gateway South San Francisco (50% ownership) South San Francisco, CA 640,000
Peterson Way Santa Clara, CA 630,000
1001 6th Street, NW (50% ownership) Washington, DC 520,000
2021 Rosecrans Avenue (Beach Cities Media Campus) (50% ownership) El Segundo, CA 275,000
Future Development Pipeline 16,325,000

BXP Sustainability

25
BXP ESG
Updates• Previously established an emissions reduction target
ambition in line with a 1.5°C trajectory– The most ambitious designation available at the time of
submission under the Science Based Targets initiative. – BXP was the only North American office company with this
distinction.
Committed to achieving carbon neutral operations by 2025
• Increases Board oversight of sustainability issues
• Direct resource to management
Established a Board Sustainability Committee
• Developed and implemented a comprehensive Health Security plan
• Earned a 2020 Best in Building Health award
• Completed Fitwel’s Viral Response Module enterprise certification.
Furthered our leadership in Building Health and Wellness
• Identified actionable goals and proposed initiatives in the areas of recruitment and development, Company policies, and community outreach
• Each executive is evaluated on their diversity efforts -achievement of these goals is directly tied to annual compensation
Launched a Diversity & Inclusion Committee
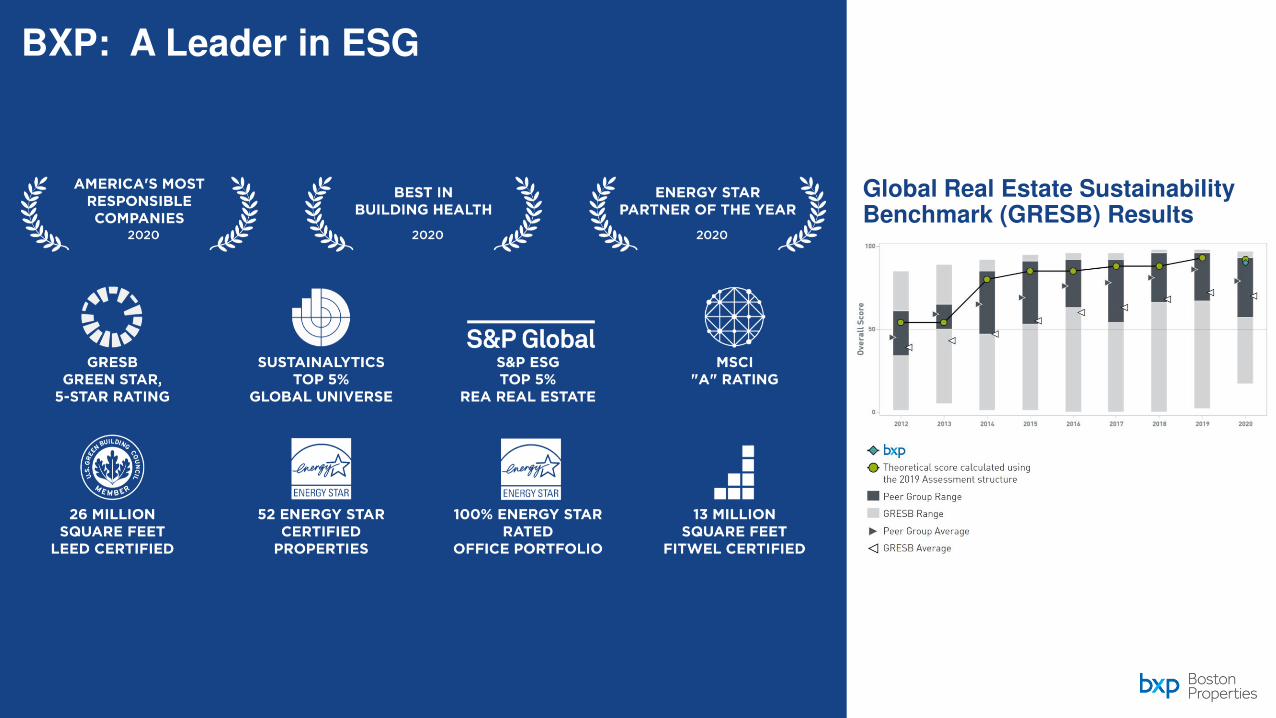
• Ranked among top real estate companies, earned fifth consecutive 5-Star rating
• 9+ years of “Green Star” designations• Green Lease Leader – Gold
• MSCI “A Rating”• Newsweek 56th Most Responsible Company
• Sustainalytics Top 5% Global Universe
• S&P ESG Score – Top 5% REA Real Estate.
• >25 Million SF LEED Gold and Platinum
Maintained ESG Leadership Position
26
BXP: A Leader in ESG
Global Real Estate Sustainability Benchmark (GRESB) Results

27
Energy & Water Efficiency
Green Building
Renewable Energy
Carbon-Neutrality
Climate Risk Awareness
Asset-level Preparedness
Scenario Analysis
Management & Planning
Healthy Buildings
Community Involvement
Employee Programs
Diversity & Inclusion
Climate Action Resilience Social Good
Numbers above correspond to Sustainable Development Goals as defined by The United Nations’
BXP Sustainability Framework
28
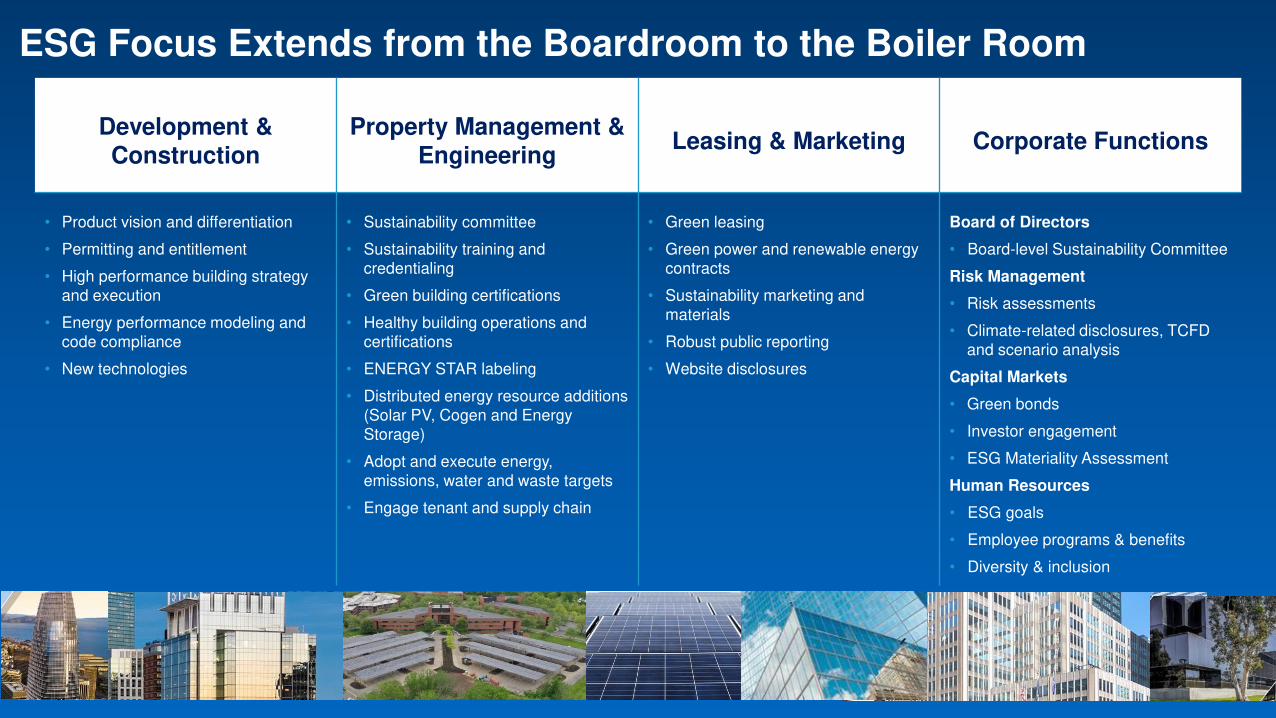
ESG Focus Extends from the Boardroom to the Boiler Room
Development & Construction
Property Management & Engineering
Leasing & Marketing Corporate Functions
• Product vision and differentiation
• Permitting and entitlement
• High performance building strategy and execution
• Energy performance modeling and code compliance
• New technologies
• Sustainability committee
• Sustainability training and credentialing
• Green building certifications
• Healthy building operations and certifications
• ENERGY STAR labeling
• Distributed energy resource additions (Solar PV, Cogen and Energy Storage)
• Adopt and execute energy, emissions, water and waste targets
• Engage tenant and supply chain
• Green leasing
• Green power and renewable energy contracts
• Sustainability marketing and materials
• Robust public reporting
• Website disclosures
Board of Directors
• Board-level Sustainability Committee
Risk Management
• Risk assessments
• Climate-related disclosures, TCFD and scenario analysis
Capital Markets
• Green bonds
• Investor engagement
• ESG Materiality Assessment
Human Resources
• ESG goals
• Employee programs & benefits
• Diversity & inclusion

29
Public Sustainability Goals
41% energy use intensity reduction
The status of our current goal will remain in
progress until our buildings are repopulated
in 2021 and 2022.
86% Scope 1 and Scope 2carbon emissions intensity reduction
• 45x25 Goal achieved prior to COVID-19 impacts.
• Scope 3 calculations are in the process of completion.
• We have committed to
achieving carbon-neutral
operations, or net-zero
carbon dioxide equivalent
emissions, by 2025.
30
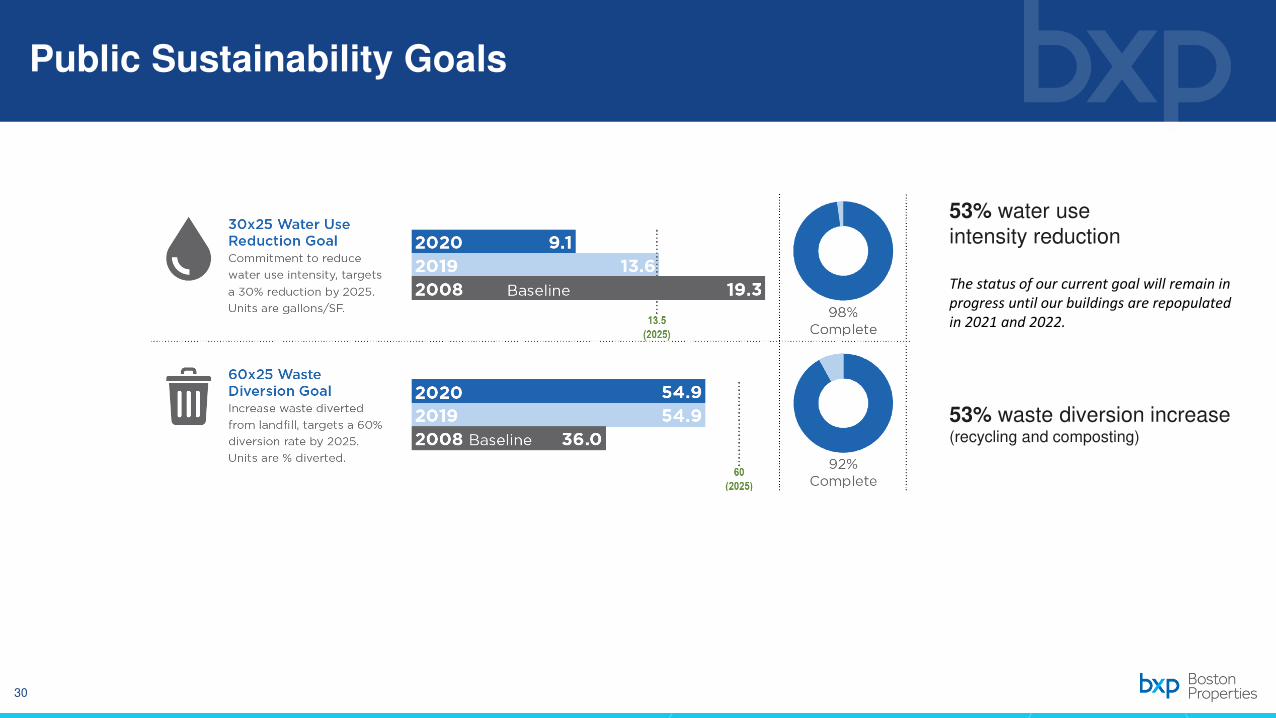
53% waste diversion increase(recycling and composting)
Public Sustainability Goals
53% water use intensity reduction
The status of our current goal will remain in
progress until our buildings are repopulated
in 2021 and 2022.

31
BXP has an approved science-based target, confirming an emissions reduction rate equal to our greater than the rate of reduction required to keep global temperature increase below 1.5º C.
>$30 Million
Avoided Annual Energy Operating Cost
Energy Efficient Operations and Decarbonization
94.9
56.2
64.7
9.2
1.3
0
0
1
2
3
4
5
6
7
8
9
10
0
10
20
30
40
50
60
70
80
90
100
Energy Intensity (kBTU/SF-yr) Carbon Intensity (kgCO2e/SF-yr)
Energy and Carbon Intensity Performance

Appendix

33
FORWARD-LOOKING STATEMENTS
This Presentation contains forward-looking statements within the meaning of the federal securities laws, Section 27A of the Securities Act of 1933, as amended, and Section 21E of the Securities Exchange Act of 1934, as amended. We intend these forward-looking statements to be covered by the safe harbor provisions for forward-looking statements contained in the Private Securities Litigation Reform Act of 1995 and are including this statement for purposes of complying with those safe harbor provisions, in each case, to the extent applicable. We caution investors that any such forward-looking statements are based on current beliefs or expectations of future events and on assumptions made by, and information currently available to, our management. When used, the words “anticipate,” “believe,” “budget,” “estimate,” “expect,” “intend,” “may,” “might,” “plan,” “project,” “should,” “will” and similar expressions that do not relate solely to historical matters are intended to identify forward-looking statements. Such statements are subject to risks, uncertainties and assumptions and are not guarantees of future performance or occurrences, which may be affected by known and unknown risks, trends, uncertainties and factors that are, in some cases, beyond our control. Should one or more of these known or unknown risks or uncertainties materialize, or should underlying assumptions prove incorrect, actual results may vary materially from those expressed or implied by the forward-looking statements. We caution you that, while forward-looking statements reflect our good-faith beliefs when we make them, they are not guarantees of future performance or occurrences and are impacted by actual events when they occur after we make such statements. Accordingly, investors should use caution in relying on forward-looking statements, which are based on results and trends at the time they are made, to anticipate future results or trends.
One of the most significant factors that may cause actual results to differ materially from those expressed or implied by the forward-looking statements is the ongoing impact of the global COVID-19 pandemic on the U.S. and global economies, which has impacted, and is likely to continue to impact, us and, directly or indirectly, many of the other important factors below and the risks described in the Company’s Annual Report on Form 10-K for the fiscal year ended December 31, 2020 and our subsequent filings under the Exchange Act.
Some of the risks and uncertainties that may cause our actual results, performance or achievements to differ materially from those expressed or implied by forward-looking statements include, among others, the following:
• uncertainties and risks related to the impact of the COVID-19 global pandemic, including the duration, scope and severity of the pandemic domestically and internationally; federal, state and local government actions and restrictive measures implemented in response to COVID-19, the effectiveness of such measures and the direct and indirect impact of such measures on our and our tenants' businesses, financial condition, results of operation, cash flows, liquidity and performance, and the U.S. and international economy and economic activity generally; the speed, effectiveness and distribution of vaccines, whether new or existing actions or measures continue to impact the ability of our residential tenants to generate sufficient income to pay, or make them unwilling to pay, rent in full or at all in a timely manner; the health, continued service and availability of our personnel, including our key personnel and property management teams; and the effectiveness or lack of effectiveness of government relief in providing assistance to individuals and large and small businesses, including our tenants, that have suffered significant adverse effects from COVID-19;
• volatile or adverse global economic and political conditions, health crises and dislocations in the credit markets could adversely affect our access to cost-effective capital and have a resulting material adverse effect on our business opportunities, results of operations and financial condition;
• general risks affecting the real estate industry (including, without limitation, the inability to enter into or renew leases, tenant space utilization, dependence on tenants’ financial condition, and competition from other developers, owners and operators of real estate);
• failure to manage effectively our growth and expansion into new markets and sub-markets or to integrate acquisitions and developments successfully;
• the ability of our joint venture partners to satisfy their obligations;
• risks and uncertainties affecting property development and construction (including, without limitation, construction delays, increased construction costs, cost overruns, inability to obtain necessary permits, tenant accounting considerations that may result in negotiated lease provisions that limit a tenant’s liability during construction, and public opposition to such activities);
• risks associated with the availability and terms of financing and the use of debt to fund acquisitions and developments or refinance existing indebtedness, including the impact of higher interest rates on the cost and/or availability of financing;

34
FORWARD-LOOKING STATEMENTS (continued)
• risks associated with forward interest rate contracts and the effectiveness of such arrangements;
• risks associated with downturns in the national and local economies, increases in interest rates, and volatility in the securities markets;
• risks associated with actual or threatened terrorist attacks;
• costs of compliance with the Americans with Disabilities Act and other similar laws;
• potential liability for uninsured losses and environmental contamination;
• risks associated with the physical effects of climate change;
• risks associated with security breaches through cyber attacks, cyber intrusions or otherwise, as well as other significant disruptions of our information technology (IT) networks and related systems, which support our operations and our buildings;
• risks associated with BXP’s potential failure to qualify as a REIT under the Internal Revenue Code of 1986, as amended;
• possible adverse changes in tax and environmental laws;
• the impact of newly adopted accounting principles on our accounting policies and on period-to-period comparisons of financial results;
• risks associated with possible state and local tax audits;
• risks associated with our dependence on key personnel whose continued service is not guaranteed; and
• the other risk factors identified in our most recently filed Annual Report on Form 10-K for the fiscal year ended December 31, 2020 or described herein, including those under the caption “Risk Factors.”
The risks set forth above are not exhaustive. Other sections of this presentation may include additional factors that could adversely affect our business and financial performance. Moreover, we operate in a very competitive and rapidly changing environment, particularly in light of the circumstances relating to COVID-19. New risk factors emerge from time to time and it is not possible for management to predict all risk factors, nor can we assess the impact of all risk factors on our business or the extent to which any factor, or combination of factors, may cause actual results to differ materially from those contained in any forward-looking statements. Given these risks and uncertainties, investors should not place undue reliance on forward-looking statements as a prediction of actual results. Investors should also refer to our most recent Annual Reports on Form 10-K and our Quarterly Reports on Form 10-Q for future periods and Current Reports on Form 8-K as we file them with the SEC, and to other materials we may furnish to the public from time to time through Current Reports on Form 8-K or otherwise, for a discussion of risks and uncertainties that may cause actual results, performance or achievements to differ materially from those expressed or implied by forward-looking statements. We expressly disclaim any responsibility to update any forward-looking statements to reflect changes in underlying assumptions or factors, new information, future events, or otherwise, and you should not rely upon these forward-looking statements after the date of this Appendix.

DEFINITIONS OF NON-GAAP FINANCIAL MEASURES AND OTHER TERMS
35
This Appendix contains definitions of certain non-GAAP financial measures and other terms that the Company uses in this presentation and, where applicable, quantitative reconciliations of the differences between the non-GAAP financial measures and the most directly comparable GAAP financial measures, the reasons why management believes these non-GAAP financial measures provide useful information to investors about the Company’s financial condition and results of operations and the other purposes for which management uses the measures. Additional detail can be found in the Company’s most recent annual report on Form 10-K and quarterly report on Form 10-Q, as well as other documents the Company files or furnishes to the SEC from time to time.
The Company also presents “BXP's Share” of certain of these measures, which are non-GAAP financial measures that are calculated as the consolidated amount calculated in accordance with GAAP, plus the Company's share of the amount from the Company's unconsolidated joint ventures (calculated based upon the Company’s percentage ownership interest and, in some cases, after priority allocations), minus the Company’s partners’ share of the amount from the Company's consolidated joint ventures (calculated based upon the partners’ percentage ownership interests and, in some cases, after priority allocations, income allocation to private REIT shareholders and their share of fees due to the Company). Management believes that presenting “BXP's Share” of these measures provides useful information to investors regarding the Company’s financial condition and/or results of operations because the Company has several significant joint ventures and in some cases, the Company exercises significant influence over, but does not control, the joint venture, in which case GAAP requires that the Company account for the joint venture entity using the equity method of accounting and the Company does not consolidate it for financial reporting purposes. In other cases, GAAP requires that the Company consolidate the venture even though the Company's partner(s) owns a significant percentage interest. As a result, management believes that presenting BXP Share of various financial measures in this manner can help investors better understand the Company’s financial condition and/or results of operations after taking into account its true economic interest in these joint ventures. The Company cautions investors that the ownership percentages used in calculating “BXP's Share” of these measures may not completely and accurately depict all of the legal and economic implications of holding an interest in a consolidated or unconsolidated joint venture. For example, in addition to partners' interests in profits and capital, venture agreements vary in the allocation of rights regarding decision making (both routine and major decisions), distributions, transferability of interests, financing and guarantees, liquidations and other matters. As a result, presentations of “BXP's Share” of a financial measure should not be considered a substitute for, and should only be considered together with and as a supplement to, the Company's financial information presented in accordance with GAAP.
In addition, the Company presents certain of these measures on a “Annualized” basis, which means the measure for the applicable quarter is multiplied by four (4). Management believes that presenting “Annualized” measures allows investors to compare results of a particular quarter to the same measure for full years and thereby more easily assess trend data. However, the Company cautions investors that “Annualized” measures should not be considered a substitute for the measure calculated in accordance with GAAP and should only be considered together with and as a supplement to the Company’s financial information prepared in accordance with GAAP.
DEFINITIONS OF NON-GAAP FINANCIAL MEASURES AND OTHER TERMS (continued)
36
Annualized RevenueAnnualized Revenue is defined as (1) revenue less termination income for the quarter ended March 31, 2021, multiplied by four (4), plus (2) termination income for the quarter ended March 31, 2021. The Company believes that termination income can distort the results for any given period because termination income generally represents multiple months or years of a tenant’s rental obligations that are paid in a lump sum in connection with a negotiated early termination of the tenant’s lease and thus does not reflect the core ongoing operating performance of the Company’s properties. As a result, the Company believes that by presenting Annualized Revenue without annualizing termination income, investors may more easily compare quarterly revenue to revenue for full fiscal years, which can provide useful trend data. Annualized Revenue should not be considered a substitute for revenue in accordance with GAAP and should only be considered together with and as a supplement to the Company’s financial information prepared in accordance with GAAP.
Annualized Rental ObligationsAnnualized Rental Obligations is defined as monthly Rental Obligations, as of the last day of the reporting period, multiplied by twelve (12).
Debt to Market Capitalization RatioConsolidated Debt to Consolidated Market Capitalization Ratio is a measure of leverage commonly used by analysts in the REIT sector that equals the quotient of (A) the Company’s Consolidated Debt divided by (B) the Company’s Consolidated Market Capitalization, presented as a percentage. Consolidated Market Capitalization is the sum of (x) the Company’s Consolidated Debt plus (y) the market value of the Company’s outstanding equity securities calculated using the closing price per share of common stock of the Company, as reported by the New York Stock Exchange, multiplied by the sum of (1) outstanding shares of common stock of the Company, (2) outstanding common units of limited partnership interest in Boston Properties Limited Partnership (excluding common units held by the Company) and (3) common units issuable upon conversion of all outstanding LTIP Units for which all performance conditions have been satisfied for such conversion. We exclude from the calculation of Consolidated Market Capitalization other LTIP Units issued in the form of MYLTIP Awards in 2019 or later, which remain subject to performance conditions.
The Company also presents BXP’s Share of Market Capitalization, which is calculated in a similar manner, except that BXP’s Share of Debt is utilized instead of the Company’s Consolidated Debt in both the numerator and the denominator. The Company presents these ratios because its degree of leverage could affect its ability to obtain additional financing for working capital, capital expenditures, acquisitions, development or other general corporate purposes and because different investors and lenders consider one or both of these ratios. Investors should understand that these ratios are, in part, a function of the market price of the common stock of the Company, and as such will fluctuate with changes in such price and do not necessarily reflect the Company’s capacity to incur additional debt to finance its activities or its ability to manage its existing debt obligations. However, for a company like Boston Properties, Inc., whose assets are primarily income-producing real estate, these ratios may provide investors with an alternate indication of leverage, so long as they are evaluated along with the ratio of indebtedness to other measures of asset value used by financial analysts and other financial ratios, as well as the various components of the Company’s outstanding indebtedness.
EBITDArePursuant to the definition of Earnings Before Interest, Taxes, Depreciation and Amortization for Real Estate adopted by the Board of Governors of the National Association of Real Estate Investment Trusts (“Nareit”), the Company calculates Earnings Before Interest, Taxes, Depreciation and Amortization for Real Estate, or “EBITDAre,” as net income (loss) attributable to Boston Properties, Inc. common shareholders, the most directly comparable GAAP financial measure, plus preferred stock redemption charge, net income attributable to noncontrolling interests, interest expense, losses (gains) from early extinguishments of debt, depreciation and amortization expense, impairment loss and adjustments to reflect the Company's share of EBITDAre from unconsolidated joint ventures, less gains (losses) on sales of real estate and gain on sale of investment in unconsolidated joint venture. EBITDAre is a non-GAAP financial measure. The Company uses EBITDAre internally as a performance measure and believes EBITDAre provides useful information to investors regarding its financial condition and results of operations at the corporate level because, when compared across periods, EBITDAre reflects the impact on operations from trends in occupancy rates, rental rates, operating costs, general and administrative expenses and acquisition and development activities on an unleveraged basis, providing perspective not immediately apparent from net (loss) income attributable to Boston Properties, Inc. common shareholders.
In some cases the Company also presents (A) BXP’s Share of EBITDAre – cash, which is BXP’s Share of EBITDAre after eliminating the effects of straight-line rent (excluding the impact related to deferred revenue related to improvements to long-lived assets paid for by a tenant), fair value lease revenue, non-cash termination income adjustment (fair value lease amounts) and non-cash gains (losses) from early extinguishment of debt and adding straight-line ground rent expense, preferred stock redemption charge, stock-based compensation expense and lease transaction costs that qualify as rent inducements, and (B) Annualized EBITDAre, which is EBITDAre for the applicable fiscal quarter ended multiplied by four (4). Presenting BXP’s Share of EBITDAre – cash allows investors to compare EBITDAre across periods without taking into account the effect of certain non-cash rental revenues, ground rent expense and stock based compensation expense. Similar to depreciation and amortization, because of historical cost accounting, fair value lease revenue may distort operating performance measures at the property level. Additionally, presenting EBITDAre excluding the impact of straight-line rent provides investors with an alternative view of operating performance at the property level that more closely reflects rental revenue generated at the property level without regard to future contractual increases in rental rates. In addition, the Company’s management believes that the presentation of Annualized EBITDAre provides useful information to investors regarding the Company’s results of operations because it enables investors to more easily compare quarterly EBITDAre to EBITDAre from full fiscal years.
The Company’s computation of EBITDAre may not be comparable to EBITDAre reported by other REITs or real estate companies that do not define the term in accordance with the current Nareit definition or that interpret the current Nareit definition differently. The Company believes that in order to facilitate a clear understanding of its operating results, EBITDAre should be examined in conjunction with net income attributable to Boston Properties, Inc. common shareholders as presented in the Company’s consolidated financial statements. EBITDAre should not be considered a substitute to net income attributable to Boston Properties, Inc. common shareholders in accordance with GAAP or any other GAAP financial measures and should only be considered together with and as a supplement to the Company’s financial information prepared in accordance with GAAP.
DEFINITIONS OF NON-GAAP FINANCIAL MEASURES AND OTHER TERMS (continued)
37
DEFINITIONS OF NON-GAAP FINANCIAL MEASURES AND OTHER TERMS
Funds from Operations (FFO)Pursuant to the revised definition of Funds from Operations adopted by the Board of Governors of Nareit, the Company calculates Funds from Operations, or “FFO,” by adjusting net income (loss) attributable to Boston Properties, Inc. common shareholders (computed in accordance with GAAP) for gains (or losses) from sales of properties, impairment losses on depreciable real estate consolidated on the Company’s balance sheet, impairment losses on its investments in unconsolidated joint ventures driven by a measurable decrease in the fair value of depreciable real estate held by the unconsolidated joint ventures, gain on sale of investment included within (income) loss from unconsolidated joint ventures and real estate-related depreciation and amortization. FFO is a non-GAAP financial measure, but the Company believes the presentation of FFO, combined with the presentation of required GAAP financial measures, has improved the understanding of operating results of REITs among the investing public and has helped make comparisons of REIT operating results more meaningful. Management generally considers FFO and FFO per share to be useful measures for understanding and comparing the Company’s operating results because, by excluding gains and losses related to sales of previously depreciated operating real estate assets, impairment losses and real estate asset depreciation and amortization (which can differ across owners of similar assets in similar condition based on historical cost accounting and useful life estimates), FFO and FFO per share can help investors compare the operating performance of a company’s real estate across reporting periods and to the operating performance of other companies.
The Company’s computation of FFO may not be comparable to FFO reported by other REITs or real estate companies that do not define the term in accordance with the current Nareit definition or that interpret the current Nareit definition differently. In order to facilitate a clear understanding of the Company’s operating results, FFO should be examined in conjunction with net income attributable to Boston Properties, Inc. common shareholders as presented in the Company’s consolidated financial statements. FFO should not be considered as a substitute for net income attributable to Boston Properties, Inc. common shareholders (determined in accordance with GAAP) or any other GAAP financial measures and should only be considered together with and as a supplement to the Company’s financial information prepared in accordance with GAAP.
In-Service PropertiesThe Company treats a property as being “in-service” upon the earlier of (1) lease-up and completion of tenant improvements or (2) one year after cessation of major construction activity as determined under GAAP. The determination as to when an entire property should be treated as “in-service” involves a degree of judgment and is made by management based on the relevant facts and circumstances of the particular property. For portfolio operating and occupancy statistics, the Company specifies a single date for treating a property as “in-service,” which is generally later than the date the property is partially placed in-service under GAAP. Under GAAP, a property may be placed in-service in stages as construction is completed and the property is held available for occupancy. In addition, under GAAP, when a portion of a property has been substantially completed and either occupied or held available for occupancy, the Company ceases capitalizing costs on that portion, even though it may not treat the property as being “in-service,” and continues to capitalize only those costs associated with the portion still under construction. In-service properties include properties held by the Company’s unconsolidated joint ventures.

DEFINITIONS OF NON-GAAP FINANCIAL MEASURES AND OTHER TERMS (continued)
38
Net Operating Income (NOI)Net operating income (NOI) is a non-GAAP financial measure equal to net income attributable to Boston Properties, Inc. common shareholders, the most directly comparable GAAP financial measure, plus (1) preferred stock redemption charge, preferred dividends, net income attributable to noncontrolling interests, corporate general and administrative expense, payroll and related costs from management services contracts, transaction costs, impairment losses, depreciation and amortization expense, gains (losses) from early extinguishments of debt and interest expense, less (2) development and management services revenue, direct reimbursements of payroll and related costs from management services contracts, income (loss) from unconsolidated joint ventures, gains (losses) on sales of real estate, gains (losses) from investments in securities and interest and other income (loss). In some cases, the Company also presents (1) NOI – cash, which is NOI after eliminating the effects of straight-line rent (excluding the impact related to deferred revenue related to improvements to long-lived assets paid for by a tenant), fair value lease revenue, straight-line ground rent expense adjustment and lease transaction costs that qualify as rent inducements in accordance with GAAP, and (2) NOI and NOI – cash, in each case excluding termination income.
The Company uses these measures internally as performance measures and believes they provide useful information to investors regarding the Company’s results of operations and financial condition because, when compared across periods, they reflect the impact on operations from trends in occupancy rates, rental rates, operating costs and acquisition and development activity on an unleveraged basis, providing perspective not immediately apparent from net income. For example, interest expense is not necessarily linked to the operating performance of a real estate asset and is often incurred at the corporate level as opposed to the property level. Similarly, interest expense may be incurred at the property level even though the financing proceeds may be used at the corporate level (e.g., used for other investment activity). In addition, depreciation and amortization expense because of historical cost accounting and useful life estimates, may distort operating performance measures at the property level. Presenting NOI – cash allows investors to compare NOI performance across periods without taking into account the effect of certain non-cash rental revenues and ground rent expenses. Similar to depreciation and amortization expense, fair value lease revenues, because of historical cost accounting, may distort operating performance measures at the property level. Additionally, presenting NOI excluding the impact of the straight-lining of rent provides investors with an alternative view of operating performance at the property level that more closely reflects net cash generated at the property level on an unleveraged basis. Presenting NOI measures that exclude termination income provides investors with additional information regarding operating performance at a property level that allows them to compare operating performance between periods without taking into account termination income, which can distort the results for any given period because they generally represent multiple months or years of a tenant’s rental obligations that are paid in a lump sum in connection with a negotiated early termination of the tenant’s lease and are not reflective of the core ongoing operating performance of the Company’s properties.
Rental Obligations Rental Obligations is defined as the contractual base rents (but excluding percentage rent) and budgeted reimbursements from tenants under existing leases. These amounts exclude rent abatements.
Rental RevenueRental Revenue is equal to Total revenue, the most directly comparable GAAP financial measure, less development and management services revenue and direct reimbursements of payroll and related costs from management services contracts. The Company uses Rental Revenue internally as a performance measure and in calculating other non-GAAP financial measures (e.g., NOI), which provides investors with information regarding our performance that is not immediately apparent from the comparable non-GAAP measures and allows investors to compare operating performance between periods. The Company also presents Rental Revenue (excluding termination income) because termination income can distort the results for any given period because it generally represents multiple months or years of a tenant’s rental obligations that are paid in a lump sum in connection with a negotiated early termination of the tenant’s lease and does not reflect the core ongoing operating performance of the Company’s properties.
Same PropertiesIn the Company’s analysis of NOI, particularly to make comparisons of NOI between periods meaningful, it is important to provide information for properties that were in-service and owned by the Company throughout each period presented. The Company refers to properties acquired or placed in-service prior to the beginning of the earliest period presented and owned by the Company through the end of the latest period presented as “Same Properties.” “Same Properties” therefore exclude properties placed in-service, acquired, repositioned or in development or redevelopment after the beginning of the earliest period presented or disposed of prior to the end of the latest period presented. Accordingly, it takes at least one year and one quarter after a property is acquired or treated as “in-service” for that property to be included in “Same Properties.”

RECONCILIATIONS OF NON-GAAP FINANCIAL MEASURES AND OTHER FINANCIAL INFORMATION (UNAUDITED)
39
Quarter endedMarch 31, 2021
Net income attributable to Boston Properties, Inc. common shareholders $ 91,624 Add:
Preferred stock redemption charge 6,412 Preferred dividends 2,560 Net income attributable to noncontrolling interests 27,551 Losses (gains) from early extinguishments of debt 898 Interest expense 107,902 Depreciation and amortization expense 176,565
Less:Income (loss) from unconsolidated JVs 5,225
Add:BXP's share of EBITDAre from unconsolidated JVs 1 24,737
EBITDAre 433,024 Less:
Partners' share of EBITDAre from consolidated JVs 2 44,344 BXP's Share of EBITDAre (A) $ 388,680
BXP's Share of Annualized EBITDAre 3 (A x 4) $ 1,554,720
BXP's Share of EBITDAre (A) $ 388,680 Add:
Lease transaction costs that qualify as rent inducements 4 1,859 BXP’s share of lease transaction costs that qualify as rent inducements from unconsolidated JVs 1, 4 1,418 Straight-line ground rent expense adjustment 932 BXP's share of straight-line ground rent expense adjustment from unconsolidated JVs 1 234 Preferred stock redemption charge 6,412 Non-cash losses from early extinguishment of debt 898 Stock-based compensation expense 19,806
Less:Partners' share of lease transaction costs that qualify as rent inducements from consolidated JVs 2, 4 251 Straight-line rent and fair value lease revenue 8,383 BXP's share of straight-line rent and fair value lease revenue from unconsolidated JVs 1 1,084
Add:Partners' share of straight-line rent and fair value of lease revenue from consolidated JVs 2 (5,340) Partner’s share of non-cash termination income adjustment (fair value lease amounts) from consolidated JVs 2 —
BXP's Share of EBITDAre—cash $ 405,181
EBITDAre(dollars in thousands)
1 See “Joint Ventures-Unconsolidated” in this Appendix.2 See “Joint Ventures-Consolidated” in this Appendix.3 BXP's Share of Annualized EBITDAre equals BXP's Share of EBITDAre multiplied by four (4). 4 Lease transaction costs are generally included in second generation tenant improvements and leasing commissions in the period in which the lease commences.

RECONCILIATIONS OF NON-GAAP FINANCIAL MEASURES AND OTHER FINANCIAL INFORMATION (UNAUDITED)
40
RECONCILIATIONS OF NON-GAAP FINANCIAL MEASURES AND OTHER FINANCIAL INFORMATION (UNAUDITED)
FFO(in thousands, except percentages)
1See “Joint Ventures-Consolidated” in this Appendix.2See “Joint Ventures-Unconsolidated” in this Appendix.
Year ended December 31,2019 2018 2017 2016 2015
Net income attributable to Boston Properties, Inc. common shareholders $ 511,034 $ 572,347 $ 451,939 $ 502,285 $ 572,606 Add:
Preferred dividends 10,500 10,500 10,500 10,500 10,500 Noncontrolling interest - common units of the Operating Partnership 59,345 66,807 52,210 59,260 66,951 Noncontrolling interest - redeemable preferred units of the Operating Partnership — — — — 6 Noncontrolling interests in property partnerships 71,120 62,909 47,832 (2,068) 149,855
Net income 651,999 712,563 562,481 569,977 799,918 Add:
Depreciation and amortization expense 677,764 645,649 617,547 694,403 639,542 Noncontrolling interests in property partnerships' share of depreciation and amortization (71,389) (73,880) (78,190) (107,087) (90,832) BXP's share of depreciation and amortization from unconsolidated joint ventures 58,451 54,352 34,262 26,934 6,556 Corporate-related depreciation and amortization (1,695) (1,634) (1,986) (1,568) (1,503) Impairment losses 24,038 11,812 — — —
Less:Gain on sale of investment in unconsolidated joint venture — — — 59,370 — Gain on sale of real estate included within income (loss) from unconsolidated joint
ventures 47,238 8,270 — — — Gains on sales of real estate 709 182,356 7,663 80,606 375,895 Noncontrolling interests in property partnerships 71,120 62,909 47,832 (2,068) 48,737 Noncontrolling interest - redeemable preferred units of the Operating Partnership — — — — 6 Preferred dividends 10,500 10,500 10,500 10,500 10,500 Preferred stock redemption charge — — — — —
FFO attributable to the Operating Partnership common unitholders (including Boston Properties, Inc.) (“Basic FFO”)
1,209,601 1,084,827 1,068,119 1,034,251 918,543
Less:Noncontrolling interest - common units of the Operating Partnership's share of FFO 123,757 110,338 108,707 106,504 94,828
FFO attributable to Boston Properties, Inc. common shareholders $ 1,085,844 $ 974,489 $ 959,412 $ 927,747 $ 823,715
Boston Properties, Inc.'s percentage share of Basic FFO 89.77 % 89.83 % 89.82 % 89.70 % 89.68 %Weighted average shares outstanding - basic 154,582 154,427 154,190 153,715 153,471
FFO per share basic $ 7.02 $ 6.31 $ 6.22 $ 6.04 $ 5.37 Weighted average shares outstanding - diluted 154,883 154,682 154,390 153,977 153,844
FFO per share diluted $ 7.01 $ 6.30 $ 6.21 $ 6.03 $ 5.35
FFO per share diluted - Year-over-Year increase ($) $ 0.71 $ 0.09 $ 0.18 $ 0.68 FFO per share diluted - Year-over-Year increase (%) 11.27 % 1.45 % 2.99 % 12.71 %FFO per share diluted - Average Year-over-Year increase since 2016 (%) 7.11 %
1See “Joint Ventures-Consolidated” in this Appendix.2See “Joint Ventures-Unconsolidated” in this Appendix.3For the year ended December 31, 2015, excludes the noncontrolling interests in property partnerships' share of a gain on sale of real estate totaling approximately $101.1 million.

RECONCILIATIONS OF NON-GAAP FINANCIAL MEASURES AND OTHER FINANCIAL INFORMATION (UNAUDITED)
41
RECONCILIATIONS OF NON-GAAP FINANCIAL MEASURES AND OTHER FINANCIAL INFORMATION (UNAUDITED)
Net Operating Income (NOI)(in thousands)
Quarter endedMarch 31, 2021 March 31, 2011
Net income attributable to Boston Properties, Inc. common shareholders $ 91,624 $ 40,813 Preferred stock redemption 6,412 — Preferred dividends 2,560 —
Net income attributable to Boston Properties, Inc. 100,596 40,813 Net income attributable to noncontrolling interests:
Noncontrolling interest - common units of the Operating Partnership 11,084 6,029 Noncontrolling interest - redeemable preferred units of the Operating Partnership — 823 Noncontrolling interests in property partnerships 16,467 529
Net income 128,147 48,194 Add:
Interest expense 107,902 99,151 Loss from early extinguishment of debt 898 — Depreciation and amortization expense 176,565 109,428 Transaction costs 331 72 Payroll and related costs from management services contracts 3,505 — General and administrative expense 44,959 24,643
Less:Interest and other income (loss) 1,168 974 Gains (losses) from investments in securities 1,659 373 Income (loss) from unconsolidated joint ventures ("JVs") 5,225 7,976
Direct reimbursements of payroll and related costs from management services contracts 3,505 — Development and management services revenue 6,803 7,428
Consolidated NOI 443,947 264,737
Add:BXP's share of NOI from unconsolidated JVs 24,795 1 58,164
Less:Partners' share of NOI from consolidated JVs (after income allocation to private REIT shareholders) 44,376 2 — Termination income 4,269 1,992 BXP's share of termination income from unconsolidated JVs — 1 11
Add:Partners' share of termination income from consolidated JVs (6) 2 —
BXP's Share of NOI (excluding termination income) (A) $ 420,091 $ 320,898
1See “Joint Ventures-Unconsolidated” in this Appendix. 2See “Joint Ventures-Consolidated” in this Appendix.
Quarter ended Quarter endedMarch 31, 2021 March 31, 2021
Net income attributable to Boston Properties, Inc. common shareholders $ 91,624 BXP's Share of Annualized NOI (excluding termination income) (A x 4) $ 1,654,716 Preferred dividends 2,560 Add:
Net income attributable to Boston Properties, Inc. 94,184 Termination income 4,269 Net income attributable to noncontrolling interests: BXP's share of termination income from unconsolidated JVs1 —
Noncontrolling interest - common units of the Operating Partnership 11,084 Less:Noncontrolling interests in property partnerships 16,467 Partners' share of termination income from consolidated JVs2 (6)
Net income 121,735 BXP's Share of Annualized NOI $ 1,658,991
Add:Interest expense 107,902 Depreciation and amortization expense 176,565 Transaction costs 331 Payroll and related costs from management services contracts 3,505 General and administrative expense 44,959
Less:Interest and other income 1,168 Gains from investments in securities 1,659 Gains on sales of real estate — Loss from unconsolidated joint ventures ("JVs") 5,225 Direct reimbursements of payroll and related costs from management
services contracts 3,505
Development and management services revenue 6,803 Consolidated NOI 437,535
Add:BXP's share of NOI from unconsolidated JVs1 24,795
Less:Partners' share of NOI from consolidated JVs (after income allocation
to private REIT shareholders)2 44,376 Termination income 4,269 BXP's share of termination income from unconsolidated JVs1 —
Add:Partners' share of termination income from consolidated JVs2 (6)
BXP's Share of NOI (excluding termination income) (A) $ 413,679

RECONCILIATIONS OF NON-GAAP FINANCIAL MEASURES AND OTHER FINANCIAL INFORMATION (UNAUDITED)
42
Quarter endedMarch 31, 2021
Revenue $ 713,695 Add:
BXP's share of revenue from unconsolidated Joint Ventures ("JVs")1 42,401 Less:
Partners' share of revenue from consolidated JVs2 75,274 Termination income 4,269 BXP's share of termination income from unconsolidated JVs1 —
Add:Partners' share of termination income from consolidated JVs2 (6)
BXP's Share of Revenue (excluding termination income) (A) $ 676,547
BXP's Share of Annualized Revenue (excluding termination income)3
(A x 4) $ 2,706,188 Add:
Termination income 4,269 BXP's share of termination income from unconsolidated JVs1 —
Less:Partners' share of termination income from consolidated JVs2 (6)
BXP's Share of Annualized Revenue $ 2,710,463
BXP's Share of Annualized Revenue(in thousands)
1 See “Joint Ventures-Unconsolidated” in this Appendix.2 See “Joint Ventures-Consolidated” in this Appendix.3 BXP's Share of Annualized Revenue (excluding termination income) equals BXP's Share of Revenue (excluding termination income), multiplied by four (4).
Quarter endedMarch 31, 2021
Revenue $ 713,695 Less:
Direct reimbursements of payroll and related costs from management services contracts 3,505
Development and management services 6,803 Rental Revenue 703,387 Add:
BXP's share of Rental Revenue from unconsolidated JVs1 42,289 Less:
Partners' share of Rental Revenue from consolidated JVs2 75,276 BXP's Share of Rental Revenue $ 670,400 Less:
Termination income 4,269 BXP's share of termination income from unconsolidated JVs1 —
Add:Partners' share of termination income from consolidated JVs2 (6)
BXP's Share of Rental Revenue (excluding termination income) (B) $ 666,125
BXP's Share of Annualized Rental Revenue (excluding termination income)3 (B x 4) $ 2,664,500
Quarter ended
March 31, 2021 December 31, 2020 December 31, 2019Revenue $ 713,695 $ 665,089 $ 757,501 Add:
BXP's share of revenue from unconsolidated Joint Ventures ("JVs") 42,401 1 31,422 40,146 Less:
Partners' share of revenue from consolidated JVs 75,274 2 70,539 75,000 Termination income 4,269 551 1,397 BXP's share of termination income from unconsolidated JVs — 1 771 —
Add:Partners' share of termination income from consolidated JVs (6) 2 95 —
BXP's Share of Revenue (excluding termination income) (A) $ 676,547 $ 624,745 $ 721,250
BXP's Share of Annualized Revenue (excluding termination income)3 (A x 4) $ 2,706,188 $ 2,498,980 $ 2,885,000 Add:
Termination income 4,269 551 1,397 BXP's share of termination income from unconsolidated JVs — 1 771 —
Less:Partners' share of termination income from consolidated JVs (6) 2 95 —
BXP's Share of Annualized Revenue $ 2,710,463 $ 2,500,207 $ 2,886,397

RECONCILIATIONS OF NON-GAAP FINANCIAL MEASURES AND OTHER FINANCIAL INFORMATION (UNAUDITED)
43
Norges Joint VenturesTimes Square Tower
601 Lexington Avenue /One Five Nine East 53rd Street
767 Fifth Avenue 100 Federal Street Total Consolidated(The GM Building) Atlantic Wharf Office Joint Ventures
RevenueLease 1 $ 73,873 $ 110,215 2 $ 184,088 Write-offs associated with accounts receivable, net — 3 3 Straight-line rent 2,661 (13,555) 2 (10,894) Write-offs associated with straight-line rent, net — (68) (68) Fair value lease revenue (804) 109 (695) Termination income (5) (8) (13)
Total lease revenue 75,725 96,696 172,421 Parking and other — 829 829 Insurance proceeds — 2,444 3 2,444
Total rental revenue 4 75,725 99,969 175,694 Expenses
Operating 30,897 35,383 66,280 Restoration expenses related to insurance claim — 2,460 3 2,460
Total expenses 30,897 37,843 68,740
Net Operating Income (NOI) 44,828 62,126 106,954 Other income (expense)
Development and management services revenue — (4) (4) Interest and other income 1 (54) (53) Interest expense (20,959) (6,756) (27,715) Depreciation and amortization expense (15,737) (21,618) (37,355) General and administrative expense (7) (63) (70)
Total other income (expense) (36,702) (28,495) (65,197) Net income $ 8,126 $ 33,631 $ 41,757
.BXP's nominal ownership percentage 60.00% 55.00%
Partners' share of NOI (after income allocation to private REIT shareholders) 5 $ 17,278 $ 27,098 $ 44,376 BXP's share of NOI (after income allocation to private REIT shareholders) $ 27,550 $ 35,028 $ 62,578 Unearned portion of capitalized fees 6 $ 115 $ 196 $ 311
Partners' share of select items 5
Partners’ share of write-offs associated with accounts receivable, net $ — $ (1) $ (1) Partners’ share of write-offs associated with straight-line rent, net $ — $ 31 $ 31 Partners’ share of parking and other revenue $ — $ 373 $ 373 Partners' share of hedge amortization $ 144 $ — $ 144 Partners' share of amortization of financing costs $ 346 $ 36 $ 382 Partners’ share of depreciation and amortization related to capitalized fees $ 322 $ 308 $ 630 Partners' share of capitalized interest $ — $ 472 $ 472 Partners' share of lease transaction costs that qualify as rent inducements $ — $ (251) $ (251) Partners' share of management and other fees $ 653 $ 859 $ 1,512 Partners' share of basis differential and other adjustments $ (16) $ (205) $ (221)
Joint Ventures (“JVs”) - Consolidated (unaudited and in thousands)Results of Operations for the three months ended March 31, 2021

RECONCILIATIONS OF NON-GAAP FINANCIAL MEASURES AND OTHER FINANCIAL INFORMATION (UNAUDITED)
44
Norges Joint VenturesTimes Square Tower
601 Lexington Avenue /One Five Nine East 53rd Street
767 Fifth Avenue 100 Federal Street Total Consolidated(The GM Building) Atlantic Wharf Office Joint Ventures
Reconciliation of Partners' share of EBITDAre 7
Partners' NCI $ 2,295 $ 14,172 $ 16,467 Add:
Partners' share of interest expense 8,380 3,040 11,420 Partners' share of depreciation and amortization expense after BXP's basis differential 6,600 9,857 16,457
Partners' share of EBITDAre $ 17,275 $ 27,069 $ 44,344
Reconciliation of Partners' share of NOI 5
Rental revenue 4 $ 30,290 $ 44,986 $ 75,276 Less: Termination income (2) (4) (6) Rental revenue (excluding termination income) 4 30,292 44,990 75,282 Less: Operating expenses (including partners' share of management and other fees) 13,012 17,888 30,900
Income allocation to private REIT shareholders — — — NOI (excluding termination income and after income allocation to private REIT shareholders) $ 17,280 $ 27,102 $ 44,382
Rental revenue (excluding termination income) 4 $ 30,292 $ 44,990 $ 75,282 Less: Straight-line rent 1,064 (6,131) 2 (5,067) Fair value lease revenue (322) 49 (273) Add: Lease transaction costs that qualify as rent inducements — 251 251 Subtotal $ 29,550 $ 51,323 $ 80,873 Less: Operating expenses (including partners' share of management and other fees) 13,012 17,888 30,900
Income allocation to private REIT shareholders — — — NOI - cash (excluding termination income and after income allocation to private REIT shareholders) $ 16,538 $ 33,435 $ 49,973
Reconciliation of Partners' share of Revenue 5
Rental revenue 4 $ 30,290 $ 44,986 $ 75,276 Add: Development and management services revenue — (2) (2) Revenue $ 30,290 $ 44,984 $ 75,274
Joint Ventures (“JVs”) - Consolidated (continued) (unaudited and in thousands)Results of Operations for the three months ended March 31, 2021
1 Lease revenue includes recoveries from tenants and service income from tenants
2 Lease revenue and straight-line rent includes approximately $19,435 and $17,007, respectively, related to deferred revenue from a tenant, of which the Partners’ share of lease revenue and straight-line are approximately $8,746 and $7,653, respectively.
3 Amounts relate to damage at one of the Company’s properties in New York City due to a water main break. . 4 See the Definitions section of this Appendix package.5 Amounts represent the partners’ share based on their respective ownership percentage.6 Capitalized fees are eliminated in consolidation and recognized over the life of the asset as depreciation and amortization are added back to the Company’s net income.7 Amounts represent the partners’ share based on their respective ownership percentage and is adjusted for basis differentials and the allocations of management and other fees and depreciation and amortization
related to capitalized fees.

RECONCILIATIONS OF NON-GAAP FINANCIAL MEASURES AND OTHER FINANCIAL INFORMATION (UNAUDITED)
45
Joint Ventures (“JVs”) - UnconsolidatedAs of March 31, 2021
BXP’s Nominal OwnershipPropertyBoston
The Hub on Causeway 50.00 %100 Causeway Street 50.00 %Hub50House 50.00 %Podium 50.00 %Hotel Air Rights 50.00 %
1265 Main Street 50.00 %Los Angeles
Santa Monica Business Park 55.00 %Colorado Center 50.00 %Beach Cities Media Center 50.00 %
New YorkDock 72 50.00 %3 Hudson Boulevard 25.00 %
San FranciscoPlatform 16 55.00 %Gateway Commons 50.00 %
Washington, DC7750 Wisconsin Avenue (Marriott International Headquarters) 50.00 %1001 6th Street 50.00 %Market Square North 50.00 %Wisconsin Place Parking Facility 33.33 %500 North Capitol Street, N.W. 30.00 %901 New York Avenue 25.00 %Metropolitan Square 20.00 %

RECONCILIATIONS OF NON-GAAP FINANCIAL MEASURES AND OTHER FINANCIAL INFORMATION (UNAUDITED)
46
Joint Ventures (“JVs”) - Unconsolidated 1(unaudited and in thousands)Results of Operations for the three months ended March 31, 2021
Boston Los Angeles New York San Francisco Washington, DC
Total Unconsolidated Joint Ventures
RevenueLease 2 $ 8,520 $ 36,263 $ 1,144 $ 11,278 $ 25,242 $ 82,447 Write-offs associated with accounts receivable, net — (13) — — — (13) Straight-line rent 809 (1,149) 232 230 1,210 1,332 Write-offs associated with straight-line rent, net — (81) — — (186) (267) Fair value lease revenue — 289 — 45 334 Termination income — — — — — —
Total lease revenue 9,329 35,309 1,376 11,553 26,266 83,833 Parking and other 3 2,429 — 1 768 3,201
Total rental revenue 3 9,332 37,738 1,376 11,554 27,034 87,034 Expenses
Operating 4,773 12,124 2,969 4 4,687 12,174 36,727 Net Operating Income 4,559 25,614 (1,593) 6,867 14,860 50,307
Other income/(expense)Development and management services income — — 224 — 1 225 Interest and other income — 5 — 2 — 7 Interest expense (2,688) (11,775) (1,642) (4) (9,447) (25,556) Transaction costs — — — — (7) (7) Depreciation and amortization expense (4,778) (12,438) (2,535) (5,939) (8,413) (34,103) General and administrative expense (15) (169) (83) (6) (134) (407)
Total other income/(expense) (7,481) (24,377) (4,036) (5,947) (18,000) (59,841) Net income/(loss) $ (2,922) $ 1,237 $ (5,629) $ 920 $ (3,140) $ (9,534)
BXP's share of select itemsBXP’s share of write-offs associated with accounts receivable, net $ — $ 7 $ — $ — $ — $ 7 BXP’s share of write-offs associated with straight-line rents, net $ — $ 45 $ — $ — $ 93 $ 138 BXP’s share of parking and other revenue $ 2 $ 1,273 $ — $ 1 $ 270 5 $ 1,546 BXP's share of amortization of financing costs $ 194 $ 85 $ 76 $ — $ 311 5 $ 666 BXP's share of capitalized interest $ 479 $ — $ 203 $ — $ 286 5 $ 968
Reconciliation of BXP's share of EBITDAreIncome/(loss) from unconsolidated joint ventures $ (1,504) $ 139 $ (2,465) $ (779) $ 9,834 5 $ 5,225
Add:BXP's share of interest expense 1,345 6,230 821 2 2,959 5 11,357
BXP's share of depreciation and amortization expense 2,432 7,737 6 920 4,253 7 3,070 5 18,412 Less:
BXP’s share of gain on sale of investment — — — — 10,257 8 10,257 BXP's share of EBITDAre 2,273 14,106 6 (724) 3,476 7 5,606 5 24,737

RECONCILIATIONS OF NON-GAAP FINANCIAL MEASURES AND OTHER FINANCIAL INFORMATION (UNAUDITED)
47
Reconciliation of BXP's share of Net Operating Income/(Loss) Boston Los Angeles New York San Francisco Washington, DC
Total Unconsolidated Joint Ventures
BXP's share of rental revenue 3 $ 4,667 $ 20,596 6 $ 688 $ 6,016 7 $ 10,322 5 $ 42,289
BXP's share of operating expenses 2,386 6,404 1,481 2,536 4,687 5 17,494
BXP's share of net operating income/(loss) 2,281 14,192 6 (793) 3,480 7 5,635 5 24,795
Less:
BXP's share of termination income — — — — — — BXP's share of net operating income/(loss) (excluding termination
income) 2,281 14,192 (793) 3,480 5,635 5 24,795
Less:
BXP's share of straight-line rent 405 (81) 6 116 132 7 232 5 804
BXP's share of fair value lease revenue — 493 6 — (213) 7 — 280
Add:
BXP's share of straight-line ground rent adjustment — — 234 — — 234 BXP's share of lease transaction costs that qualify as rent
inducements — 59 1,149 — 210 5 1,418 BXP's share of net operating income/(loss) - cash (excluding
termination income) $ 1,876 $ 13,839 6 $ 474 $ 3,561 7 $ 5,613 5 $ 25,363
Reconciliation of BXP's share of Revenue
BXP's share of rental revenue 3 $ 4,667 $ 20,596 6 $ 688 $ 6,016 7 $ 10,322 5 $ 42,289
Add:BXP's share of development and management services
revenue — — 112 — — 112
BXP's share of revenue $ 4,667 $ 20,596 6 $ 800 $ 6,016 7 $ 10,322 5 $ 42,401
Joint Ventures (“JVs”) - Unconsolidated 1(unaudited and in thousands)Results of Operations for the three months ended March 31, 2021
1 For information on the properties included for each region and the Company’s percentage ownership in each property, see page 45.2 Lease revenue includes recoveries from tenants and service income from tenants.3 See the Definitions section of this Appendix package. 4 Includes approximately $468 of straight-line ground rent expense.5 Reflects the allocation percentages pursuant to the achievement of specified investment return thresholds as provided for in the joint venture agreement of 901 New York Avenue.6 The Company’s purchase price allocation under ASC 805 for Colorado Center differs from the historical basis of the venture resulting in the majority of the basis differential for this region.7 The Company’s purchase price allocation under ASC 805 for Gateway Commons differs from the historical basis of the venture resulting in the majority of the basis differential for this region.8 On March 30, 2021, the Company completed the sale of its 50% ownership interest in Annapolis Junction.

RECONCILIATIONS OF NON-GAAP FINANCIAL MEASURES AND OTHER FINANCIAL INFORMATION (UNAUDITED)
48
BXP's Share of Same Property Net Operating Income—cash (excluding termination income)(in thousands)
RECONCILIATIONS OF NON-GAAP FINANCIAL MEASURES AND OTHER FINANCIAL INFORMATION (UNAUDITED)
2021 2020 2019
31-Mar-21 31-Mar-20 Change ($) Change (%) 31-Mar-20 31-Mar-19 Change ($) Change (%) 31-Mar-19 31-Mar-18 Change ($) Change (%) Q1 $ 388,703 $ 404,317 (15,614) (3.9) % $ 400,348 $ 381,224 19,124 5.0 % $ 368,940 $ 337,759 31,181 9.2 %
30-Jun-20 30-Jun-19 Change ($) Change (%) 30-Jun-19 30-Jun-18 Change ($) Change (%) Q2 $ 349,808 $ 389,184 (39,376) (10.1) % $ 377,245 $ 346,028 31,217 9.0 %
30-Sep-20 30-Sep-19 Change ($) Change (%) 30-Sep-19 30-Sep-18 Change ($) Change (%) Q3 $ 343,757 $ 392,673 (48,916) (12.5) % $ 372,475 $ 354,093 18,382 5.2 %
31-Dec-20 31-Dec-19 Change ($) Change (%) 31-Dec-19 31-Dec-18 Change ($) Change (%) Q4 $ 355,284 $ 382,801 (27,517) (7.2) % $ 373,088 $ 373,613 (525) (0.1) %
2018 2017 2016
31-Mar-18 31-Mar-17 Change ($) Change (%) 31-Mar-17 31-Mar-16 Change ($) Change (%) 31-Mar-16 31-Mar-15 Change ($) Change (%) Q1 $ 335,553 $ 338,860 (3,307) (1.0) % $ 328,368 $ 321,831 6,537 2.0 % $ 322,168 $ 301,136 21,032 7.0 %
30-Jun-18 30-Jun-17 Change ($) Change (%) 30-Jun-17 30-Jun-16 Change ($) Change (%) 30-Jun-16 30-Jun-15 Change ($) Change (%) Q2 $ 344,912 $ 356,617 (11,705) (3.3) % $ 344,583 $ 335,171 9,412 2.8 % $ 334,902 $ 319,807 15,095 4.7 %
30-Sep-18 30-Sep-17 Change ($) Change (%) 30-Sep-17 30-Sep-16 Change ($) Change (%) 30-Sep-16 30-Sep-15 Change ($) Change (%) Q3 $ 355,058 $ 346,325 8,733 2.5 % $ 346,146 $ 336,885 9,261 2.7 % $ 322,185 $ 318,833 3,352 1.1 %
31-Dec-18 31-Dec-17 Change ($) Change (%) 31-Dec-17 31-Dec-16 Change ($) Change (%) 31-Dec-16 31-Dec-15 Change ($) Change (%) Q4 $ 371,103 $ 343,949 27,154 7.9 % $ 342,461 $ 343,103 (642) (0.2) % $ 326,978 $ 315,166 11,812 3.7 %
Please see the following pages for complete reconciliations of BXP’s Share of Same Property NOI—cash (excluding termination income) for each quarterly period presented over the past five years.

RECONCILIATIONS OF NON-GAAP FINANCIAL MEASURES AND OTHER FINANCIAL INFORMATION (UNAUDITED)
49
BXP's Share of Same Property Net Operating Income—cash (excluding termination income)(in thousands)
RECONCILIATIONS OF NON-GAAP FINANCIAL MEASURES AND OTHER FINANCIAL INFORMATION (UNAUDITED)
2015 2014 2013
31-Mar-15 31-Mar-14 Change ($) Change (%) 31-Mar-14 31-Mar-13 Change ($) Change (%) 31-Mar-13 31-Mar-12 Change ($) Change (%) Q1 $ 318,345 $ 314,478 3,867 1.2 % $ 294,299 $ 279,673 14,626 5.2 % $ 295,149 $ 285,568 9,581 3.4 %
30-Jun-15 30-Jun-14 Change ($) Change (%) 30-Jun-14 30-Jun-13 Change ($) Change (%) 30-Jun-13 30-Jun-12 Change ($) Change (%) Q2 $ 331,214 $ 327,992 3,222 1.0 % $ 314,323 $ 290,957 23,366 8.0 % $ 285,221 $ 272,290 12,931 4.7 %
30-Sep-15 30-Sep-14 Change ($) Change (%) 30-Sep-14 30-Sep-13 Change ($) Change (%) 30-Sep-13 30-Sep-12 Change ($) Change (%) Q3 $ 327,493 $ 329,953 (2,460) (0.7) % $ 346,462 $ 326,607 19,855 6.1 % $ 293,030 $ 271,002 22,028 8.1 %
31-Dec-15 31-Dec-14 Change ($) Change (%) 31-Dec-14 31-Dec-13 Change ($) Change (%) 31-Dec-13 31-Dec-12 Change ($) Change (%) Q4 $ 304,493 $ 300,686 3,807 1.3 % $ 341,235 $ 326,472 14,763 4.5 % $ 292,029 $ 273,976 18,053 6.6 %
2012 2011
31-Mar-12 31-Mar-11 Change ($) Change (%) 30-Jun-11 30-Jun-10 Change ($) Change (%) Q1 $ 274,181 $ 269,180 5,001 1.9 % $ 275,149 $ 253,450 21,699 8.6 %
30-Jun-12 30-Jun-11 Change ($) Change (%) 30-Sep-11 30-Sep-10 Change ($) Change (%) Q2 $ 281,137 $ 282,243 (1,106) (0.4) % $ 273,672 $ 255,020 18,652 7.3 %
30-Sep-12 30-Sep-11 Change ($) Change (%) 31-Dec-11 31-Dec-10 Change ($) Change (%) Q3 $ 273,675 $ 279,414 (5,739) (2.1) % $ 269,015 $ 262,169 6,846 2.6 %
31-Dec-12 31-Dec-11 Change ($) Change (%) Q4 $ 286,432 $ 279,204 7,228 2.6 %
10-Year Average Quarterly Change (%) 2.4 %
Please see the following pages for complete reconciliations of BXP’s Share of Same Property NOI—cash (excluding termination income) for each quarterly period presented over the past five years.

RECONCILIATIONS OF NON-GAAP FINANCIAL MEASURES AND OTHER FINANCIAL INFORMATION (UNAUDITED)
50
For the three months ended31-Mar-21 31-Mar-20
Net income (loss) attributable to Boston Properties, Inc. common shareholders $ 91,624 $ 497,496 Preferred stock redemption charge 6,412 — Preferred dividends 2,560 2,625 Net income (loss) attributable to Boston Properties, Inc. 100,596 500,121 Net income attributable to noncontrolling interests: Noncontrolling interest - common units of the Operating Partnership 11,084 57,539 Noncontrolling interest in property partnerships 16,467 19,486 Net income 128,147 577,146 Add: (Gains) losses from early extinguishments of debt 898 — Interest expense 107,902 101,591 Depreciation and amortization expense 176,565 171,094 Transaction costs 331 615 Payroll and related costs from management services contracts 3,505 3,237 General and administrative expense 44,959 36,454 Subtract: (Gains) losses from investments in securities (1,659) 5,445 Interest and other income (loss) (1,168) (3,017) (Gains) losses on sales of real estate — (410,165) (Income) loss from unconsolidated joint ventures (5,225) 369 Direct reimbursements of payroll and related costs from management services contracts (3,505) (3,237) Development and management services revenue (6,803) (7,879) Net Operating Income ("NOI") 443,947 471,653 Subtract: Straight-line rent (7,730) (31,430) Fair value lease revenue (653) (2,991) Termination income (4,269) (2,399) Add: Straight-line ground rent expense adjustment2 765 811 Lease transaction costs that qualify as rent inducements 1,859 2,399 NOI - cash 433,919 438,043 Subtract: NOI - cash from non Same Properties (excluding termination income) (24,220) (12,995) Same Property NOI - cash (excluding termination income) 409,699 425,048 Subtract: Partners' share of NOI - cash from consolidated JVs (excluding termination income) (49,973) (42,050) Add: Partners' share of NOI - cash from non Same Properties from consolidated JVs (excluding termination income) 8,517 205 BXP's share of NOI - cash from unconsolidated JVs (excluding termination income) 25,363 25,020 Subtract: BXP's share of NOI - cash from non Same Properties from unconsolidated JVs (excluding termination income) (4,903) (3,906) BXP's Share of Same Property NOI - cash (excluding termination income) $ 388,703 $ 404,317
BXP's Share of Same Property Net Operating Income—cash (excluding termination income) (continued)(in thousands)
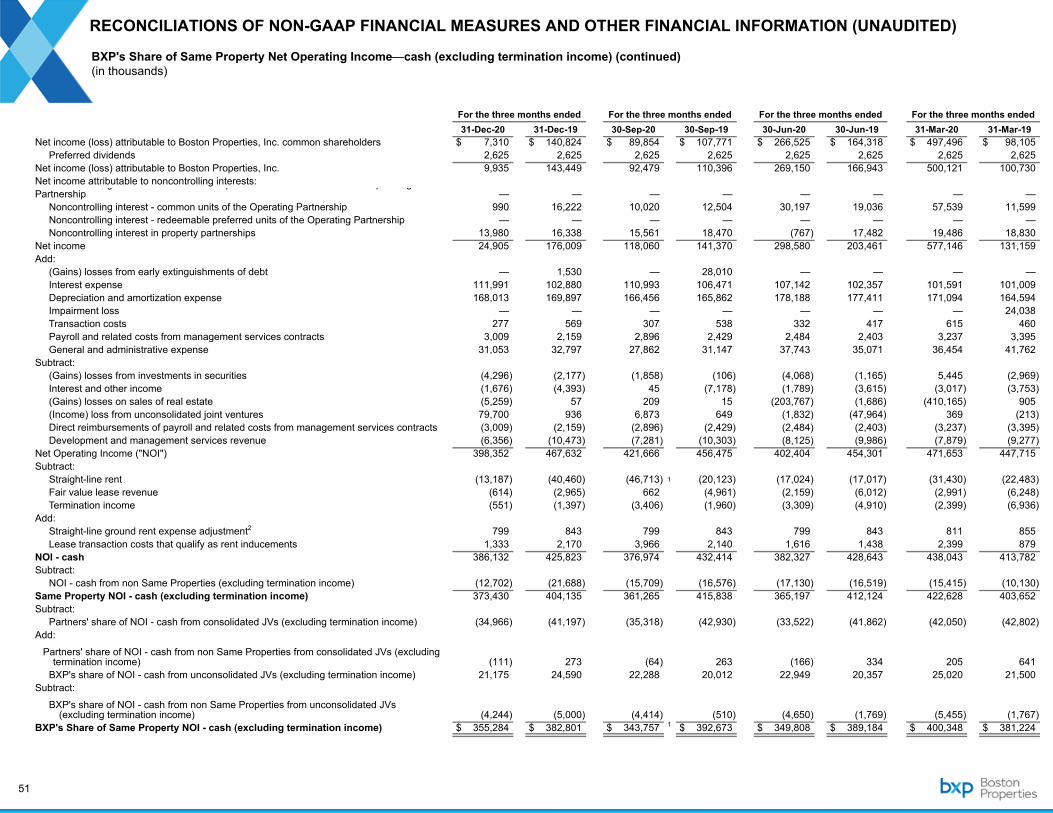
RECONCILIATIONS OF NON-GAAP FINANCIAL MEASURES AND OTHER FINANCIAL INFORMATION (UNAUDITED)
51
For the three months ended For the three months ended For the three months ended For the three months ended31-Dec-20 31-Dec-19 30-Sep-20 30-Sep-19 30-Jun-20 30-Jun-19 31-Mar-20 31-Mar-19
Net income (loss) attributable to Boston Properties, Inc. common shareholders $ 7,310 $ 140,824 $ 89,854 $ 107,771 $ 266,525 $ 164,318 $ 497,496 $ 98,105 Preferred dividends 2,625 2,625 2,625 2,625 2,625 2,625 2,625 2,625 Net income (loss) attributable to Boston Properties, Inc. 9,935 143,449 92,479 110,396 269,150 166,943 500,121 100,730 Net income attributable to noncontrolling interests: Noncontrolling interest in discontinued operations - common units of the Operating Partnership — — — — — — — — Noncontrolling interest - common units of the Operating Partnership 990 16,222 10,020 12,504 30,197 19,036 57,539 11,599 Noncontrolling interest - redeemable preferred units of the Operating Partnership — — — — — — — — Noncontrolling interest in property partnerships 13,980 16,338 15,561 18,470 (767) 17,482 19,486 18,830 Net income 24,905 176,009 118,060 141,370 298,580 203,461 577,146 131,159 Add: (Gains) losses from early extinguishments of debt — 1,530 — 28,010 — — — — Interest expense 111,991 102,880 110,993 106,471 107,142 102,357 101,591 101,009 Depreciation and amortization expense 168,013 169,897 166,456 165,862 178,188 177,411 171,094 164,594 Impairment loss — — — — — — — 24,038 Transaction costs 277 569 307 538 332 417 615 460 Payroll and related costs from management services contracts 3,009 2,159 2,896 2,429 2,484 2,403 3,237 3,395 General and administrative expense 31,053 32,797 27,862 31,147 37,743 35,071 36,454 41,762 Subtract: (Gains) losses from investments in securities (4,296) (2,177) (1,858) (106) (4,068) (1,165) 5,445 (2,969) Interest and other income (1,676) (4,393) 45 (7,178) (1,789) (3,615) (3,017) (3,753) (Gains) losses on sales of real estate (5,259) 57 209 15 (203,767) (1,686) (410,165) 905 (Income) loss from unconsolidated joint ventures 79,700 936 6,873 649 (1,832) (47,964) 369 (213) Direct reimbursements of payroll and related costs from management services contracts (3,009) (2,159) (2,896) (2,429) (2,484) (2,403) (3,237) (3,395) Development and management services revenue (6,356) (10,473) (7,281) (10,303) (8,125) (9,986) (7,879) (9,277) Net Operating Income ("NOI") 398,352 467,632 421,666 456,475 402,404 454,301 471,653 447,715 Subtract: Straight-line rent (13,187) (40,460) (46,713) 1 (20,123) (17,024) (17,017) (31,430) (22,483) Fair value lease revenue (614) (2,965) 662 (4,961) (2,159) (6,012) (2,991) (6,248) Termination income (551) (1,397) (3,406) (1,960) (3,309) (4,910) (2,399) (6,936) Add: Straight-line ground rent expense adjustment2 799 843 799 843 799 843 811 855 Lease transaction costs that qualify as rent inducements 1,333 2,170 3,966 2,140 1,616 1,438 2,399 879 NOI - cash 386,132 425,823 376,974 432,414 382,327 428,643 438,043 413,782 Subtract: NOI - cash from non Same Properties (excluding termination income) (12,702) (21,688) (15,709) (16,576) (17,130) (16,519) (15,415) (10,130) Same Property NOI - cash (excluding termination income) 373,430 404,135 361,265 415,838 365,197 412,124 422,628 403,652 Subtract: Partners' share of NOI - cash from consolidated JVs (excluding termination income) (34,966) (41,197) (35,318) (42,930) (33,522) (41,862) (42,050) (42,802) Add:
Partners' share of NOI - cash from non Same Properties from consolidated JVs (excluding termination income) (111) 273 (64) 263 (166) 334 205 641
BXP's share of NOI - cash from unconsolidated JVs (excluding termination income) 21,175 24,590 22,288 20,012 22,949 20,357 25,020 21,500 Subtract:
BXP's share of NOI - cash from non Same Properties from unconsolidated JVs (excluding termination income) (4,244) (5,000) (4,414) (510) (4,650) (1,769) (5,455) (1,767)
BXP's Share of Same Property NOI - cash (excluding termination income) $ 355,284 $ 382,801 $ 343,757 1 $ 392,673 $ 349,808 $ 389,184 $ 400,348 $ 381,224
BXP's Share of Same Property Net Operating Income—cash (excluding termination income) (continued)(in thousands)
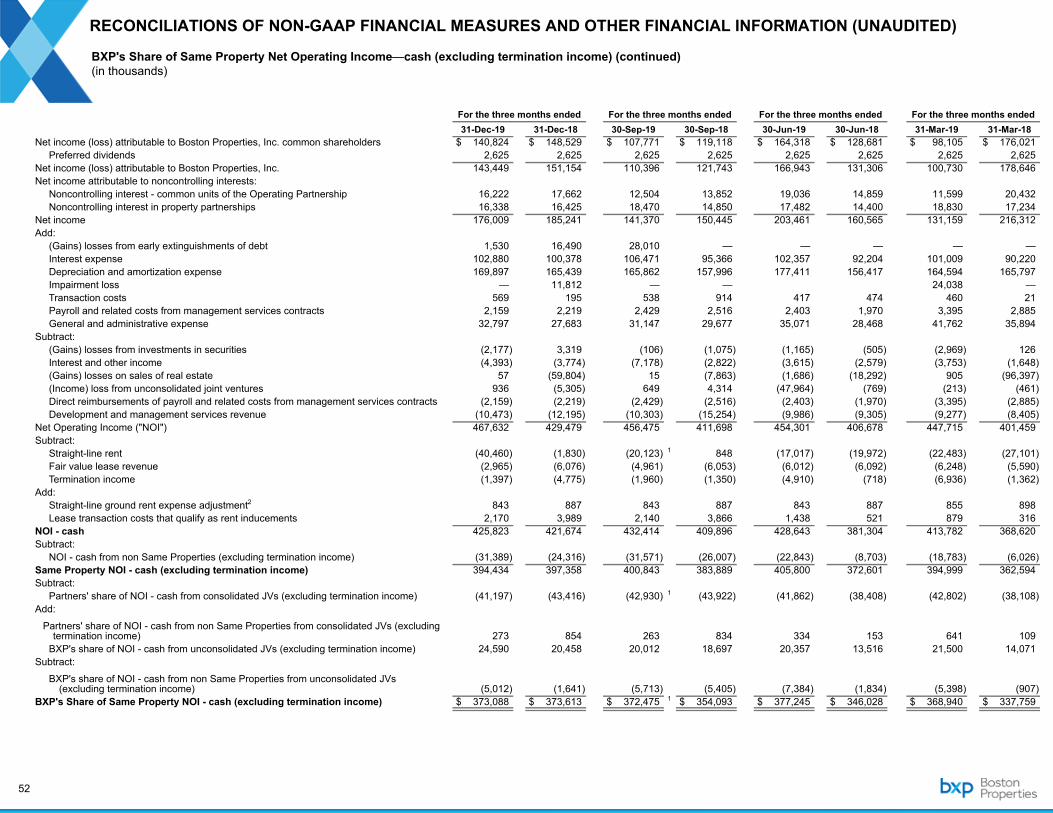
RECONCILIATIONS OF NON-GAAP FINANCIAL MEASURES AND OTHER FINANCIAL INFORMATION (UNAUDITED)
52
RECONCILIATIONS OF NON-GAAP FINANCIAL MEASURES AND OTHER FINANCIAL INFORMATION (UNAUDITED)
For the three months ended For the three months ended For the three months ended For the three months ended31-Dec-19 31-Dec-18 30-Sep-19 30-Sep-18 30-Jun-19 30-Jun-18 31-Mar-19 31-Mar-18
Net income (loss) attributable to Boston Properties, Inc. common shareholders $ 140,824 $ 148,529 $ 107,771 $ 119,118 $ 164,318 $ 128,681 $ 98,105 $ 176,021 Preferred dividends 2,625 2,625 2,625 2,625 2,625 2,625 2,625 2,625 Net income (loss) attributable to Boston Properties, Inc. 143,449 151,154 110,396 121,743 166,943 131,306 100,730 178,646 Net income attributable to noncontrolling interests: Noncontrolling interest - common units of the Operating Partnership 16,222 17,662 12,504 13,852 19,036 14,859 11,599 20,432 Noncontrolling interest in property partnerships 16,338 16,425 18,470 14,850 17,482 14,400 18,830 17,234 Net income 176,009 185,241 141,370 150,445 203,461 160,565 131,159 216,312 Add: (Gains) losses from early extinguishments of debt 1,530 16,490 28,010 — — — — — Interest expense 102,880 100,378 106,471 95,366 102,357 92,204 101,009 90,220 Depreciation and amortization expense 169,897 165,439 165,862 157,996 177,411 156,417 164,594 165,797 Impairment loss — 11,812 — — 24,038 — Transaction costs 569 195 538 914 417 474 460 21 Payroll and related costs from management services contracts 2,159 2,219 2,429 2,516 2,403 1,970 3,395 2,885 General and administrative expense 32,797 27,683 31,147 29,677 35,071 28,468 41,762 35,894 Subtract: (Gains) losses from investments in securities (2,177) 3,319 (106) (1,075) (1,165) (505) (2,969) 126 Interest and other income (4,393) (3,774) (7,178) (2,822) (3,615) (2,579) (3,753) (1,648) (Gains) losses on sales of real estate 57 (59,804) 15 (7,863) (1,686) (18,292) 905 (96,397) (Income) loss from unconsolidated joint ventures 936 (5,305) 649 4,314 (47,964) (769) (213) (461) Direct reimbursements of payroll and related costs from management services contracts (2,159) (2,219) (2,429) (2,516) (2,403) (1,970) (3,395) (2,885) Development and management services revenue (10,473) (12,195) (10,303) (15,254) (9,986) (9,305) (9,277) (8,405) Net Operating Income ("NOI") 467,632 429,479 456,475 411,698 454,301 406,678 447,715 401,459 Subtract: Straight-line rent (40,460) (1,830) (20,123) 1 848 (17,017) (19,972) (22,483) (27,101) Fair value lease revenue (2,965) (6,076) (4,961) (6,053) (6,012) (6,092) (6,248) (5,590) Termination income (1,397) (4,775) (1,960) (1,350) (4,910) (718) (6,936) (1,362) Add: Straight-line ground rent expense adjustment2 843 887 843 887 843 887 855 898 Lease transaction costs that qualify as rent inducements 2,170 3,989 2,140 3,866 1,438 521 879 316 NOI - cash 425,823 421,674 432,414 409,896 428,643 381,304 413,782 368,620 Subtract: NOI - cash from non Same Properties (excluding termination income) (31,389) (24,316) (31,571) (26,007) (22,843) (8,703) (18,783) (6,026) Same Property NOI - cash (excluding termination income) 394,434 397,358 400,843 383,889 405,800 372,601 394,999 362,594 Subtract: Partners' share of NOI - cash from consolidated JVs (excluding termination income) (41,197) (43,416) (42,930) 1 (43,922) (41,862) (38,408) (42,802) (38,108) Add:
Partners' share of NOI - cash from non Same Properties from consolidated JVs (excluding termination income) 273 854 263 834 334 153 641 109
BXP's share of NOI - cash from unconsolidated JVs (excluding termination income) 24,590 20,458 20,012 18,697 20,357 13,516 21,500 14,071 Subtract:
BXP's share of NOI - cash from non Same Properties from unconsolidated JVs (excluding termination income) (5,012) (1,641) (5,713) (5,405) (7,384) (1,834) (5,398) (907)
BXP's Share of Same Property NOI - cash (excluding termination income) $ 373,088 $ 373,613 $ 372,475 1 $ 354,093 $ 377,245 $ 346,028 $ 368,940 $ 337,759
BXP's Share of Same Property Net Operating Income—cash (excluding termination income) (continued)(in thousands)

RECONCILIATIONS OF NON-GAAP FINANCIAL MEASURES AND OTHER FINANCIAL INFORMATION (UNAUDITED)
53
RECONCILIATIONS OF NON-GAAP FINANCIAL MEASURES AND OTHER FINANCIAL INFORMATION (UNAUDITED)
For the three months ended For the three months ended For the three months ended For the three months ended31-Dec-18 31-Dec-17 30-Sep-18 30-Sep-17 30-Jun-18 30-Jun-17 31-Mar-18 31-Mar-17
Net income (loss) attributable to Boston Properties, Inc. common shareholders $ 148,529 $ 103,829 $ 119,118 $ 117,337 $ 128,681 $ 133,709 $ 176,021 $ 97,083 Preferred dividends 2,625 2,625 2,625 2,625 2,625 2,625 2,625 2,625 Net income (loss) attributable to Boston Properties, Inc. 151,154 106,454 121,743 119,962 131,306 136,334 178,646 99,708 Net income attributable to noncontrolling interests: Noncontrolling interest - common units of the Operating Partnership 17,662 11,884 13,852 13,402 14,859 15,473 20,432 11,432 Noncontrolling interest in property partnerships 16,425 13,865 14,850 14,340 14,400 15,203 17,234 4,424 Net income 185,241 132,203 150,445 147,704 160,565 167,010 216,312 115,564 Add: (Gains) losses from early extinguishments of debt 16,490 13,858 — — — (14,354) — — Interest expense 100,378 91,772 95,366 92,032 92,204 95,143 90,220 95,534 Depreciation and amortization expense 165,439 154,259 157,996 152,164 156,417 151,919 165,797 159,205 Impairment loss 11,812 — — — — — — — Transaction costs 195 96 914 239 474 299 21 34 Payroll and related costs from management services contracts 2,219 — 2,516 — 1,970 — 2,885 — General and administrative expense 27,683 29,396 29,677 25,792 28,468 27,141 35,894 31,386 Subtract: (Gains) losses from investments in securities 3,319 (962) (1,075) (944) (505) (730) 126 (1,042) Interest and other income (3,774) (2,336) (2,822) (1,329) (2,579) (1,504) (1,648) (614) Gains on sales of real estate (59,804) (872) (7,863) (2,891) (18,292) (3,767) (96,397) (133) (Income) loss from unconsolidated joint ventures (5,305) (4,197) 4,313 (843) (769) (3,108) (461) (3,084) Direct reimbursements of payroll and related costs from management services contracts (2,219) — (2,516) — (1,970) — (2,885) — Development and management services revenue (12,195) (9,957) (15,253) (10,811) (9,305) (7,365) (8,405) (6,472) Net Operating Income ("NOI") 429,479 403,260 411,698 401,113 406,678 410,684 401,459 390,378 Subtract: Straight-line rent (1,830) (22,323) 848 (16,105) (19,972) (3,060) (27,101) (12,023) Fair value lease revenue (6,076) (5,655) (6,053) (5,781) (6,092) (5,464) (5,590) (5,390) Termination income (4,775) (756) (1,350) (4,783) (718) (13,601) (1,362) (3,918) Add: Straight-line ground rent expense adjustment2 887 929 887 929 887 929 898 941 Lease transaction costs that qualify as rent inducements 3,989 225 3,866 (102) 521 115 316 682 NOI - cash 421,674 375,680 409,896 375,271 381,304 389,603 368,620 370,670 Subtract: NOI - cash from non Same Properties (excluding termination income) (23,135) (6,629) (26,602) (2,135) (10,207) 105 (6,915) (1,922) Same Property NOI - cash (excluding termination income) 398,539 369,051 383,294 373,136 371,097 389,708 361,705 368,748 Subtract: Partners' share of NOI - cash from consolidated JVs (excluding termination income) (43,416) (38,390) (43,922) (38,758) (39,865) (45,314) (39,770) (41,051) Add:
Partners' share of NOI - cash from non Same Properties from consolidated JVs (excluding termination income and after priority allocation and income allocation to private REIT shareholders) 854 (6) 834 (596) 189 (882) 313 (279)
BXP's share of NOI - cash from unconsolidated JVs (excluding termination income) 20,458 13,346 18,697 12,543 13,516 13,105 14,071 11,442 Subtract:
BXP's share of NOI - cash from non Same Properties from unconsolidated JVs (excluding termination income) (5,332) (52) (3,845) — (25) — (766) —
BXP's Share of Same Property NOI - cash (excluding termination income) $ 371,103 $ 343,949 $ 355,058 $ 346,325 $ 344,912 $ 356,617 $ 335,553 $ 338,860
BXP's Share of Same Property Net Operating Income—cash (excluding termination income) (continued)(in thousands)

RECONCILIATIONS OF NON-GAAP FINANCIAL MEASURES AND OTHER FINANCIAL INFORMATION (UNAUDITED)
54
For the three months ended For the three months ended For the three months ended For the three months ended31-Dec-17 30-Dec-16 30-Sep-17 30-Sep-16 30-Jun-17 30-Jun-16 31-Mar-17 31-Mar-16
Net income (loss) attributable to Boston Properties, Inc. common shareholders $ 103,829 $ 147,214 $ 117,337 $ 76,753 $ 133,709 $ 96,597 $ 97,083 $ 181,747 Preferred dividends 2,625 2,704 2,625 2,589 2,625 2,589 2,625 2,618 Net income (loss) attributable to Boston Properties, Inc. 106,454 149,918 119,962 79,342 136,334 99,186 99,708 184,365 Net income attributable to noncontrolling interests: Noncontrolling interest - common units of the Operating Partnership 11,884 17,097 13,402 9,387 15,473 11,357 11,432 21,393 Noncontrolling interest in property partnerships 13,865 (2,121) 14,340 (17,225) 15,203 6,814 4,424 10,464 Net income 132,203 164,894 147,704 71,504 167,010 117,357 115,564 216,222 Add: (Gains) losses from early extinguishments of debt 13,858 — — 371 (14,354) — — — Losses from interest rate contracts — — — 140 — — — — Interest expense 91,772 97,896 92,032 104,641 95,143 105,003 95,534 105,309 Depreciation and amortization expense 154,259 178,032 152,164 203,748 151,919 153,175 159,205 159,448 Impairment loss — — — 1,783 — — — — Transaction costs 96 1,200 239 249 299 913 34 25 General and administrative expense 29,396 25,293 25,792 25,165 27,141 25,418 31,386 29,353 Subtract: (Gains) losses from investments in securities (962) (560) (944) (976) (730) (478) (1,042) (259) Interest and other income (2,336) (573) (1,329) (3,628) (1,504) (1,524) (614) (1,505) Gains on sales of real estate (872) — (2,891) (12,983) (3,767) — (133) (67,623) Gains on sale of investment in unconsolidated joint venture — (59,370) — — — — — — (Income) loss from unconsolidated joint ventures (4,197) (2,585) (843) (1,464) (3,108) (2,234) (3,084) (1,791) Development and management services revenue (9,957) (9,698) (10,811) (6,364) (7,365) (5,533) (6,472) (6,689) Net Operating Income ("NOI") 403,260 394,529 401,113 382,186 410,684 392,097 390,378 432,490 Subtract: Straight-line rent (22,323) (14,711) (16,105) (11,107) (3,060) 6,503 (12,023) (14,424) Fair value lease revenue (5,655) (6,840) (5,781) (6,547) (5,464) (8,808) (5,390) (8,186) Termination income (756) (504) (4,783) 170 (13,601) (7,654) (3,918) (51,306) Add: Straight-line ground rent expense adjustment2 929 971 929 971 929 971 941 982 Lease transaction costs that qualify as rent inducements 225 487 (102) 861 115 2,200 682 5,305 NOI - cash (excluding termination income) 375,680 373,932 375,271 366,534 389,603 385,309 370,670 364,861 Subtract: NOI - cash from non Same Properties (excluding termination income) (6,884) (23) (467) 532 (6,818) (19,492) (8,187) (10,625) Same Property NOI - cash (excluding termination income) 368,796 373,909 374,804 367,066 382,785 365,817 362,483 354,236 Subtract: Partners' share of NOI - cash from consolidated JVs (excluding termination income) (40,084) (40,655) (40,283) (39,901) (45,314) (40,415) (41,051) (41,703) Add:
Partners' share of NOI - cash from non Same Properties from consolidated JVs (excluding termination income and after priority allocation and income allocation to private REIT shareholders) 192 (600) (589) (231) (882) 1,577 (279) 1,571
BXP's share of NOI - cash from unconsolidated JVs (excluding termination income) 13,557 10,602 12,708 10,647 13,182 8,881 11,537 9,109 Subtract:
BXP's share of NOI - cash from non Same Properties from unconsolidated JVs (excluding termination income) — (153) (494) (696) (5,188) (689) (4,322) (1,382)
BXP's Share of Same Property NOI - cash (excluding termination income) $ 342,461 $ 343,103 $ 346,146 $ 336,885 $ 344,583 $ 335,171 $ 328,368 $ 321,831
RECONCILIATIONS OF NON-GAAP FINANCIAL MEASURES AND OTHER FINANCIAL INFORMATION (UNAUDITED)
BXP's Share of Same Property Net Operating Income—cash (excluding termination income) (continued)(in thousands)
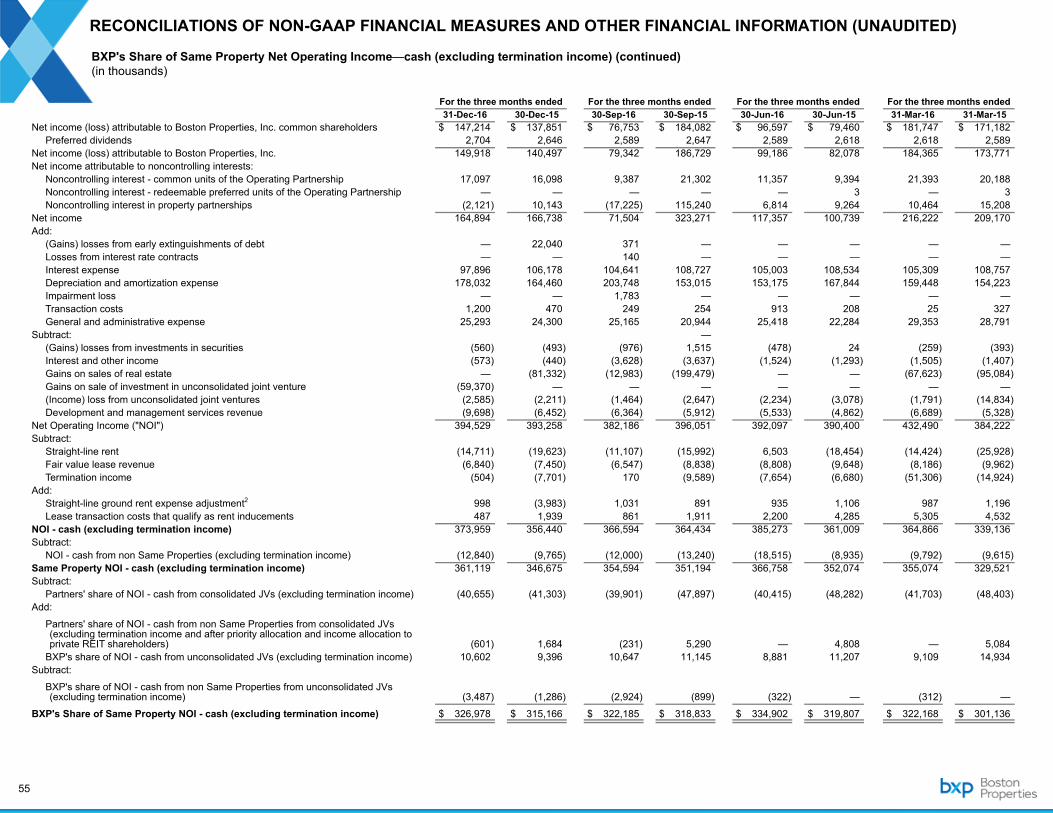
RECONCILIATIONS OF NON-GAAP FINANCIAL MEASURES AND OTHER FINANCIAL INFORMATION (UNAUDITED)
55
For the three months ended For the three months ended For the three months ended For the three months ended31-Dec-16 30-Dec-15 30-Sep-16 30-Sep-15 30-Jun-16 30-Jun-15 31-Mar-16 31-Mar-15
Net income (loss) attributable to Boston Properties, Inc. common shareholders $ 147,214 $ 137,851 $ 76,753 $ 184,082 $ 96,597 $ 79,460 $ 181,747 $ 171,182 Preferred dividends 2,704 2,646 2,589 2,647 2,589 2,618 2,618 2,589 Net income (loss) attributable to Boston Properties, Inc. 149,918 140,497 79,342 186,729 99,186 82,078 184,365 173,771 Net income attributable to noncontrolling interests: Noncontrolling interest - common units of the Operating Partnership 17,097 16,098 9,387 21,302 11,357 9,394 21,393 20,188 Noncontrolling interest - redeemable preferred units of the Operating Partnership — — — — — 3 — 3 Noncontrolling interest in property partnerships (2,121) 10,143 (17,225) 115,240 6,814 9,264 10,464 15,208 Net income 164,894 166,738 71,504 323,271 117,357 100,739 216,222 209,170 Add: (Gains) losses from early extinguishments of debt — 22,040 371 — — — — — Losses from interest rate contracts — — 140 — — — — — Interest expense 97,896 106,178 104,641 108,727 105,003 108,534 105,309 108,757 Depreciation and amortization expense 178,032 164,460 203,748 153,015 153,175 167,844 159,448 154,223 Impairment loss — — 1,783 — — — — — Transaction costs 1,200 470 249 254 913 208 25 327 General and administrative expense 25,293 24,300 25,165 20,944 25,418 22,284 29,353 28,791 Subtract: — (Gains) losses from investments in securities (560) (493) (976) 1,515 (478) 24 (259) (393) Interest and other income (573) (440) (3,628) (3,637) (1,524) (1,293) (1,505) (1,407) Gains on sales of real estate — (81,332) (12,983) (199,479) — — (67,623) (95,084) Gains on sale of investment in unconsolidated joint venture (59,370) — — — — — — — (Income) loss from unconsolidated joint ventures (2,585) (2,211) (1,464) (2,647) (2,234) (3,078) (1,791) (14,834) Development and management services revenue (9,698) (6,452) (6,364) (5,912) (5,533) (4,862) (6,689) (5,328) Net Operating Income ("NOI") 394,529 393,258 382,186 396,051 392,097 390,400 432,490 384,222 Subtract: Straight-line rent (14,711) (19,623) (11,107) (15,992) 6,503 (18,454) (14,424) (25,928) Fair value lease revenue (6,840) (7,450) (6,547) (8,838) (8,808) (9,648) (8,186) (9,962) Termination income (504) (7,701) 170 (9,589) (7,654) (6,680) (51,306) (14,924) Add: Straight-line ground rent expense adjustment2 998 (3,983) 1,031 891 935 1,106 987 1,196 Lease transaction costs that qualify as rent inducements 487 1,939 861 1,911 2,200 4,285 5,305 4,532 NOI - cash (excluding termination income) 373,959 356,440 366,594 364,434 385,273 361,009 364,866 339,136 Subtract: NOI - cash from non Same Properties (excluding termination income) (12,840) (9,765) (12,000) (13,240) (18,515) (8,935) (9,792) (9,615) Same Property NOI - cash (excluding termination income) 361,119 346,675 354,594 351,194 366,758 352,074 355,074 329,521 Subtract: Partners' share of NOI - cash from consolidated JVs (excluding termination income) (40,655) (41,303) (39,901) (47,897) (40,415) (48,282) (41,703) (48,403) Add:
Partners' share of NOI - cash from non Same Properties from consolidated JVs (excluding termination income and after priority allocation and income allocation to private REIT shareholders) (601) 1,684 (231) 5,290 — 4,808 — 5,084
BXP's share of NOI - cash from unconsolidated JVs (excluding termination income) 10,602 9,396 10,647 11,145 8,881 11,207 9,109 14,934 Subtract:
BXP's share of NOI - cash from non Same Properties from unconsolidated JVs (excluding termination income) (3,487) (1,286) (2,924) (899) (322) — (312) —
BXP's Share of Same Property NOI - cash (excluding termination income) $ 326,978 $ 315,166 $ 322,185 $ 318,833 $ 334,902 $ 319,807 $ 322,168 $ 301,136
RECONCILIATIONS OF NON-GAAP FINANCIAL MEASURES AND OTHER FINANCIAL INFORMATION (UNAUDITED)
BXP's Share of Same Property Net Operating Income—cash (excluding termination income) (continued)(in thousands)

RECONCILIATIONS OF NON-GAAP FINANCIAL MEASURES AND OTHER FINANCIAL INFORMATION (UNAUDITED)
56
For the three months ended For the three months ended For the three months ended For the three months ended31-Dec-15 31-Dec-14 30-Sep-15 30-Sep-14 30-Jun-15 30-Jun-14 31-Mar-15 31-Mar-14
Net income (loss) attributable to Boston Properties, Inc. common shareholders $ 137,851 $ 174,510 $ 184,082 $ 127,724 $ 79,460 $ 76,527 $ 171,182 $ 54,034 Preferred dividends 2,646 2,646 2,647 2,647 2,618 2,618 2,589 2,589 Net income (loss) attributable to Boston Properties, Inc. 140,497 177,156 186,729 130,371 82,078 79,145 173,771 56,623 Net income attributable to noncontrolling interests: Noncontrolling interest - common units of the Operating Partnership 16,098 21,172 21,302 14,963 9,394 8,883 20,188 6,160 Noncontrolling interest - redeemable preferred units of the Operating Partnership — 9 — 75 3 320 3 619 Noncontrolling interest in property partnerships 10,143 13,088 115,240 5,566 9,264 7,553 15,208 4,354 Net income 166,738 211,425 323,271 150,975 100,739 95,901 209,170 67,756 Add: (Gains) losses from early extinguishment of debt 22,040 10,633 — — — — — — Interest expense 106,178 117,904 108,727 113,308 108,534 110,977 108,757 113,554 Depreciation and amortization expense 164,460 162,430 153,015 157,245 167,844 154,628 154,223 154,270 Impairment loss — — — — — — — — Transaction costs 470 640 254 1,402 208 661 327 437 General and administrative expense 24,300 23,172 20,944 22,589 22,284 23,271 28,791 29,905 Subtract: (Gains) losses from investments in securities (493) (387) 1,515 297 24 (662) (393) (286) Interest and other income (440) (1,924) (3,637) (3,421) (1,293) (2,109) (1,407) (1,311) Gains on sales of real estate (81,332) (126,102) (199,479) (41,937) — — (95,084) — (Income) loss from unconsolidated joint ventures (2,211) (2,700) (2,647) (4,419) (3,078) (2,834) (14,834) (2,816) Development and management services revenue (6,452) (7,119) (5,912) (6,475) (4,862) (6,506) (5,328) (5,216) Net Operating Income ("NOI") 393,258 387,972 396,051 389,564 390,400 373,327 384,222 356,293 Subtract: Straight-line rent (19,623) (21,244) (15,992) (19,893) (18,455) (12,182) (25,928) (9,741) Fair value lease revenue (7,450) (17,542) (8,838) (11,516) (9,648) (9,609) (9,962) (9,598) Termination income (7,701) (1,134) (9,589) (8,164) (6,680) (986) (14,924) (1,110) Add: Straight-line ground rent expense adjustment2 (3,983) 1,669 891 1,669 1,106 1,708 1,196 1,747 Lease transaction costs that qualify as rent inducements 1,939 2,600 1,911 1,411 4,285 1,812 4,532 3,183 NOI - cash (excluding termination income) 356,440 352,321 364,434 353,071 361,008 354,070 339,136 340,774 Subtract: NOI - cash from non Same Properties (excluding termination income) (1,646) (6,374) (18,966) (6,899) (12,161) (6,724) (5,066) (6,235) Same Property NOI - cash (excluding termination income) 354,794 345,947 345,468 346,172 348,847 347,346 334,070 334,539 Subtract: Partners' share of NOI - cash from consolidated JVs (excluding termination income) (59,340) (58,608) (47,896) (29,436) (46,630) (30,465) (48,403) (30,777) Add:
Partners' share of NOI - cash from non Same Properties from consolidated JVs (excluding termination income and after priority allocation and income allocation to private REIT shareholders) — 1,968 19,625 1,949 17,759 — 17,654 —
BXP's share of NOI - cash from unconsolidated JVs (excluding termination income) 9,396 11,379 11,145 11,312 11,207 10,971 14,935 10,716
Subtract:
BXP's share of NOI - cash from non Same Properties from unconsolidated JVs (excluding termination income) (357) — (849) (44) 31 140 89 —
BXP's Share of Same Property NOI - cash (excluding termination income) $ 304,493 $ 300,686 $ 327,493 $ 329,953 $ 331,214 $ 327,992 $ 318,345 $ 314,478
RECONCILIATIONS OF NON-GAAP FINANCIAL MEASURES AND OTHER FINANCIAL INFORMATION (UNAUDITED)
BXP's Share of Same Property Net Operating Income—cash (excluding termination income) (continued)(in thousands)
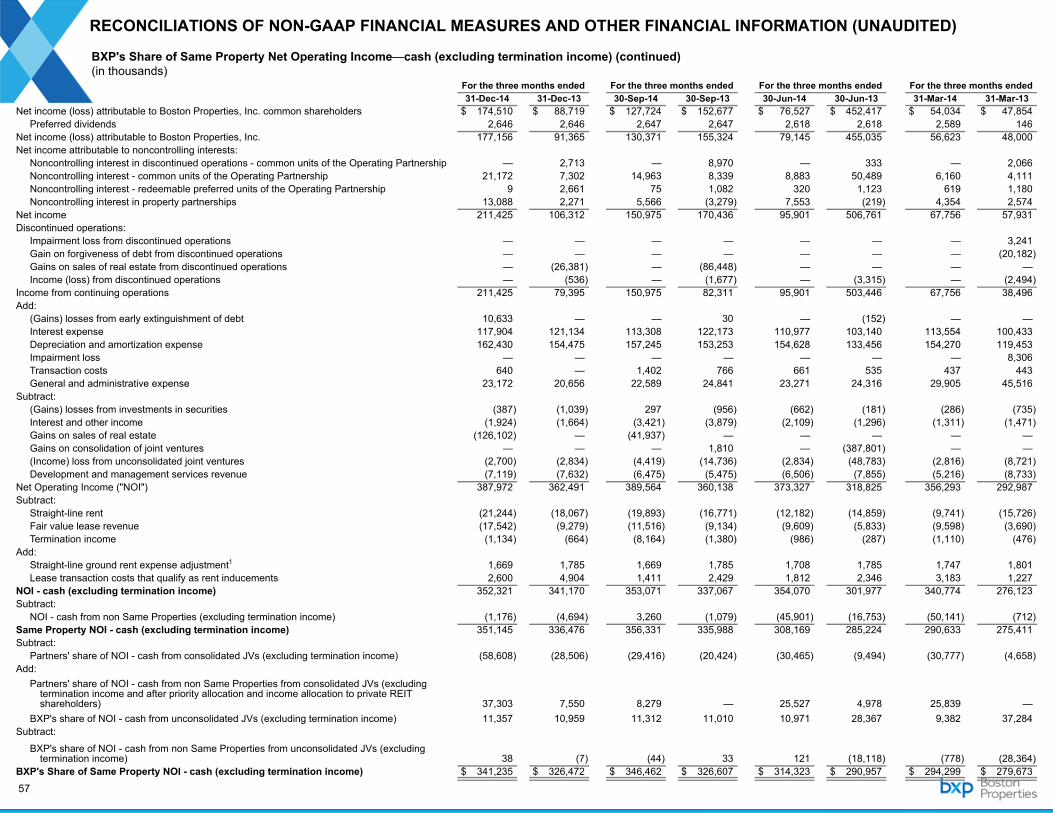
RECONCILIATIONS OF NON-GAAP FINANCIAL MEASURES AND OTHER FINANCIAL INFORMATION (UNAUDITED)
57
For the three months ended For the three months ended For the three months ended For the three months ended31-Dec-14 31-Dec-13 30-Sep-14 30-Sep-13 30-Jun-14 30-Jun-13 31-Mar-14 31-Mar-13
Net income (loss) attributable to Boston Properties, Inc. common shareholders $ 174,510 $ 88,719 $ 127,724 $ 152,677 $ 76,527 $ 452,417 $ 54,034 $ 47,854 Preferred dividends 2,646 2,646 2,647 2,647 2,618 2,618 2,589 146 Net income (loss) attributable to Boston Properties, Inc. 177,156 91,365 130,371 155,324 79,145 455,035 56,623 48,000 Net income attributable to noncontrolling interests: Noncontrolling interest in discontinued operations - common units of the Operating Partnership — 2,713 — 8,970 — 333 — 2,066 Noncontrolling interest - common units of the Operating Partnership 21,172 7,302 14,963 8,339 8,883 50,489 6,160 4,111 Noncontrolling interest - redeemable preferred units of the Operating Partnership 9 2,661 75 1,082 320 1,123 619 1,180 Noncontrolling interest in property partnerships 13,088 2,271 5,566 (3,279) 7,553 (219) 4,354 2,574 Net income 211,425 106,312 150,975 170,436 95,901 506,761 67,756 57,931 Discontinued operations: Impairment loss from discontinued operations — — — — — — — 3,241 Gain on forgiveness of debt from discontinued operations — — — — — — — (20,182) Gains on sales of real estate from discontinued operations — (26,381) — (86,448) — — — — Income (loss) from discontinued operations — (536) — (1,677) — (3,315) — (2,494) Income from continuing operations 211,425 79,395 150,975 82,311 95,901 503,446 67,756 38,496 Add: (Gains) losses from early extinguishment of debt 10,633 — — 30 — (152) — — Interest expense 117,904 121,134 113,308 122,173 110,977 103,140 113,554 100,433 Depreciation and amortization expense 162,430 154,475 157,245 153,253 154,628 133,456 154,270 119,453 Impairment loss — — — — — — — 8,306 Transaction costs 640 — 1,402 766 661 535 437 443 General and administrative expense 23,172 20,656 22,589 24,841 23,271 24,316 29,905 45,516 Subtract: (Gains) losses from investments in securities (387) (1,039) 297 (956) (662) (181) (286) (735) Interest and other income (1,924) (1,664) (3,421) (3,879) (2,109) (1,296) (1,311) (1,471) Gains on sales of real estate (126,102) — (41,937) — — — — — Gains on consolidation of joint ventures — — — 1,810 — (387,801) — — (Income) loss from unconsolidated joint ventures (2,700) (2,834) (4,419) (14,736) (2,834) (48,783) (2,816) (8,721) Development and management services revenue (7,119) (7,632) (6,475) (5,475) (6,506) (7,855) (5,216) (8,733) Net Operating Income ("NOI") 387,972 362,491 389,564 360,138 373,327 318,825 356,293 292,987 Subtract: Straight-line rent (21,244) (18,067) (19,893) (16,771) (12,182) (14,859) (9,741) (15,726) Fair value lease revenue (17,542) (9,279) (11,516) (9,134) (9,609) (5,833) (9,598) (3,690) Termination income (1,134) (664) (8,164) (1,380) (986) (287) (1,110) (476) Add: Straight-line ground rent expense adjustment1 1,669 1,785 1,669 1,785 1,708 1,785 1,747 1,801 Lease transaction costs that qualify as rent inducements 2,600 4,904 1,411 2,429 1,812 2,346 3,183 1,227 NOI - cash (excluding termination income) 352,321 341,170 353,071 337,067 354,070 301,977 340,774 276,123 Subtract: NOI - cash from non Same Properties (excluding termination income) (1,176) (4,694) 3,260 (1,079) (45,901) (16,753) (50,141) (712) Same Property NOI - cash (excluding termination income) 351,145 336,476 356,331 335,988 308,169 285,224 290,633 275,411 Subtract: Partners' share of NOI - cash from consolidated JVs (excluding termination income) (58,608) (28,506) (29,416) (20,424) (30,465) (9,494) (30,777) (4,658) Add: Partners' share of NOI - cash from non Same Properties from consolidated JVs (excluding
termination income and after priority allocation and income allocation to private REIT shareholders) 37,303 7,550 8,279 — 25,527 4,978 25,839 —
BXP's share of NOI - cash from unconsolidated JVs (excluding termination income) 11,357 10,959 11,312 11,010 10,971 28,367 9,382 37,284 Subtract:
BXP's share of NOI - cash from non Same Properties from unconsolidated JVs (excluding termination income) 38 (7) (44) 33 121 (18,118) (778) (28,364)
BXP's Share of Same Property NOI - cash (excluding termination income) $ 341,235 $ 326,472 $ 346,462 $ 326,607 $ 314,323 $ 290,957 $ 294,299 $ 279,673
BXP's Share of Same Property Net Operating Income—cash (excluding termination income) (continued)(in thousands)

RECONCILIATIONS OF NON-GAAP FINANCIAL MEASURES AND OTHER FINANCIAL INFORMATION (UNAUDITED)
58
For the three months ended For the three months ended For the three months ended For the three months ended31-Dec-13 31-Dec-12 30-Sep-13 30-Sep-12 30-Jun-13 30-Jun-12 31-Mar-13 31-Mar-12
Net income (loss) attributable to Boston Properties, Inc. common shareholders $ 88,719 $ 65,400 $ 152,677 $ 57,249 $ 452,417 $ 118,559 $ 47,854 $ 48,454 Preferred dividends 2,646 — 2,647 — 2,618 — 146 — Net income (loss) attributable to Boston Properties, Inc. 91,365 65,400 155,324 57,249 455,035 118,559 48,000 48,454 Net income attributable to noncontrolling interests: Noncontrolling interest in discontinued operations - common units of the Operating Partnership 2,713 245 8,910 162 88 4,075 1,819 61 Noncontrolling interest - common units of the Operating Partnership 7,302 7,575 8,399 6,779 50,734 10,318 4,358 5,973 Noncontrolling interest - redeemable preferred units of the Operating Partnership 2,661 1,057 1,082 874 1,123 765 1,180 801 Noncontrolling interest in property partnerships 2,271 2,331 (3,279) 458 (219) 457 2,574 546 Net income 106,312 76,608 170,436 65,522 506,761 134,174 57,931 55,835 Discontinued operations: Impairment loss from discontinued operations — — — — — — 3,241 — Gain on forgiveness of debt from discontinued operations — — — — — — (20,182) — Gains on sales of real estate from discontinued operations (26,381) — (86,448) — — (36,877) — — Income (loss) from discontinued operations (536) (2,357) (1,078) (1,550) (873) (218) (61) (570) Income from continuing operations 79,395 74,251 82,910 63,972 505,888 97,079 40,929 55,265 Add: (Gains) losses from early extinguishment of debt — — 30 5,494 (152) (274) — (767) Interest expense 121,134 102,802 122,173 105,030 103,140 99,901 100,433 103,237 Depreciation and amortization expense 154,475 118,752 154,193 110,653 134,604 111,168 120,595 108,462 Impairment loss — — — — — — 8,306 — Transaction costs — 401 766 1,140 535 8 443 2,104 General and administrative expense 20,656 17,921 24,841 21,617 22,194 19,066 43,571 27,619 Subtract: (Gains) losses from investments in securities (1,039) (187) (956) (587) (181) 186 (735) (801) Interest and other income (loss) (1,664) (2,062) (3,879) (4,001) (1,296) (2,382) (1,471) (1,646) Gains on consolidation of joint ventures — — 1,810 — (387,801) — — — (Income) loss from unconsolidated joint ventures (2,834) (6,949) (14,736) (9,217) (48,783) (21,191) (8,721) (11,721) Development and management services revenue (7,632) (8,340) (5,479) (8,024) (7,857) (9,564) (8,736) (8,145) Net Operating Income ("NOI") 362,491 296,589 361,673 286,077 320,291 293,997 294,614 273,607 Subtract: Straight-line rent (18,025) (18,216) (16,742) (20,026) (15,112) (19,775) (15,864) (19,270) Fair value lease revenue (9,279) (3,711) (9,134) (3,919) (5,833) (3,759) (3,760) (2,937) Termination income (664) (2,094) (1,380) (1,205) (287) (4,086) (476) (3,056) Add: Straight-line ground rent expense adjustment1 1,785 1,838 1,785 1,838 1,785 1,838 1,801 5,032 Lease transaction costs that qualify as rent inducements 4,895 890 2,429 1,247 2,346 (372) 1,237 508 NOI - cash (excluding termination income) 341,203 275,296 338,631 264,012 303,190 267,843 277,552 253,884 Subtract: NOI - cash from non Same Properties (excluding termination income) (53,445) (6,121) (52,742) (981) (25,023) (3,770) (16,295) (3,496) Same Property NOI - cash (excluding termination income) 287,758 269,175 285,889 263,031 278,167 264,073 261,257 250,388 Subtract: Partners' share of NOI - cash from consolidated JVs (excluding termination income) (28,506) (4,280) (20,424) (1,730) (9,494) (1,792) (4,658) (1,859) Add: Partners' share of NOI - cash from non Same Properties from consolidated JVs (excluding
termination income and after priority allocation and income allocation to private REIT shareholders) 23,786 — 18,473 — 7,631 — 2,771 —
BXP's share of NOI - cash from unconsolidated JVs (excluding termination income) 9,647 36,233 9,715 37,089 26,958 37,228 35,863 37,039 Subtract:
BXP's share of NOI - cash from non Same Properties from unconsolidated JVs (excluding termination income) (656) (27,152) (623) (27,389) (18,041) (27,219) (84) —
BXP's Share of Same Property NOI - cash (excluding termination income) $ 292,029 $ 273,976 $ 293,030 $ 271,002 $ 285,221 $ 272,290 $ 295,149 $ 285,568
BXP's Share of Same Property Net Operating Income—cash (excluding termination income) (continued)(in thousands)

RECONCILIATIONS OF NON-GAAP FINANCIAL MEASURES AND OTHER FINANCIAL INFORMATION (UNAUDITED)
59
For the three months ended For the three months ended For the three months ended For the three months ended31-Dec-12 31-Dec-11 30-Sep-12 30-Sep-11 30-Jun-12 30-Jun-11 31-Mar-12 31-Mar-11
Net income (loss) attributable to Boston Properties, Inc. common shareholders $ 65,400 $ 101,644 $ 57,769 $ 70,542 $ 119,070 $ 60,214 $ 64,632 $ 40,813 Preferred dividends — — — — — — — — Net income (loss) attributable to Boston Properties, Inc. 65,400 101,644 57,769 70,542 119,070 60,214 64,632 40,813 Net income attributable to noncontrolling interests: Noncontrolling interest in discontinued operations - common units of the Operating
Partnership — 47 — 2 4,094 (15) 1,942 (61) Noncontrolling interest - common units of the Operating Partnership 7,820 12,470 7,002 8,989 10,360 8,194 6,089 6,090 Noncontrolling interest - redeemable preferred units of the Operating Partnership 1,057 842 874 832 765 842 801 823 Noncontrolling interest in property partnerships 2,331 440 458 86 457 503 546 529 Net income 76,608 115,443 66,103 80,451 134,746 69,738 74,010 48,194 Discontinued operations: Gain on forgiveness of debt from discontinued operations — — — — — — (17,807) — Gains on sales of real estate from discontinued operations — — — — (36,877) — — — Income (loss) from discontinued operations — (437) — (20) (398) 132 156 497 Income from continuing operations 76,608 115,006 66,103 80,431 97,471 69,870 56,359 48,691 Add: (Gains) losses from early extinguishment of debt — 1,494 5,494 — (274) — (767) — Interest expense 103,452 103,967 105,030 95,117 99,901 94,583 103,237 98,525 Depreciation and amortization expense 120,550 108,511 111,360 108,674 111,643 110,259 109,673 109,237 Transaction costs 401 80 1,140 474 8 1,361 2,104 72 General and administrative expense 15,940 19,329 19,757 16,917 19,066 18,721 27,619 24,643 Subtract: (Gains) losses from investments in securities (187) (38) (587) 860 186 (6) (801) (373) Interest and other income (loss) (2,062) (1,179) (4,001) (1,252) (2,382) (1,953) (1,646) (974) (Income) loss from unconsolidated joint ventures (6,949) (57,712) (9,217) (11,326) (21,191) (8,882) (11,721) (7,976) Development and management services revenue (8,343) (8,726) (8,024) (8,178) (9,564) (9,095) (8,149) (7,428) Net Operating Income ("NOI") 299,410 280,732 287,055 281,717 294,864 274,858 275,908 264,417 Subtract: Straight-line rent (18,425) (17,227) (20,310) (19,106) (19,772) (22,229) (19,413) (18,492) Fair value lease revenue (3,781) (2,742) (3,989) (2,690) (3,829) (2,627) (3,007) (2,697) Termination income (2,095) (6,463) (959) (8,188) (4,086) (222) (3,056) (1,992) Add: Straight-line ground rent expense adjustment1 1,838 1,788 1,838 1,687 1,838 682 5,032 56 Lease transaction costs that qualify as rent inducements 890 — 1,247 — 372 — (508) — NOI - cash (excluding termination income) 277,837 256,088 264,882 253,420 269,387 250,462 254,956 241,292 Subtract: NOI - cash from non Same Properties (excluding termination income) (24,246) (10,019) (25,069) (7,479) (23,682) (1,280) (15,956) (4,535) Same Property NOI - cash (excluding termination income) 253,591 246,069 239,813 245,941 245,705 249,182 239,000 236,757 Subtract: Partners' share of NOI - cash from consolidated JVs (excluding termination income) (4,280) (1,720) (1,729) (1,336) (1,791) (1,746) (1,858) (1,774) Add: Partners' share of NOI - cash from non Same Properties from consolidated JVs (excluding
termination income and after priority allocation and income allocation to private REIT shareholders) 2,435 — — — — — — —
BXP's share of NOI - cash from unconsolidated JVs (excluding termination income) 34,810 35,255 35,660 36,920 37,228 37,000 37,039 36,511 Subtract:
BXP's share of NOI - cash from non Same Properties from unconsolidated JVs (excluding termination income) (124) (400) (69) (2,111) (5) (2,193) — (2,314)
BXP's Share of Same Property NOI - cash (excluding termination income) $ 286,432 $ 279,204 $ 273,675 $ 279,414 $ 281,137 $ 282,243 $ 274,181 $ 269,180
BXP's Share of Same Property Net Operating Income—cash (excluding termination income) (continued)(in thousands)

RECONCILIATIONS OF NON-GAAP FINANCIAL MEASURES AND OTHER FINANCIAL INFORMATION (UNAUDITED)
60
For the three months ended For the three months ended For the three months ended31-Dec-11 31-Dec-10 30-Sep-11 30-Sep-10 30-Jun-11 30-Jun-10
Net income (loss) attributable to Boston Properties, Inc. common shareholders $ 101,644 $ (12,903) $ 70,542 $ 57,668 $ 60,214 $ 61,412 Preferred dividends — — — — — — Net income (loss) attributable to Boston Properties, Inc. 101,644 (12,903) 70,542 57,668 60,214 61,412 Net income attributable to noncontrolling interests: Noncontrolling interest in discontinued operations - common units of the Operating Partnership 47 — 2 — (15) — Noncontrolling interest in gains on sales of real estate - common units of the Operating Partnership — — — — — 125 Noncontrolling interest - common units of the Operating Partnership 12,470 (1,555) 8,989 8,712 8,194 9,250 Noncontrolling interest - redeemable preferred units of the Operating Partnership 842 795 832 820 842 836 Noncontrolling interest in property partnerships 440 907 86 889 503 864 Net income 115,443 (12,756) 80,451 68,089 69,738 72,487 Add: (Gains) losses from early extinguishment of debt 1,494 81,662 — — — 6,051 Interest expense 103,967 92,192 95,777 97,103 95,236 96,755 Depreciation and amortization expense 109,181 92,763 109,495 81,133 111,080 81,400 Transaction costs 19 721 51 1,893 13 — General and administrative expense 19,390 17,121 17,340 18,067 20,069 17,648 Subtract: (Gains) losses from investments in securities (38) (682) 860 (731) (6) 678 Interest and other income (loss) (1,179) (1,691) (1,252) (1,814) (1,953) (2,117) (Gains) losses on sales of real estate — — — — — (969) (Income) loss from unconsolidated joint ventures (57,712) (9,834) (11,326) (11,565) (8,882) (7,465) Development and management services revenue (8,729) (6,964) (8,180) (6,439) (9,098) (18,884) Net Operating Income ("NOI") 281,836 252,532 283,216 245,736 276,197 245,584 Subtract: Straight-line rent (17,233) (17,220) (19,070) (19,815) (22,222) (23,850) Fair value lease revenue (2,742) (514) (2,690) (596) (2,627) (728) Termination income (6,463) (2,175) (8,188) (3,610) (222) (2,346) Add: Straight-line ground rent expense adjustment1 1,788 — 1,687 — 682 — NOI - cash (excluding termination income) 257,186 232,623 254,955 221,715 251,808 218,660 Subtract: NOI - cash from non Same Properties (excluding termination income) (21,306) (2,114) (16,841) (1,833) (11,912) (135) Same Property NOI - cash (excluding termination income) 235,880 230,509 238,114 219,882 239,896 218,525 Subtract: Partners' share of NOI - cash from consolidated JVs (excluding termination income) (1,720) (1,644) (1,336) (1,716) (1,747) (1,670) Add: Partners' share of NOI - cash from non Same Properties from consolidated JVs (excluding termination
income and after priority allocation and income allocation to private REIT shareholders) — — — — — — BXP's share of NOI - cash from unconsolidated JVs (excluding termination income) 35,255 35,960 36,920 37,206 37,000 36,621 Subtract:
BXP's share of NOI - cash from non Same Properties from unconsolidated JVs (excluding termination income) (400) (2,656) (26) (352) — (26)
BXP's Share of Same Property NOI - cash (excluding termination income) $ 269,015 $ 262,169 $ 273,672 $ 255,020 $ 275,149 $ 253,450
BXP's Share of Same Property Net Operating Income—cash (excluding termination income) (continued)(in thousands)
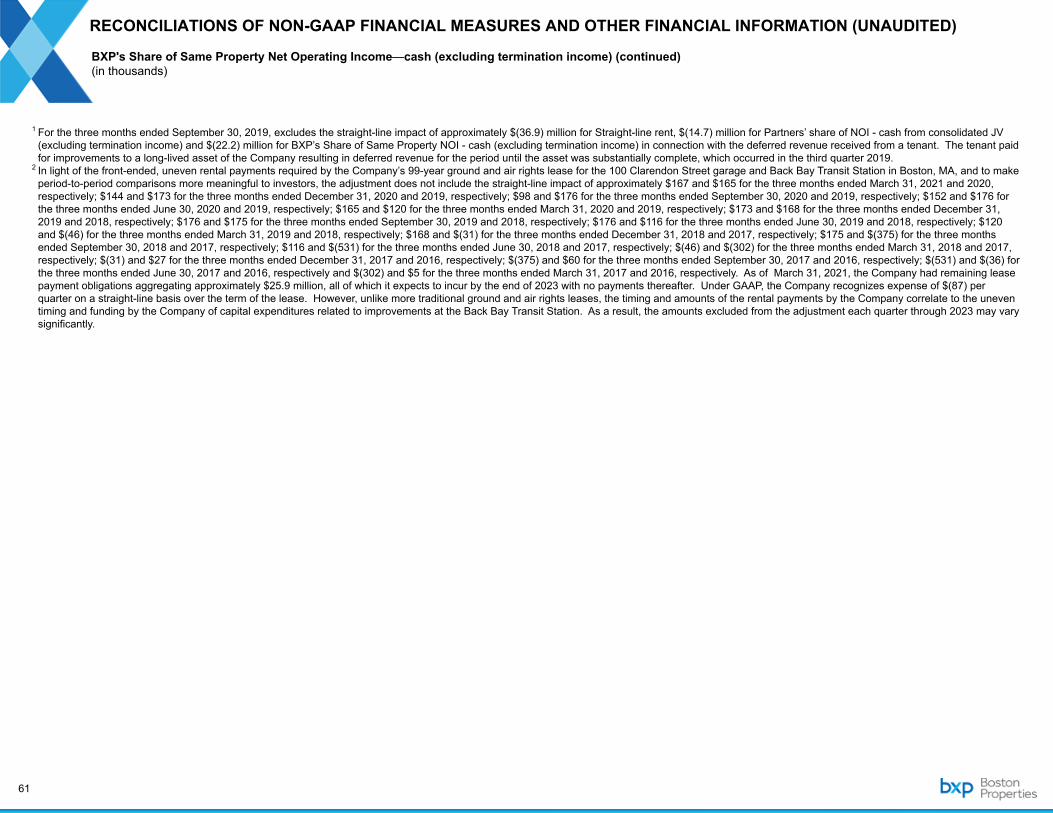
RECONCILIATIONS OF NON-GAAP FINANCIAL MEASURES AND OTHER FINANCIAL INFORMATION (UNAUDITED)
61
RECONCILIATIONS OF NON-GAAP FINANCIAL MEASURES AND OTHER FINANCIAL INFORMATION (UNAUDITED)
1 For the three months ended September 30, 2019, excludes the straight-line impact of approximately $(36.9) million for Straight-line rent, $(14.7) million for Partners’ share of NOI - cash from consolidated JV (excluding termination income) and $(22.2) million for BXP’s Share of Same Property NOI - cash (excluding termination income) in connection with the deferred revenue received from a tenant. The tenant paid for improvements to a long-lived asset of the Company resulting in deferred revenue for the period until the asset was substantially complete, which occurred in the third quarter 2019.
2 In light of the front-ended, uneven rental payments required by the Company’s 99-year ground and air rights lease for the 100 Clarendon Street garage and Back Bay Transit Station in Boston, MA, and to make period-to-period comparisons more meaningful to investors, the adjustment does not include the straight-line impact of approximately $167 and $165 for the three months ended March 31, 2021 and 2020, respectively; $144 and $173 for the three months ended December 31, 2020 and 2019, respectively; $98 and $176 for the three months ended September 30, 2020 and 2019, respectively; $152 and $176 for the three months ended June 30, 2020 and 2019, respectively; $165 and $120 for the three months ended March 31, 2020 and 2019, respectively; $173 and $168 for the three months ended December 31, 2019 and 2018, respectively; $176 and $175 for the three months ended September 30, 2019 and 2018, respectively; $176 and $116 for the three months ended June 30, 2019 and 2018, respectively; $120 and $(46) for the three months ended March 31, 2019 and 2018, respectively; $168 and $(31) for the three months ended December 31, 2018 and 2017, respectively; $175 and $(375) for the three months ended September 30, 2018 and 2017, respectively; $116 and $(531) for the three months ended June 30, 2018 and 2017, respectively; $(46) and $(302) for the three months ended March 31, 2018 and 2017, respectively; $(31) and $27 for the three months ended December 31, 2017 and 2016, respectively; $(375) and $60 for the three months ended September 30, 2017 and 2016, respectively; $(531) and $(36) for the three months ended June 30, 2017 and 2016, respectively and $(302) and $5 for the three months ended March 31, 2017 and 2016, respectively. As of March 31, 2021, the Company had remaining lease payment obligations aggregating approximately $25.9 million, all of which it expects to incur by the end of 2023 with no payments thereafter. Under GAAP, the Company recognizes expense of $(87) per quarter on a straight-line basis over the term of the lease. However, unlike more traditional ground and air rights leases, the timing and amounts of the rental payments by the Company correlate to the uneven timing and funding by the Company of capital expenditures related to improvements at the Back Bay Transit Station. As a result, the amounts excluded from the adjustment each quarter through 2023 may vary significantly.
BXP's Share of Same Property Net Operating Income—cash (excluding termination income) (continued)(in thousands)


