Page 1
Permeability, Resistivity and Strength of Fouled Railroad Ballast
By: AJ Rahman
B.S., University of Kansas, Lawrence, Spring 2013
Submitted to the Department of Civil, Environmental, and Architectural Engineering and the Graduate Faculty of the University of Kansas in partial
fulfillment of the requirements for the degree of Master of Science
________________________________ Chairperson Dr. Robert L. Parsons
Committee members
________________________________ Dr. Jie Han
________________________________ Dr. Thomas Glavinich
Page 2
ii
The Thesis Committee for AJ Rahman certifies that this is the approved version of the following thesis:
Permeability, Resistivity and Strength of Fouled Railroad Ballast
Date approved: 5/7/2013
________________________________ Chairperson Dr. Robert L. Parsons
Page 3
iii
Table of Contents
List of Abbreviations ......................................................................................................................... xi
Acknowledgments .............................................................................................................................xiii
Abstract ............................................................................................................................................. xiv
Chapter 1 Introduction........................................................................................................................ 1
Chapter 2 Literature Review ............................................................................................................... 3
2.1 Effects of Fouled Ballast ......................................................................................................... 3
2.2 Soil Resistivity ......................................................................................................................... 5
2.3 Railroad Ballast Fouling Detection.......................................................................................... 8
Chapter 3 Material Testing ............................................................................................................... 11
3.1 Material ................................................................................................................................ 11
3.1.1 Gradation of Ballast ........................................................................................................... 11
3.1.2 Gradation of Crushed Ballast Fines.................................................................................... 13
3.1.3 Gradation of Clay ............................................................................................................... 14
3.1.4 Gradation of Coal Dust ...................................................................................................... 15
3.1.5 Specific Gravity and Absorption of Ballast Coarse Aggregates ......................................... 18
3.1.6 Specific Gravity of Crushed Ballast Aggregates ................................................................. 19
3.1.7 Specific Gravity of Clay ...................................................................................................... 20
3.2 Summary ............................................................................................................................... 20
Chapter 4 Test Setup and Instrumentation ...................................................................................... 21
4.1 Permeability and Resistivity Test Setup and Instrumentation ............................................. 21
4.2 Permeability and Resistivity Test Procedure ........................................................................ 26
4.3 Large Direct Shear Box Test Setup and Instrumentation ..................................................... 36
4.5 Modified Direct Shear Test Setup and Instrumentation ...................................................... 41
Page 4
4.6 Modified Direct Shear Test Procedure ................................................................................. 41
4.7 Large Scale Resistivity Test on Fouled Ballast ...................................................................... 44
Chapter 5 Results and Discussion ..................................................................................................... 47
5.1 Permeability Test Data ......................................................................................................... 47
5.2 Resistivity Test Data.............................................................................................................. 53
5.3 Direct Shear Test Data .......................................................................................................... 61
5.4 Modified Direct Shear Test Data .......................................................................................... 76
5.5 Summary of Large Direct Shear Box and Modified Direct Shear Box Tests Results ............. 88
5.6 Large Scale Resistivity Test ................................................................................................... 92
Chapter 6 Conclusions....................................................................................................................... 97
References ...................................................................................................................................... 100
Page 5
List of Figures Figure 3.1 Sieve shaker 12
Figure 3.2 Gradation curves of the ballast aggregates 12
Figure 3.3 Gradation curve of the crushed ballast fines 14
Figure 3.4 Gradation curve of clay 15
Figure 3.5 Gradation curve of coal dust
Figure 3.6 Comparison of gradation curves for fouling materials
Figure 3.7 Ballast aggregates immersed in water 18
Figure 3.8 Ballast aggregates in SSD condition 18
Figure 3.9 Wire basket and scale used to measure weight of aggregates when
submerged in water 19
Figure 4.1.1 Plastic support and fiber glass screen 22
Figure 4.1.2 Cut front wall of the box and place the glass wall 23
Figure 4.1.3 Secure and seal glass wall 23
Figure 4.1.4 Aluminum sheets and copper rods spaced equally 24
Figure 4.1.5 Schematic diagram for the setup of the test 24
Figure 4.1.6 Schematic diagram for the setup of the test with dimensions 25
Figure 4.1.7 Picture of actual test setup 25
Figure 4.2.1 Washing the box prior to testing 28
Figure 4.2.2 Screen wrapped around support 28
Figure 4.2.3 Verify box is leveled 28
Figure 4.2.4 Tap sides of the wall to compact sample 28
Figure 4.2.5 First layer of ballast mixed with fouling material 29
Page 6
Figure 4.2.6 Box filled with sample and ready for test 30
Figure 4.2.7 Flooding the sample with water through the bottom pipe 31
Figure 4.2.8 Water rise in standpipe relative to water level in sample 32
Figure 4.2.9 Close picture of height of water in standpipe 32
Figure 4.2.10 Constant head flow exiting the outflow pipe 33
Figure 4.2.11 Collect water at a certain time period 33
Figure 4.2.12 Verify draining water is clean (no loss of fines) 34
Figure 4.2.13 Aluminum sheets and copper rods connected to resistivity meter 34
Figure 4.2.14 Measure resistance in sample 35
Figure 4.3.1 Large direct shear box 37
Figure 4.3.2 Pressure gauge and display 38
Figure 4.3.3 Test Monitor 38
Figure 4.3.4 Cylinder and top plate 38
Figure 4.3.2 Pressure gauge and display 38
Figure 4.4.1 Bottom box (ballast and clay) 40
Figure 4.4.2 Top box fixed 40
Figure 4.4.3 Loading frame assembled and air supply connected 40
Figure 4.5.1 Installing box extension to bottom box 41
Figure 4.5.2 Modified direct shear box 42
Figure 4.5.3 Modified direct shear box with clean ballast 42
Figure 4.5.4 Modified direct shear box setup 43
Figure 4.7.1 3-D Schematic diagram of the steup of the test 44
Figure 4.7.2 Sample of fouled ballast 45
Page 7
Figure 4.7.3 Spraying water on top of sample 45
Figure 4.7.4 Resistivity four point test setup 46
Figure 4.7.5 Measure resistance in sample 46
Figure 5.1.1 Measured hydraulic conductivity versus fouling ratio
for crushed ballast fines, clay and coal dust 47
Figure 5.1.2 Measured hydraulic conductivity (log scale) versus fouling ratio
for crushed ballast fines, clay and coal dust 48
Figure 5.1.3 Close up picture of material loss after sample is filled with water 50
Figure 5.1.4 Geotextile placed on top of sample 50
Figure 5.1.5 Clean water flow out of pipe 50
Figure 5.1.6 Hydraulic conductivity (log scale) versus fouling index of fouled ballast 51
Figure 5.2.1 Measured resistivity of fouled ballast (crushed ballast fines) versus time (log scale)
at different fouling ratio 54
Figure 5.2.2 Measured resistivity of fouled ballast (clay) versus time (log scale) at different
fouling ratio 54
Figure 5.2.3 Measured resistivity of fouled ballast (coal dust) versus time (log scale) at different
fouling ratio 55
Figure 5.2.4 Comparison of the resistivity of fouled ballast (crushed ballast fines, clay and coal
dust) at the 18th hour 57
Figure 5.2.5 Comparison between measured hydraulic conductivity and resistivity at 18th hour
versus fouling ratio 58
Figure 5.3.1 Shear stress versus horizontal displacement of clean ballast 62
Figure 5.3.2 Display of particle crushing 63
Page 8
Figure 5.3.3 Crushed ballast fines after clean ballast direct shear test 63
Figure 5.3.4 Shear stress versus horizontal displacement of ballast fouled with 20% crushed
ballast fines 64
Figure 5.3.5 Shear stress versus horizontal displacement of ballast fouled with 30% crushed
ballast fines 64
Figure 5.3.6 Shear stress versus horizontal displacement of ballast fouled with 40% crushed
ballast fines 65
Figure 5.3.7 Shear stress versus horizontal displacement of ballast fouled with 50% crushed
ballast fines 65
Figure 5.3.8 Failure envelopes of clean ballast and fouled ballast with crushed ballast fines
66
Figure 5.3.9 Shear stress versus horizontal displacement of ballast fouled with 20% clay 67
Figure 5.3.10 Shear stress versus horizontal displacement of ballast fouled with 30% clay
67
Figure 5.3.11 Shear stress versus horizontal displacement of ballast fouled with 40% clay
68
Figure 5.3.12 Shear stress versus horizontal displacement of ballast fouled with 50% clay
68
Figure 5.3.13 Failure envelopes of clean ballast and fouled ballast with clay 69
Figure 5.3.14 Shear stress versus horizontal displacement of ballast fouled with 10% coal dust
70
Figure 5.3.15 Shear stress versus horizontal displacement of ballast fouled with 20% coal dust
70
Page 9
Figure 5.3.16 Shear stress versus horizontal displacement of ballast fouled with 30% coal dust
71
Figure 5.3.17 Shear stress versus horizontal displacement of ballast fouled with 40% coal dust
71
Figure 5.3.18 Shear stress versus horizontal displacement of ballast fouled with 50% coal dust
72
Figure 5.3.19 Failure envelopes of clean ballast and fouled ballast with coal dust 72
Figure 5.3.20 Comparison of failure envelopes of clean and fouled ballast at 30% fouling.74
Figure 5.3.21 Top plate tilt during direct shear test 75
Figure 5.4.1 Shear stress versus horizontal displacement of clean ballast 76
Figure 5.4.2 Shear stress versus horizontal displacement of ballast fouled with 20% crushed
ballast fines 77
Figure 5.4.3 Shear stress versus horizontal displacement of ballast fouled with 30% crushed
ballast fines 78
Figure 5.4.4 Shear stress versus horizontal displacement of ballast fouled with 40% crushed
ballast fines 78
Figure 5.4.5 Shear stress versus horizontal displacement of ballast fouled with 50% crushed
ballast fines 79
Figure 5.4.6 Failure envelopes of clean ballast and fouled ballast with crushed ballast fines
79
Figure 5.4.7 Shear stress versus horizontal displacement of ballast fouled with 20% clay 80
Figure 5.4.8 Shear stress versus horizontal displacement of ballast fouled with 30% clay 81
Figure 5.4.9 Shear stress versus horizontal displacement of ballast fouled with 40% clay 81
Page 10
Figure 5.4.10 Shear stress versus horizontal displacement of ballast fouled with 50% clay
82
Figure 5.4.11 Failure envelopes of clean ballast and fouled ballast with clay 82
Figure 5.4.12 Shear stress versus horizontal displacement of ballast fouled with 10% coal dust
83
Figure 5.4.13 Shear stress versus horizontal displacement of ballast fouled with 20% coal dust
84
Figure 5.4.14 Shear stress versus horizontal displacement of ballast fouled with 30% coal dust
84
Figure 5.4.15 Shear stress versus horizontal displacement of ballast fouled with 40% coal dust
85
Figure 5.4.16 Shear stress versus horizontal displacement of ballast fouled with 50% coal dust
85
Figure 5.4.17 Failure envelopes of clean ballast and fouled ballast with coal dust 86
Figure 5.4.18 Comparison of failure envelopes of clean and fouled ballast at 30% fouling.87
Figure 5.5.1 Friction angle versus fouling ratio for each fouling material (large direct shear box)
89
Figure 5.5.2 Friction angle versus fouling ratio for each fouling material (modified box)
89
Figure 5.5.3 Comparison of large direct shear and modified direct shear friction angle versus
fouling ratio for each fouling material 90
Figure 5.6.1 Schematic diagram of resistivity large scale test at depth of 18 inches 93
Figure 5.6.2 Detailed data sheet for resistivity large scale test at depth of 18 inches 93
Page 11
Figure 5.6.3 Schematic diagram of resistivity large scale test at depth of 12 inches 94
Figure 5.6.4 Detailed data sheet for resistivity large scale test at depth of 12 inches 94
Figure 5.6.5 Schematic diagram of resistivity large scale test at depth of 6 inches 95
Figure 5.6.6 Schematic diagram of resistivity large scale test at depth of 6 inches 95
Page 12
List of Tables
Table 2.1 Typical resistivity values of some soils 6
Table 3.1 BNSF specification limits (class 1) 13
Table 3.2 Gradation data for crushed ballast fines 14
Table 3.3 Gradation data for coal dust 16
Table 3.4 Specific gravity of ballast coarse aggregates 19
Table 3.5 Properties of fouling materials 20
Table 3.6 Summary of grain size characteristics of ballast and
fouling materials 20
Table 5.1.1 Hydraulic conductivity values for different fouling ratio of ballast 48
Table 5.1.2 Categories of fouling based on fouling ratio and fouling index 52
Table 5.2.1 Measured resistivity range for each fouling ratio for crushed ballast fines 55
Table 5.2.2 Measured resistivity range for each fouling ratio for clay 56
Table 5.2.3 Measured resistivity range for each fouling ratio for coal dust 56
Table 5.2.4 Comparison of the resistivity of fouled ballast
(crushed ballast fines and clay) at the 18th hour 57
Table 5.5.1 Summary of strength properties for direct shear and modified direct shear box tests
88
Table 5.6.1 Summary of fouled resisitivity with depth 96
List of Abbreviations
Page 13
Ground Penetrating Radar (GPR)
Liquid Limit (LL)
Mid-America Transportation Center (MATC)
Percentage Void Contamination (PVC)
Time Domain Reflectometry (TDR)
Page 14
xiii
Acknowledgments
The author thanks the Mid-America Transportation Center (MATC) for providing
financial support for the research described in this report, and Mr. Hank Lees of BNSF for
providing material and technical support for this research. We also thank the many individuals
who contributed to the completion of this research, including, Mr. Johnathon Crank, Miss.
Jennifer Penfield, Mr. Jitendra Thakur, Mr. Deep Khatri, Mr. Raju Acharya and especially Mr.
Jim Weaver and Mr. Matthew Maksimowicz for their help in with the physical testing.
Page 15
xiv
Abstract
Ballasted tracks are the most common tracks used in the railroad industry and are
designed to provide a stable, safe, and efficient rail foundation. A ballasted track consists of
superstructure (ties, fasteners, and rails) and substructure (ballast, sub-ballast, and subgrade
layers). The main functions of ballast are to support the superstructure by distributing the loads
from the moving train, and to provide lateral resistance to tie movement and drainage. However,
ballast deterioration and fouling are major issues in the railroad industry, and can be caused by
repeated loadings, which lead to crushing ballast that is in contact with ties. Upward migration of
subgrade particles into the ballast layer can increase fouling in the ballast and decrease drainage
through the ballast layer. There is a need for methods to easily and inexpensively identify areas
that have fouled ballast. The objective of this preliminary study was to evaluate the potential for
estimating the level of fouling in a ballast layer by soil resistivity and permeability tests to be
followed by a second study. A test box was designed and fabricated at the lab at the University
of Kansas to perform the constant head permeability test and soil resistivity tests. Constant head
tests were conducted to determine the coefficient of permeability of fouled ballast for different
fouling percentages. Soil resistivity tests were also conducted using the Wenner method (4 points
method) to determine the resistivity of ballast for different fouling ratios. The tests showed a
relationship between the fouling ratio and ballast resistivity. The resistance of the ballast layer
decreased as the fouling ratio increased due to the presence of water. Fouled material retained
water and filled the voids between the ballast particles, and therefore decreased resistivity in the
ballast layer. The permeability (hydraulic conductivity) also decreased as the fouling ratio
increased due to the presence of fine particles between the ballast particles; therefore,
permeability and resistivity were also correlated. The strength properties of clean and fouled
Page 16
xv
ballast were also evaluated using large direct shear box and modified direct shear box (extension
in height for the large direct shear box). Three type of fouling materials were tested (crushed
ballast fines, clay and coal dust) at different fouling ratios by dry weight of ballast. Test results
showed that as fouling ratio increased, strength of ballast decreased for both set of tests (large
direct shear and modified direct shear). Moreover, samples fouled with coal dust with more than
10% showed a significant decrease in strength properties. Also, samples fouled with clay showed
a significant strength reduction at about 40% fouling. A large scale sample of heavily fouled
ballast was constructed and tested under wet conditions. The four point Wenner method was
used to measure resistivity at depths of eighteen inches, twelve inches and six inches. The results
show that as the depth increased, resistivity increased. The higher resistivites at greater depths
were interpreted to be representative of drier material, while the near suface material had a lower
resistivity due to the addition of water to the surface.
Page 17
1
Chapter 1 Introduction
A rail track structure is designed to provide a stable, safe, and efficient path for trains to
operate at high speeds while transporting substantial loads. Ballasted track is the most common
type of rail structure used throughout the world due to its relatively low cost of construction and
maintenance (Indraratna 2006). A ballasted track system usually consists of a superstructure
(ties, fasteners and rails), and substructure (ballast, sub-ballast and subgrade layers, (Indraratna
2011). Ballast consists of uniformly graded coarse aggregate placed between the cross ties and
subgrade (Huang 2009). The main functions of railroad ballast are to support the superstructure
by distributing the loads from the moving train to provide lateral resistance, and to facilitate
drainage. The physical properties of high quality ballast can be classified by its angularity of
particles, high toughness, high resistance to weathering, rough surface, high specific gravity, and
shear strength (Huang 2009).
Ballast deterioration and fouling are major issues in the railroad industry, and can be
caused from repeated dynamic loading, vibration, temperature, and the presence of water.
Fouling is caused by breakage of the ballast aggregate, spillage of coal dust from moving trains,
and the migration of subgrade particles. As the fouling ratio in the ballast and sub-ballast layers
increases, more water is retained by the fouled layers, resulting in track instability due to the
buildup of pore water pressure, as well as alignment problems. Detection of the fouling ratio in
ballast has been a challenging task for maintenance units, especially if the drainage capacity
varies significantly beneath the track with location. Track maintenance divisions need to have a
system for scheduling maintenance when needed in order to maintain safe operation and traffic
flow.
Page 18
2
The objective of this study was to obtain a proper understanding of the fouling of ballast
caused by various types of fines, and its implications on track drainage, which can affect track
maintenance operations. Additionally, this study sought to determine the feasibility of evaluating
the fouling ratio in railroad ballast by measuring the resistivity in the ballast and sub-ballast layer
and finding a correlation between ballast permeability and resistivity. Also, determine the
strength properties of fouled ballast at different fouling ratios. Tests included three main sources
of fouling: internal ballast crushing, fine particles migrating from subgrade and coal dust. A
relationship between the resistivity of ballast and fouling ratio was observed.
Page 19
3
Chapter 2 Literature Review
2.1 Effects of Fouled Ballast
As ballast ages, it becomes progressively fouled with fine material filling the voids
between coarse particles. Several research studies report that around 70% of fouling material
results from ballast aggregate breakage (Huang 2009). Selig and Waters showed that about 76%
of ballast fouling is caused by ballast breakdown, 13% by infiltration from sub-ballast, 7% by
infiltration from the ballast surface, 3% from subgrade intrusion, and 1% is related to tie wear
(Selig 1994).
Raymond reported that the liquid limit (LL) of fine particles in the ballast layer should be less
than 35 to function as a drainable layer; also showing that aggregate breakdown is mainly
influenced by the physical properties of the mineral aggregate (Raymond 1978).
According to (Indraratna 2011), under saturated conditions water and fine particles mix to form
slurry and will migrate to the sub-ballast and ballast layer. This migration can fill voids within
coarse aggregates and decrease drainage, which may lead to ballast degradation and may cause
serviceability problems with the superstructure. Ballast is designed to be a free drainage material
with particle sizes ranging from 0.5 to 2.5 inches; however, the infiltration of fouling material
reduces the void spaces and restricts drainage. Specifications for the gradation of ballast require
a uniform gradation with a uniformity coefficient between 1.5 and 3. Fouling materials can have
variable specific gravity, void ratio, and gradation, which will result in changing the
characteristics of the ballast layer (Huang 2009). In a study conducted by Wallace, an increase in
the percentage of fines resulted in a decrease in hydraulic conductivity and decreased the
drainage capacity of ballast; the results of the study showed that sand did not impact the
Page 20
4
permeability of ballast significantly; however, clay and silt caused a significant reduction on
permeability of ballast (Wallace 2003). When ballast is not functioning correctly the strength of
the track structure may be inadequate and thus track stability may become compromised. The
ballast particles must resist the vertical forces applied on the track and provide lateral stability,
and the load is transferred by the inter-particle contact between adjacent ballast particles.
However, fouling material fills up the voids between particles which can reduce strength and
hydraulic conductivity of the ballast layer. The fouling material can reduce the friction angle at
inter-particle contact points which reduces the strength and can cause instability of track
structure. Furthermore, past studies on the effects of fouled ballast on drainage showed that
drainage is significantly reduced when the fouling index is 30 or greater. The author suggested
using new technologies to evaluate the ballast condition to reduce the risk of sudden failure
(Sussmann 2012).
Moreover, a study conducted by Chiang showed that ballast settlement increased with the
percentage fouling in ballast (Chiang 1989). Han and Selig conducted a similar study where the
results showed that the degree of ballast fouling had a significant impact on ballast settlement
(Han 1997). A study was presented by the University of Illinois with an assessment of the effects
of different fouling agents on railroad ballast strength. A set of strength tests using the large
direct shear box was conducted to investigate the strength of clean and fouled ballast by different
agents at various level of fouling. The shear strength properties were related to field ballast
fouling levels to better understand the impact of fouling on track stability. Results of large direct
shear tests showed a trend of decreasing strength with samples fouled with 32% clay and 40% of
mineral filler. Coal dust was particularly problematic with concentrations of more than 15
percent causing a significant reduction in strength (Huang 2009).
Page 21
5
2.2 Soil Resistivity
Resistance is the ratio of applied voltage to the resulting current flow. Resistivity is the
resistance of a conductor, which depends on its atomic structure and behavior of the material.
The commonly used symbol for resistivity is ρ, and is usually measured in ohm-cm. the
resistivity is defined by the following relationship:
ρ = (2.1)
where,
R is resistance in ohms,
A is cross section area in cm,2
and L is length of conductor in cm.
A material with high resistivity is considered to be a bad conductor. Sand, loam, and
crushed stone aggregate have high resistance and are considered to be bad conductors. However,
when water is present, the resistivity decreases and the soil or aggregate will become a
conductor, though still considered to be a poor conductor compared to metals. The resistivity of
soil will be governed by the quantity of water held in the soil. In other words, conductivity of the
soil would be a function of the water retained within the soil.
The main factors which determine resistivity are (Tagg 1964):
1- Type of soil
2- Chemical composition of salts dissolved in the contained water
Page 22
6
3- Moisture content
4- Temperature
5- Grain size of the material and distribution of grain size
6- Closeness of packing and pressure
Table 2.1 Typical resistivity values of some soils (Tagg 1964)
Type of Soil Resistivity in ohm-cm
Loams, garden soil 500 - 5000
Clays 800 – 5000
Clay, sand and gravel mixtures 4000 - 25,000
Sand and gravel 6000 - 10,000
Slates, shale, sandstone 1000 - 50,000
Crystalline rocks 20,000 - 1,000,000
There are several types of soil resistivity measurements that can be used in the field and
also for laboratory testing (soil box testing). According to Tagg, the Wenner-four probe (point)
method is considered to be the most accurate method, although 2 point and 3 point methods may
also be used. The configuration of the Wenner-four probe method consists of four probes placed
at equal distances from each other. A current is sent through the two outer electrodes (probes)
and the voltage is measured between the two inner probes (Tagg 1964). The soil resistance is
determined using Ohm’s law, R = V/I. The following formula is used to determine soil resistivity
in accordance with the Wenner-four probe method:
Page 23
7
ρ = 2π × R × D (2.2)
where,
R= resistance in ohms and D = Distance between probes in cm (AEMC 2012).
Two other soil resistivity measurement methods which can be used to determine the soil
resistivity using AEMC equipment are the two point method and three point method. The two
point method measures the resistance between two points. The 3 point method (Fall-of-Potential)
is used to measure resistance to ground of auxiliary electrodes and grids. The measurement of
ground resistance can only be obtained with specially designed test equipment. Most equipment
uses the Fall-of-Potential voltage of alternating current circulating around auxiliary electrodes
and a ground electrode under test (AEMC 2012).
(Siddiqui 2012) presented correlations of electrical resistivity with soil strength properties
such as internal angle of friction. The study was conducted using field electrical resistivity
survey and laboratory electrical resistivity measurements. Electrical resistivity measurements
were retrieved from boreholes in the field and samples were obtained from the field at different
depths were tested in laboratory. Several laboratory tests were conducted on the field samples
such as moisture content, unit weight, direct shear and electrical resistivity. Field data and
laboratory data were analyzed and results showed strong correlation between electrical resistivity
and angle of internal friction. According to the author, as the angle of internal friction increases,
electrical resistivity increases (Siddiqui 2012).
Page 24
8
2.3 Railroad Ballast Fouling Detection
In order to evaluate the need for maintenance to assure continued safe operations and to
prevent any structure instability or drainage problems, several methods have been introduced to
evaluate the percentage fouling of ballast. Selig and Waters proposed two methods to quantify
the level of ballast fouling. The first method is the fouling index, which is the sum of the percent
by weight of the ballast sample passing the 4.75 mm sieve plus the percent passing the 0.075 mm
sieve. The second method is the fouling ratio, which is the ratio of the dry weight of the material
passing the 9.5 mm sieve to the dry weight of total sample (Selig 1994). Feldman and Nissen
developed the percentage void contamination (PVC) parameter to show the effect of void
decrease in ballast as the ratio between the total volume of re-compacted fouling material
(passing the 9.5 mm sieve) and the void volume between re-compacted ballast aggregates. This
method determines the percentage of voids occupied by fouling material, but the gradation of
fouling particles cannot be taken into account (Han 1997). Another method proposed by
Indraratna is called relative ballast fouling ratio. It is a ratio between the solid volumes of fouling
particles passing a 9.5 mm sieve and ballast particles being retained on a 9.5 mm sieve (Tagg
1964).
Traditionally, a destructive drilling method is used to evaluate the condition of ballast;
however, this method is time consuming (Han 1997). Ground penetrating radar (GPR) has been
used in the past for ballast evaluation. According to (Roberts and Rudy 2006), GPR has been
utilized as a non-disturbing evaluation tool to evaluate railroad ballast and fouling level. GPR
data is obtained on railroad ballast using 2 GHz horn antennas, and provides data that show
significant energy scattering from the void space in the clean ballast. The data from fouled
ballast produce less scattering energy due to fewer void spaces in ballast layer (Han 1997). The
Page 25
9
GPR method has proven to be applicable for determining the percentage fouling in the ballast
and sub-ballast layer; however, more data and ground properties are required to evaluate the
limitations of this methodology (Han 1997). GPR is effective, according to many previous
studies, for evaluating ballast conditions. According to Leng and Al Qadi, there are limitations
that may result in undetected fouling (AEMC 2012). First, the dielectric constant of the railroad
ballast is unknown in many evaluation cases. Another limitation with the GPR method is that the
signal reflection can only detect an interface where there is a significant difference in dielectric
contrast properties, even though the gradation of ballast changes with depth and there may not be
a clear interface between fouled and clean ballast. Therefore, GPR may not be able to detect
fouled ballast under certain conditions, which may lead to unreliable results (AEMC 2012).
Moreover, as the fouling level increases in a ballast layer, the reflection becomes less
defined and data will be difficult to interpret. Overall, GPR studies illustrate the difficulty of data
interpretation and the data are sensitive to the water content in fouled ballast (Ebrahimi 2008).
Another study conducted by (Ebrahimi 2008) contained adscription of a method for
detecting and quantifying the fouling content by electromagnetic surveys and visual observation
through boreholes. A small scale study was conducted using time domain reflectometry (TDR) to
evaluate the change of electromagnetic parameters in detecting fouling content. The study
focused on characterizing the EM parameters of two main sources of fouled ballast, deteriorated
ballast and coal dust, using the TDR methodology to assess the percentage fouling and moisture
content. The test results showed that an increase in water content of the fouling material from 5
to 10% increased the electrical conductivity of ballast from 10 to 24mS/m. Ebrahimi’s study also
showed that the fouling content and water content increased the plastic deformation of the track
(Ebrahimi 2008).
Page 26
10
(Anbazhagan 2011) attempted to identify ballast fouling in the field using a multichannel
analysis of subsurface wave (MASW) on a model track and a field track. The tests were
performed on clean and fouled ballast and track subsurface. Results of the study show that shear
wave velocity (SWV) increases when fouling increases until it reaches a maximum level before
decreasing. He observed that SWV reached a maximum at 15% fouling with coal dust and 25%
fouling with clay. Fouled ballast with coal dust reaches the critical fouling point before clayey
sand fouled ballast. Since fouling of ballast reduces the drainage, a plot of permeability and
SWV with fouling ratios shows that for fouling percentages above the critical fouling point,
drainage capacity decreases significantly below acceptable limits (Anbazhagan 2011).
Page 27
11
Chapter 3 Material Testing
This chapter contains descriptions of the railroad ballast, crushed ballast, clay and coal
dust, and the methods used to characterize them. The proposed tests ensure that the material meet
the requirements to be used in the field.
3.1 Material
The railroad ballast material was provided by BNSF and was excavated from track
undergoing maintenance in Gardner, Kansas. The coal dust was also provided by BNSF from
undercut material from line milepost 61.This material was characterized during a previous
project (Jowkar 2013). Several tests were conducted to determine the properties of ballast,
crushed ballast, clay and coal dust in the soils lab at the University of Kansas.
3.1.1 Gradation of Ballast
The ballast coarse aggregates were separated by conducting a sieve analysis test, where
the distribution of particle size was determined. Ballast aggregates were sieved with a sieve
shaker provided by BNSF, as shown in figure 3.1. Separation was achieved from retained
particles of different sieve sizes starting at 2.5 in. opening and ending at 0.5. in. The results of
this test were plotted on a graph as shown in figure 3.2, and the following parameters were
determined: the maximum size, minimum size, coefficient of curvature, and coefficient of
uniformity of ballast aggregates. The results were used to determine compliance of the particle
size distribution with applicable specifications requirements provided by BNSF (table 3.1).
Page 28
12
Figure 3.1 Sieve shaker (Jowkar 2013)
Figure 3.2 Gradation curves of the ballast aggregates (Jowkar 2013)
0%
10%
20%
30%
40%
50%
60%
70%
80%
90%
100%0.10 1.00 10.00
Per
cen
t P
ass
ing
Sieve Size(in)
Ku gradation after seive Upper bound of BNSF Specification
Lower bound of BNSF Specification
Page 29
13
Table 3.1 BNSF specification limits class 1 (Jowkar 2013)
Sieve Analysis (ASTM C 136)
Sieve Size BNSF Specification Limits (Class 1)
2.5" 100
2" 90-100
1.5" 50-80
1" 10-35
0.75" 0-10
0.5” 0-5
3.1.2 Gradation of Crushed Ballast Fines
The ballast fine aggregates were separated by sieve analysis, where the distribution of
particle size was determined by sieving. This test separated the particles by their size. Separation
was achieved for retained particles of different sieve sizes starting at 4.75 mm opening and
ending at 0.075 mm, in accordance with ASTM D5444-08. The results of this test are plotted in
figure 3.3. The maximum size, mean size, coefficient of curvature, and coefficient of uniformity
of crushed ballast particles were found to be 9.5 mm, 1.7 mm, 0.959, and 7.19, respectively.
Page 30
14
Table 3.2 Gradation data for crushed ballast fines
Figure 3.3 Gradation curve of the crushed ballast fines
3.1.3 Gradation of Clay
0
10
20
30
40
50
60
70
80
90
0.01 0.1 1 10
Per
cen
t F
iner
, (%
)
Grain- Size, (mm)
Sieve
No.
Size
Opening
(mm)
Mass Clean
Sieve, Ms (g)
Mass Sieve
and Soil,
Mss (g)
Mass
Retained,
Mn (g)
% of
mass
retained
Cumulative
%
Retained
%
Finer
4 4.75 498.77 734.87 236.1 18.4 18.4 81.6
8 2.36 477.94 736.24 258.3 20.1 38.5 61.5
16 1.18 442 726.56 284.56 22.1 60.6 39.4
30 0.6 400.56 626.53 225.97 17.6 78.2 21.8
50 0.3 368.33 533.3 164.97 12.8 91.0 9.0
100 0.15 341 411.8 70.8 5.5 96.6 3.4
200 0.075 326.24 352.4 26.16 2.0 98.6 1.4
Pan 496.07 512.87 16.8 1.4 100.0 0.0
Page 31
15
The grain size distribution of the clay used as fouling material was determined by
hydrometer analysis in accordance with ASTM D22.2703-1. The grain size distribution chart of
the clay is shown in figure 3.4.
Figure 3.4 Gradation curve of clay
3.1.4 Gradation of Coal Dust
The grain size distribution of the coal dust used as fouling material was determined by
sieve analysis in accordance with ASTM D22.2703-1. The grain size distribution chart of the
coal dust is shown in figure 3.5.
0
10
20
30
40
50
60
70
80
90
0.001 0.010 0.100 1.000
Per
cen
t F
iner
Grain-Size (mm)
Page 32
16
Table 3.3 Gradation data for coal dust
Sieve No. Size Opening
(mm)
Mass
Clean
Sieve, Ms
(g)
Mass
Sieve and
Soil, Mss
(g)
Mass
Retained,
Mn (g)
% of
mass
retained
Cumulative
%
Retained
%
Finer
4 4.75 498 502 4 0.48 0.5 99.5
8 2.36 478 534 56 6.71 7.2 92.8
16 1.18 442 696 254 30.4 37.6 62.4
30 0.6 414 628 214 25.6 63.3 36.7
50 0.3 364 512 148 17.7 81.1 18.9
100 0.15 340 420 80 9.60 90.6 9.4
200 0.075 322 360 38 4.56 95.2 4.8
Pan
354 394 40 4.80 100.0 0.0
Figure 3.5 Gradation curve of coal dust
0
10
20
30
40
50
60
70
80
90
100
0.01 0.1 1 10
Per
cen
t F
iner
(%
)
Grain-Size (mm)
Page 33
17
Figure 3.6 Comparison of gradation curves for fouling materials
0
10
20
30
40
50
60
70
80
90
100
0.001 0.01 0.1 1 10
Per
cen
t F
iner
(%
)
Grain-Size (mm)
Coal dust Crushed ballast Clay
Page 34
18
3.1.5 Specific Gravity and Absorption of Ballast Coarse Aggregates
This test method determines the average density of a quantity of coarse aggregate
particles, the specific gravity, and the absorption of coarse aggregates. A sample of aggregates is
immersed in water for 24 hours to essentially fill the pores. Then the sample is weighed after it is
removed from the water and the surfaces of the particles are towel dried. Next, the sample is
submerged in water and weighed. Finally, the sample is oven-dried and weighed for final dry
mass. Using the mass values and the formulas provided by the test method will result in
obtaining the specific gravity and absorption of the aggregate. This test method was performed in
accordance with ASTM C127. Pictures of the test are shown in figures 3.7 through 3.9. Specific
gravity was used in calculating void content of aggregates and volume weight conversion. Table
3.4 shows the specific gravity of the ballast coarse aggregates.
Figure 3.8 Ballast aggregates in SSD condition Figure 3.7 Ballast aggregates immersed in water
Page 35
19
Table 3.4 Specific gravities of ballast coarse aggregates
Bulk Specific Gravity 2.72
SSD Bulk Specific Gravity 2.74
Apparent Specific Gravity 2.76
Absorption 0.54%
3.1.6 Specific Gravity of Crushed Ballast Aggregates
The specific gravity of crushed ballast was determined by the specific gravity of soil
solids by water pycnometer test in accordance with ASTM D854-06. The specific gravity was
determined to be 2.61.
Figure 3.9 Wire basket and scale used to measure weight of aggregates when submerged in water
Page 36
20
3.1.7 Specific Gravity of Clay
The specific gravity of the clay was determined using the specific gravity of soil solids by
water pycnometer test, in accordance with ASTM D854-06. The specific gravity was determined
to be 2.74.
3.2 Summary
The properties of the ballast and fouling materials are shown in tables 3.5 and 3.6.
Table 3.5 Properties of fouling materials
Fouling Material LL (%) PL (%) Specific
Gravity Passing No.
200 Sieve (%) Crushed Ballast NA NA 2.61 1.4
Clay 52 31 2.74 73
Coal Dust NA NA 1.54 4.8
Table 3.6 Summary of grain size characteristics of ballast and fouling material
D50 (mm) Dmax (mm) Cc Cu
Ballast 33 63.5 0.89 2
Crushed Ballast 1.7 9.5 0.959 7.19
Clay 0.075 0.1 NA NA
Coal Dust 1.2 4.75 1.14 7.35
Page 37
21
Chapter 4 Test Setup and Instrumentation
This section includes descriptions of the test setups used for examining the permeability,
resistivity and strength of fouled ballast. Three sets of tests were performed; one using crushed
ballast as the fouling material, one using clay, and one using coal dust. Different masses of each
material added to the ballast during each set of tests.
4.1 Permeability and Resistivity Test Setup and Instrumentation
For each fouling material four tests were conducted to examine the permeability and
resistivity at different fouling levels. Constant head permeability tests were conducted in a test
box designed for that purpose to determine the hydraulic conductivity of the sample. The same
sample was then tested for resistivity with respect to time using a resistivity meter in accordance
with the Wenner 4 point method. The box was designed and fabricated at the geotechnical
laboratory at the KU Civil, Environmental, and Architectural Engineering (CEAE) Department.
The outside dimensions of the box were 42 in. x 29 in. x 28 in. and the inside dimensions were
39 in. x 26 in. x 22 in.. Two layers of plastic support were placed at the bottom of the box and
wrapped with fiberglass screen to prevent fines from going through, as shown in figure 4.1.1.
The height of a typical sample was approximately 12 in.. The front of the box was cut and
replaced with a clear glass wall to permit visual observation, as shown in figures 4.1.2 and 4.1.3.
A 2 in. pipe and valve were installed at the bottom of the box, which were used to fill the box
with water and drain water out after the test. A 2 in. pipe was also installed at the back side of the
box near the top to allow a constant water outflow. A 1 in. diameter plastic standpipe was also
clamped and suspended freely beneath the fiberglass screen, used to measure the water level in
the box during a test. Two sheets of aluminum were attached to the side walls of the box and two
copper rods were held by clamps at equal distances of 13 in. from the side wall of the box, as
Page 38
22
shown in figure 4.1.4. The soil resistivity meter measured the resistivity within the sample by
connecting all four electrodes to the meter. A schematic diagram of the final setup is shown in
figures 4.1.5 and 4.1.6. Figure 4.1.7 shows an actual test sample.
Figure 4.1.1 Plastic support and fiber glass screen
Page 39
23
Figure 4.1.2 Cut front wall of the box and place the glass wall
Figure 4.1.3 Secure and seal glass wall
Page 40
24
Figure 4.1.4 Aluminum sheets and copper rods spaced equally
Figure 4.1.5 Schematic diagram for the setup of the test
Copper rods Aluminum sheet Aluminum sheet
Page 41
25
Figure 4.1.6 Schematic diagram for the setup of the test with dimensions
Figure 4.1.7 Picture of actual test setup
Page 42
26
4.2 Permeability and Resistivity Test Procedure
This section contains a description of the procedures followed for both the permeability
and resistivity tests. First, the box was washed after every test to clean the residue from the
previous test. The copper rods, aluminum sheets, standpipe, and screen were also cleaned before
setting up for the next test. Then the fiberglass screen was fastened securely on the plastic
support and around the corners of the box to prevent fines from migrating around the screen,
which was necessary to obtain accurate results for the resistivity test. The box was then checked
for level to make sure it was standing on a flat surface. Then, the sample, which consisted of
ballast and the fouling material, was added to the box layers and spread out uniformly around the
box. The sample was then compacted by tapping the walls of the box with a rubber mallet. The
hose was connected to the inflow pipe at the bottom of the box and water was introduced into the
sample. A steady state flow condition (constant head) was established as water entered the lower
reservoir, passed upward through the sample and into the upper reservoir, and exited through the
outflow port. Water was collected from the upper reservoir (outflow) for a measured time period,
and the mass and time were recorded. This procedure was repeated twice more before constant
head flow was calculated. Constant head flow, Q, was determined by the following equation:
w
w
tM
Q
(4.1)
where,
Mw = weight of water collected (g)
t = measured time period (s)
ρw = density of water, use 1 g/cm.3
Page 43
27
For each test the height of the water rise was measured in the standpipe relative to the
water level in the sample. Hydraulic conductivity was determined by the following equation:
AQLh
k
(4.2)
where,
L = length of sample (cm)
A= area of sample (cm2)
Δh = height of water rise in the standpipe.
The electrodes were then connected to the resistivity meter in order to take resistance
readings, in accordance with the Wenner 4 point method, as the water drained out from the
bottom pipe. The aluminum sheet on the east wall of the box was connected to X in the
resistivity meter, the first copper rod was connected to Xv, the second copper rod was connected
to Y, and the aluminum sheet on the west wall of the box was connected to Z. The four
electrodes were set at equal distances from each other. A current was then passed through the
outer electrodes, and the voltage between the two copper rods was measured. The soil resistance
was measured by the resistivity meter, and the resistivity of the sample, ρ, was determined using
equation 4.3. Time was recorded for each reading taken up to 24 hours.
ρ = 2π × R × A (4.3)
Page 44
28
Figures 4.2.1 through 4.2.14 present different steps taken to prepare the test:
Figure 4.2.1 Washing the box prior to testing
Figure 4.2.3 Verify box is level Figure 4.2.4 Tap sides of the wall to compact sample
Figure 4.2.2 Screen wrapped around support
Page 45
29
Figure 4.2.5. First layer of ballast mixed with fouling material
Page 46
30
Figure 4.2.6 Box filled with sample and ready for test
Page 47
31
Figure 4.2.7 Flooding the sample with water through the bottom pipe
Page 48
32
Figure 4.2.8 Water rise in standpipe relative to water level in sample
Figure 4.2.9 Close picture of height of water in standpipe
Page 49
33
Figure 4.2.10 Constant head flow exiting the outflow pipe
Figure 4.2.11 Collect water for a certain time period
Page 50
34
Figure 4.2.13 Aluminum sheets and copper rods connected to resistivity meter
Figure 4.2.12 Verify draining water is clean (no loss of fines)
Page 51
35
Figure 4.2.14 Measure resistance in sample
Page 52
36
4.3 Large Direct Shear Box Test Setup and Instrumentation
Direct shear strength tests were performed on clean and fouled ballast. The first sets of
tests were conducted in a large direct shear box in the geotechnical laboratory at the KU Civil,
Environmental, and Architectural Engineering (CEAE) Department. The inside dimensions of
the top box were 305mm x 305mm x 102mm (12 in. x 12 in. x 4 in.) and the bottom box
dimensions were 406mm x 305mm x 102mm (16 in. x 12 in. x 4 in.). The normal pressure was
applied by a cylinder (140 mm inside diameter) on a steel plate (305 mm x 305mm x 25mm).
Equivalent normal pressures were calculated based on the area conversion from the cylinder to
top plate. The vertical normal load was controlled by a pressure gauge that is connected to an air
compressor. Horizontal load cell and displacement gauge were connected to an automatic data
acquisition system that was controlled by the user on a personal computer. Figure 4.3.1 through
4.3.4 shows the whole setup of the large direct shear test.
Page 53
37
Figure 4.3.1 Large direct shear box
Page 54
38
Figure 4.3.3 Test monitor
Figure 4.3.2 Pressure gauge and display Figure 4.3.4 Cylinder and top plate
Page 55
39
4.4 Direct Shear Test Procedure
Samples were prepared in four layers, two in the bottom box and then another two layers
after the top box was placed. The weight of ballast was recorded for each layer and then the
weight of fouling material to be added was calculated based on the fouling ratio tested. The
fouling material was spread on top of the clean aggregates on each layer, this method was
adopted from a study performed by (Huang 2009) were coal dust was spread on top of ballast to
simulate field conditions. The top box was then fixed in place and the loading plate was placed
on top of the sample. The loading frame was then assembled on top of the top box. The air
supply was opened and the equivalent normal pressure was set using the pressure gauge. The
loading rate was set to 5.1 mm/min (0.2 in./min), and maximum horizontal displacement was set
to 15% strain. The load cell and displacement gauges were initiated at the large direct shear box
and the data acquisition software. The software was set to record shear force and horizontal
displacement. Figures 4.4.1 through 4.4.3 show the test preparation and setup.
Page 56
40
Figure 4.4.1 Bottom box (ballast and clay fines) Figure 4.4.2 Top box fixed
Figure 4.4.3 Loading frame assembled and air supply connected
Page 57
41
4.5 Modified Direct Shear Test Setup and Instrumentation
The same set of strength tests were performed using a modified direct shear box. The
modification included an extension to the bottom box and a new top box. The inside dimensions
of the top box were 305mm x 305mm x 153mm (12 in. x 12 in. x 6 in.) and the bottom box
dimensions were 406mm x 305mm x 153mm (16 in. x 12 in. x 6 in.). The same loading setup
and instrumentation were used for this test as in the large direct shear box test mentioned in
section 4.3. Figures 4.5.1 through 4.5.4 show pictures of the modified box after assembly and
sample preparation.
4.6 Modified Direct Shear Test Procedure
The same sample preparation steps mentioned in section 4.3 were performed with the
modified direct shear box. However, two more layers were added since the overall volume has
increased.
Figure 4.5.1 Installing box extension to bottom box
Page 58
42
Figure 4.5.2 Modified direct shear box
Figure 4.5.3 Modified direct shear box with clean ballast
Page 59
43
Figure 4.5.4 Modified direct shear box setup
Page 60
44
4.7 Large Scale Resistivity Test on Fouled Ballast
Three tests were performed on a large scale pad of fouled ballast at different depths. The
pad had a length of ten feet, a width of five feet and height of three feet. The sample was
prepared by adding fouled ballast and compacted in six inches layers. The pad contained ballast
and crushed ballast fines. Prior to testing water was added to the sample using a garden hose for
about five minutes. A wooden board with pre-drilled holes was placed on top of the sample and
four copper rods were inserted into the sample at specified spacing. Figure 4.7.1 through 4.7.5
show the sample preparation and setup.
Figure 4.7.1 Schematic diagram of the setup of the test
Page 61
45
Figure 4.7.2 Sample of fouled ballast
Figure 4.7.3 Spraying water on top of sample
Page 62
46
Figure 4.7.4 Resistivity four point test setup
Figure 4.7.5 Measure resistance in sample
Page 63
47
Chapter 5 Results and Discussion
5.1 Permeability Test Data
Four constant head permeability tests were conducted for each fouling material. Samples
were prepared at 20, 30, 40, and 50 fouling ratio. According to (Selig and Waters 1994), the
Fouling ratio is the ratio of the dry weight of fouled material passing the 9.5mm sieve to the
weight of dry ballast. Figures 5.1.1 and 5.1.2 show the relationship of hydraulic conductivity
with fouling ratio for crushed ballast fines , coal dust and clay on an arithmetic and logarithmic
scale. The hydraulic conductivity was calculated using equation (4.2), and the results are
presented in table 5.1.1.
Figure 5.1.1 Measured hydraulic conductivity versus fouling ratio for crushed ballast fines, clay and coal dust
0
0.5
1
1.5
2
2.5
0 10 20 30 40 50 60
Hy
dra
uli
c C
on
du
ctiv
ity
, k
(cm
/s)
Fouling ratio (%)
Crushed Ballast fines Clay Coal dust
Page 64
48
Figure 5.1.2 Measured hydraulic conductivity (log scale) versus fouling ratio for crushed ballast fines, clay and coal dust
Table 5.1.1 Hydraulic conductivity values for different fouling ratios for fouling materials
Permeability Test
Fouling ratio
Hydraulic
conductivity with
crushed ballast, k
(cm/s)
Hydraulic
conductivity with
clay, k (cm/s)
Hydraulic
conductivity with
coal dust, k (cm/s)
10% NA NA 0.490 20% 2.33 0.63 0.111 30% 1.05 0.179 0.0964 40% 0.379 0.0809 0.0871 50% 0.175 0.0611 0.0541
0.01
0.1
1
10
0 10 20 30 40 50 60
Hy
dra
uli
c co
nd
uct
ivit
y, k
(cm
/s)
Fouling ratio (%)
Crushed Ballast fines Clay Coal dust
Page 65
49
The relationships between permeability and fouling ratio are shown in table 5.1.1 and
figure 5.1.1. The results confirm that permeability decreases substantially when the fouling ratio
increases as fines fill up the voids between ballast coarse aggregate particles and restrict flow.
Figures 5.1.1 and 5.1.2 show a sharp decrease in permeability as the fouling ratio increased for
all fouling materials, with permeability for the ballast fouled with clay or coal dust consistently
below that of ballast fouled with crushed ballast particles. Size distribution played a major role in
the comparison between crushed ballast and clay particles. The clay grain size distribution curve
shows that more 50% of the clay particles passed the No. 200 sieve compared to 1.4% of crushed
ballast particles. Specific gravity is a major factor as coal dust has a low specific gravity
compared to crushed ballast fines and clay, therefore, more coal dust particles are present in
samples fouled with coal dust as compared with clay and crushed ballast fines.
For the 40% and 50% coal dust fouled ballast, the samples experienced a significant loss
of material due to the light weight of coal dust particles. Figure 5.1.3 shows a close up picture of
the change of height in the sample after water was let out. A layer of geotextile was placed on
top of the sample to minimize material loss and the effect of geotextile on permeability was
assumed to be negligible. Figures 5.1.4 shows a picture of the sample with geotextile placed on
top after box was filled with water and figure 5.1.5 shows a picture of clean water flowing out.
Page 66
50
Figure 5.1.3 Close up picture of material loss after sample is filled with water
Figure 5.1.4 Geotextile placed on top of sample Figure 5.1.5 Clean water flow out of
pipe
Page 67
51
Figure 5.1.6 presents the hydraulic conductivity versus fouling index of fouled ballast.
The fouling index was proposed by (Selig and Waters 1994) and is represented by the sum of the
percentages that passed the No. 4 sieve and the No. 200 sieve. The fines that passed the No. 200
sieve are accounted for twice in this index due to the significance of the size of fine particles in
decreasing the drainage capacity. Plotting of fouling using the fouling index resulted in similar
hydraulic conductivity values for different materials with the same fouling index. The fouling
index adjusts for the different grain size distribution, and was therefore less dependent on fouling
material type. Also, percentage of fouling can be calculated using the fouling ratio to define the
level of fouling of the ballast. Fouling ratio is equal to ratio of percentage fouling to one minus
percentage fouling.
According to (Indraratna 2006), and as shown in table 5.1.2, the ballast layers are
considered highly fouled when the fouling ratio is greater than 50%, or the fouling index is
40%or greater.
Page 68
52
Figure 5.1.6 Hydraulic conductivity (log scale) versus fouling index of fouled ballast
Table 5.1.2 Categories of fouling based on fouling ratio and fouling index (Indraratna, 2006)
Category Fouling ratio (%) Percentage of fouling
(%)
Fouling Index (Selig
and Waters) (%)
Clean < 2 < 2 < 1
Moderately clean 2 to < 10 2 to < 9.5 1 to < 10
Moderately fouled 10 to < 20 9.5 to < 17.5 10 to < 20
Fouled 20 to < 50 17.5 to < 34 20 to < 40 Highly fouled ≥ 50 ≥ 34 ≥ 40
0.01
0.1
1
10
0 10 20 30 40 50 60 70 80
Hy
dra
uli
c co
nd
uct
ivit
y, k
(cm
/s)
Fouling Index
Crushed Ballast (FI) Clay (FI) Coal dust (FI)
Page 69
53
5.2 Resistivity Test Data
For each sample, a resistivity test was conducted at different time intervals up to 24
hours. As the water drained out of the sample, resistance readings were taken at recorded time
periods to develop a resistivity range for each fouling material and the fouling ratio. Figures
5.2.1, 5.2.2 and 5.2.3 show the relationship of resistivity of fouled ballast (crushed ballast, clay
and coal dust) with time at 20, 30, 40 and 50 fouling ratio. An additional test of 10% fouled
ballast with coal dust was also conducted. Also, tables 5.2.1, 5.2.2 and 5.2.3 show the resistivity
range for each fouling ratio of crushed ballast fines, clay, and coal dust. Figure 5.2.4 shows the
resistivity for each test at the 18th hour measurement. Table 5.2.4 shows the actual resistivity
measurement comparison for the fouled ballast with crushed ballast fines , clay and coal dust at
the 18th hour. Figure 5.2.5 shows the hydraulic conductivity and resistivity plotted versus the
fouling ratio.
Page 70
54
Figure 5.2.1 Measured resistivity of fouled ballast (crushed ballast fines) versus time (log scale) at different fouling ratio
Figure 5.2.2 Measured resistivity of fouled ballast (clay) versus time (log scale) at different fouling ratio
0
10000
20000
30000
40000
50000
60000
70000
80000
90000
1 10 100 1000 10000
Res
isti
vit
y (
oh
ms-
cm)
Time(min)
20% fouled 30% fouled 40% Fouled 50% fouled
7000
9000
11000
13000
15000
17000
19000
21000
23000
25000
1 10 100 1000 10000
Res
isti
vit
y (
oh
ms-
cm)
Time (min)
20% fouled 30% fouled 40% fouled 50% fouled
Page 71
55
Figure 5.2.3 Measured resistivity of fouled ballast (coal dust) versus time (log scale) at different fouling ratio
Table 5.2.1 Measured resistivity range for each fouling ratio for crushed ballast fines
Crushed Ballast
Fouling ratio Resistivity (ohms-cm) Range
20% 42,000 - 80,000
30% 32,000 - 42,000
40% 12,000 - 20,000
50% 8,000 - 12,000
0
5000
10000
15000
20000
25000
30000
35000
40000
45000
50000
1 10 100 1000 10000
Res
isti
vit
y (
oh
ms-
cm)
Time (min)
10% fouled 20% fouled 30% fouled 40% fouled 50% fouled
Page 72
56
Table 5.2.2 Measured resistivity range for each fouling ratio for clay
Clay
Fouling ratio Resistivity (ohms-cm) Range
20% 20,000 - 24,000
30% 15,000 - 20,000
40% 11,000 - 15,000
50% 8,000 - 9,000
Table 5.2.3 Measured resistivity range for each fouling ratio for coal dust
Coal Dust
Fouling ratio Resistivity (ohms-cm) Range
10% 27,000 – 46,000
20% 16,000 - 26,000
30% 12,000 - 16,700
40% 7,800 - 12,000
50% 6,000 – 8,000
Page 73
57
Figure 5.2.4 Measured resistivity of fouled ballast at the 18th hour versus fouling ratio
Table 5.2.4 Comparison of the resistivity of fouled ballast (crushed ballast fines, clay and coal dust) at the 18th hour
Resistivity (ohms- cm)
Fouling ratio Crushed ballast Clay Coal dust
10% NA NA 40,000
20% 73,000 23,630 26,000
30% 40,500 19,202 15,800
40% 18,000 14,375 11,500
50% 11,000 8,500 8,000
0
10000
20000
30000
40000
50000
60000
70000
80000
0 10 20 30 40 50 60
Res
isti
vit
y (
oh
ms-
cm)
Fouling ratio (%)
Crushed Ballast Fines Clay Coal dust
Page 74
58
Figure 5.2.5 Comparison between measured hydraulic conductivity and resistivity at 18th hour versus fouling ratio
The values of resistivity of fouled ballast are plotted against time in figures 5.2.1, 5.2.2
and 5.2.3 for different fouling ratios with crushed ballast, clay and coal dust. As expected, the
resistivity decreased as the fouling ratio increased. Values of resistivity decreased due to the
increase in the amount of water retained as the fouling ratio increased. As evident in figures
5.2.1, 5.2.2 and 5.2.3, resistivity values were measured at short time intervals. The resistivity
increased rapidly as the water drained out of the sample before stabilizing after few hours. A
final reading was taken 23 hours after the sample had the opportunity to drain, which resulted in
the high value shown at the end of each curve in figures 5.2.1, 5.2.2 and 5.2.3. However, as the
0
10000
20000
30000
40000
50000
60000
70000
80000
0
0.5
1
1.5
2
2.5
0 10 20 30 40 50 60
Res
isti
vti
y (
oh
ms-
cm)
Hyd
rau
lic
Con
du
ctiv
ity, k
(cm
.s)
Fouling Ratio (%)
Crushed Ballast Fines (HydraulicConductivity)Clay (Hydraulic Conductivity)
Coal dust (HydraulicConductivity)Crushed Ballast Fines (Resistivity)
Clay (Resistivity)
Coal dust (Resistivity)
Page 75
59
fouling ratio increased, the resistivity values also increased to a lesser extent during the early
times as the water drained out. This was due to a decrease in the rate of drainage, as shown in
figure 5.2.1, for 40% and 50% fouling in the ballast. In addition, the reading taken after 23 hours
for the samples with 40% and 50% fouling increased to a lesser extent compared with the
samples with 20% and 30% fouling.
Moreover, the results of the resistivity test are consistent with the permeability trends,
since the resistivity drops dramatically at 30% and 40% fouling, and the water drains out more
slowly due to the low permeability of the sample at higher fouling ratios.
As shown in figure 5.2.1, the curve of the 30% fouled sample showed a slight decrease in
the resistivity values after three hours of testing, before increasing for the final reading. The
decrease in resistivity observed in some of the curves could have been caused by the increase of
temperature during the day. All the tests shown in figure 5.2.1 were conducted in the open air
outside of the laboratory, where the weather varied during the day and night for each test;
however tests were begun in the morning, so temperatures generally increased during the initial
6-10 hours of testing, before decreasing with nightfall. Similar behavior was observed for the
clay samples, as shown in figure 5.2.2 According to (Tagg 1964), the resistivity will decrease as
temperature increases. This effect was presented in a study by (Samouelian 2005), which stated
that ion agitation increases with temperature, resulting in a decrease in electrical resistivity.
Figure 5.2.2 presents the results of resistivity tests of fouled ballast with clay fines at
different percentages. The patterns of resistivity vs. time were similar to ballast fouled with
crushed ballast fines, with a decrease in resistivity occurring as fouling ratio increased. Tests of
the 20%, 30%, and 40% fouling ballast were conducted in the open air outside of the laboratory,
and measurements were taken for up to 18 hours. The sample with 50% fouling was conducted
Page 76
60
inside the laboratory due to extreme weather conditions. As evident in figure 5.2.2, the curve for
50% fouling shows a steady line for resistivity measurements, presumably because the sample
was not affected by temperature. Overall, as the fouling ratio increased, more water was retained
due to the reduction in rate of drainage, which resulted in less permeable and resistive ballast.
Figure 5.2.3 presents the resistivity results with time for coal dust fouled ballast at
different percentages. As expected, the resisitivity of ballast decreased as the percentage of coal
dust increased. The weight of coal dust particles is relatively small compared to crushed ballast
fines and clay, therefore, more particles were added to the sample and as a result more water was
retained.
Tables 5.2.1, 5.2.2 and 5.2.3 present the range of resistivity measurements for each
fouling ratio sample for crushed ballast fine ,clay and coal dust. The ranges for each sample are
relatively small compared to the large differences in resistivity with changes in fouling ratio. The
absolute values and the trends present in tables 5.2.1 and 5.2.2 are also consistent with the
reference values for clay, sand, and crystalline rocks reported in table 2.1.
Figure 5.2.4 and table 5.2.4 show a comparison between permeability and resistivity of
fouled ballast at the 18th hour. The 18th hour reading was chosen for the comparison since the
clay samples were tested for 18 hours only due to time limitation. Solid curves represent the
permeability test results and the dotted curves represent the resistivity results. As evident in
figure 5.2.5, the patterns are similar, and show that as fouling ratio increased, permeability and
resistivity decreased at a comparable rate and were clearly correlated with each other and with
fouling. This indicates that measurements of either permeability or resistivity could be used to
estimate the degree of fouling.
Page 77
61
5.3 Direct Shear Test Data
For each sample a direct shear test was performed at three normal pressures, 35 kPa, 70
kPa, and 105 kPa (5 psi, 10 psi and 15 psi). Fouled samples were prepared with 20, 30, 40, and
50 fouling ratio content (by weight) for each type of fouling material. A series of tests with 10%
fouled ballast with coal dust were performed. Additionally, a test on clean ballast was performed
to compare the strength properties of fouled and clean ballast. The maximum shear stress for
each test was evaluated and plotted according to ASTM D3080-04 to determine friction angle
and cohesion. For each test, a shear stress and horizontal displacement curve was plotted to show
the behavior of sample during the shearing process. Figures 5.3.1 and 5.3.3 through 5.3.19
present the results of direct shear tests of clean and fouled ballast at the three normal pressures.
The curves plotted for each test are not smooth due to particle crushing during the shearing
process. Also, the variability of particle size can cause this disturbance in the results for those
tests. For these figures the solid lines represent the actual data retrieved from software and the
dashed lines represent the predicted path of the curve (neglects disturbance caused by particle
crushing) where the maximum shear stress values were evaluated. Crushing of the particle was
observed visually on the display chart of the software and on the display of the machine, which
showed the load increasing and suddenly falling after the particle was crushed. Also, crushing of
ballast particles occurred during the end of some tests and the test had to be terminated due to
reaching maximum travel in the machine. The data that was recorded during the crushing was
neglected and was represented by a dashed circle as shown in several figures presented in section
5.3.
Page 78
62
Figure 5.3.1 Shear stress versus horizontal displacement of clean ballast
Figures 5.3.1 shows the shear stress versus horizontal displacement for clean ballast at
three different normal stresses. After the test, crushed ballast fines were observed at the bottom
of the box as shown in Figure 5.3.3. As expected, the cohesion of the clean ballast was zero.
0
20
40
60
80
100
120
140
160
180
0 1 2 3 4 5 6 7
Sh
ear
Str
ess
(kP
a)
Horizantal Displacement (cm)
35 kPa 70 kPa 105 kPa
Page 79
63
Figure 5.3.2. Display of particle crushing
Figure 5.3.3. Crushed ballast fines after clean ballast direct shear test
Page 80
64
Figure 5.3.4 Shear stress versus horizontal displacement of ballast fouled with 20% crushed
ballast fines
Figure 5.3.5 Shear stress versus horizontal displacement of ballast fouled with 30% crushed
ballast fines
0
20
40
60
80
100
120
140
160
180
0 2 4 6 8
Sh
ear
Str
ess
(kP
a)
Horizantal Displacement (cm)
35 kPa 70 kPa 105 kPa
0
20
40
60
80
100
120
140
160
180
200
0 1 2 3 4 5 6 7
Sh
ear
Str
ess
(kP
a)
Horizantal Displacement (cm)
35 kPa 70 kPa 105 kPa
Page 81
65
Figure 5.3.6 Shear stress versus horizontal displacement of ballast fouled with 40% crushed
ballast fines
Figure 5.3.7 Shear stress versus horizontal displacement of ballast fouled with 50% crushed
ballast fines
0
20
40
60
80
100
120
140
160
0 1 2 3 4 5 6 7
Sh
ear
Str
ess
(kP
a)
Horizantal Displacement (cm)
35 kPa 70 kPa 105 kPa
0
20
40
60
80
100
120
140
160
0 1 2 3 4 5 6 7
Sh
ear
Str
ess
(kP
a)
Horizantal Displacement (cm)
35 kPa 70 kPa 105 kPa
Page 82
66
Figure 5.3.8 Failure envelopes of clean ballast and fouled ballast with crushed ballast fines
Figures 5.3.4 through 5.3.7 show the shear stress versus horizontal displacement plots of
ballast with crushed ballast fines at different fouling ratios. Figure 5.3.8 presents a comparison of
failure envelopes of clean ballast and fouled ballast with crushed ballast fines at different fouling
ratios. The results show that clean ballast has a higher friction angle compared with fouled
ballast. Typically, as the fouling ratio increased the friction angle decreased. However, the
cohesion measured was not expected since all samples were prepared in a dry state. The
variability in the results caused by the crushing of the ballast particles may have resulted in the
cohesion of the sample
0
20
40
60
80
100
120
140
0 20 40 60 80 100 120
Sh
ear
Str
ess
(kP
a)
Normal Stress (kPa)
20%
30%
40%
50%
Clean
Linear (20%)
Linear (30%)
Linear (40%)
Linear (50%)
Linear (Clean)
Page 83
67
Figure 5.3.9 Shear stress versus horizontal displacement of ballast fouled with 20% clay
Figure 5.3.10 Shear stress versus horizontal displacement of ballast fouled with 30% clay
0
20
40
60
80
100
120
140
160
180
0 1 2 3 4 5 6 7
Sh
ear
Str
ess
(kP
a)
Horizantal Displacement (cm)
35 kPa 70 kPa 105 kPa
0
20
40
60
80
100
120
140
160
0 1 2 3 4 5 6 7 8
Sh
ear
Str
ess
(kP
a)
Horizantal Displacement (cm)
35 kPa 70 kPa 105 kPa
Page 84
68
Figure 5.3.11 Shear stress versus horizontal displacement of ballast fouled with 40% clay
Figure 5.3.12 Shear stress versus horizontal displacement of ballast fouled with 50% clay
0
20
40
60
80
100
120
140
0 1 2 3 4 5 6 7
Sh
ear
Str
ess
(kP
a)
Horizantal Displacement (cm)
35 kPa 70 kPa 105 kPa
0
20
40
60
80
100
120
140
0 1 2 3 4 5 6 7
Sh
ear
Str
ess
(kP
a)
Horizantal Displacement (cm)
35 kPa 70 kPa 105 kPa
Page 85
69
Figure 5.3.13 Failure envelopes of clean ballast and fouled ballast with clay
.
Figures 5.3.9 through 5.3.12 show the shear stress versus horizontal displacement of
fouled ballast with clay. Figure 5.3.13 presents the comparison of failure envelopes of clean
ballast and fouled ballast with clay at different fouling ratios. The trend of decreasing strength as
the fouling ratio increases is similar to that observed for fouled ballast with crushed ballast fines.
However, the friction angles are lower compared with crushed ballast fines which was expected
due to the differences in the properties of crushed ballast fines and clay.
0
20
40
60
80
100
120
140
160
0 20 40 60 80 100 120
Sh
ear
Str
ess
(kP
a)
Normal Stress (kPa)
20%
30%
40%
50%
Clean
Linear (20%)
Linear (30%)
Linear (40%)
Linear (50%)
Linear (Clean)
Page 86
70
Figure 5.3.14 Shear stress versus horizontal displacement of ballast fouled with 10% coal dust
Figure 5.3.15 Shear stress versus horizontal displacement of ballast fouled with 20% coal dust
0
10
20
30
40
50
60
70
80
90
100
0 1 2 3 4 5 6 7
Sh
ear
Str
ess
(kP
a)
Horizantal Displacement (cm)
35 kPa 70 kPa 105 kPa
0
10
20
30
40
50
60
70
80
0 1 2 3 4 5 6 7
Sh
ear
Str
ess
(kP
a)
Horizantal Displacement (cm)
35 kPa 70 kPa 105 kPa
Page 87
71
Figure 5.3.16 Shear stress versus horizontal displacement of ballast fouled with 30% coal dust
Figure 5.3.17 Shear stress versus horizontal displacement of ballast fouled with 40% coal dust
0
20
40
60
80
100
120
140
160
0 1 2 3 4 5 6 7
Sh
ear
Str
ess
(kP
a)
Horizantal Displacement (cm)
35 kPa 70 kPa 105 kPa
-40
-20
0
20
40
60
80
100
120
0 1 2 3 4 5 6 7
Sh
ear
stre
ss (
kP
a)
Horizantal displacement (cm)
35 kPa 70 kPa 105 kPa
Page 88
72
Figure 5.3.18 Shear stress versus horizontal displacement of ballast fouled with 50% coal dust
Figure 5.3.19 Failure envelopes of clean ballast and fouled ballast with coal dust
0
10
20
30
40
50
60
70
0 1 2 3 4 5 6 7
Sh
ear
Str
ess
(kP
a)
Horizantal Displacement (cm)
35 kPa 70 kPa 105 kPa
0
20
40
60
80
100
120
140
160
0 20 40 60 80 100 120
Sh
ear
Str
ess
(kP
a)
Normal Stress (kPa)
10%20%30%40%50%CleanLinear (10%)Linear (20%)Linear (30%)Linear (40%)Linear (50%)Linear (Clean)
Page 89
73
Figures 5.3.14 through 5.3.18 show the shear stress versus horizontal displacement of
fouled ballast with coal dust at different fouling ratios. An a additional set of tests of 10% fouled
ballast with coal dust were performed and evaluated as shown in section 5.3. According to
Huang, ballast fouled with 15% coal dust or more decreases strength significantly (Huang 2009).
Therefore, it was beneficial to examine the behavior of fouled ballast with coal dust at 10% and
compare the results with different fouling ratios. Moreover, the results for the 20% through 40%
fouled ballast with coal dust were inconsistent compared to clay and crushed ballast fines. Figure
5.3.19 presents the comparison of failure envelopes of clean and fouled ballast with coal dust.
More evident from the figure, the 40% fouled ballast has higher strength than 20 and 30% fouled
ballast, which is not consistent with the expected trend. However, fouled material can gain
strength as voids are filled and the sample becomes more dense. Yet, as the fouling ratio
increases the ballast particles will be separated and therefore the strength will decrease
eventually (Anbazhagan 2010).
Figure 5.3.20 shows a comparison of failure envelopes for clean ballast and fouled ballast
at 30% fouling with crushed ballast fines, clay and coal dust. As evident from the figure, coal
dust fouled ballast show a significant decrease in strength at 30% fouling compared to clean
ballast and other fouling materials.
Page 90
74
Figure 5.3.20 Comparison of failure envelopes of clean and fouled ballast at 30% fouling
Overall, the trend shows as the fouling ratio increased the friction angle decreased,
especially for coal dust and clay. The properties of coal dust and clay resulted in decreases in the
strength of ballast and therefore the results shows a similar pattern compared with the hydraulic
conductivity of fouled ballast.
However, the crushing of the ballast particles and the tilting of the top plate which caused
inaccurate results and high cohesion values. Figure 5.3.21 show the tilting of the top plate during
a direct shear test.
0
20
40
60
80
100
120
140
160
0 20 40 60 80 100 120
Sh
ear
Str
ess
(kP
a)
Normal Stress (kPa)
Clean
Crushed ballastfines
Coal dust
Clay
Linear (Clean)
Linear (Crushedballast fines)
Linear (Coaldust)
Linear (Clay)
Page 91
75
Figure 5.3.21. Top plate tilt during direct shear test
Page 92
76
5.4 Modified Direct Shear Test Data
The direct shear box was modified by increasing the height of both halves to reduce the
crushing of particles and allow more particle movement. The same set of tests and sample
preparations were implemented in the modified direct shear box as in the direct shear box and the
results were compared. Section 5.4 shows the results of direct shear tests and presents the shear
stress and horizontal displacement relationships and comparisons of the failure envelopes of each
fouling material at different fouling ratios. A dashed curve was plotted on each stress-
displacement curve to show the stress-displacement trend and neglecting the individual
variations in the trend caused by particle crushing. Figures 5.4.1 through 5.4.17 present the
results of direct shear tests of clean and fouled ballast at the three normal pressures.
Figure 5.4.1 Shear stress versus horizontal displacement of clean ballast
0
20
40
60
80
100
120
140
160
180
200
0 1 2 3 4 5 6 7
Sh
ear
Str
ess
(kP
a)
Horizantal Displacement (cm)
35 kPa 70 kPa 105 kPa
Page 93
77
Figure 5.4.1 shows the shear stress versus horizontal displacement for clean ballast at
three different normal stresses. Crushing of the particles was observed during the test but only
under high normal pressure. The cohesion value was above zero and that could be due to sample
variation or the friction of the ballast particles and the wall of the box.
Figure 5.4.2 Shear stress versus horizontal displacement of ballast fouled with 20% crushed ballast fines
0
20
40
60
80
100
120
140
160
180
0 1 2 3 4 5 6 7
Sh
ear
Str
ess
(kP
a)
Horizantal Displacement (cm)
35 kPa 70 kPa 105 kPa
Page 94
78
Figure 5.4.3 Shear stress versus horizontal displacement of ballast fouled with 30% crushed
ballast fines
Figure 5.4.4 Shear stress versus horizontal displacement of ballast fouled with 40% crushed
ballast fines
0
20
40
60
80
100
120
0 1 2 3 4 5 6 7
Sh
ear
Str
ess
(kP
a)
Horizantal Displacement (cm)
35 kPa 70 kPa 105 kPa
0
20
40
60
80
100
120
140
160
180
0 1 2 3 4 5 6 7
Sh
ear
Str
ess
(kP
a)
Horizantal Displacement (kPa)
35 kPa 70 kPa 105 kPa
Page 95
79
Figure 5.4.5 Shear stress versus horizontal displacement of ballast fouled with 50% crushed
ballast fines
Figure 5.4.6 Failure envelopes of clean ballast and fouled ballast with crushed ballast fines
0
10
20
30
40
50
60
70
80
90
100
0 1 2 3 4 5 6 7
Sh
ear
Str
ess
(kP
a)
Horizantal Displacement (cm)
35 kPa 70 kPa 105 kPa
0
20
40
60
80
100
120
140
160
0 20 40 60 80 100 120
Sh
ear
Str
ess
(kP
a)
Normal Stress (kPa)
20%30%40%50%CleanLinear (20%)Linear (30%)Linear (40%)Linear (50%)
Page 96
80
Figures 5.4.2 through 5.4.5 show the shear stress and horizontal displacement
relationship for different fouling ratios with crushed ballast fines. The trend shows as the fouling
ratio increased, shear strength generally decreased. Crushing of particles evidently occurred
during some the tests as shown in figures 5.4.2 (at normal pressure of 70 kPa) and 5.4.4 (at
normal pressure of 105 kPa). The results in figure 5.4.6 show a pattern of decrease in the friction
angle as the fouling ratio of crushed ballast fines increased.
Figure 5.4.7 Shear stress versus horizontal displacement of ballast fouled with 20% clay
0
20
40
60
80
100
120
140
0 1 2 3 4 5 6 7
Sh
ear
Str
ess
(kP
a)
Horizantal Displacement (cm)
35 kPa 70 kPa 105 kPa
Page 97
81
Figure 5.4.8 Shear stress versus horizontal displacement of ballast fouled with 30% clay
Figure 5.4.9 Shear stress versus horizontal displacement of ballast fouled with 40% clay
0
20
40
60
80
100
120
0 1 2 3 4 5 6 7
Sh
ear
Str
ess
(kP
a)
Horizantal Displacement (cm)
35 kpa 70 kPa 105 kPa
0
20
40
60
80
100
120
140
0 1 2 3 4 5 6 7
Sh
ear
Str
ess
(kP
a)
Horizantal Displacement (cm)
35 kPa 70 kPa 105 kPa
Page 98
82
Figure 5.4.10 Shear stress versus horizontal displacement of ballast fouled with 50% clay
Figure 5.4.11 Failure envelopes of clean ballast and fouled ballast with clay
0
20
40
60
80
100
120
0 1 2 3 4 5 6 7
Sh
ear
Str
ess
(kP
a)
Horizantal Displacement (cm)
35 kPa 70 kPa 105 kPa
0
20
40
60
80
100
120
140
160
0 20 40 60 80 100 120
Sh
ear
Str
ess
(kP
a)
Normal Stress (kPa)
20%30%40%50%CleanLinear (20%)Linear (30%)Linear (40%)Linear (50%)Linear (Clean)
Page 99
83
Figures 5.4.7 through 5.4.10 show the shear stress and horizontal displacement
relationship as the percentage of clay increased. A similar trend for the crushed ballast fines
could be interpreted from the results shown in these figures. However, the 40% fouled sample
with clay was determined to have higher shear strength than 30% fouled sample which does not
follow the expected pattern. As voids are partially filled with clay particles, the free movements
of ballast particles are limited and the strength of the sample may increase temporarily and that
could be the reason the sample gained strength at 40% fouling.
Figure 5.4.12 Shear stress versus horizontal displacement of ballast fouled with 10% coal dust
0
20
40
60
80
100
120
140
160
180
200
0 1 2 3 4 5 6 7
Sh
ear
Str
ess
(kP
a)
Horizantal Displacement (cm)
35 kPa 70 Kpa 105 kPa
Page 100
84
Figure 5.4.13 Shear stress versus horizontal displacement of ballast fouled with 20% coal dust
Figure 5.4.14 Shear stress versus horizontal displacement of ballast fouled with 30% coal dust
0
10
20
30
40
50
60
70
80
90
100
0 1 2 3 4 5 6 7
Sh
ear
Str
ess
(kP
a)
Horizantal Displacement (cm)
35 kPa 70 kPa 105 kPa
0
20
40
60
80
100
120
0 1 2 3 4 5 6 7
Sh
ear
Str
ess
(kP
a)
Horizantal Displacement (cm)
35 kPa 70 kPa 105 kPa
Page 101
85
Figure 5.4.15 Shear stress versus horizontal displacement of ballast fouled with 40% coal dust
Figure 5.4.16 Shear stress versus horizontal displacement of ballast fouled with 50% coal dust
0
10
20
30
40
50
60
70
80
90
0 1 2 3 4 5 6 7
Sh
ear
Str
ess
(kP
a)
Horizantal Displacement (cm)
35 kPa 70 kPa 105 kPa
0
10
20
30
40
50
60
70
80
0 1 2 3 4 5 6 7
Sh
ear
Str
ess
(kP
a)
Horizantal Displacement (cm)
35 kPa 70 kPA 105 kPa
Page 102
86
Figure 5.4.17 Failure envelopes of clean ballast and fouled ballast with coal dust
Figures 5.4.12 through 5.4.17 show the results of strength tests on ballast fouled with
coal dust for different fouling ratios. The results show a similar trend with the strength of sample
decreasing as the fouling ratio increased,. Also, figure 5.4.17 show a significant decrease in shear
strength for sampleswith more than 10% coal dust.
Overall, the results show a similar trend for all fouling material which indicates that as
fouling ratio increased, strength of fouled ballast decreased. For the modified direct shear box,
the results are more well-defined compared with results from the direct shear box as shown in the
failure of envelopes graphs. The strength of ballast decreased significantly with coal dust fouled
ballast and clay fouled ballast as the fouling ratio increased. Figure 5.4.18 shows a comparison of
0
20
40
60
80
100
120
140
160
0 20 40 60 80 100 120
Sh
ear
Str
ess
(kP
a)
Normal Stress (kPa)
10%20%30%40%50%CleanLinear (10%)Linear (20%)Linear (30%)Linear (40%)Linear (50%)Linear (Clean)
Page 103
87
failure envelopes for clean ballast and fouled ballast at 30% fouling with crushed ballast fines,
clay and coal dust. As evident from the figure, coal dust fouled ballast show a significant
decrease in strength at 30% fouling compared to clean ballast and other fouling materials. The
results are consistent with the permeability test results as the hydraulic conductivity of fouled
ballast with coal dust decreased significantly compared with other fouling materials.
Figure 5.4.18 Comparison of failure envelopes of clean and fouled ballast at 30% fouling
0
20
40
60
80
100
120
140
160
0 20 40 60 80 100 120
Sh
ear
Str
ess
(kP
a)
Normal Stress (kPa)
Clean
Crushed ballastfinesCoal dust
Clay
Linear (Clean)
Linear (Crushedballast fines)Linear (Coaldust)
Page 104
88
5.5 Summary of Large Direct Shear Box and Modified Direct Shear Box Tests Results
This section presents a summary of direct shear results for the large direct shear box tests
and modified direct shear tests. Table 5.5.1 present strength properties (friction angle and
cohesion) of clean and fouled ballast for both the direct shear and modified direct shear tests.
Figure 5.5.1 shows the comparison of friction angles of clean and fouled ballast for each fouling
material tested in the direct shear box. Figure 5.5.2 presents the friction angles of clean and
fouled ballast for each fouling material tested in the modified direct shear box.
Table 5.5.1 Summary of strength properties for direct shear and modified direct shear box tests
Large Direct Shear Box Data Modified Direct Shear Box Data
Fouling Material Condition Cohesion (kPa) ɸ Condition Cohesion
(kPa) ɸ
NA Clean 0 53 Clean 13.3 51.3
Coal dust 10% 9.3 35.5 10% 36.3 34.3
20% 6.3 35.4 20% 4.9 33.8
30% 6.3 37 30% 21.7 31 40% 36.1 33 40% 9.1 30.3 50% 16.8 22.1 50% 0 31.4
Crushed ballast fines 20% 22.4 47 20% 35.7 37
30% 16.1 45.8 30% 35.7 31.8 40% 5.6 48.2 40% 16.8 34.2 50% 21 39.7 50% 23.8 32.9
Clay 20% 17.8 49 20% 21 42 30% 37.8 37.6 30% 23.8 31 40% 35.7 33 40% 44.8 31.2 50% 37.8 30.1 50% 30.1 27.5
Page 105
89
Figure 5.5.1 Friction angle versus fouling ratio for each fouling material (large direct shear box)
Figure 5.5.2 Friction angle versus fouling ratio for each fouling material (modified box)
0
10
20
30
40
50
60
0% 10% 20% 30% 40% 50% 60%
Fri
ctio
n A
ngle
Fouling ratio
Coal dust
Crushed ballast
Clay
Linear (Coal dust)
Linear (Crushedballast)Linear (Clay)
25
27
29
31
33
35
37
39
0% 10% 20% 30% 40% 50% 60%
Fri
ctio
n A
ngle
Fouling ratio
Coal dust
crushed ballast
Clay
Linear (Coaldust)
Linear (crushedballast)
Linear (Clay)
Page 106
90
Figure 5.5.3 Comparison of large direct shear and modified direct shear friction angle versus
fouling ratio for each fouling material
Table 5.5.1 shows the summary of strength test results of the large direct shear box and
modified direct shear box. Both sets of results show the same pattern of decrease in strength of
ballast as fouling ratio increased. For the large direct shear box, the strength of ballast fouled
with clay and coal dust fines decreased significantly. The properties of clay and coal dust
reduced the strength of ballast as the percentage of fines increased. Figure 5.5.1 presents a
comparison between the friction angle of fouled ballast with different fouling materials for
0
10
20
30
40
50
60
0% 10% 20% 30% 40% 50% 60%
Fri
ctio
n A
ngle
Fouling ratio
CoalCoal MODCrushed ballastCrushed ballast MODClayClay MODLinear (Coal)Linear (Coal MOD)Linear (Crushed ballast)Linear (Crushed ballast MOD)Linear (Clay)Linear (Clay MOD)
Page 107
91
various fouling ratios. Coal dust fouled ballast show a significant decrease in friction angle at
50% fouling compared with clay and crushed ballast.
Moreover, the results for the modified direct shear box show a similar pattern as the large
direct shear box; however, the results show that clay fines had a more significant effect on
strength than coal dust at 50% fouling as shown in figure 5.5.2. Overall, coal dust and clay fines
reduced the strength of ballast significantly as the fouling ratio increased. Figure 5.5.3 compares
the results from large direct shear and modified direct shear of friction angle vs fouling ratio. The
solid lines represent the results from large direct shear box and dashed lines represent the results
from modified direct shear box.
Page 108
92
5.6 Large Scale Resistivity Test
A large scale sample of heavily fouled ballast was constructed and tested under wet
conditions. The four point Wenner method was used to measure resistivity at depths of eighteen
inches, twelve inches and six inches. A wooden board with pre-drilled holes at a measured
spacing was used to hold the rods during the test. The resistivity readings were taken after water
was sprayed on top of the sample. According to Wenner’s four point method, the depth of
measurement is equal to the spacing of the rods, therefore, the resisitivity of the sample was
measured at three depths. Figure 5.6.1 through 5.6.6 show a cross section of each test and a data
sheet that show test conditions and results.
Page 109
93
Figure 5.6.1 Schematic diagram of resistivity large scale test at depth of 18 inches
Figure 5.6.2 Detailed data sheet for resistivity large scale test at depth of 18 inches (AEMC 2012)
Test Date 4/19/2013
Test Conditions
Soil Condition: x Moist Dry Temperature 61 °F
x Crushed Ballast & Ballast
Soil Type: Clay & Ballast
Coal Dust & Ballast
Electrode Spacing (A) 1.5 ft
Crushed Ballast
Test 1Percentage Fouling
Resistivity (ohms-cm)
Range
50.7 20%30%40%50%
rho calculation ρ = 2*PI*AR
Test
Reading
Soil
Resistivity
Test R ρ Effective soil resistivity: 14563.58 Ω - cm
1 50.7 14563.6
42,000 - 80,00032,000 - 42,00012,000 - 20,0008,000 - 12,000A AA
3’
Page 110
94
Figure 5.6.3 Schematic diagram of resistivity large scale test at depth of 12 inches
Figure 5.6.4 Detailed data sheet for large scale test at depth of 12 inches (AEMC 2012)
Test Date 4/19/2013
Test Conditions
Soil Condition: x Moist Dry Temperature 61 °F
x Crushed Ballast & Ballast
Soil Type: Clay & Ballast
Coal Dust & Ballast
Electrode Spacing (A) 1 ft
Crushed Ballast
Test 1Percentage Fouling
Resistivity (ohms-cm)
Range
69.1 20%30%40%50%
rho calculation ρ = 2*PI*AR
Test
Reading
Soil
Resistivity
Test R ρ Effective soil resistivity: 13232.65 Ω - cm
1 69.1 13232.7
42,000 - 80,00032,000 - 42,00012,000 - 20,0008,000 - 12,000A AA
3’
Page 111
95
Figure 5.6.5 Schematic diagram of resistivity large scale test at depth of 6 inches
Figure 5.6.6 Detailed data sheet for resistivity large scale test at depth of 6 inches (AEMC 2012)
Test Date 4/19/2013
Test Conditions
Soil Condition: x Moist Dry Temperature 61 °F
x Crushed Ballast & Ballast
Soil Type: Clay & Ballast
Coal Dust & Ballast
Electrode Spacing (A) 0.5 ft
Crushed Ballast
Test 1Percentage Fouling
Resistivity (ohms-cm)
Range
83.3 20%30%40%50%
rho calculation ρ = 2*PI*AR
Test
Reading
Soil
Resistivity
Test R ρ Effective soil resistivity: 7975.98 Ω - cm
1 83.3 7975.98
42,000 - 80,00032,000 - 42,00012,000 - 20,0008,000 - 12,000A AA
3’
Page 112
96
Table 5.6.1 Summary of fouled resisitivity with depth
Test Reading
Soil Resistivity
Depth (in)
Test R (Ω) ρ (Ω-cm)
18 1 50.7 14564.4 12 2 69.1 13233.4 6 3 83.3 7976.5
. Figures 5.6.1, 5.6.3 and 5.6.5 show schematic diagrams of the setup at different depths
with dimensions. Figures 5.6.2, 5.6.4 and 5.6.6 show a detailed data sheet of test setup and
conditions which was obtained from AEMC (manufacturer of the soil resistivity meter). The data
sheet was adjusted to be compatible with railroad ballast resistivity testing, and a table of
resistivity ranges was added to be able to determine the fouling ratio from the resistivity of the
sample tested. The results show that as the depth increased, resistivity increased. The higher
resistivites at greater depths were interpreted to be representative of drier material, while the near
suface material had a lower resistivity due to the addition of water to the surface.
Page 113
97
Chapter 6 Conclusions
This study represents the first step in attempting to evaluate the fouling ratio in a ballast
layer using resistivity and permeability methods. Relationships between permeability, resistivity,
and fouling were identified during this study, which suggests the goal of using measurements of
either resistivity or permeability as a proxy for fouling may be successful.
A series of laboratory tests were conducted at the University of Kansas on fouled ballast
obtained from Gardner, Kansas, and coal dust from Wyoming, BNSF line milepost 61. The tests
measured the permeability and resistivity of ballast fouled with three different fouling materials.
Each fouling material was mixed with clean aggregates to obtain 20%, 30%, 40% and 50%
fouling by dry weight. Results from using crushed ballast fines, clay and coal dust as fouling
material showed similar patterns in permeability and resistivity. Hydraulic conductivity of ballast
decreased as the fouling ratio increased. Resistivity decreased in a similar manner as the fouling
ratio increased. Fouling index was observed to be a better proxy for hydraulic conductivity than
fouling ratio, because fouling index better accounted for the type of fouling material.
Moreover, strength properties were also examined for the same samples prepared for
permeability and resistivity tests. Strength properties were determined by running large direct
shear box and modified direct shear box tests. Results of direct shear and modified direct shear
tests show that as fouling ratio increased, strength of ballast decreased. However, the modified
direct shear box presented a clear pattern of decreasing strength as the fouling ratio increased.
Also, the modified direct shear box experienced less top plate tilting which indicates more
accurate results were obtained from the modified setup. Moreover, the modified direct shear
results show that friction angles were lower for the same samples tested in the large direct shear
Page 114
98
box, however, higher cohesion values were observed in modified direct shear tests which could
be due to more friction between ballast particles and the walls of the box. Both the large direct
shear and modified direct shear tests experienced ballast crushing during the test, however, the
modified direct shear box allowed more particle movement than the large direct shear box and
the results were less variable. Overall, ballast fouled with clay and coal showed a significant
decrease in strength in both the large direct shear box and modified direct shear tests. The results
compare well with the measured hydraulic conductivities of fouled ballast with clay and coal
dust.
A large scale resistivity test on heavily fouled ballast was performed on a sample
prepared outdoors with a near-surface wet condition. The resistivity of the sample was measured
using the Wenner’s four point method at three different depths. The results showed that
resistivity changed with depth since more water is retained towards the surface, therefore, higher
resistivity values were measured as depth increased.
Page 115
99
Recommendations
The resistivity and permeability values from the fabricated box showed a good pattern on
how the percentage of fouling affects drainage and resistivity values and how each fouling agent
behaved differently due to its properties. However, I believe further studies must be done on this
method to be able to investigate other factors such as moisture contents at different depths since
it could change resistivity values. Also, it would be more accurate to test the resistivity of each
sample at different depths and take an average value. Some tests were terminated after 18 hours,
giving results that could be improved if the test is terminated when it reaches certain moisture
content and that could show a better comparison between permeability and resistivity curves.
For the strength tests, I suggest constructing a new box with larger dimensions to be able
to test the strength of clean and fouled ballast and eliminating the limitations that were
experienced in the large direct shear box and modified direct shear box. Also, the inside walls of
the box should be coated with a smooth surface to minimize the friction between ballast particles
and walls of box. The box should be water tight to be able to test samples under submerged
conditions.
Moreover, field testing will be beneficial to be able to apply methods presented in this
study from this study and verify results obtained from this paper. I suggest Wenner’s 4 point
method to measure resistivity in the field and excavate several sections from the field and bring
samples to the lab to evaluate the level of fouling. This will improve the test procedure and
increase confidence in using the suggested method to be able to evaluate the level of fouling by
using an effective non-destructive testing method.
Page 116
100
References
AEMC Instruments (2012). 15 Faraday Drive. Dover, NH. http://www.aemc.com/products/html/minfindex.asp?id=50306&dbname=products
Anbazhaga, P., B. Inraratna, C. Rujikiatkamjorn, and L. Su. 2010. “Using a seismic survey to measure the shear modulus of clean and fouled ballast.” Geomechanics and
Geoengineering: An International Journal, 5, no. 2: 117-126.
Chiang, C. C. 1989. “Effects of water and fines on ballast performance in box tests.” Master of
Science Degree Project Report No. AAR89-366P. University of Massachusetts, Amherst, MA.
Ebrahimi, A., D. Fratta, and J. Tinjum. 2008. “Detection of fouling in ballast by electromagnetic survey.” Research in Nondestructive Evaluation,19, no. 4: 219-237.
Feldman, F. and D. Nissen. 2002. “Alternative testing method for the measurement of ballast fouling: Percentage voids contamination.” Proceedings of the Conference on Railway
Engineering, Wollongong, Australia. Railway Technical Society of Australia, Canberra, Australia, 101-109.
Han, X., and E. T. Selig. 1997. “Effects of fouling on ballast settlement.” Proceedings of the 6th
International Heavy Haul Railway Conference, Cape Town, South Africa.
Huang, H., E. Tutumluer, and W. Dombrow. 2009. “Laboratory characterization of fouled railroad ballast behavior.” Transportation Research Record, 2117: 93-101.
Indraratna, B., H. Khabbaz, W. Salim, and D. Christie. 2006. “Geotechnical properties of ballast and the role of geosynthetics in rail track stabilisation. Ground Improvement, 10, no. 3: 91-101.
Indrartna, B., W. Salim, and C. Rujikiatkamjorn. 2011. Advanced rail geotechnology –Ballasted
track. University of Wollongong, Australia: CRC Press.
Jowkar, M., Parsons, R. , and Han, J. (2013). “Performance of geogrid reinforced ballast under
dynamic loading.” (CD-ROM), Transportation Research Board, Washington, DC.
Leng. Z, and I. Al-Qadi. 2010. “Railroad ballast evaluation using ground penetrating radar: Laboratory investigation and field evaluation.” Transportation Research Record: Journal
of the Transportation Research Board, 2159: 110-117.
Raymond, G. P. 1978. “Design for railroad ballast and subgrade support.” Journal of the
Geotechnical Engineering Division,105, no. 1: 45-60.
Page 117
101
Roberts, R., and J. Rudy. 2006. “Railroad ballast fouling detection using ground penetrating radar. A new approach based on scattering from voids.” ECNDT 2006 – Th.4.5.1. http://www.ndt.net/article/ecndt2006/doc/Th.4.5.1.pdf
Samouelian, A., I. Cousin, A. Tabbagh, and Richard G. Bruand. 2005. “Electrical resistivity survey in soil science.” Soil & Tillage Research, 83: 173-193.
Selig, E.T, and J. Waters. 1994. Track geotechnology and substructure management. London: Thomas Telford.
Tagg, G. F. 1964. Earth resistances. Great Britain: Pitman Publishing Corporation.
Wallace, A. J. 2003. “Permeability of fouled rail ballast.” UG Thesis, School of Civil, Mining and Environmental Engineering, University of Wollongong, New South Wales, Australia.


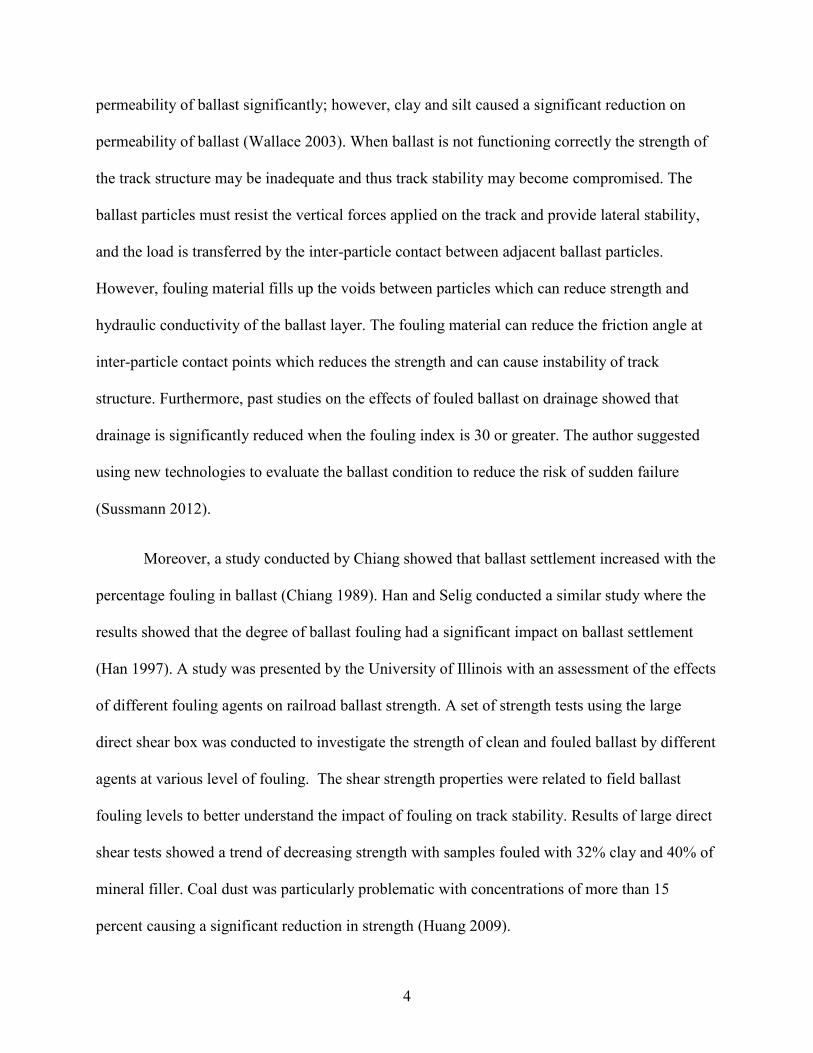


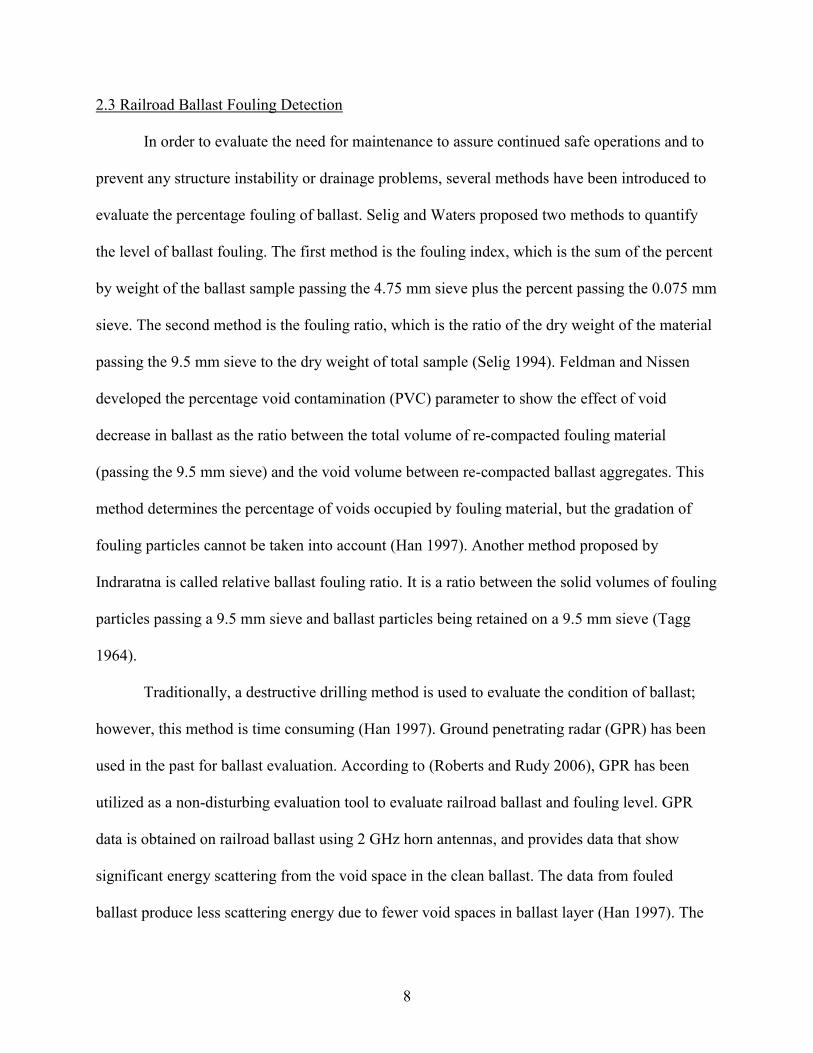


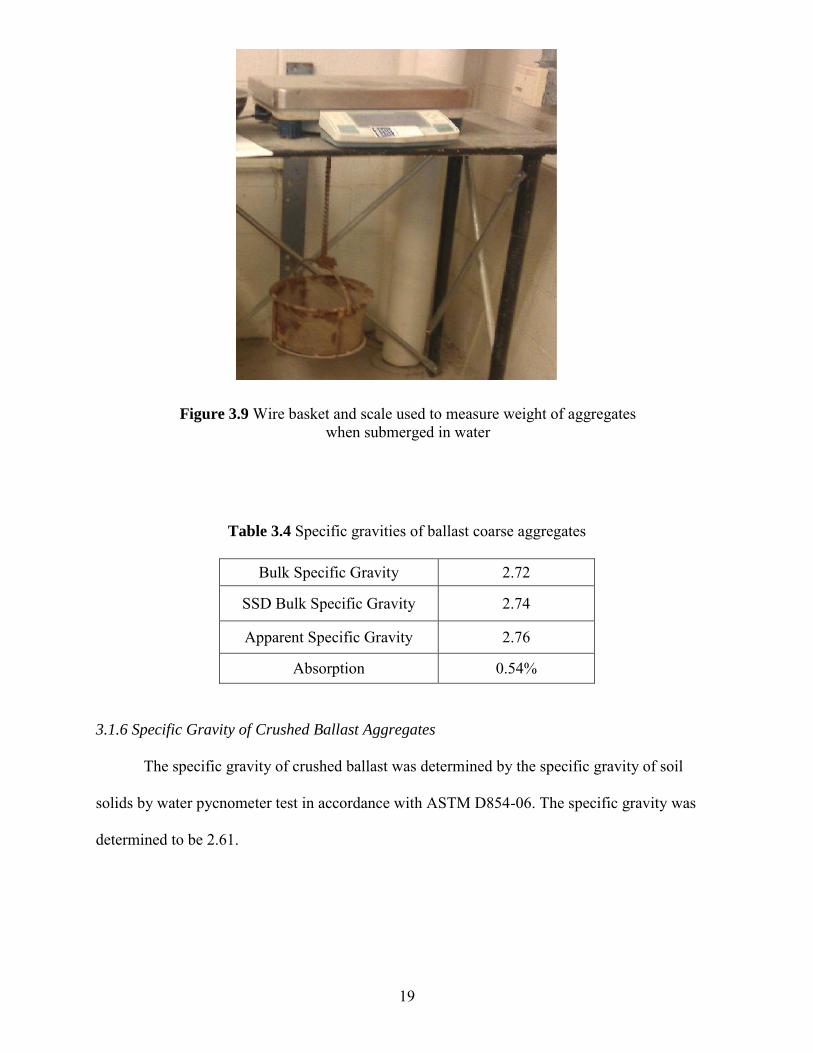


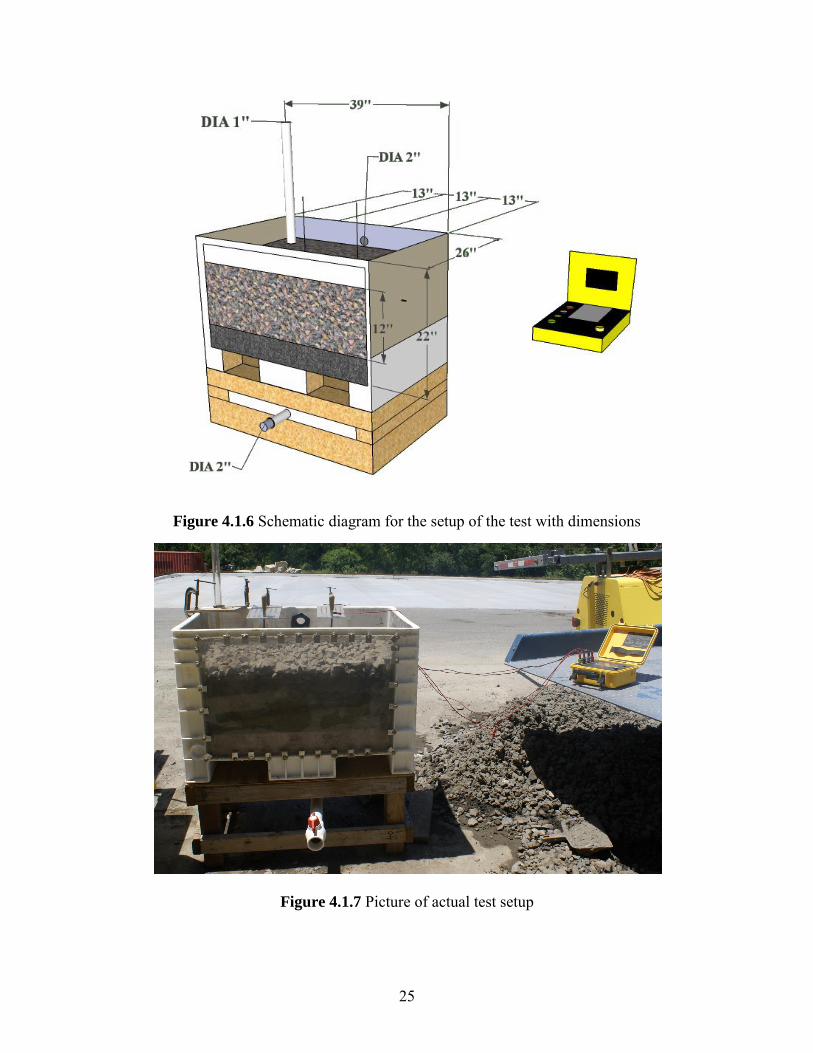

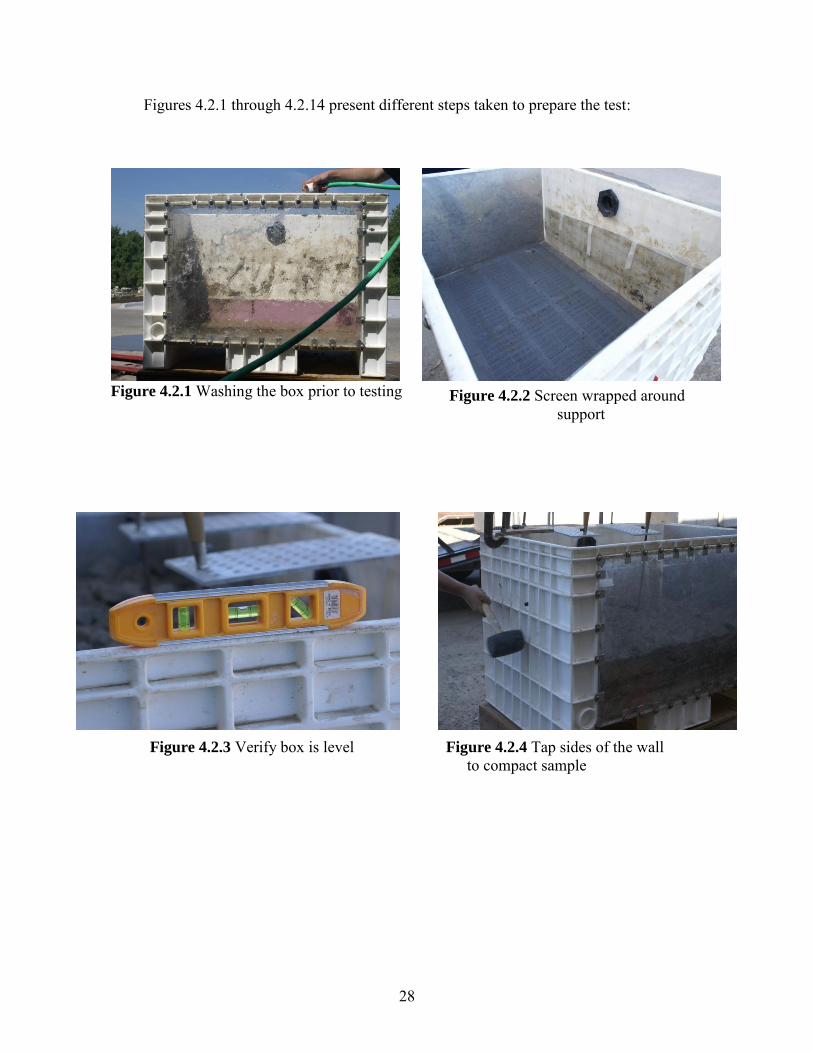
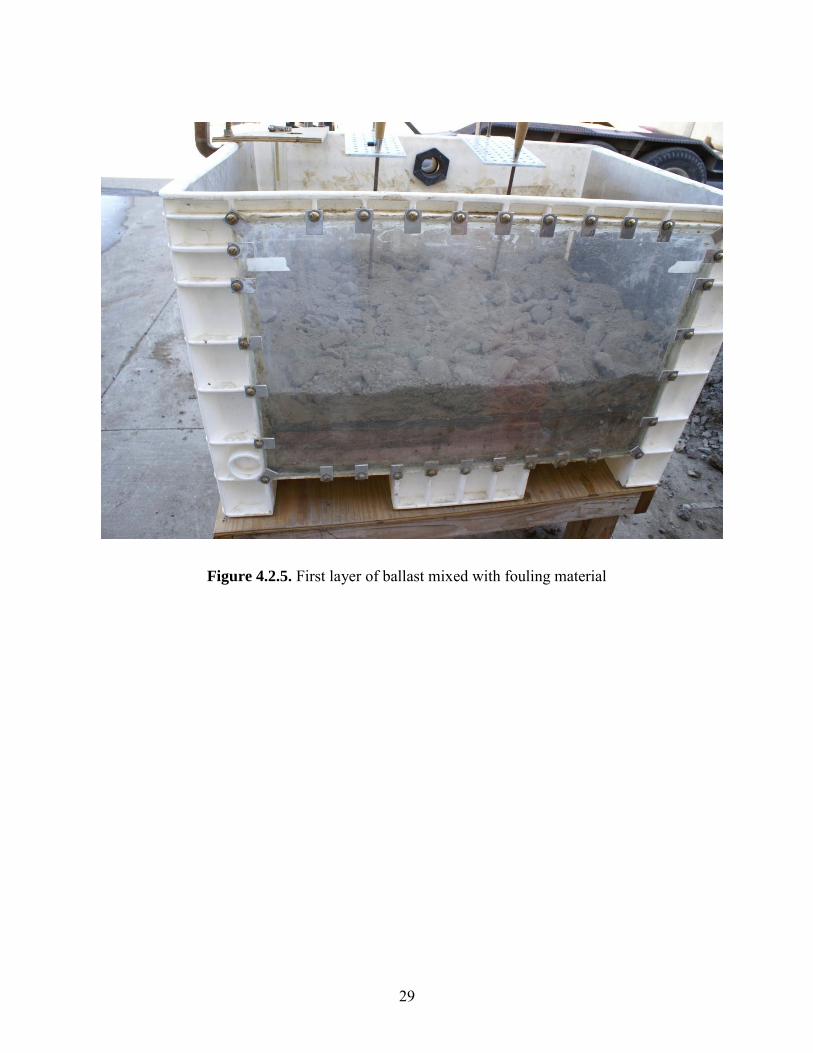
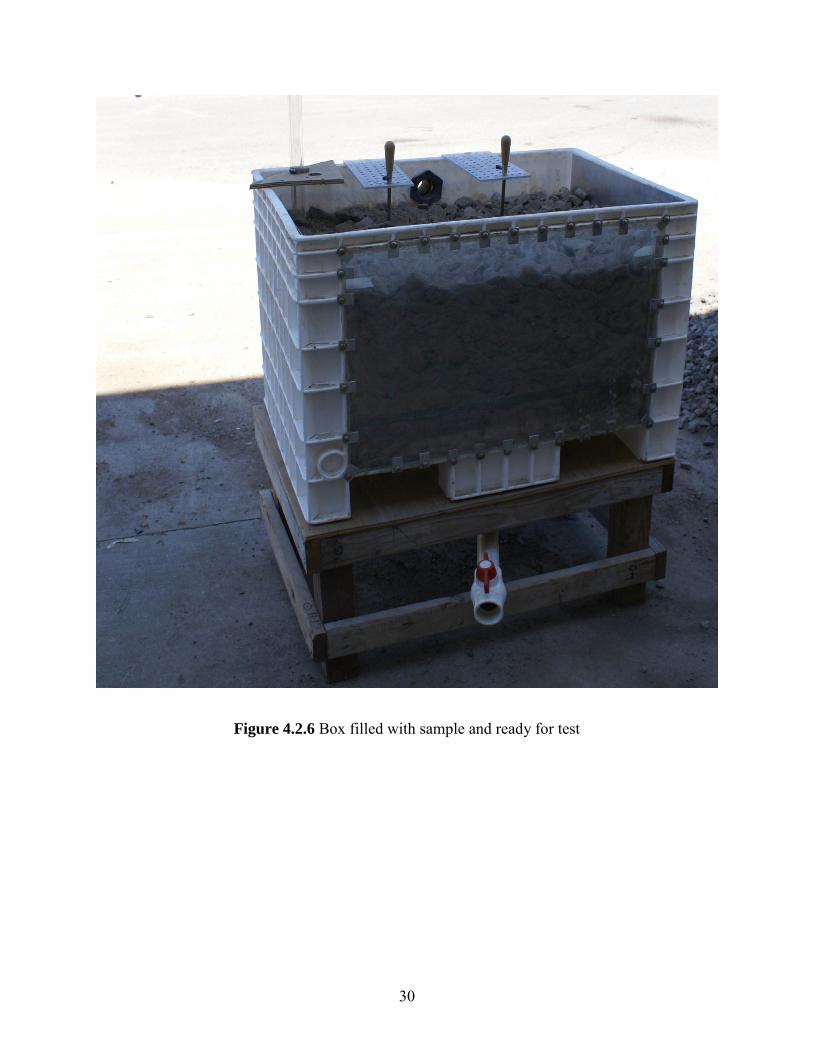
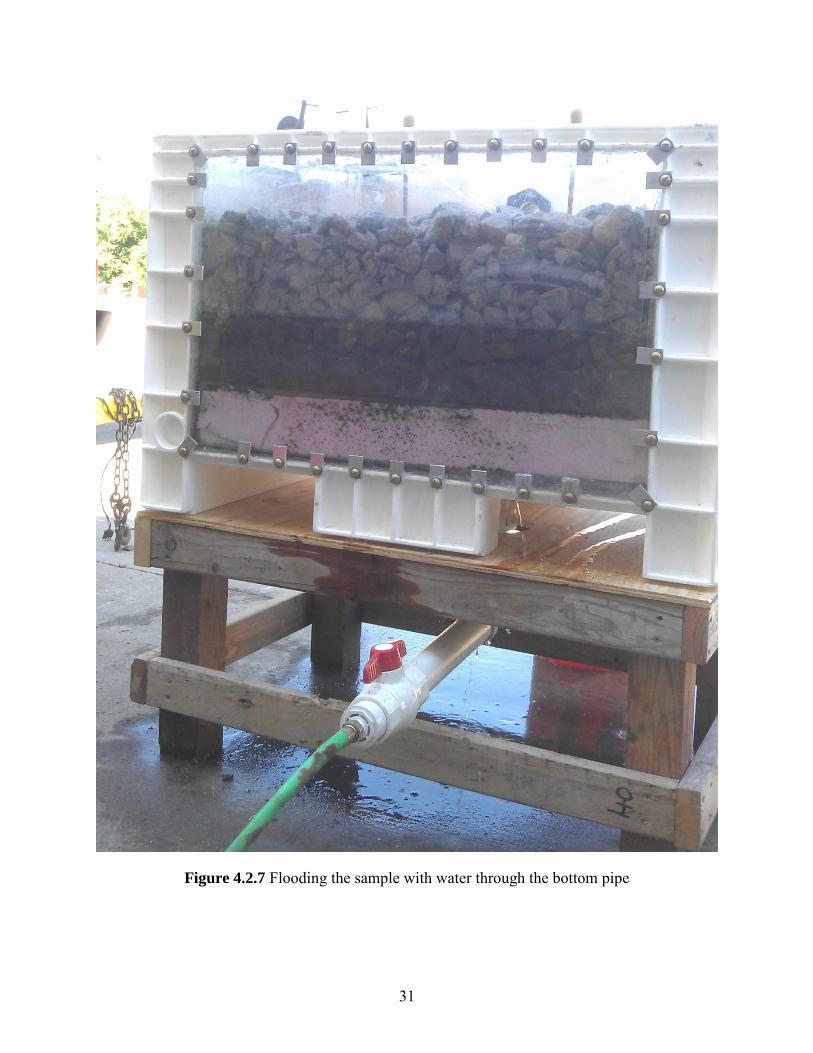
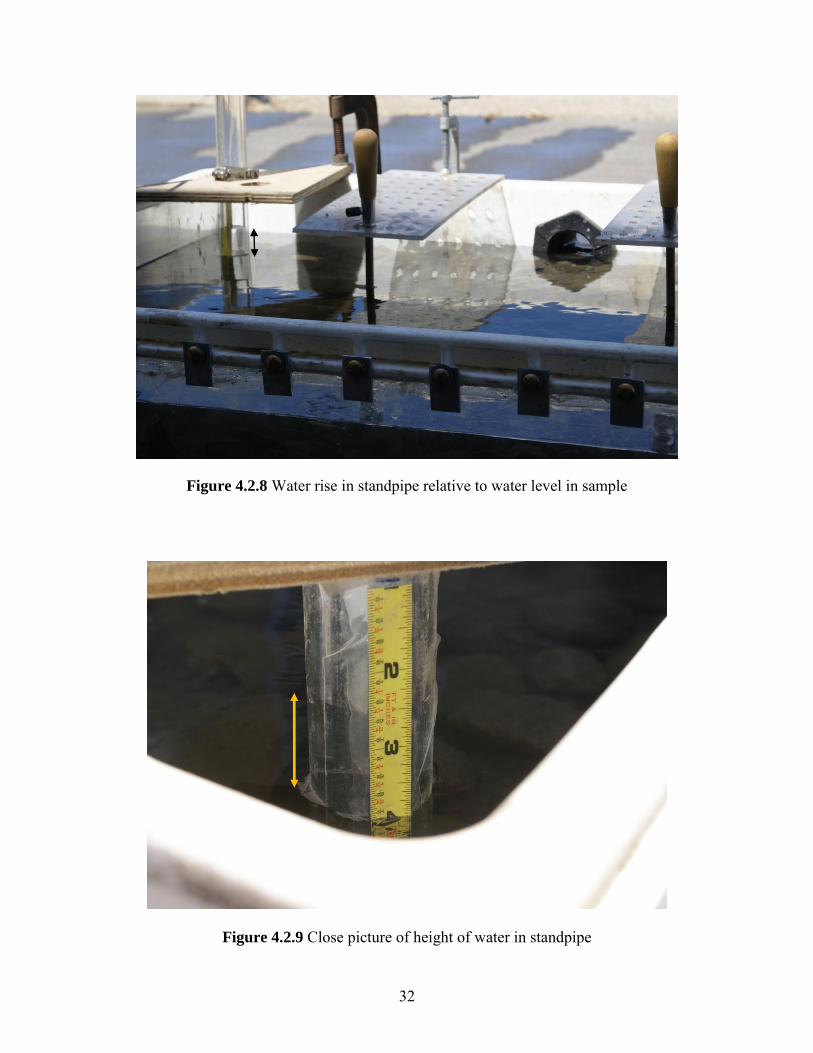

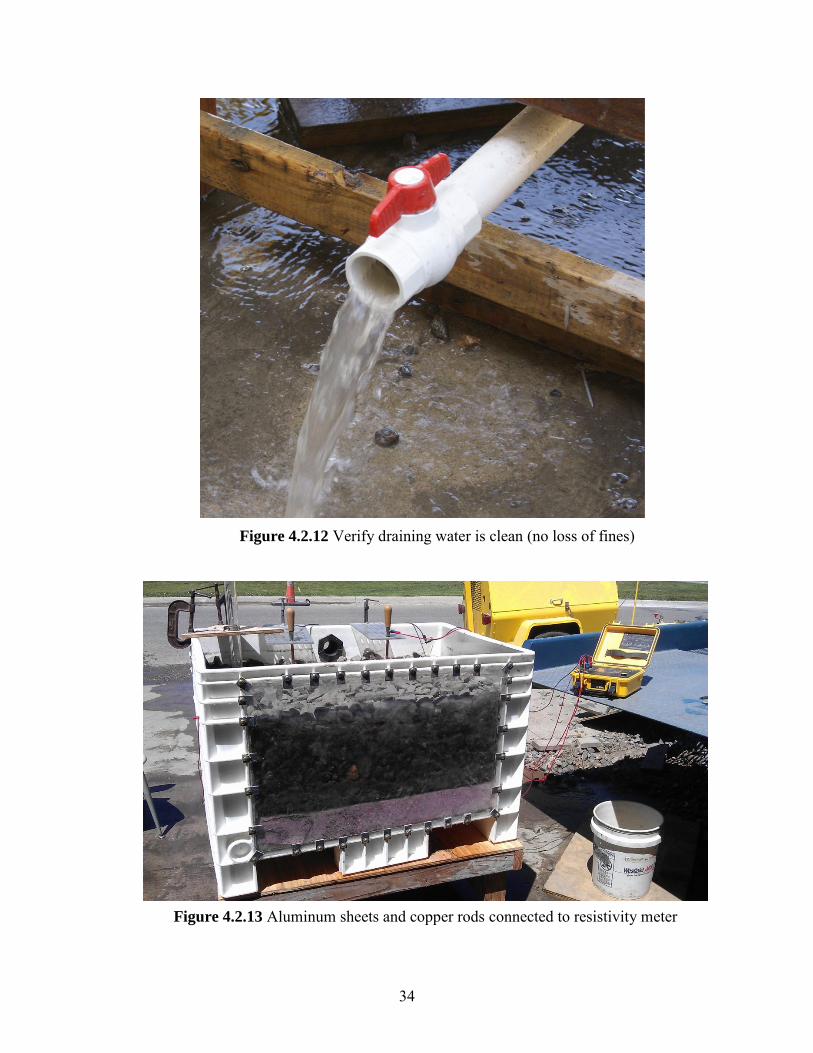


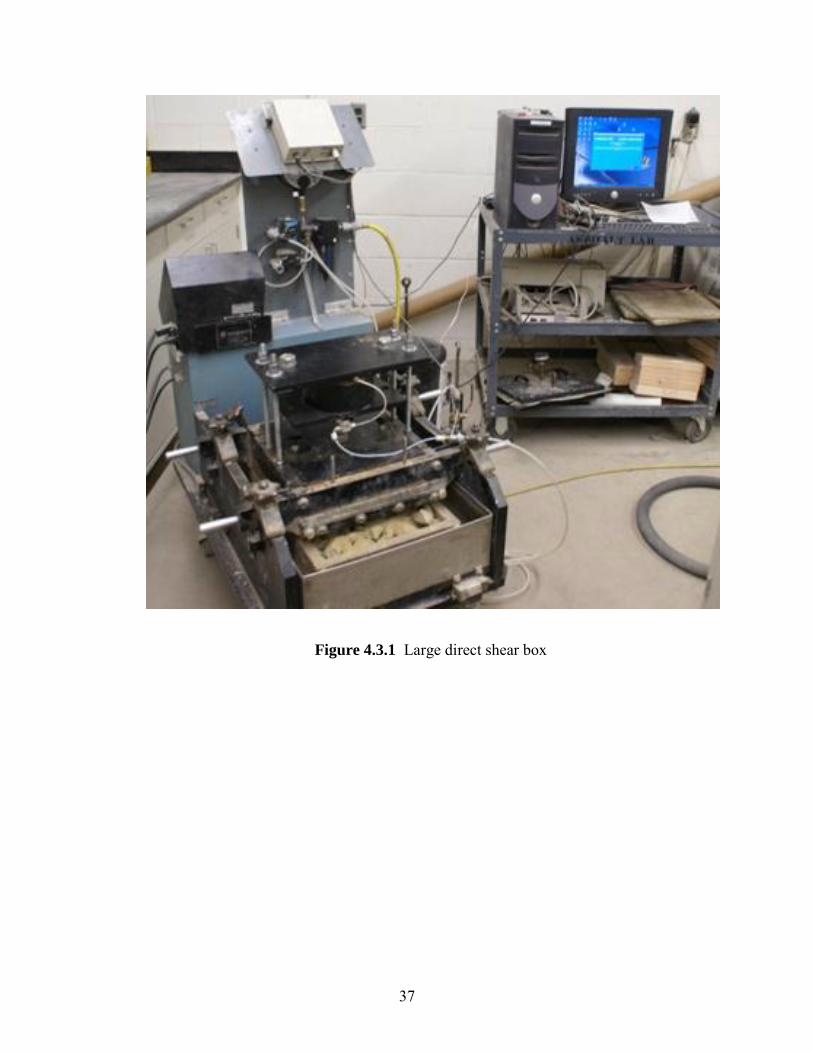


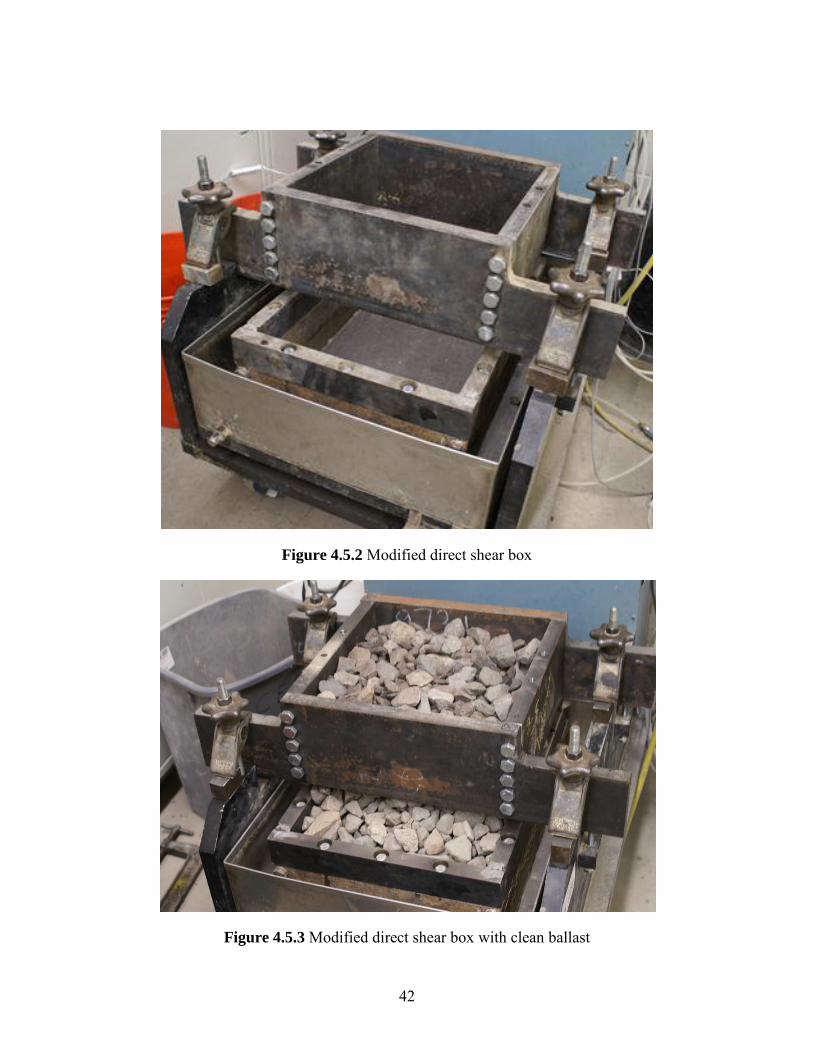
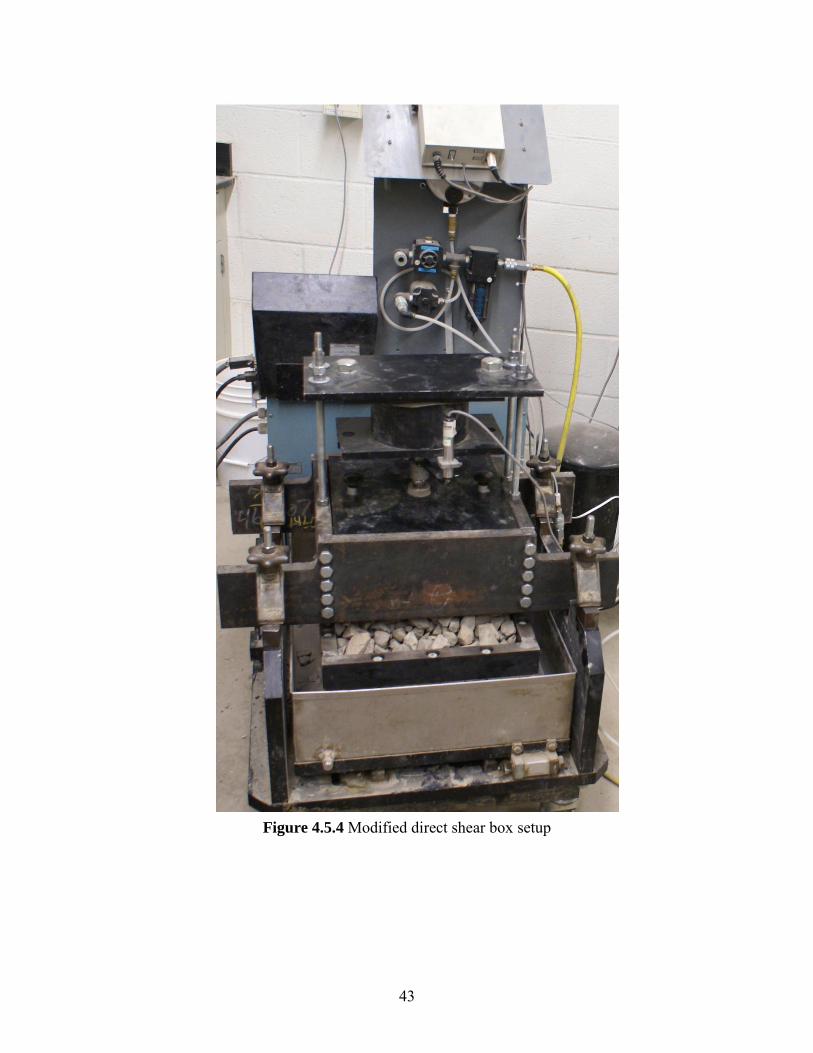
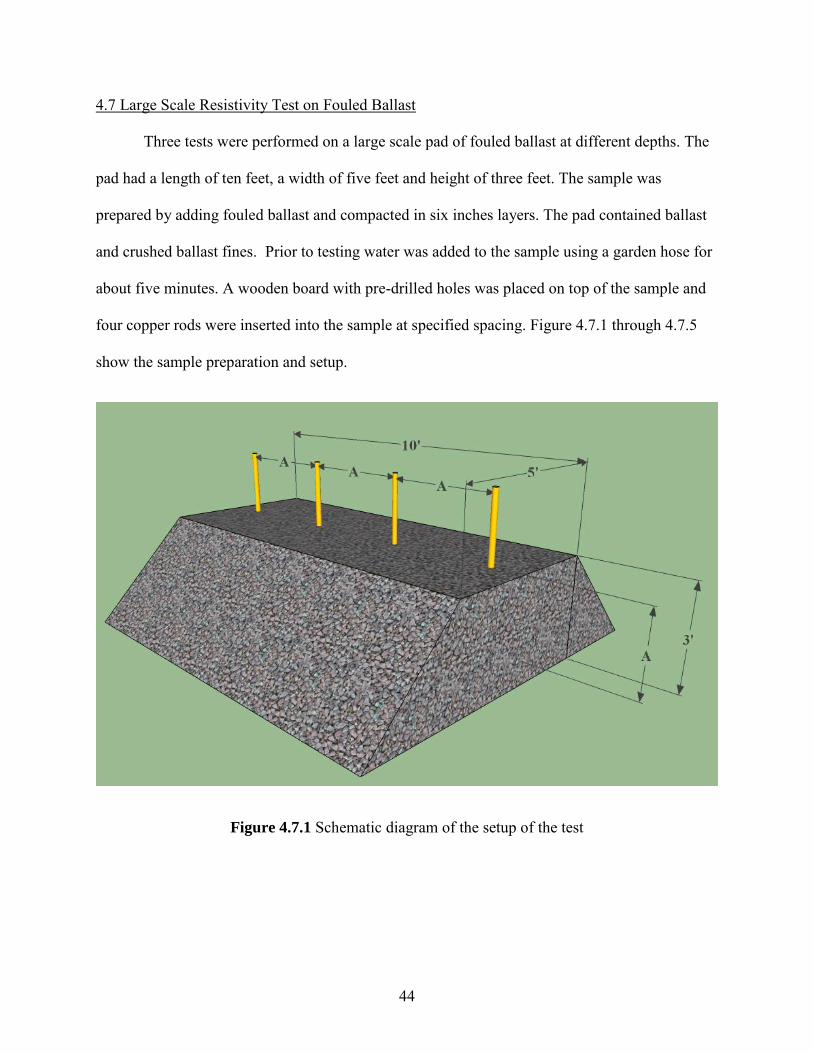

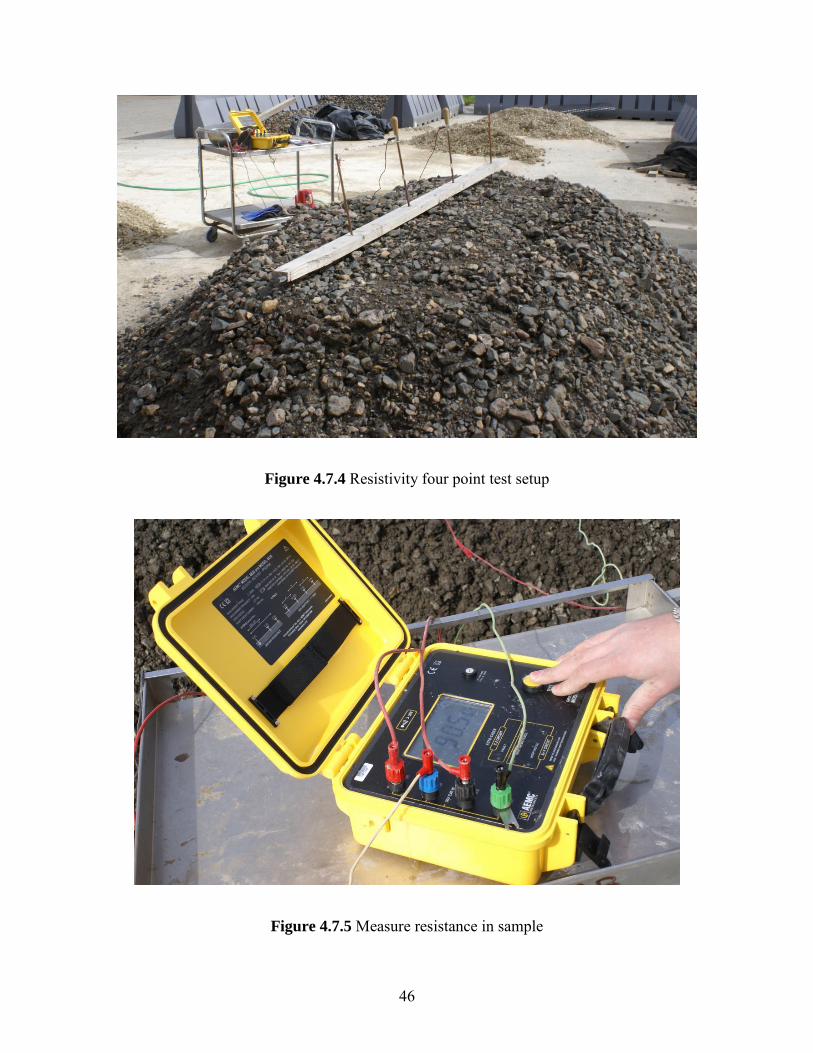
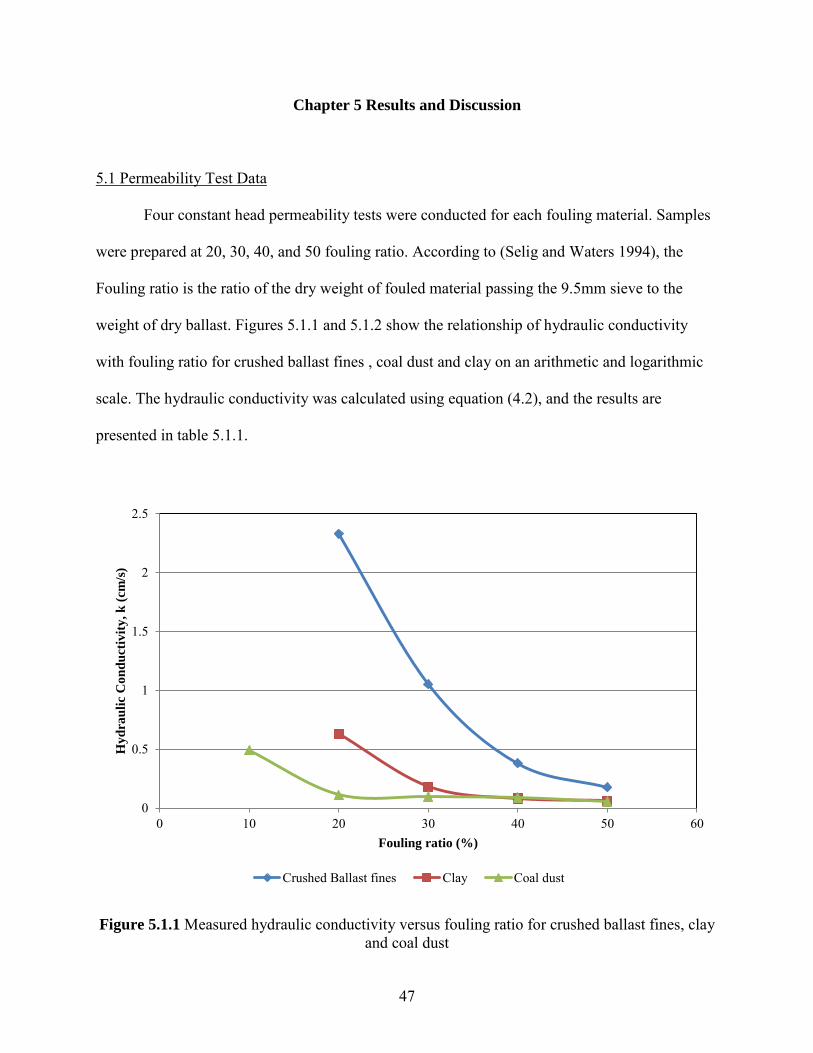
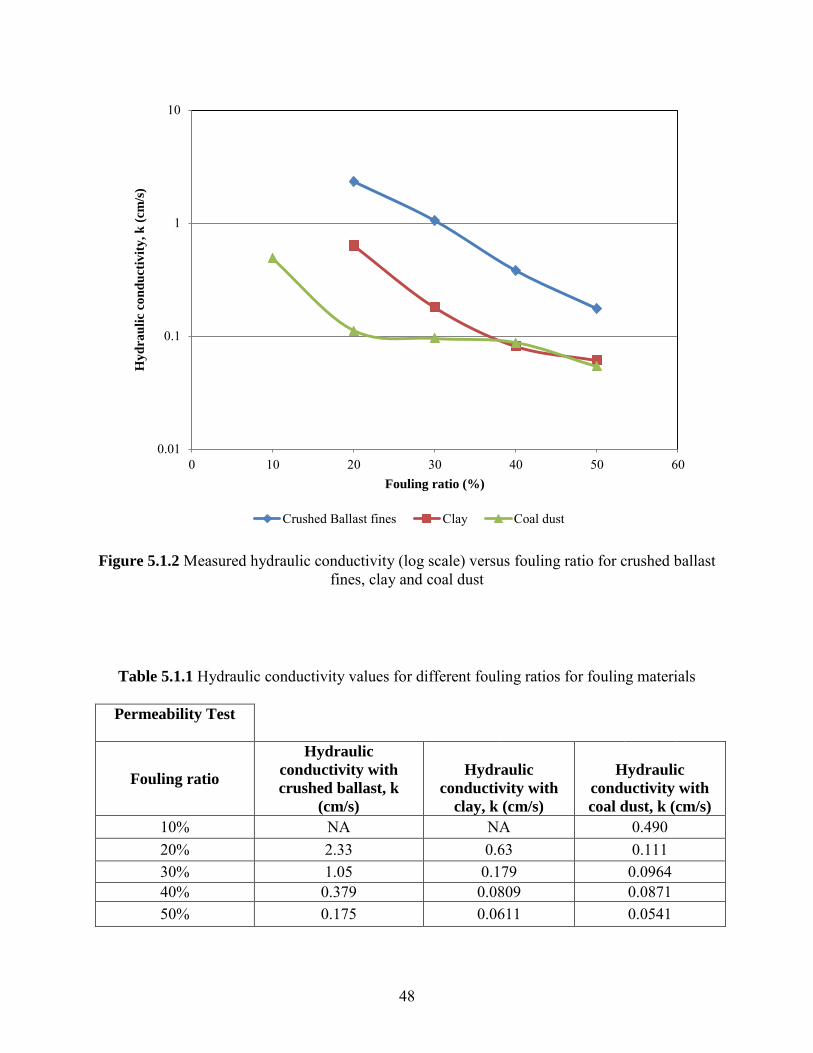
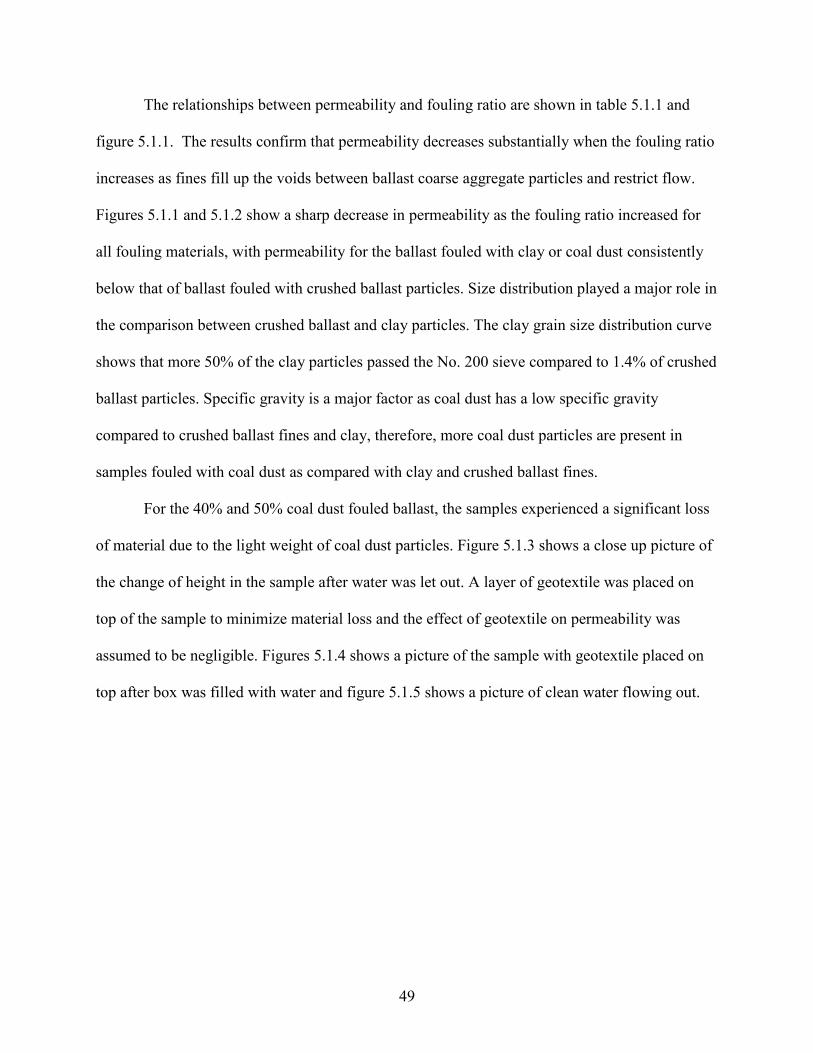


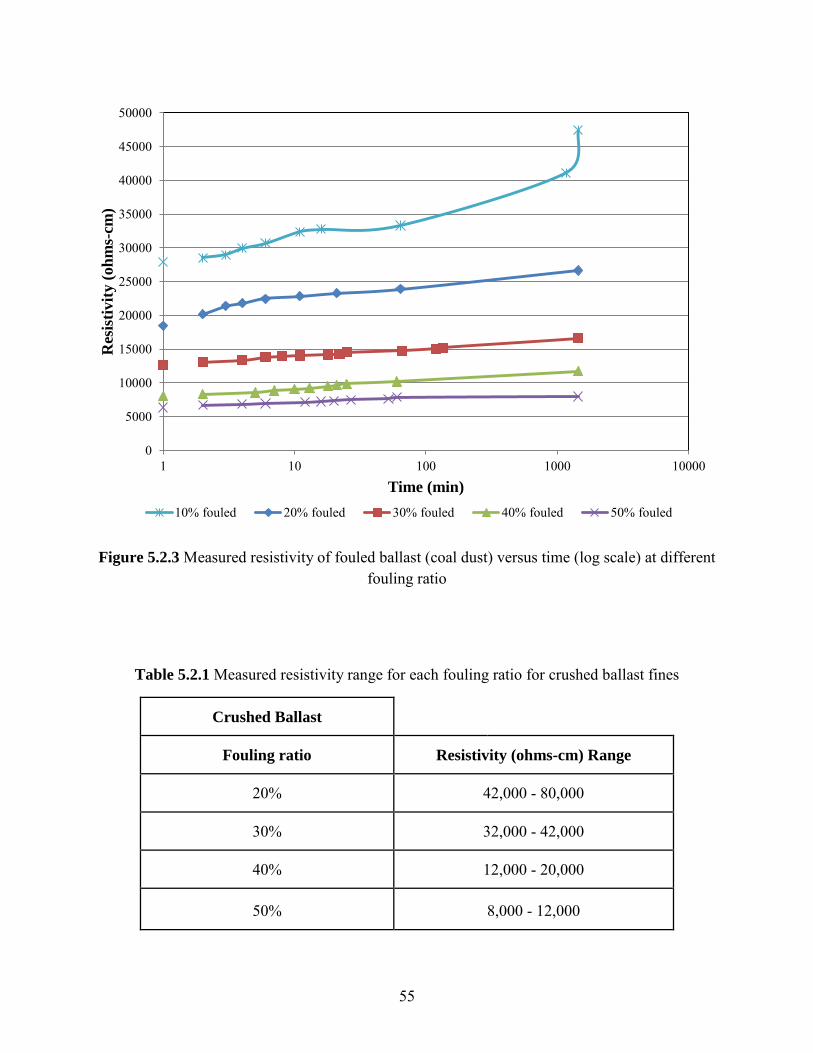


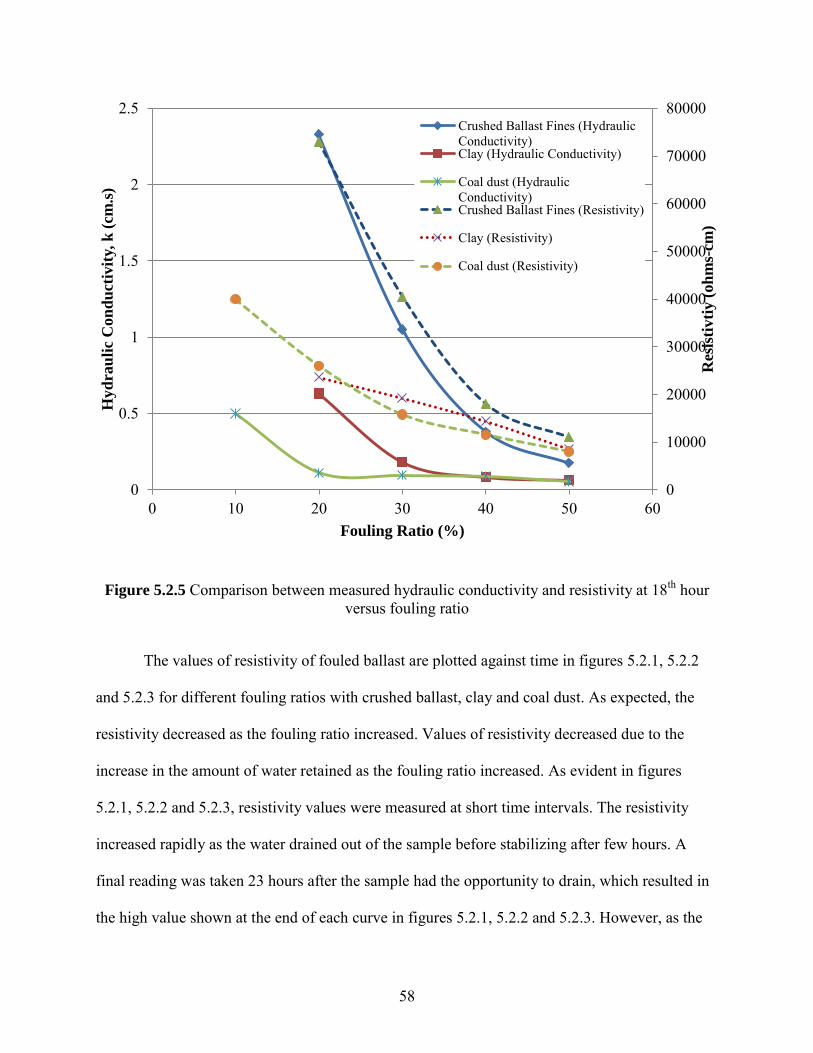


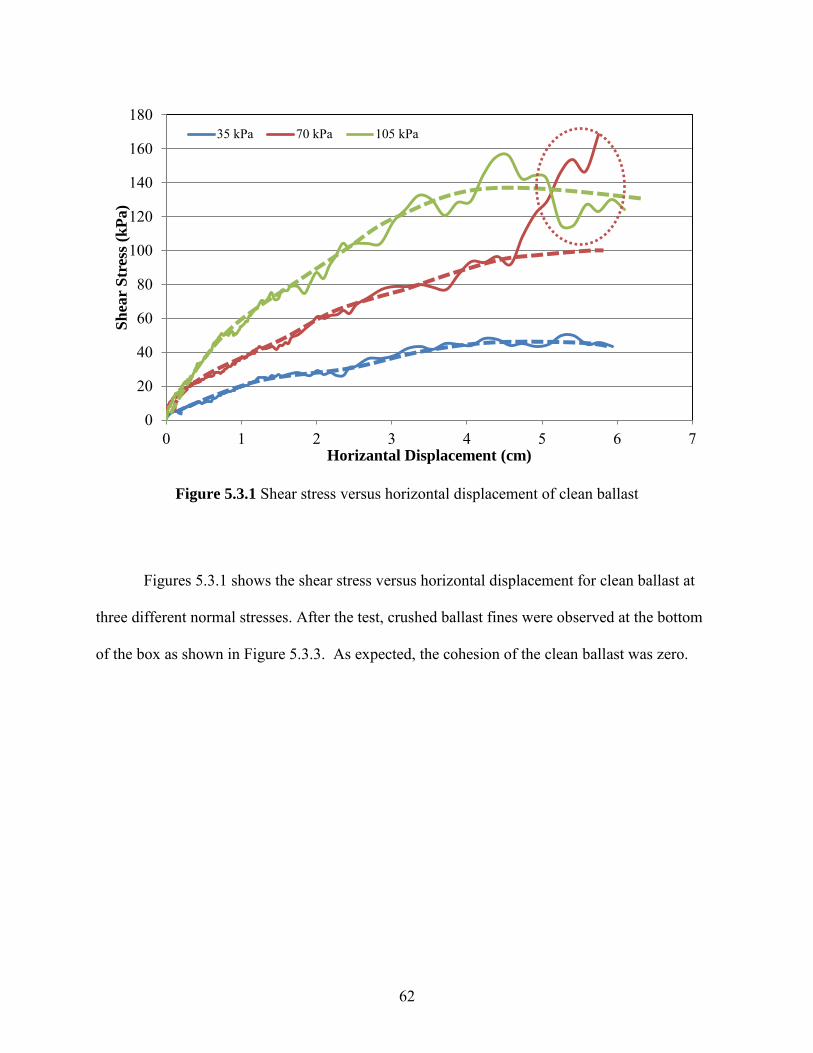
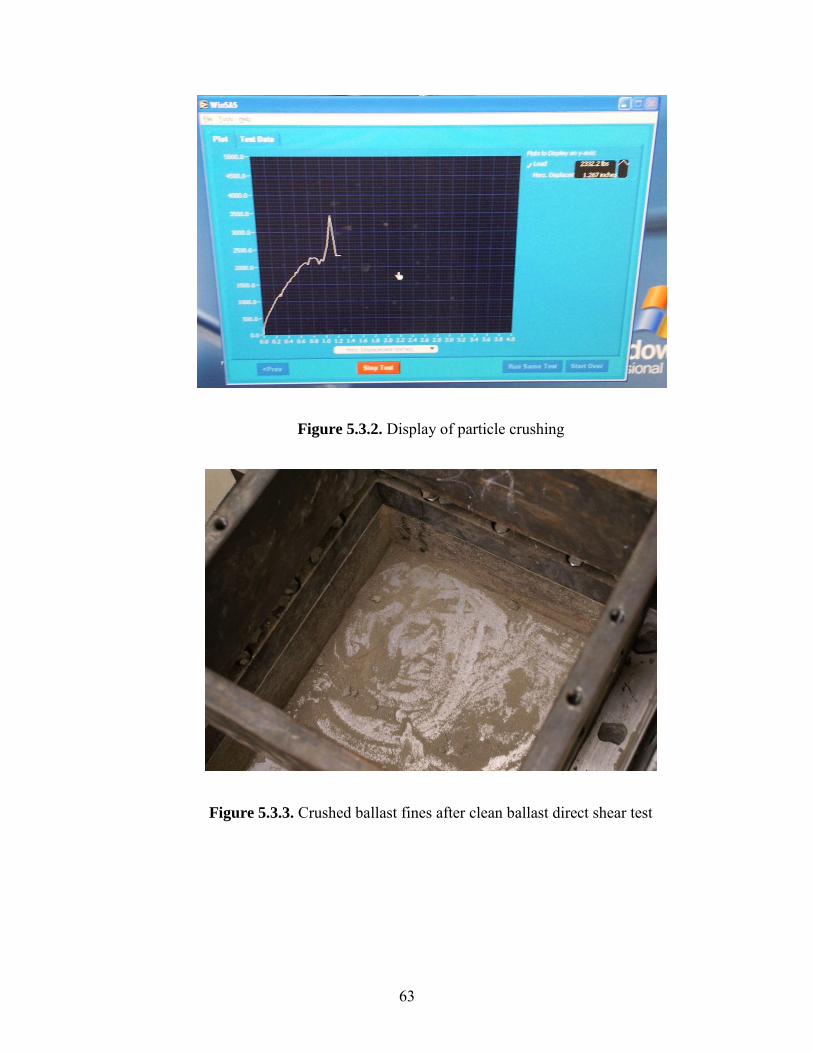


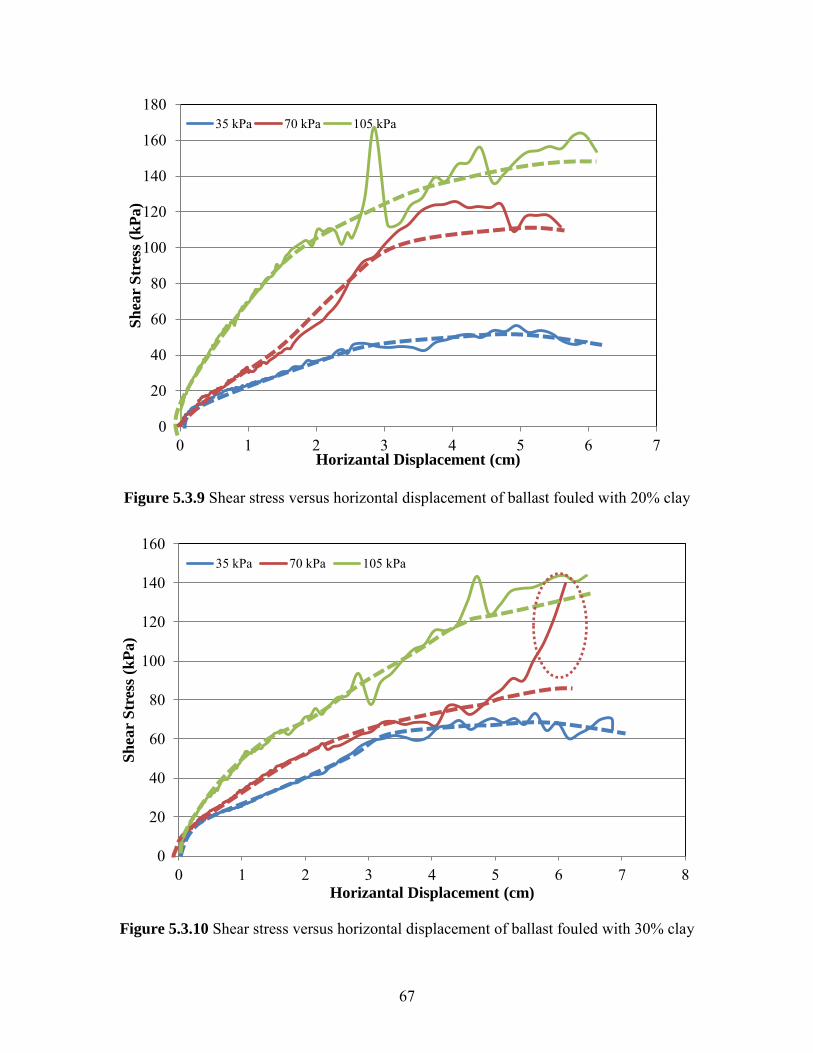


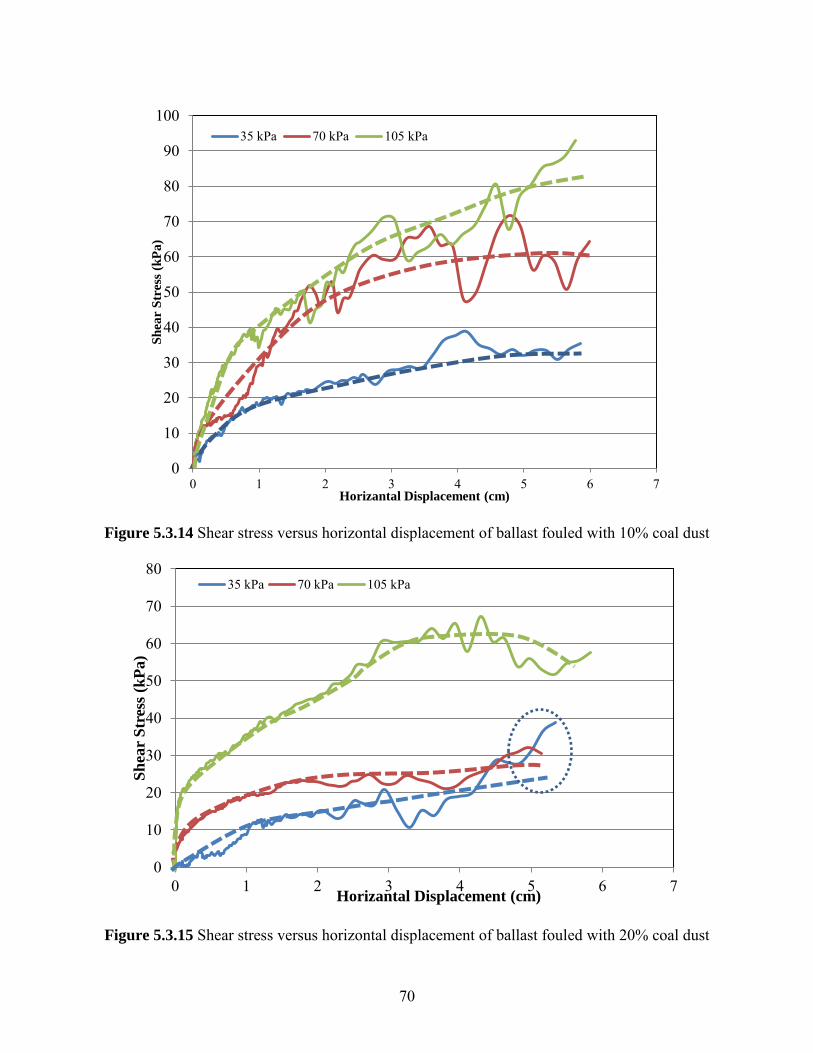
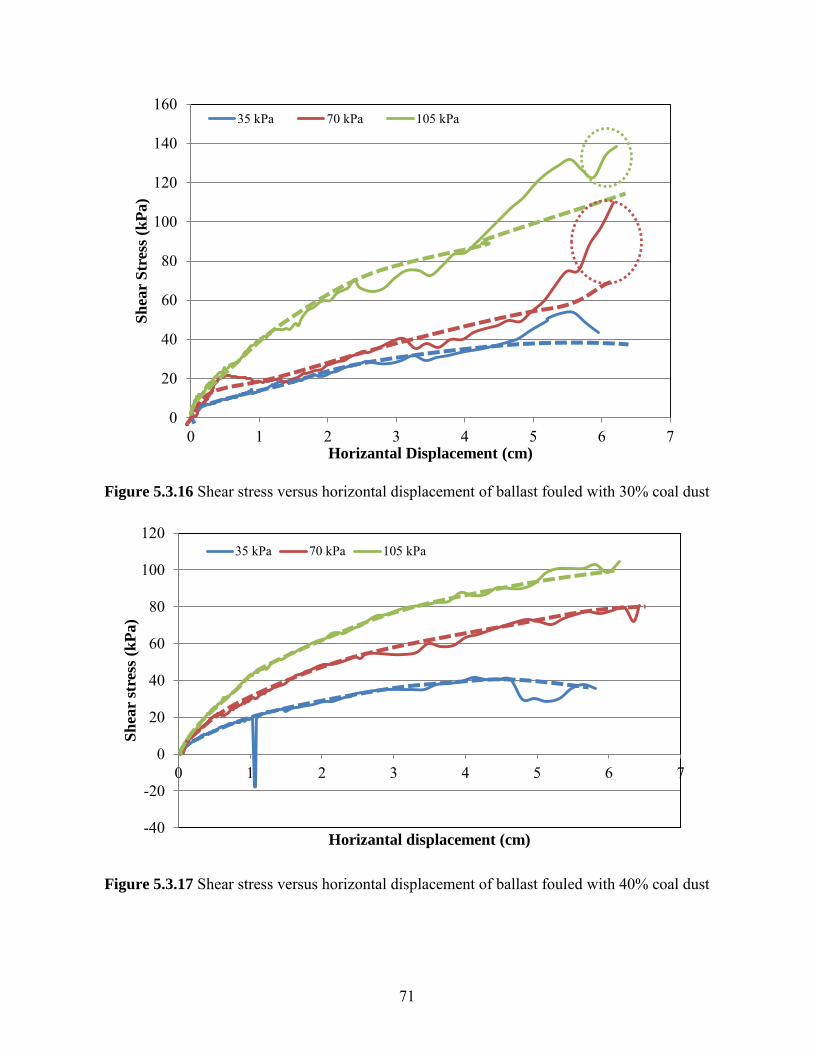


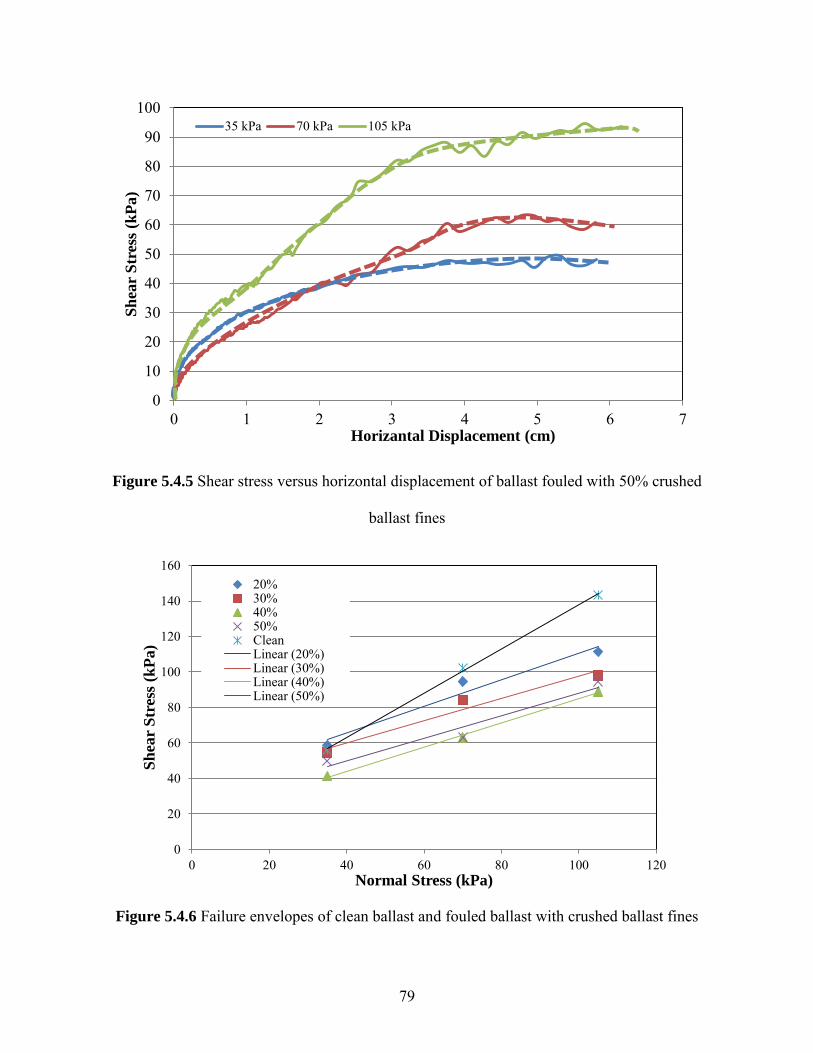

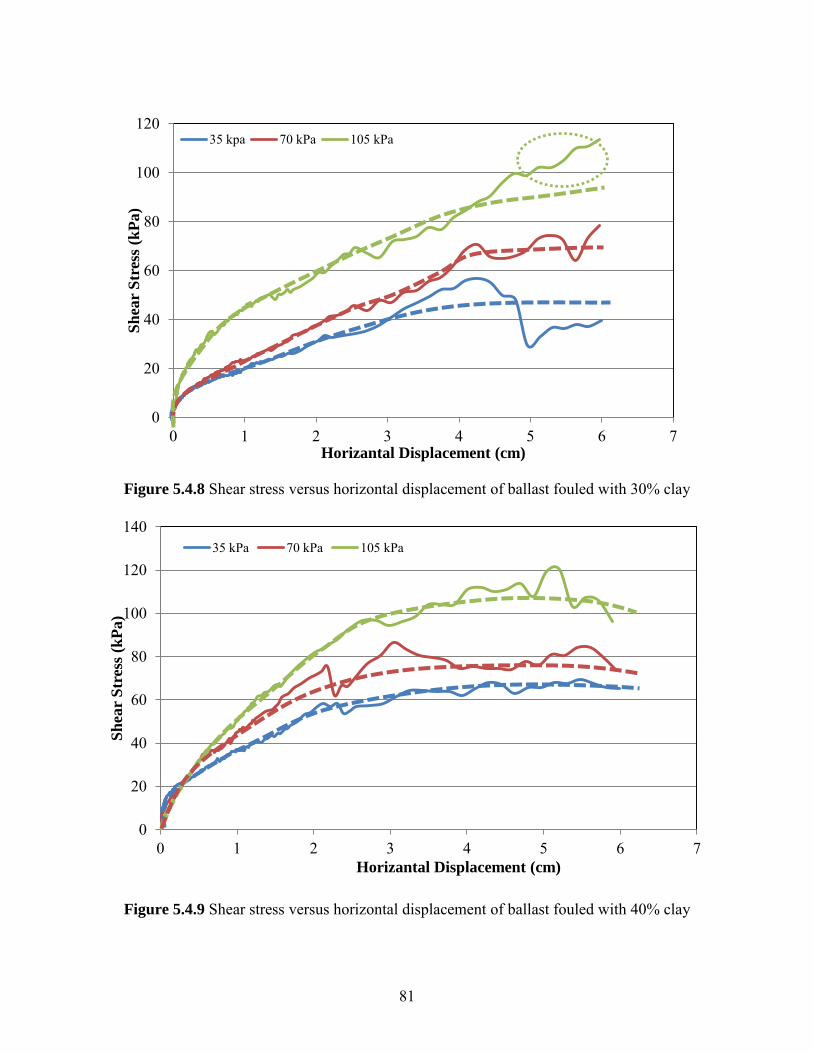
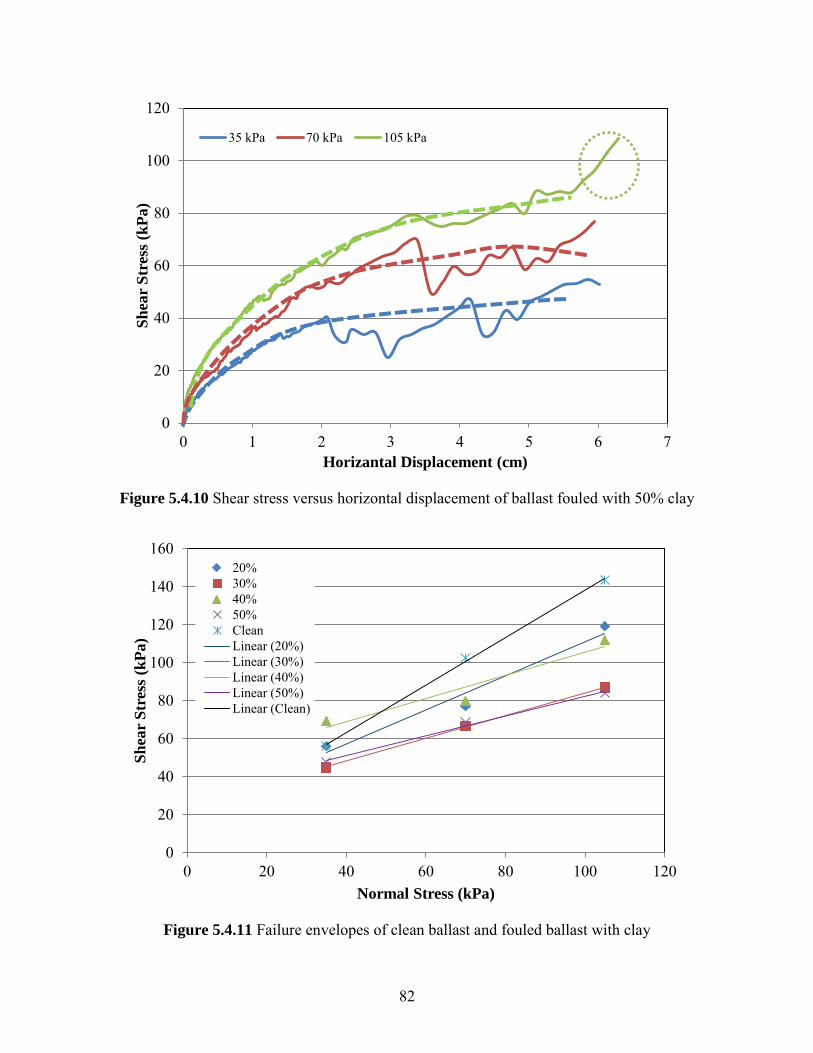
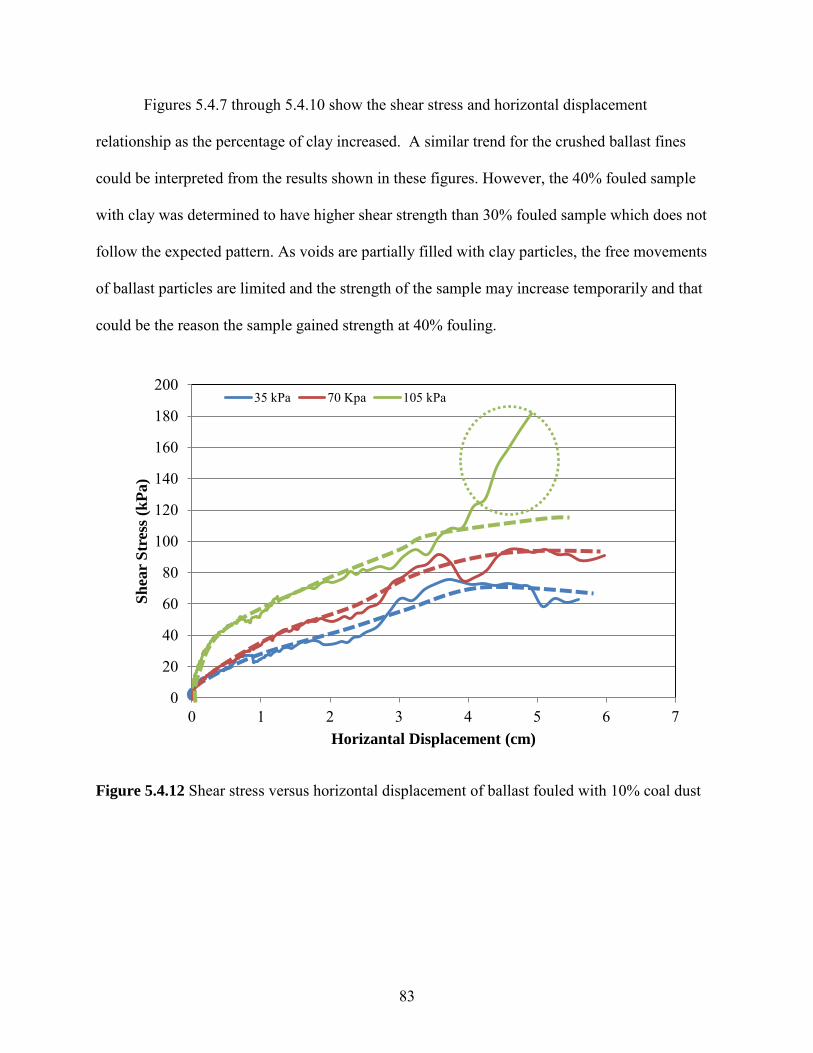
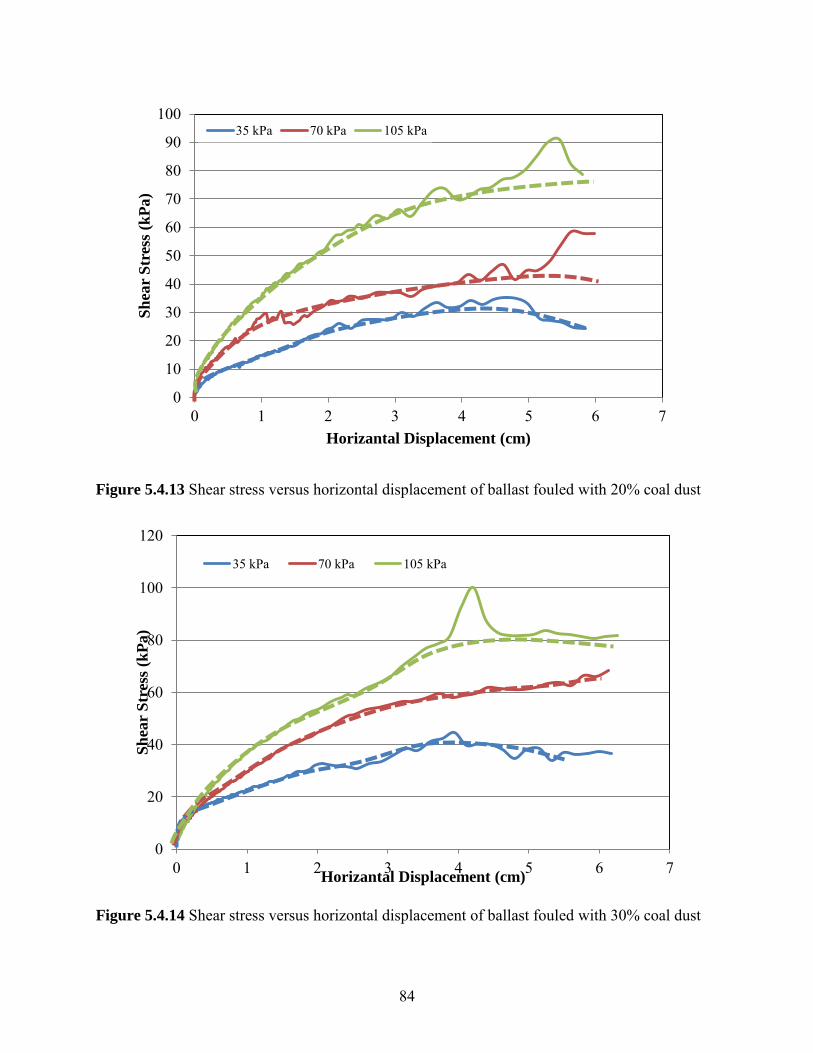


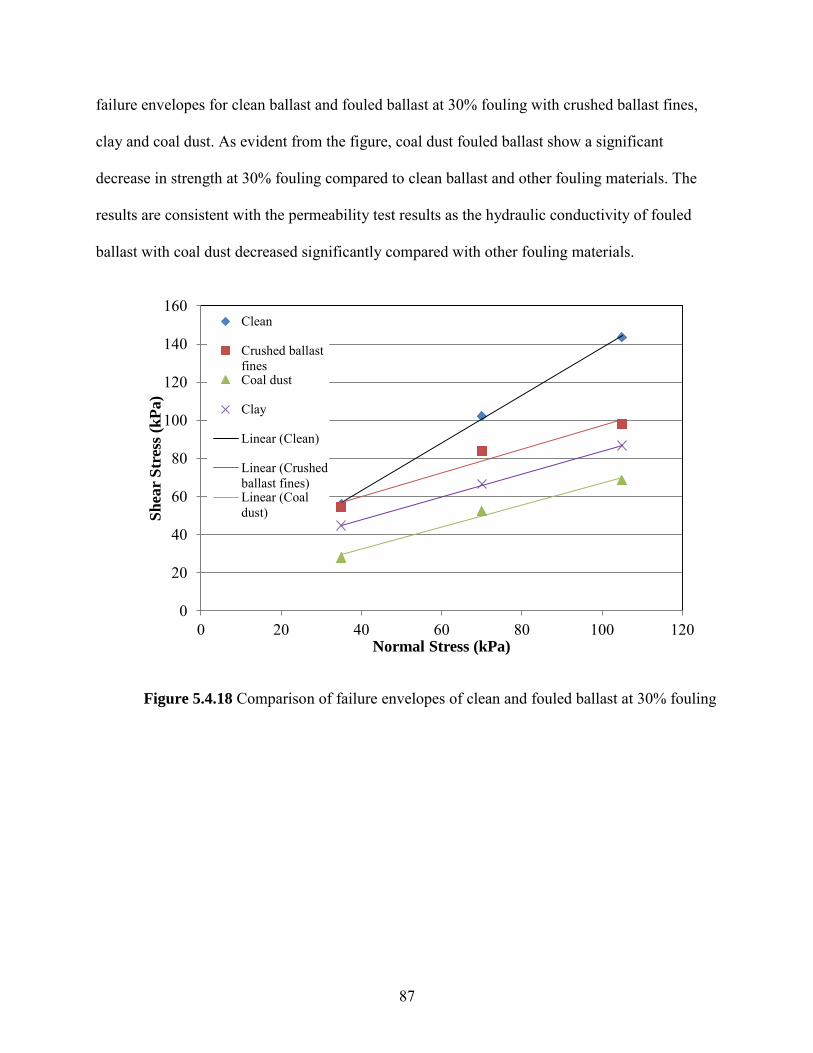


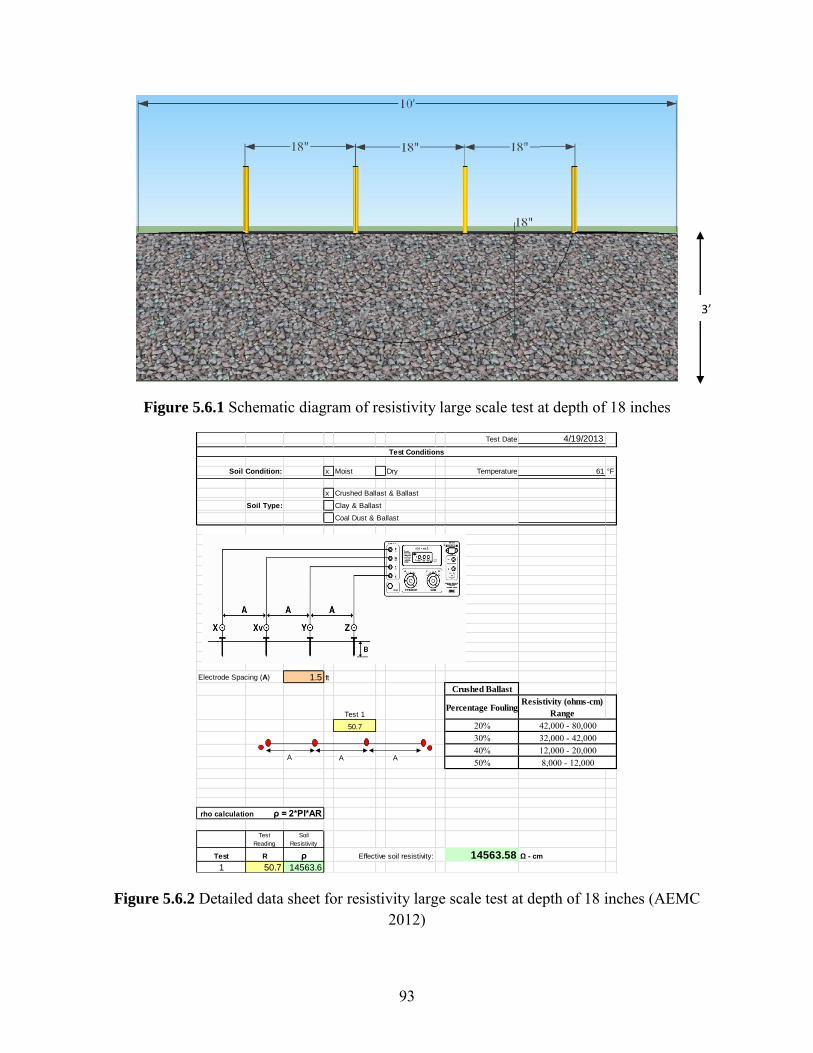
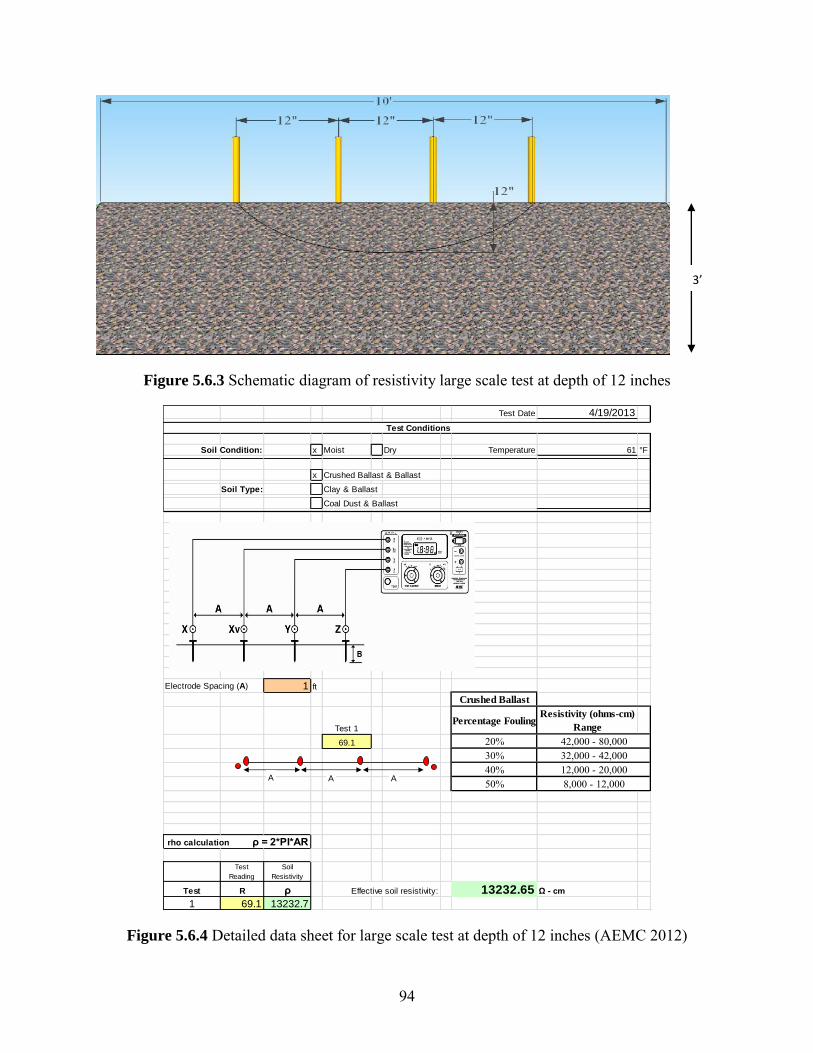


![18-01-2017 Version 0 · figure 8: traffic light concept (from [cce2012] ) 43 figure 9: use case overview of ochp protocol (excl. ochpdirect) 46 figure 10: use case overview of ochpdirect](https://static.documents.pub/doc/80x56/60061e5c48e82142ec18b06a/18-01-2017-version-0-figure-8-traffic-light-concept-from-cce2012-43-figure.jpg)


