WP/16/175 Profitability and Balance Sheet Repair of Italian Banks by Andreas (Andy) Jobst and Anke Weber IMF Working Papers describe research in progress by the author(s) and are published to elicit comments and to encourage debate. The views expressed in IMF Working Papers are those of the author(s) and do not necessarily represent the views of the IMF, its Executive Board, or IMF management.
Transcript
WP/16/175
Profitability and Balance Sheet Repair of Italian Banks
by Andreas (Andy) Jobst and Anke Weber
IMF Working Papers describe research in progress by the author(s) and are published to elicit
comments and to encourage debate. The views expressed in IMF Working Papers are those of the
author(s) and do not necessarily represent the views of the IMF, its Executive Board, or IMF
1 We thank staff from the Supervisory and Economics Departments of the Bank of Italy as well as Rishi Goyal, Phakawa Jeasakul, Kenneth Kang, Dermot Monaghan, Hiroko Oura, and Camelia Minou for their helpful comments and suggestions. We are also grateful to staff from the Directorate General for Macro-Prudential Policy and Financial Stability and the Directorate General Micro-Prudential Supervision I–IV at the European Central Bank (ECB) for their feedback on parts of this analysis, which was used in the 2016 Article IV Consultation Staff Report for the Euro Area (IMF, 2016a). See Jobst and Weber (2016) for an earlier version.
IMF Working Papers describe research in progress by the author(s) and are published to
elicit comments and to encourage debate. The views expressed in IMF Working Papers are
those of the author(s) and do not necessarily represent the views of the IMF, its Executive Board,
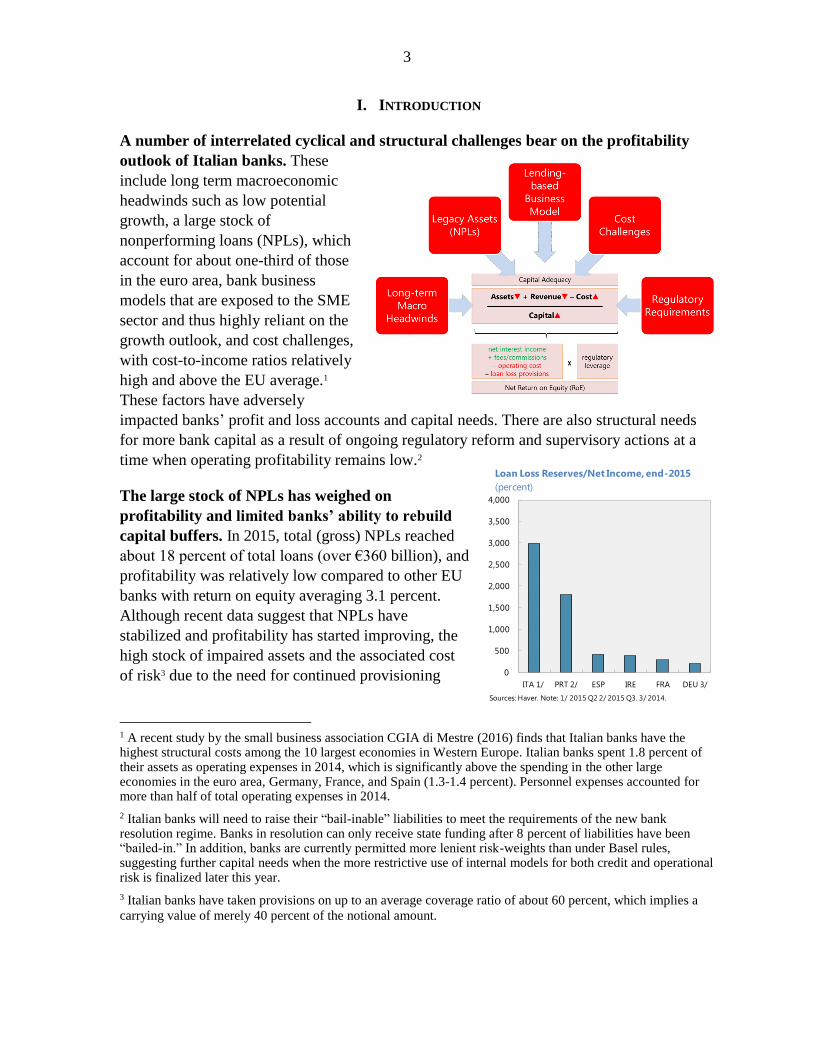
A number of interrelated cyclical and structural challenges bear on the profitability
outlook of Italian banks. These
include long term macroeconomic
headwinds such as low potential
growth, a large stock of
nonperforming loans (NPLs), which
account for about one-third of those
in the euro area, bank business
models that are exposed to the SME
sector and thus highly reliant on the
growth outlook, and cost challenges,
with cost-to-income ratios relatively
high and above the EU average.1
These factors have adversely
impacted banks’ profit and loss accounts and capital needs. There are also structural needs
for more bank capital as a result of ongoing regulatory reform and supervisory actions at a
time when operating profitability remains low.2
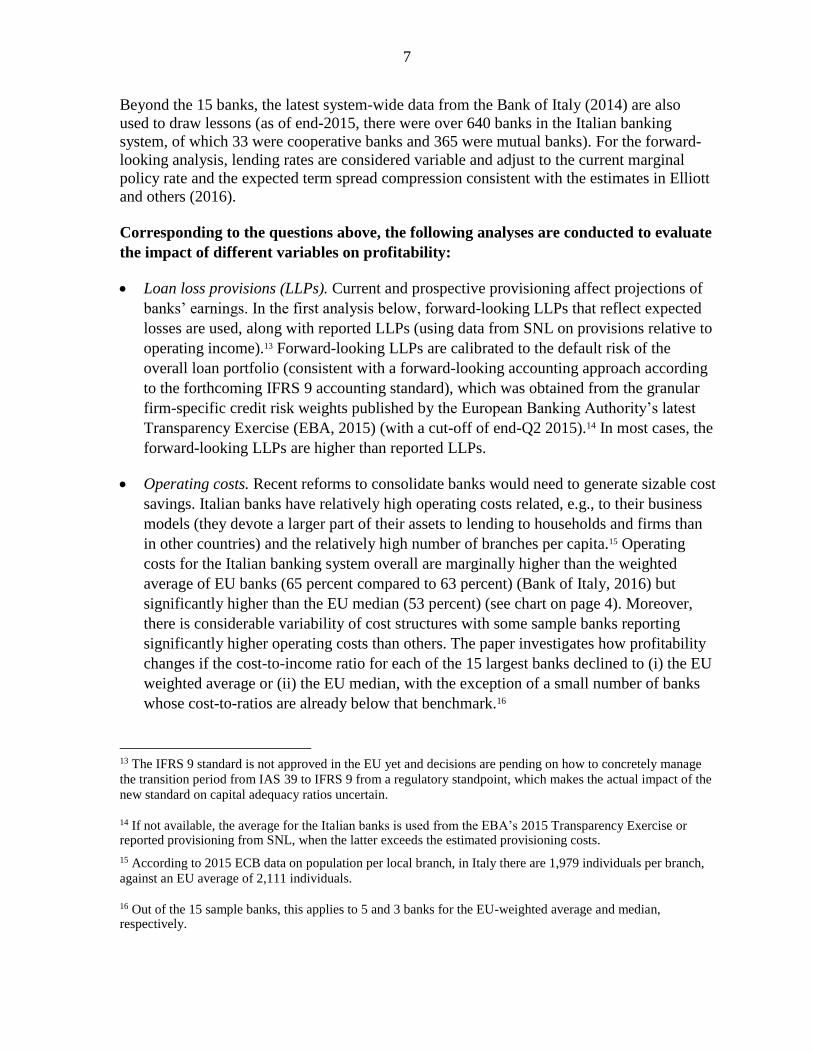
The large stock of NPLs has weighed on
profitability and limited banks’ ability to rebuild
capital buffers. In 2015, total (gross) NPLs reached
about 18 percent of total loans (over €360 billion), and
profitability was relatively low compared to other EU
banks with return on equity averaging 3.1 percent.
Although recent data suggest that NPLs have
stabilized and profitability has started improving, the
high stock of impaired assets and the associated cost
of risk3 due to the need for continued provisioning
1 A recent study by the small business association CGIA di Mestre (2016) finds that Italian banks have the highest structural costs among the 10 largest economies in Western Europe. Italian banks spent 1.8 percent of their assets as operating expenses in 2014, which is significantly above the spending in the other large economies in the euro area, Germany, France, and Spain (1.3-1.4 percent). Personnel expenses accounted for more than half of total operating expenses in 2014.
2 Italian banks will need to raise their “bail-inable” liabilities to meet the requirements of the new bank resolution regime. Banks in resolution can only receive state funding after 8 percent of liabilities have been “bailed-in.” In addition, banks are currently permitted more lenient risk-weights than under Basel rules, suggesting further capital needs when the more restrictive use of internal models for both credit and operational risk is finalized later this year.
3 Italian banks have taken provisions on up to an average coverage ratio of about 60 percent, which implies a
carrying value of merely 40 percent of the notional amount.
have dragged down banks’ earnings capacity;4 this, in turn, has limited the buildup of capital
buffers and slowed the repair of balance sheets. Alongside anemic demand, impaired balance
sheets have weighed down credit growth and the economic recovery. There is also a risk of
amplifying asset quality challenges in instances where profitability of new lending is
insufficient to offset the declining interest income from the existing loan book.
This paper evaluates quantitatively the current and prospective profitability of Italian
banks against the backdrop of the various challenges highlighted above. Using granular
bank-by bank data for the 15 largest banks that are supervised by the Single Supervisory
Mechanism (SSM), the paper focuses on the flow component of profitability. It looks at the
profitability of lending through the lens of the net return on equity, which in turn is a function
of net interest income, operating
cost, and loan loss provisions as
well as regulatory leverage (see
text figure above) and examines
potential solutions that can restore
credit growth and safeguard
financial stability. It asks the
following questions:
By how much would
profitability of current lending
improve if all of the 15 largest
banks were able to achieve a cost structure similar to the EU average or median?
What is the likely impact of the ECB’s TLTRO II on funding and lending rates, and how
does it affect or improve banks’ prospects for profitability? What is the potential for the
SSM banks to raise revenues through higher credit growth?
Do banks for which lending is still profitable under conservative provisioning have
enough capital to lend and support the recovery (and, thus, strengthen their own
resilience as a result)? What is the scope for decisive NPL resolution to free up capital
for lending?
How will the profitability of new lending evolve under alternative growth projections
given the lending-based business model of Italian banks?
Overall, the results show that the system is profitable overall, but that there is
significant heterogeneity among banks. The larger of the SSM banks are already relatively
profitable and could become more so through a reduction in costs and higher credit growth,
but the amount of new lending is generally constrained by existing capital buffers. There
4 The chart showing loan loss reserves is based on publicly available data reported by Haver Analytics. The heterogeneity of the banking sector in different countries and variations in country coverage influences the conclusions that can be drawn from a cross-country comparison.
0
10
20
30
40
50
60
70
80
90
DE HU FR GB IT PT GR IE SI AT BE NL LU DK PL HRMT LT ES RO SK SE FI CZ CY LV BG NO
EU Median
Sources: EBA Risk Dashboard.
Cost-to-Income Ratio, end-2015
(percent)
5
are some banks in the sample that generate little or slightly negative profitability from
lending under current conditions but are helped by monetary easing and cost cutting.
However, some banks are likely to continue struggling to be profitable—even under
favorable funding conditions due to the ECB’s monetary easing and/or after considering
improvements in operational efficiency—not least because the profitability of new lending
is insufficient to offset the declining interest income and high provisioning cost associated
with the existing loan book.
These findings point to a number of areas in which building on recent policy initiatives
would be useful. Repairing bank balance sheets is a policy priority, not least to facilitate new
lending and support the incipient economic recovery. The cross-country experience of
growing out of a debt overhang is generally that the economy grows, e.g., from an export-led
recovery that increases the capacity of borrowers to service their obligations or reduces the
relative share of impaired assets on bank balance sheets; or the economy inflates, reducing
the real value of impaired claims; or the public sector bails out the banking sector. Within the
euro area, neither inflation nor public sector bail-outs appear feasible, putting the onus on
other approaches to invigorate the “self-healing powers” of the banking system—such as
facilitating bank consolidation and paving the way for cost-cutting, reforming insolvency
regimes to enable workouts, and setting up other mechanisms to assist banks (e.g., GACS
and Atlas, see Box 2).5
The remainder of the paper is organized as follows: Section B describes the data and
methodology used. Section C presents the results, taking stock of the profitability of lending
of Italian banks under current conditions and under alternative scenarios (reduced operating
cost and ECB TLTRO II). It also examines available capital buffers for potential loan
growth, the potential for NPL resolution to free up capital and presents some analysis of the
profitability of new lending going forward under alternative growth scenarios. Section D
offers policy considerations.
II. DATA AND METHODOLOGY
The paper uses publicly available data from the SNL database of S&P Global Market
Intelligence for the 15 largest Italian banks that are supervised by the SSM. These banks
account for about 60 percent of system-wide assets.6 End-2015 quarterly data from SNL are
used or, if not available, the latest available annual data.7
5 The legislative reforms introduced in August 2015 and May 2016 are important steps that can help speed up insolvency processes and enforcement, especially for new lending going forward (Garrido, 2016).
6 Specifically, the following variables from SNL are used or constructed: net interest income/average assets, cost of funds, cost-income ratio, CAR ((Tier 1 capital +Tier 2 capital)/total risk-weighted assets), credit risk-weighted assets, fee and commission income/operating income, total gross loans, loan loss provisions/operating income, and net operating income.
7 For the quarterly cost-to-income ratios, we use the minimum of Q3 2015 and Q4 2015 since profit and loss statement data for several banks in the sample had been impacted by extraordinary contributions to the national
6
Profitability measure−For each of the 15 banks, profitability is calculated as the net
return on equity (RoE)8 based on net interest margins (NIMs), commissions/fee income,
and operating expenses in the reported profit and loss statement of each bank, after
accounting for firm-specific capitalization.9 The net RoE in year t is thus calculated as
where τ is the tax rate, LLP* denotes the soon-to-be-adopted forward-looking
provisioning standard10 (based on expected rather than incurred losses)11 implied by the
average risk-weighted assets (RWA) reported by each bank for end-June 2015 in the
recent Transparency Exercise of the European Banking Authority (EBA), and CAR
denotes the capital adequacy ratio to determine the implicit regulatory leverage.
Sustainability of interest margins−Using historical bank level data, we also compare
lending spreads (derived from NIMs) and provisioning expenses contemporaneously to
assess ex post whether banks would have been able to maintain their profitability under
expected loss provisioning in the face of rapidly rising asset impairments over the last 10
years (between 2006 and 2015). Thus, we assess whether the actual lending rate is greater
than the amount of after-tax net operating income required to cover recurrent
provisioning costs and operating expenses
actual lending ratet −1
(1 − τ)(lending spreadt +
fees and commissionst−(operating costt + LLPt−1
∗ )
operating incomet)
⏟ minimum lending rate
≥ 0. 12
resolution fund in Q4 2015. For the time series analysis, we exclusively use annual data. The results from our analysis of bank profitability as of end-2015 are thus mildly influenced by the choice of data frequency with our annual estimates for net RoE for the largest Italian banks being a bit lower than if we used 2015 quarterly data, but the overall conclusions of the paper still hold.
8 The term “return on equity” is used as a generic reference to leveraged income, with equity referring to CAR.
9 A tax rate of 35 percent is assumed for all banks.
10 The calculation of LLP is shown in Appendix, Box A1. We also perform the same calculation for reported LLP for robustness. For actual provisions, end-Q3 2015 was chosen where available (otherwise annual 2015 data were used) since most banks reported significant one-off increases in LLP due to the ECB’s on-site requests or management decisions to increase coverage during the last quarter of 2015.
11 Under the forthcoming IFRS 9 standard, for loans where no significant increase in credit risk has (yet) occurred, provisions are set to the expected losses in the next 12 months. However, if a “significant increase in credit risk” is deemed to have occurred, provisions increase such that losses expected from events over the lifetime of a loan are provisioned against.
12 The lending spread is defined as the difference between the loan rate and the cost of funding; the RWAs underpinning the calculation of expected LLP were obtained from each bank’s public accounts at end-2015 (rather than the EBA 2015 Transparency Exercise) in order to maintain data consistency relative to the previous years during which separate data on RWAs was not available.
7
Beyond the 15 banks, the latest system-wide data from the Bank of Italy (2014) are also
used to draw lessons (as of end-2015, there were over 640 banks in the Italian banking
system, of which 33 were cooperative banks and 365 were mutual banks). For the forward-
looking analysis, lending rates are considered variable and adjust to the current marginal
policy rate and the expected term spread compression consistent with the estimates in Elliott
and others (2016).
Corresponding to the questions above, the following analyses are conducted to evaluate
the impact of different variables on profitability:
Loan loss provisions (LLPs). Current and prospective provisioning affect projections of
banks’ earnings. In the first analysis below, forward-looking LLPs that reflect expected
losses are used, along with reported LLPs (using data from SNL on provisions relative to
operating income).13 Forward-looking LLPs are calibrated to the default risk of the
overall loan portfolio (consistent with a forward-looking accounting approach according
to the forthcoming IFRS 9 accounting standard), which was obtained from the granular
firm-specific credit risk weights published by the European Banking Authority’s latest
Transparency Exercise (EBA, 2015) (with a cut-off of end-Q2 2015).14 In most cases, the
forward-looking LLPs are higher than reported LLPs.
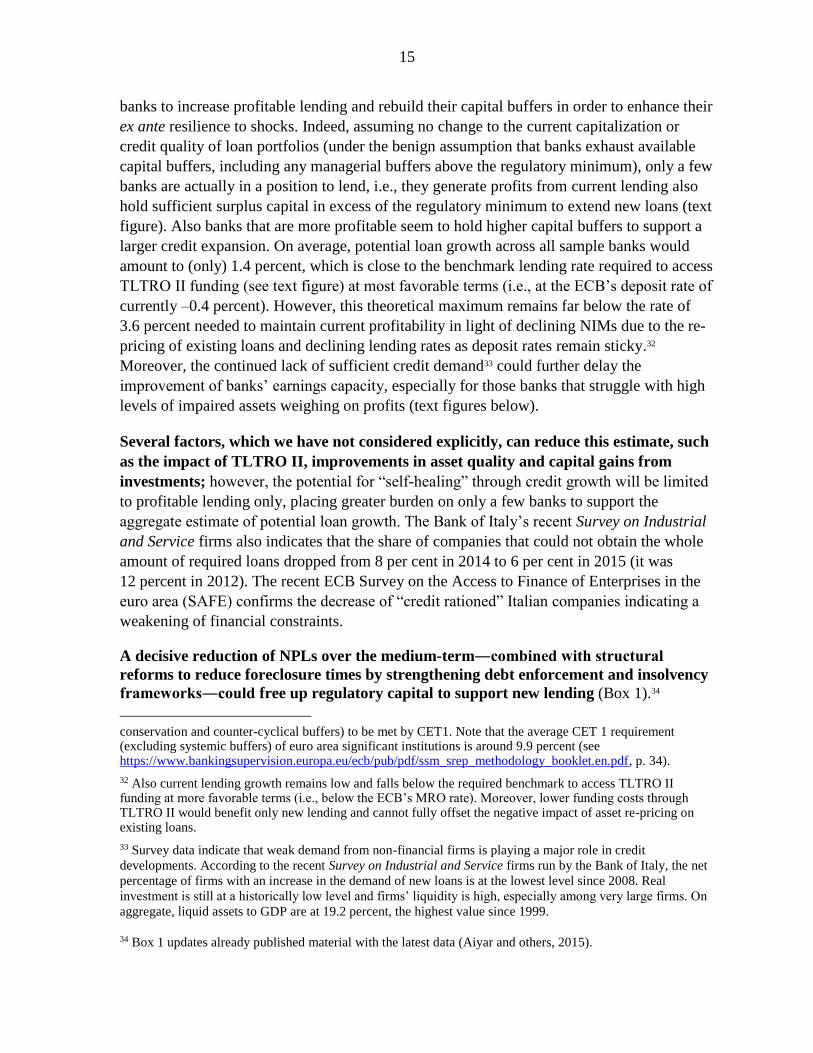
Operating costs. Recent reforms to consolidate banks would need to generate sizable cost
savings. Italian banks have relatively high operating costs related, e.g., to their business
models (they devote a larger part of their assets to lending to households and firms than
in other countries) and the relatively high number of branches per capita.15 Operating
costs for the Italian banking system overall are marginally higher than the weighted
average of EU banks (65 percent compared to 63 percent) (Bank of Italy, 2016) but
significantly higher than the EU median (53 percent) (see chart on page 4). Moreover,
there is considerable variability of cost structures with some sample banks reporting
significantly higher operating costs than others. The paper investigates how profitability
changes if the cost-to-income ratio for each of the 15 largest banks declined to (i) the EU
weighted average or (ii) the EU median, with the exception of a small number of banks
whose cost-to-ratios are already below that benchmark.16
13 The IFRS 9 standard is not approved in the EU yet and decisions are pending on how to concretely manage
the transition period from IAS 39 to IFRS 9 from a regulatory standpoint, which makes the actual impact of the
new standard on capital adequacy ratios uncertain.
14 If not available, the average for the Italian banks is used from the EBA’s 2015 Transparency Exercise or reported provisioning from SNL, when the latter exceeds the estimated provisioning costs.
15 According to 2015 ECB data on population per local branch, in Italy there are 1,979 individuals per branch,
against an EU average of 2,111 individuals.
16 Out of the 15 sample banks, this applies to 5 and 3 banks for the EU-weighted average and median, respectively.
8
ECB’s TLTRO II. To investigate the effect of credit easing on the profitability of lending,
a scenario is constructed in which all Italian banks are assumed to participate in the
ECB’s new targeted longer-term refinancing operations (TLTRO II) as of June 2016. It is
further assumed that all banks cease to remunerate deposits, reducing their funding cost
to as low as the ECB’s marginal refinancing rate (MRO) of zero percent.17 At the same
time, lending rates are considered variable that adjust in response to the decline of the
marginal policy rate (i.e., ECB deposit rate) and the historical pass-through of term
premia to NIMs. These effects are estimated to lower the NIMs of Italian banks by
11 basis points on average (Elliot and others, 2016).18
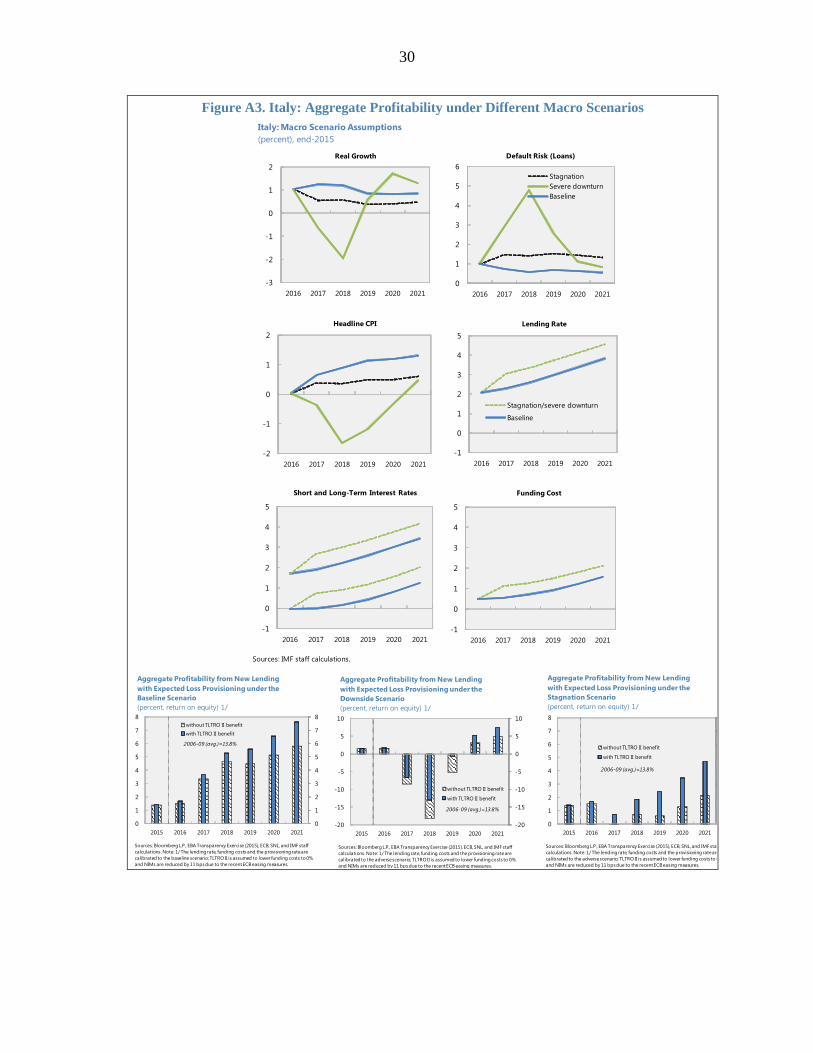
Macroeconomic conditions. Three alternative macro assumptions are considered for
assessing the impact of changes to the growth outlook on bank profitability: (i) staff’s
baseline scenario;19 (ii) a severe downturn scenario, in which real GDP growth declines
by more than 2 percentage points over the first two years (but recovers above baseline
after that); and (iii) a stagnation scenario in which annual GDP growth is one-half of that
in the baseline scenario (Appendix, Figure A3). This forward-looking analysis is
completed for the main components of net operating income (net interest margins) and
asset impairments of the overall banking system keeping all other profit and loss
elements unchanged, using the latest (2014) system-wide data from the Bank of Italy.
The historical sensitivity of loan default probabilities to nominal growth is used to
forecast changes in expected loss provisions,20 consistent with staff estimates of the
relevant macro scenarios for Italy.21 Future lending rates and funding costs are aligned to
projected changes in short- and long-term interest rates over a five-year forecast horizon,
17 Realigning the cost of refinancing to the marginal policy rate under TLTRO II (if banks meet a defined minimum rate of net lending growth) facilitates the pass-through of bank funding conditions to the real economy by encouraging more lending; it also helps maintain bank profitability, especially in countries where banks face high cost of risk and have refrained from lowering lending rates to preserve profit margins without jeopardizing their deposit base.
18 This assumption generalizes changes in the cost of funding, which might overstate the actual benefit from improved funding conditions in some countries. For instance, in the case of Italy, only the largest banks in the sample can access capital markets, and many (smaller) banks are faced with a relatively more challenging liquidity situation.
19 This corresponds to staff projections in the 2016 Article IV Consultation Staff Report for Italy (IMF, 2016b).
These do not take into account potential effects from the U.K. referendum.
20 However, the impact of low (real) interest rates on the debt repayment capacity of borrowers is not considered in the current environment of low inflation and monetary accommodation. A decline in the default rates could actually reduce the flow of provisions due to a decline in the credit risk of new lending underpinning the calculation of risk weights (Appendix, Box A1), which would help stabilize the amount of LLP.
21 Probabilities of default (PDs) are taken from Garrido and others (2016). The correlation of nominal growth with corporate PDs is estimated at 72 percent. The estimated corporate loan PD for 2014 is 1.8 percent.
9
accounting for the funding mix of Italian banks at end-2015,22 while a gradual phase-in of
TLTRO as a funding source is assumed.
Capital. Finally, the paper investigates the amount of new bank lending that can be
supported by available capital buffers. Even if lending were profitable, capital buffers
may be adequate for only a certain quantum of new lending. To this end, the available
capital buffer is calculated, taking into account Pillar I and II capital requirements under
the recent ECB’s Supervisory Review and Evaluation Process (SREP). Potential net loan
growth is then calculated assuming unchanged CAR and overall credit quality of the loan
portfolio and a minimum capital buffer of 2 percentage points over the minimum of
12.7 percent. 23
III. RESULTS
Profitability of Current Lending and Provisioning Levels
Current lending is profitable for the larger sample banks—including under the
assumption of forward-looking provisions24—but some smaller banks are likely to
continue generating losses, owing to low interest earnings (including from high NPLs)
and high operating costs.
Under expected LLP, current lending by about
half of the banks in the sample—about
83 percent of the banking sector in terms of total
outstanding loans—generate profits amounting
to a system-wide weighted-average annual net
return on equity (RoE) of 0.7 percent at end-
2015. However, a disaggregated analysis reveals
that a number of smaller banks (representing
about one-eighths of total loan volume of all
banks in the sample) are likely to experience
losses. While the cost of funding is broadly
comparable to those in other euro area countries,
the high level of LLPs in relation to net income
22 Staff also assumes that, in the stagnation and downturn scenarios, spreads are 75 bps wider than in the baseline scenario.
23 The threshold of 12.7 percent comprises the CET1 capital requirement of 4.5 percent under Pillar I, a capital conservation
buffer of 2.5 percent, and Pillar 2A and 2B requirements of 2.7 percent and 3.0 percent, respectively.
24 This reflects expected losses extrapolated from the default risk of the current loan portfolio (consistent with the forthcoming accounting standard IFRS 9). The assumption of forward-looking provisions using past loan performance reflected in RWs assumes that (i) banks do not change their loan origination to improve the average credit risk of their banking book, and (ii) the debt service capacity of borrowers remains unchanged relative to the historical experience.
-7
-6
-5
-4
-3
-2
-1
0
1
2
3
Top Tier* Medium Tier Bottom Tier
weighted average
Italy: Estimated Net Return on Equity of Current Lending and
Expected Loss Provisions
(percent), end-2015 1/
Net
Retu
rn o
n E
qu
ity
Sources: Bloomberg L.P., SNL and IMF staff calculations. Note: */ The sample was
split into three tiers (of 5 banks each), ordered by expected loss provisions (end-Q3
2015), weighted by total loans.
Low——Loan Loss Provisions——High
(percent of average assets)
10
reveals the fundamental problem of lack of profitability in core business caused by high
provisioning expenses and operating costs.
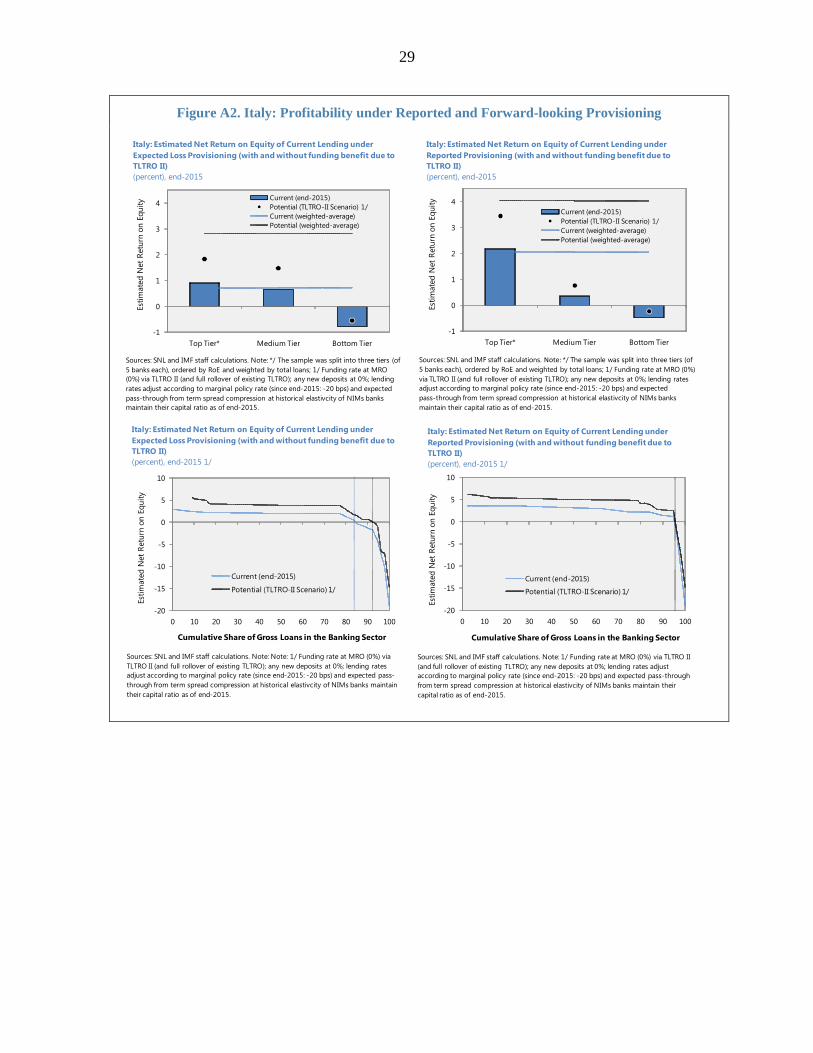
The calculations above are robust to the use of reported provisioning according the
existing accounting standard (IAS 39), and confirm that several smaller banks face
particular challenges. For the 15 largest banks, the weighted average net RoE improves
to 2.1 percent, but three smaller banks (accounting for about 5 percent of the outstanding
stock of loans in Italy) still generate losses from current lending (Figure A2). For the
system of a total of over 640 banks, the net RoE is somewhat lower at –1.6 percent
in 2014 according to the latest available data published by the Bank of Italy (and rises to
1.4 percent if projected to 2015 consistent with the performance of the 15 SSM banks in
the sample).25 These results highlight that there are a number of smaller banks in the
system with weaker asset quality and lower profitability than the 15 SSM banks.
In that regard, in recent years, the deterioration of asset quality in the Italian banking
sector seems to have outpaced banks’ ability for adequate provisioning. Extending the
analysis to historical data for the 15 sample banks—and assuming that banks would set aside
provisions according to expected losses26—suggests that, since 2012, lending rates on
25 2015 is an estimate based on 2014 system-wide data and 2015 data for the SSM banks in order to support a
statistically accurate data input for scenario analysis in the paper. The actual RoE of the system amounted to
2.6 percent in 2015 according to recently released data.
26 Note that the application of expected loss provisioning is not permitted under current accounting principles but helps illustrate how a rapid decline of loan performance could result in sizable adjustments to provisioning rates ex post, putting increasing pressure on interest rate margins from new lending.
0
1
2
3
4
5
0
1
2
3
4
5
Current (bank-
by-bank,
historical prov.)
2/
Current (bank-
by-bank, exp.
loss prov.) 3/
Current
(system-wide)
4/
Current (bank-
by-bank,
historical prov.)
2/
Current (bank-
by-bank, exp.
loss prov.) 3/
Current
(system-wide)
4/
Net return on equity
Net interest income
Sources: SNL and IMF staff calculations. Note: 1/ Funding rate at MRO (0%) via TLTRO II (and full rollover of existing TLTRO) ; any
new deposits at 0%; lending rates adjust according to marginal policy rate (since end-2015: -20 bps) and expected pass-through
from term spread compression at historical elasticity of NIMs banks maintain their capital ratio as of end-2015; 2/ end-2015 and
historical prov.=backward-looking provisioning (IAS 39); 3/ expected loss provisioning (consistent with IFRS 9); and 4/ based on
aggregate data reported by Banca d'Italia for end-2014, projected for 2015 as starting point for the scenario-based analysis.
Italy: Estimated Net Return on Equity from Current Lending (with and without funding
benefit from TLTRO II) 1/
(percent/percent of total assets)
with TLTRO II 1/without TLTRO II 1/
11
average were far below what would have been required for banks to fund sufficient loan loss
reserves ex post. Or put differently, and acknowledging the limits of such an analysis based
on comparative statics if credit conditions
reflected subsequent loan performance, the rise
of NPLs (and resultant provisioning needs) in
the past would have implied a higher minimum
lending rate for banks to maintain their
profitability.27 The picture looks somewhat
better based on reported provisioning, although
the general trend is the same (Figure A2). Past
lending growth seems to have been associated
with higher NPLs and, thus, lower net RoE for
smaller banks on average (Garrido and others,
2016). A high degree of banking sector
competition in an environment of excess supply
might also have contributed to lower lending rates than what would have been warranted by
banks’ existing cost structure and risk tolerance.
Potential Impact of a Reduction in Operating Costs
Greater operational efficiency and
incentives to raise loan loss reserves
during periods of higher profitability
would help enhance the resilience of the
banking sector. The conclusion of this
partial equilibrium analysis is not that raising
lending rates or tightening credit standards
would have solved the profitability problem,
as doing so would have dragged down real
economic activity, in turn further worsening
bank asset quality and raising funding costs.
Rather, alternative solutions are needed, such
as significantly lowering costs. Improving the
operational efficiency of all 15 SSM banks to
the euro area weighted average cost-to-
27 This analysis of a “break-even lending rate” assumes a contemporaneous relationship between lending rates and loan performance. In reality, the assessment of whether lending rates are adequate to break even requires a comparison of them with the (ex post) default rate of the underlying loans. Since repayment arrears (and corresponding provisioning expenses) in a given year are largely attributable to loans that were originated much earlier, a cohort analysis for different loan vintages (at different maturity tenors) would acknowledge the inherent time lag of how loan origination affects provisioning. However, given that both actual lending rates and asset quality of most Italian banks have continuously declined over the last four years, the application of contemporaneousness is analytically expedient and consistent with a medium-term assessment of profit sustainability.
-1
-0.5
0
0.5
1
1.5
3
3.5
4
4.5
5
5.5
6
6.5
7
2006 2007 2008 2009 2010 2011 2012 2013 2014 2015
Negative gap = loss-making (rhs)
Actual lending rate
Breakeven lending rate
Italy: Difference between Actual and Breakeven Lending
Rates for Sample Banks (Expected Loss Provisioning)
(percent, weighted average) 1/
Sources: Haver, SNL and IMF staff calculations. Note: 1/ weighed by total loans (as of end-
2015); expected loss provisions derived from risk-weighted assets (RWAs) as per methodology
described in Annex, Box A1.
Le
nd
ing
Ra
te (
perc
en
t)
-2
-1.5
-1
-0.5
0
0.5
1
1.5
2
2.5
3
Top Tier* Medium Tier Lower Tier
Current (end-2015)
Potential (EA median cost-income) 1/
Current (weighted-average)
Potential (weighted-average)
Italy: Estimated Net Return on Equity of Current Lending
(with and without improvement in cost efficiency)(percent), end-2015
Est
ima
ted
Ne
tR
etu
rn o
n E
qu
ity
(perc
en
t)
Sources: SNL and IMF staff calculations. Note: The sample was split into three tiers
(of 5 banks each), ordered by RoE and weighted by total loans ; 1/ assuming that all
banks improve their cost-income ratio to the euro area median (53 percent).
12
income ratio of 63 percent would result in a significant improvement of banks’ earnings
capacity from current (and future) lending, improving the weighted average net RoE by more
than 40 percent. If Italian banks were able to improve operational efficiency to that of the EU
median (53 percent), the weighted average net RoE would triple.
Potential Impact of Monetary Easing
Credit easing would improve overall bank profitability, but it is not expected to
materially alter the negative earnings
outlook for some smaller Italian banks.
The ECB’s TLTRO II facilitates the pass-
through of lower bank funding costs to
credit supply while mitigating the
potentially adverse impact of negative
rates on banks’ profitability. We find that
the weighted-average net RoE improves to
2.8 percent under expected loss
provisioning, assuming sufficient loan
demand. However, for one-third of the
banks in our sample, current lending
would still be unprofitable. Using reported
provisioning improves overall system
profitability to a weighted-average net
RoE of 4.0 percent, but there are still some
banks with weak profitability and three
banks that generate sizable negative returns from current lending (Figure A2).
These results suggest that there is significant heterogeneity among Italian banks in our
sample. There are some relatively profitable banks both under current conditions and
TLTRO II; some banks that generate little or slightly negative profitability from lending
under current conditions but may be helped by monetary accommodation (e.g., TLTRO II)
and improvements in operational efficiency; and some banks that would experience very
negative profitability even under optimal funding conditions.28
In addition, the impact of impaired assets on banks’ expected profitability raises the
cost of capital raising (to complement low (and potentially insufficient) profitability).
Compared to other euro area countries, the high level of impaired assets also weighs on the
capacity of banks to maintain their NIM. While the ECB’s monetary easing has reduced the
28 Carpinelli and Crosignani (2015 who analyzed the impact of the LTRO on Italian banks’ credit supply also
detect significant heterogeneity among banks. They find that only a handful of banks that were highly
dependent on wholesale funding took liquidity under this program and increased lending; while other banks
used the liquidity to increase their securities holdings.
-20
-15
-10
-5
0
5
10
0 10 20 30 40 50 60 70 80 90 100
Current (end-2015)
Potential (TLTRO-II Scenario) 1/
Italy: Estimated Net Return on Equity of Current Lending under
Expected Loss Provisioning (with and without funding benefit due
to TLTRO II)
(percent), end-2015 1/
Est
imate
d N
et
Retu
rn o
n E
qu
ity
Sources: SNL and IMF staff calculations. Note: Note: 1/ Funding rate at MRO (0%) via
TLTRO II (and full rollover of existing TLTRO); any new deposits at 0%; lending rates
adjust according to marginal policy rate (since end-2015: -20 bps) and expected pass-
through from term spread compression at historical elastivcity of NIMs banks maintain
their capital ratio as of end-2015.
Cumulative Share of Gross Loans in the Banking Sector
13
cost of borrowing, since Q3 2015 the equity risk premium of Italian banks has risen and
price-to-book ratios have declined, with the average cost of equity now exceeding the return
on equity. This largely reflects market expectations of deteriorating future profitability, and
limits the extent to which capital-constrained banks with would reduce credit (in absence of
sufficiently high-yielding but less capital-intensive lending opportunities).
Credit Growth and Capital Buffers
For larger, more profitable banks, higher credit growth is crucial to improve bank
profitability in an environment of declining interest rates. Given the wide deposit base of
Italian banks and the high proportion of
variable rate loans, the extent to which
deposit rates are sticky has a direct impact
on how the low interest rates affect bank
profitability. Thus, even if Italian banks
were to fund themselves increasingly via
money markets, lower wholesale funding
costs will benefit mostly new lending (due
to banks’ heavy reliance on deposit
funding) and does not offset the negative
impact of lower rates on existing loans if
credit growth is insufficient. As noted
earlier, the ECB’s recently expanded asset
purchase program and the negative
marginal policy rate have flattened the yield
curve and are estimated to lower the NIM of Italian banks by 11 basis points on average
EA
AUT
DEU
ESP
FRA
GRC
ITA
NLD
PRT
-20
-15
-10
-5
0
5
0.5 1.0 1.5 2.0 2.5 3.0
Ch
an
ge in
eq
uit
y p
rice
1/
Average net interest margin (NIM)
Change in Equity Price and Net Interest Margins
(percent change/percent of average assets)
Sources: Bloomberg, L.P.; and IMF staff calculations. Note: 1/ Change in
equity price between Sept. 2015 and March 2016.
0
5
10
15
20
25
30
35
40
-0.4 -0.2 0.0 0.2 0.4
Change in Net Interest Margin and
Nonperforming Exposures 1/
(percent change/percent of total exposure)
Sources: Bloomberg LP, EBA Transparency Exercise (2015) and IMF staff
calculations. Note: NPEs as of end-June 2015; change of NIM between June
2014 and March 2016.
Change in net interest margin (NIM)
Sto
ck o
f n
on
-perf
orm
ing
exp
osu
res
(NP
Es)
GRC
PRT
EA
DEU
ESPFRA
AUT
ITA
NLD
-2
0
2
4
6
8
-2
0
2
4
6
8
ESP ITA EA DEU FRA
Annual Loan Growth Required to Maintain
Current Net Interest Margin, end-2015
(y/y percent change) 1/
Required loan growth
Current loan growth (y/y, March 2016) 2/
Sources: Bloomberg L.P., EBA Transparency Exercise (2015), ECB, SNL, and IMF staff
calculations. Note: 1/ based on the historical pass-through of policy rates and the
elasticity of net interest margins to changes in term premia between Jan. 2010 and
Feb. 2016; total mortgage and corporate loans at end-2015 to EA residents.; scenario
is based on the estimated impact of the increase of monthly asset purchases (until
Sept. 2017) by the ECB and a reduction of the deposit rate by 10 bps (as per ECB
decision on March 10).
14
(Jobst and Lin, 2016).29 For banks to maintain profitability over the amortization period of
their current loan book, this potential reduction in the NIM implies ceteris paribus a need for
higher lending growth by at least 3.6 percent annually (or about 3.0 percentage points above
current credit growth).30 Hence, lower profitability from financial intermediation―amplified
by current structural challenges affecting bank performance―might override possible
mitigating effects from higher asset prices and pricing frictions.
However, capital and/or credit demand may not be high enough to allow sizable new
lending to help banks maintain profitability. Banks generally exceed the regulatory capital
adequacy requirements; thus, from a prudential viewpoint, there is no need for further capital.
But while most banks would generate profits from current lending, capital buffers may
suffice to support only a limited amount of new lending,31 constraining the capacity of viable
29 A conservative estimate of the pass-through suggests that a 10-basis-point decline in the effective policy rate
(overnight EONIA) results in 2-basis-point decline in aggregate NIM, and about half (50.9 percent) of the
expected compression of the term spread (based on its historical elasticity to central bank asset purchases)
translates into a reduction of aggregate NIM in the Italian banking sector.
30 Note that this analysis assumes that other sources of income as well as operational and provisioning costs remain unchanged. Lower interest rates increase the debt repayment capacity of borrowers and might actually reduce provisioning costs going forward. Similarly, increasing asset prices banks’ investment portfolios can result in valuation gains that help improve NIM. However, given the large share of lending in total banking sector assets, the re-pricing effect from a decline in policy rates (and its impact on term spreads) is likely to be the dominant factor determining changes in bank profitability.
31 Banks maintain a capital adequacy ratio (CAR) above the minimum regulatory requirements (defined by the ECB’s SREP and a discretionary (management) capital buffer of two percentage points). In general, EU banks are required to comply with a minimum Pillar 1 capital ratio of 8 percent of risk-weighted assets (comprising 4.5 percent CET1 capital, 1.5 percent additional Tier 1 capital and 2 percent Tier 2 capital). In addition, banks have to hold Pillar 2 capital on a bank-by-bank basis to cover shortcomings in the measurement of RWA and to mitigate risks identified by supervisors. Moreover, banks have to hold further capital buffers (capital
Sources: Deutsche Bank,ECB, and IMFstaff calculations.
Outstanding
eligible
loans
Target date
(Jan-18)
Pay deposit
rate
(-0.4%)
Pay MRO (0%)
+2.5%Graduated linear
adjustment of
MRO rate
+0.5%
+7.3%
Italy: Required Lending for TLTRO-II Benchmark
(Jan. 2015=100)
15
banks to increase profitable lending and rebuild their capital buffers in order to enhance their
ex ante resilience to shocks. Indeed, assuming no change to the current capitalization or
credit quality of loan portfolios (under the benign assumption that banks exhaust available
capital buffers, including any managerial buffers above the regulatory minimum), only a few
banks are actually in a position to lend, i.e., they generate profits from current lending also
hold sufficient surplus capital in excess of the regulatory minimum to extend new loans (text
figure). Also banks that are more profitable seem to hold higher capital buffers to support a
larger credit expansion. On average, potential loan growth across all sample banks would
amount to (only) 1.4 percent, which is close to the benchmark lending rate required to access
TLTRO II funding (see text figure) at most favorable terms (i.e., at the ECB’s deposit rate of
currently –0.4 percent). However, this theoretical maximum remains far below the rate of
3.6 percent needed to maintain current profitability in light of declining NIMs due to the re-
pricing of existing loans and declining lending rates as deposit rates remain sticky.32
Moreover, the continued lack of sufficient credit demand33 could further delay the
improvement of banks’ earnings capacity, especially for those banks that struggle with high
levels of impaired assets weighing on profits (text figures below).
Several factors, which we have not considered explicitly, can reduce this estimate, such
as the impact of TLTRO II, improvements in asset quality and capital gains from
investments; however, the potential for “self-healing” through credit growth will be limited
to profitable lending only, placing greater burden on only a few banks to support the
aggregate estimate of potential loan growth. The Bank of Italy’s recent Survey on Industrial
and Service firms also indicates that the share of companies that could not obtain the whole
amount of required loans dropped from 8 per cent in 2014 to 6 per cent in 2015 (it was
12 percent in 2012). The recent ECB Survey on the Access to Finance of Enterprises in the
euro area (SAFE) confirms the decrease of “credit rationed” Italian companies indicating a
weakening of financial constraints.
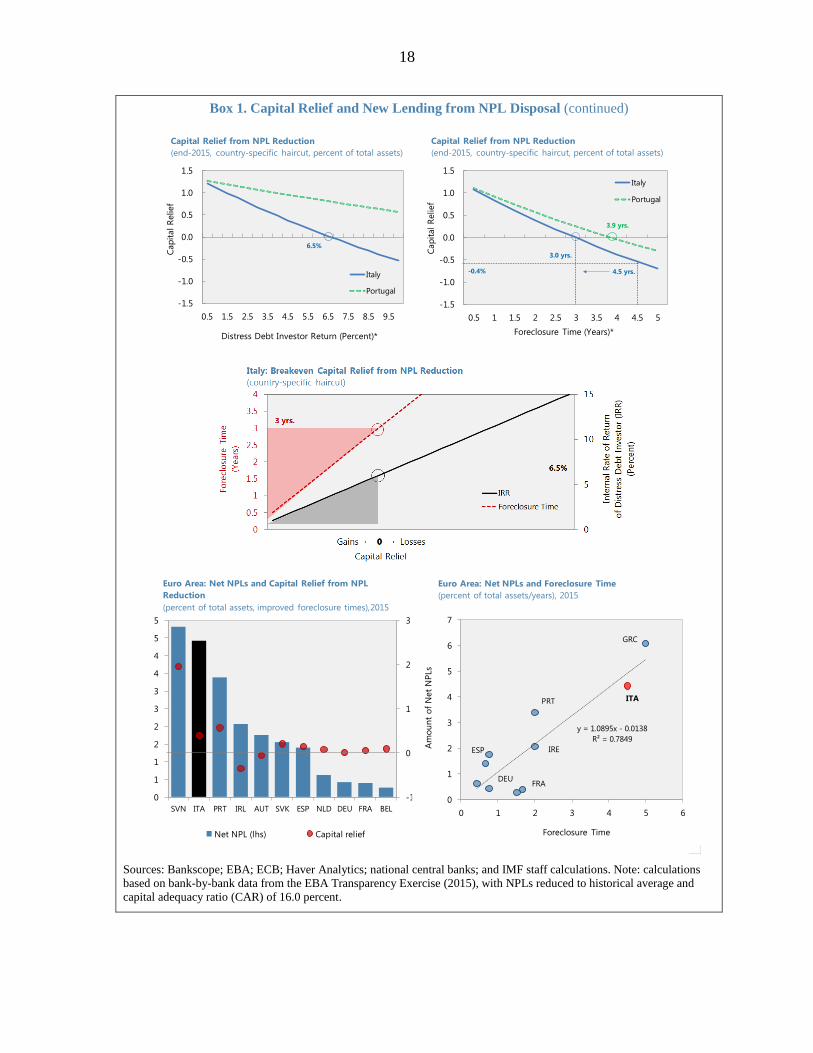
A decisive reduction of NPLs over the medium-term―combined with structural
reforms to reduce foreclosure times by strengthening debt enforcement and insolvency
frameworks―could free up regulatory capital to support new lending (Box 1).34
conservation and counter-cyclical buffers) to be met by CET1. Note that the average CET 1 requirement (excluding systemic buffers) of euro area significant institutions is around 9.9 percent (see https://www.bankingsupervision.europa.eu/ecb/pub/pdf/ssm_srep_methodology_booklet.en.pdf, p. 34).
32 Also current lending growth remains low and falls below the required benchmark to access TLTRO II funding at more favorable terms (i.e., below the ECB’s MRO rate). Moreover, lower funding costs through TLTRO II would benefit only new lending and cannot fully offset the negative impact of asset re-pricing on existing loans.
33 Survey data indicate that weak demand from non-financial firms is playing a major role in credit
developments. According to the recent Survey on Industrial and Service firms run by the Bank of Italy, the net
percentage of firms with an increase in the demand of new loans is at the lowest level since 2008. Real
investment is still at a historically low level and firms’ liquidity is high, especially among very large firms. On
aggregate, liquid assets to GDP are at 19.2 percent, the highest value since 1999.
34 Box 1 updates already published material with the latest data (Aiyar and others, 2015).
costs and write-off charges NPLs (Jobst and Lin, 2016).
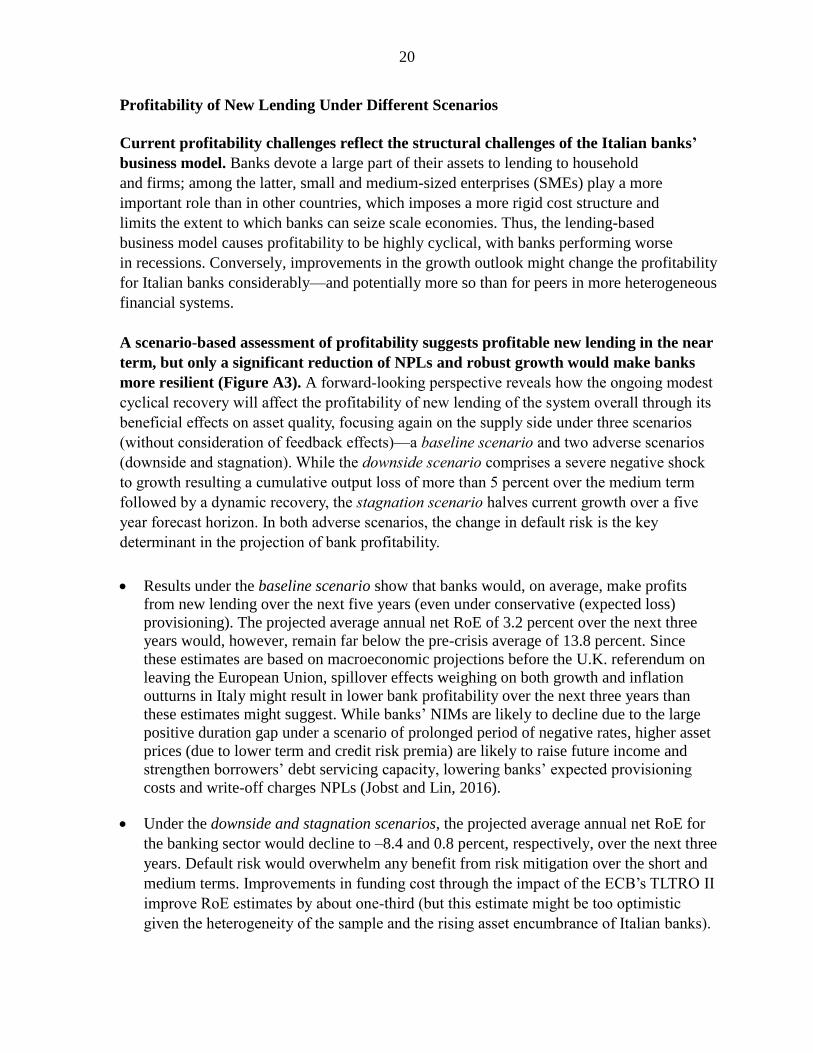
Under the downside and stagnation scenarios, the projected average annual net RoE for
the banking sector would decline to –8.4 and 0.8 percent, respectively, over the next three
years. Default risk would overwhelm any benefit from risk mitigation over the short and
medium terms. Improvements in funding cost through the impact of the ECB’s TLTRO II
improve RoE estimates by about one-third (but this estimate might be too optimistic
given the heterogeneity of the sample and the rising asset encumbrance of Italian banks).
21
Combining the forward-looking analysis with the conjunctural assessment of
profitability underscores the importance of economic recovery and the resolution of
legacy costs for Italian banks to overcome current challenges. High provisioning
expenses hamper sustainable profitability and the way a healthy banking sector can restore
credit growth and support the cyclical recovery, with lower bank profitability inhibiting a
timely repair of balance sheets through retained earnings. While the reduction in operating
and funding costs (supported by monetary easing) can enhance profitability, the evolution of
interest income from new lending will be an important driver of sustainable bank
performance going forward (Figure 1).35
Figure 1. Estimated Profitability of Italian Banks under Different Assumptions
35 While consolidation can also play an important role in this, we do not analyze its scope and potential effects.
-9
-7
-5
-3
-1
1
3
5
-9
-7
-5
-3
-1
1
3
5
Current
(bank-by-
bank,
historical
prov.) 2/
Current
(bank-by-
bank, exp.
loss prov.)
3/
Current
(system-wi
de) 4/
Baseline
scenario
(Art. IV),
2016-18
(avg.)
Downside
scenario
(Art. IV),
2016-18
(avg.)
Stagnation
scenario
(Art. IV),
2016-18
(avg.)
Current
(bank-by-
bank,
historical
prov.) 2/
Current
(bank-by-
bank, exp.
loss prov.)
3/
Current
(system-wi
de) 4/
Baseline
scenario
(Art. IV),
2016-18
(avg.)
Downside
scenario
(Art. IV),
2016-18
(avg.)
Stagnation
scenario
(Art. IV),
2016-18
(avg.)
Net return on equity
Net interest income
Sources: SNL and IMF staff calculations. Note: 1/ Funding rate at MRO (0%) via TLTRO II (and full rollover of existing TLTRO); any new deposits at 0%; lending rates adjust according to
marginal policy rate (since end-2015: -20 bps) and expected pass-through from term spread compression at historical elasticity of NIMs banks maintain their capital ratio as of end-2015; 2/
end-2015 and historical prov.=backward-looking provisioning (IAS 39); 3/ expected loss provisioning (consistent with IFRS 9); and 4/ based on aggregate data reported by Banca d'Italia for
end-2014, projected for 2015 as starting point for the scenario-based analysis.
Italy: Estimated Net Return on Equity from Current Lending and New Lending under Baseline Scenario (with and
without funding benefit from TLTRO II) 1/
(percent/percent of total assets)
with TLTRO II 1/without TLTRO II 1/
22
Figure 1. Estimated Profitability of Italian Banks under Different Assumptions (continued)
IV. CONCLUSION
The results in this paper point to significant heterogeneity among banks in the face of
significant cyclical and structural challenges. While the banking sector is somewhat
profitable overall, the amount of potential credit expansion required to offset the impact of
declining lending spreads is generally constrained by existing capital buffers (together with a
lack of sufficient demand). Especially smaller banks are likely to continue struggling to be
profitable—even under extremely favorable funding conditions due to the ECB’s monetary
easing and/or after considering improvements in operational efficiency—not least because
profitability of new lending remains too low relative to the high provisioning cost associated
with impaired assets in the existing loan book.
Without countervailing policy measures, the combination of high NPLs and low
profitability in Italy will continue to weigh on the recovery. Even if demand for credit
were to be lifted from its currently subdued levels, banks’ capacity and willingness to lend
are likely to remain modest, particularly as needed provisioning could continue to exert
notable downward pressure on profitability going forward. Thus, the impact of the high cost
of risk affecting lending behavior would weigh on the pace of economic recovery. Reducing
NPLs significantly might therefore be instrumental to spur lending, especially to SMEs that
are more reliant on bank financing. Resolving impaired loans would also encourage
corporate restructuring and allow the debt of viable firms to be restructured, while
accelerating the winding-down of non-viable firms. However, there is still a significant
-4
-3
-2
-1
0
1
2
3
4
Current
(bank-by-
bank,
historical
prov.) 2/
Current
(bank-by-
bank, exp.
loss prov.)
3/
Current
(system-
wide) 4/
Baseline
scenario
(Art. IV),
2016-18
(avg.)
Downside
scenario
(Art. IV),
2016-18
(avg.)
Stagnation
scenario
(Art. IV),
2016-18
(avg.)
Current
(bank-by-
bank,
historical
prov.) 2/
Current
(bank-by-
bank, exp.
loss prov.)
3/
Current
(system-wi
de) 4/
Baseline
scenario
(Art. IV),
2016-18
(avg.)
Downside
scenario
(Art. IV),
2016-18
(avg.)
Stagnation
scenario
(Art. IV),
2016-18
(avg.)
Taxes
Loan loss provisions
Operating cost
Commission and fee income
Net interest income
After-tax profit
Sources: SNL and IMF staff calculations. Note: 1/ Funding rate at MRO (0%) via TLTRO II (and full rollover of existing TLTRO); any new deposits at 0%; lending rates adjust according to
marginal policy rate (since end-2015: -20 bps) and expected pass-through from term spread compression at historical elasticity of NIMs banks maintain their capital ratio as of end-2015; 2/
end-2015 and historical prov.=backward-looking provisioning (IAS 39); 3/ expected loss provisioning (consistent with IFRS 9); and 4/ based on aggregate data reported by Banca d'Italia for
end-2014, projected for 2015 as starting point for the scenario-based analysis.
Italy: Decomposition of Estimated Net Operating Profits from Current Lending and New Lending under Different
Scenarios (with and without funding benefit from TLTRO II) 1/
(percent of total assets)
with TLTRO II 1/without TLTRO II 1/
23
pricing gap between the net book value and the market price of NPLs due to a depressed
housing market and structural deficiencies that slow the recovery of collateral for distressed
assets (Box 1). The lengthy foreclosure process has made it difficult for Italy’s banks to sell
NPLs because investors value loans by discounting future cash flows from asset recovery
(with larger haircuts required the longer the average time for foreclosure) rather than
imputing interest payments; this has been amplified by the absence of a developed market for
distressed debt providing a benchmark for pricing NPLs. This raises a number of areas in
which further policy intervention and building on government initiatives would be needed.
The authorities are taking steps to address structural obstacles to NPL resolution to
enhance the resilience of the banking sector. A recently issued decree law aims to reduce
the long average foreclosure time by simplifying bankruptcy procedures and speeding up the
recovery of collateral, although this is likely to impact only new NPLs and thus would be
expected to have its full impact only gradually over time. Shortening the time period for the
tax deductibility of write-offs and provisions from five years to just one year increases banks’
incentives to provision in a timely fashion (EBA, 2016). In addition to reforms in the areas of
insolvency, especially in out-of-court resolution,36 and bank corporate governance, the
establishment of an industry-sponsored backstop fund for the recapitalization of troubled
banks and for investment in distressed assets (Atlante) and the agreement of the Italian
authorities with the European Commission on a scheme for NPL securitization (GACS) can
help overcome some of the obstacles to resolving current asset quality challenges (Box 2).37
Reducing NPLs noticeably over the medium term and further improving operating
efficiency can help raise bank profitability, stimulate lending, and improve banks’
resilience. Supervisors should engage banks to provide credible plans to reduce significantly
the NPL overhang over the medium term and closely collaborate with the ECB’s NPL Task
Force to incentivize NPL resolution. Other complementary measures can support these
efforts and enhance the resilience of the banking sector to shocks. Enhanced supervision,
further advancing insolvency and enforcement reforms (beyond recent policy measures), and
the facilitation of distressed debt markets will help tackle the high level of impaired assets in
the system. In particular, the insolvency framework for corporates and households should be
improved further. Lengthy court procedures should be shortened, and out-of-court
arrangements encouraged as an alternative. Such reforms would shorten the time of asset
recovery by creditors and make it easier to restructure loans, reducing corporate and
household debt burdens and facilitate de-leveraging.
The weak underlying profitability points to the continuing need for a broad
restructuring and consolidation strategy. Building on recent reforms of large cooperative
36 See Carcea and others (2015) on the important role of efficient pre‐insolvency frameworks in supporting
corporate and household deleveraging.
37 In addition, the ECB-Banking Supervision’s Task Force on NPLs has concluded its data collection effort and is expected to provide detailed guidance on the asset impairment challenges of directly supervised banks, including Italian institutions. Furthermore, the Bank of Italy has recently launched a new periodic survey to gather detailed information on the stock of bad debts, the related collateral and guarantees, and recovery procedures.
24
and mutual banks, the viability of banks not subject to the ECB’s Comprehensive
Assessment should be examined, with follow-up actions in line with regulatory requirements.
Since growth and inflation outturns remain subdued, structural reforms are needed to
invigorate the “self-healing powers” of the banking system—such as facilitating bank
consolidation and paving the way for cost-cutting; banks’ business models need to
become more efficient through streamlining branch networks and exploiting other synergies
realized through consolidation. However, only banks that are already profitable (or have a
reasonable chance of becoming profitable over the near term would be able to absorb the
cost of reforms and build the necessary capital buffers to sustain lending suggesting a
realistic assessment of viability.
25
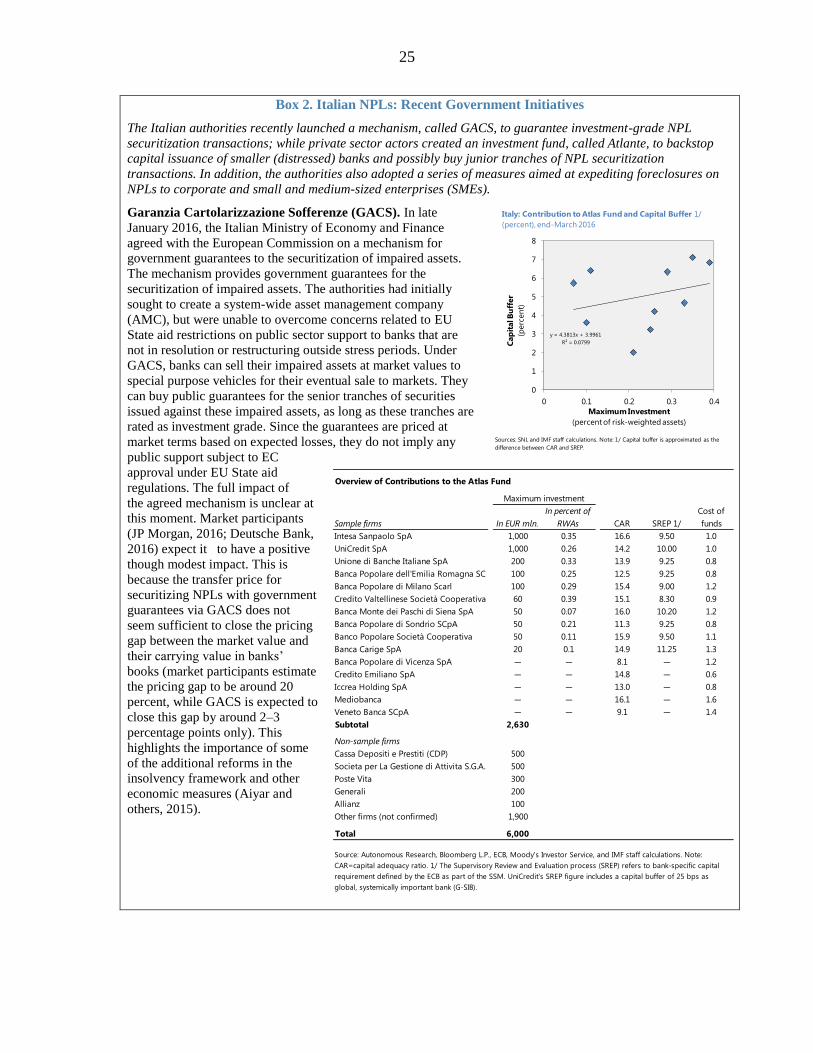
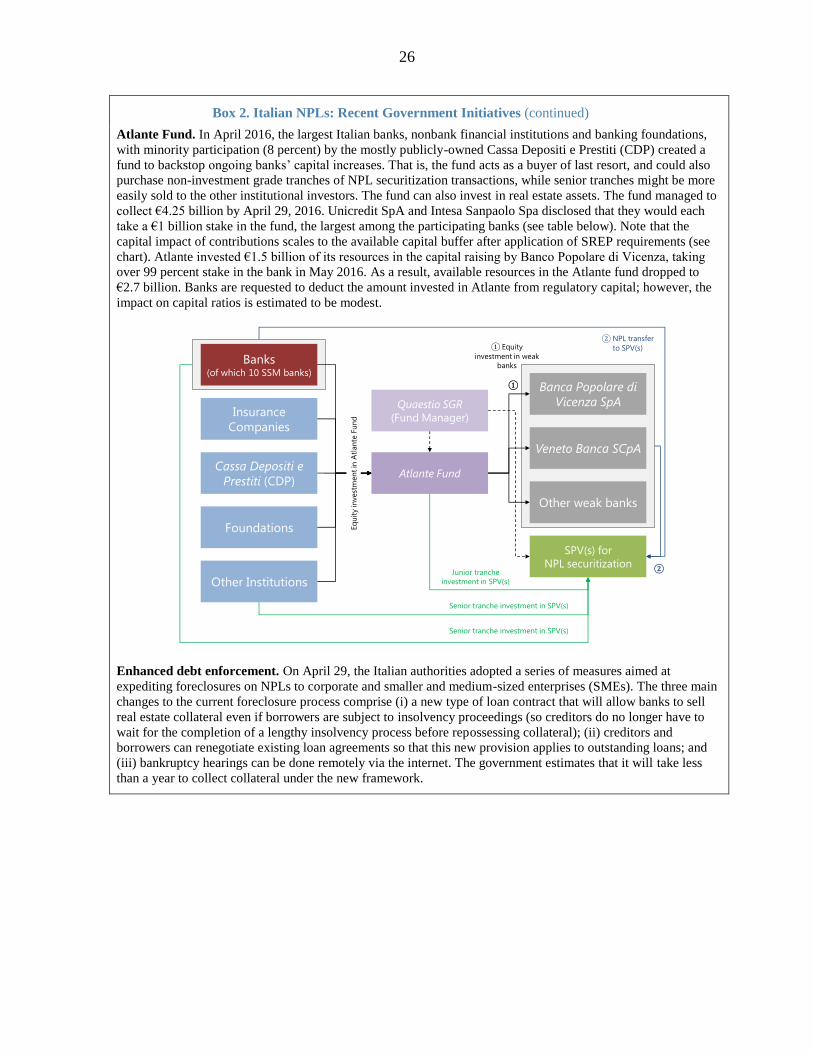
Box 2. Italian NPLs: Recent Government Initiatives
The Italian authorities recently launched a mechanism, called GACS, to guarantee investment-grade NPL
securitization transactions; while private sector actors created an investment fund, called Atlante, to backstop
capital issuance of smaller (distressed) banks and possibly buy junior tranches of NPL securitization
transactions. In addition, the authorities also adopted a series of measures aimed at expediting foreclosures on
NPLs to corporate and small and medium-sized enterprises (SMEs).
Garanzia Cartolarizzazione Sofferenze (GACS). In late
January 2016, the Italian Ministry of Economy and Finance
agreed with the European Commission on a mechanism for
government guarantees to the securitization of impaired assets.
The mechanism provides government guarantees for the
securitization of impaired assets. The authorities had initially
sought to create a system-wide asset management company
(AMC), but were unable to overcome concerns related to EU
State aid restrictions on public sector support to banks that are
not in resolution or restructuring outside stress periods. Under
GACS, banks can sell their impaired assets at market values to
special purpose vehicles for their eventual sale to markets. They
can buy public guarantees for the senior tranches of securities
issued against these impaired assets, as long as these tranches are
rated as investment grade. Since the guarantees are priced at
market terms based on expected losses, they do not imply any
public support subject to EC
approval under EU State aid
regulations. The full impact of
the agreed mechanism is unclear at
this moment. Market participants
(JP Morgan, 2016; Deutsche Bank,
2016) expect it to have a positive
though modest impact. This is
because the transfer price for
securitizing NPLs with government
guarantees via GACS does not
seem sufficient to close the pricing
gap between the market value and
their carrying value in banks’
books (market participants estimate
the pricing gap to be around 20
percent, while GACS is expected to
close this gap by around 2–3
percentage points only). This
highlights the importance of some
of the additional reforms in the
insolvency framework and other
economic measures (Aiyar and
others, 2015).
y = 4.3813x + 3.9961
R² = 0.0799
0
1
2
3
4
5
6
7
8
0 0.1 0.2 0.3 0.4
Italy: Contribution to Atlas Fund and Capital Buffer 1/
(percent), end-March 2016
Cap
ital B
uff
er
(perc
en
t)
Sources: SNL and IMF staff calculations. Note: 1/ Capital buffer is approximated as the
difference between CAR and SREP.
Maximum Investment
(percent of risk-weighted assets)
Sample firms In EUR mln.
In percent of
RWAs CAR SREP 1/
Cost of
funds
Intesa Sanpaolo SpA 1,000 0.35 16.6 9.50 1.0
UniCredit SpA 1,000 0.26 14.2 10.00 1.0
Unione di Banche Italiane SpA 200 0.33 13.9 9.25 0.8