AD-A2 65 366;,o. UNCLASSIFIED ...... DISTRI 3UITION ... * .*...... . ............ * "=-SUFFIELD MEMORANDUM= NO. 1410 CANADIAN CONTRIBUTOR TO THE 1991 UNITED NATIONS ROUND ROBIN ANALYTICAL VERIFICATION EXERCISE DTIC FILECTE "JUN07 1993.. by SU P.A. D'Agostino, J.R. Hancock, C.A. Boulet, L.R. Provost, C.E. Lough, R.P. Hicken and A.S. Hansen 93-12592 March 1993 DEFENCE RESEARCH ESTABLISHMENT SUFFIELD, RALSTON, ALBERTA WARNING "The use of this information is permitted subject to C- oiaodooo f proprietary and patent rights* /Cm, 1
Additional MS/MS data were obtained by acquiring the daughter spectrum of m/z 123 (an
ion common to sulfur vesicants) for mustard (Figures 14 and 15). The presence of sulfur in
each of these compounds was confirmed during GC-FPD (S) (Figure 16) and FTIR data
were obtained for mustard (Figure 17).
No CW relevant compounds were detected during analysis of the trimethylsilyl
extract. The second acetonitrile extract of R46 (used for TMS study) contained about 80%
as much mustard and his(2-chloroethyl)disulfide as the first which suggests difficult recovery
UNCLASSIFIED
UNCLASSIFIED 10
of these compounds from this tvpe of rubber with acetonitrile. Multiple extractions would
be required for complete recovery.
Mustard and bis(2-chloroethyl)disu lfide chromatographic/spectrometric data were
confirmed with available authentic standards.
c) Concrete (C46, C47, C48)
Sample handling
The plastic pouches containing the glass bottles were cut with scissors and the glass
bottle removed. Each concrete sample was removed and the foil removed with disposable
tweezers. Concrete samples were then placed back into the shipment bottle and extracted
by ultrasonic vibration for 5 minutes with 15 mL of acetonitrile. The acetonitrile extract was
removed and concentrated by nitrogen blowdown to 0.5 mL. Dichloromethane (4.5 mL) was
added to the acetonitrile extract (final volume of 5 mL) prior to analysis to improve
chromatographic performance.
Two mL of the 5 mL volume (above) were concentrated to 300ML and this
concentrate was used for trimethylsilylation. Trimethylsilylation was performed by combining
100 AL BSTFA, 100 ML pyridine and the 300 plL extract (C48) in a 1.8 mL screw-capped
(Teflon lined) glass vial. This sample was heated for 20 minutes at 60'C prior to analysis.
Analysis was performed immediately after cooling to minimize degradation.
Results
Figures 18 and 19 illustrate capillary column GC-FID and GC-MS (El)
chromatograms obtaineo during analysis of I ML aliquots of the acetonitrile extracts of C46,
UNCLASSIFIED
UNCLASSIFIED 11
C47 and C48. Figure 20 illustrates EI-MS for one of the two CW relevant compounds,
thiodiglycol, found in the acetonitrile extracts of C47 and C48. The second compound,
thiodiglycol sulfone, was not discernable above the chemical background during El-MS. The
molecular weight and presence of each of the compounds was confirmed by the presence
of (M+H)' and/or (M+NH 4)+ ions during GC-MS (ammonia CI) analysis (Figure 21).
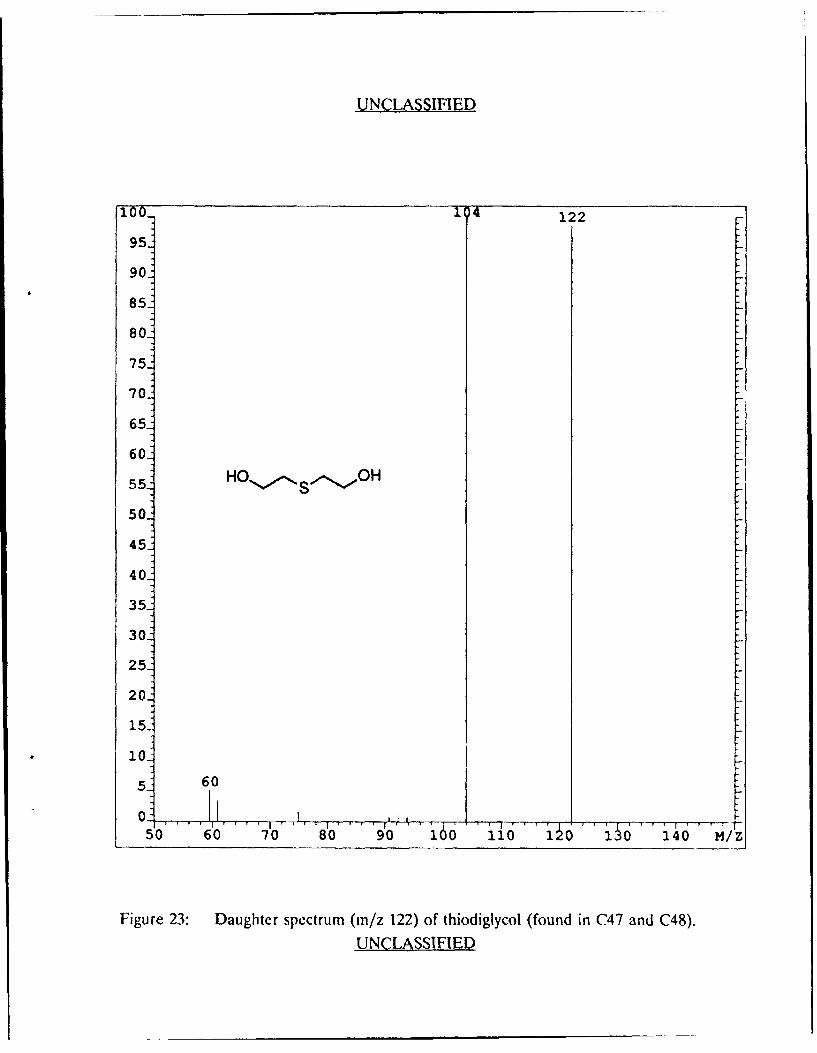
Additional MS/MS data were obtained by acquiring the daughter spectrum of m/z 122
(molecular ion) for thiodiglycol (Figures 22 and 23) and the daughter spectrum of m/z 111
for thiodiglycol sulfone (Figures 24 and 25).
Figures 26 and 27 illustrate capillary column GC-FID and GC-MS (El)
chromatograms obtained during analysis of I pL aliquots of the derivatized acetonitrile
extract of C46, C47 and C48. Figure 28 illustrates El-MS for the di-TMS derivatives of
thiodiglycol and thiodiglycol sulfone found in the acetonitrile extracts of C47 and C48. C46
did not contain compounds of CW relevance and appears to be a control. The molecular
weight of each of the derivatives was confirmed by the presence of (M+H)+ and
(M+NH4 )4 ions during GC-MS (ammonia CI) analysis (Figures 29 and 30).
The presence of sulfur in each of these compounds and their di-TMS derivatives was
confirmed during GC-FPD (S) (Figures 31 and 32) and FTIR data were obtained for
thiodiglycol, thiodiglycol sulfone and their di-TMS derivatives (Figures 33 and 34).
Thiodiglycol, thiodiglycol sulfone and their di-TMS derivatives
chromatographic/spectrometric data were confirmed with available authentic standards.
UNCLASSIFIED
UNCLASSIFIED 12
DISCUSSION
DRES adopted the following general philosophy for the analysis of the nine samples
received for analysis. The following steps indicate the order of analysis at DRES:
a) Capillary column GC-FID was used to screen solvents (e.g., hexane,
dichloromethane and acetonitrile) used for extraction of samples. Capillary column
GC-FID and GC-FPD (and when required GC-MS) was employed to screen solvent
blank extracts to ascertain the levels of potential interference and the presence of
any CW relevant or unusual compounds.
b) Standard mixtures of CW relevant compounds were analysed daily by all the
techniques to assure both chromatographic and spectrometric quality prior to sample
extract analyses.
c) One sample (or group of samples) at a time was extracted and analysed by
capillary column GC with MS, MS/MS, FTIR, FID and FPD (simultaneous S/P)
detection. The order was painted panels (October 21, 1991) followed by concrete
(October 22, 1991) and rubber (October 23, 1991) samples.
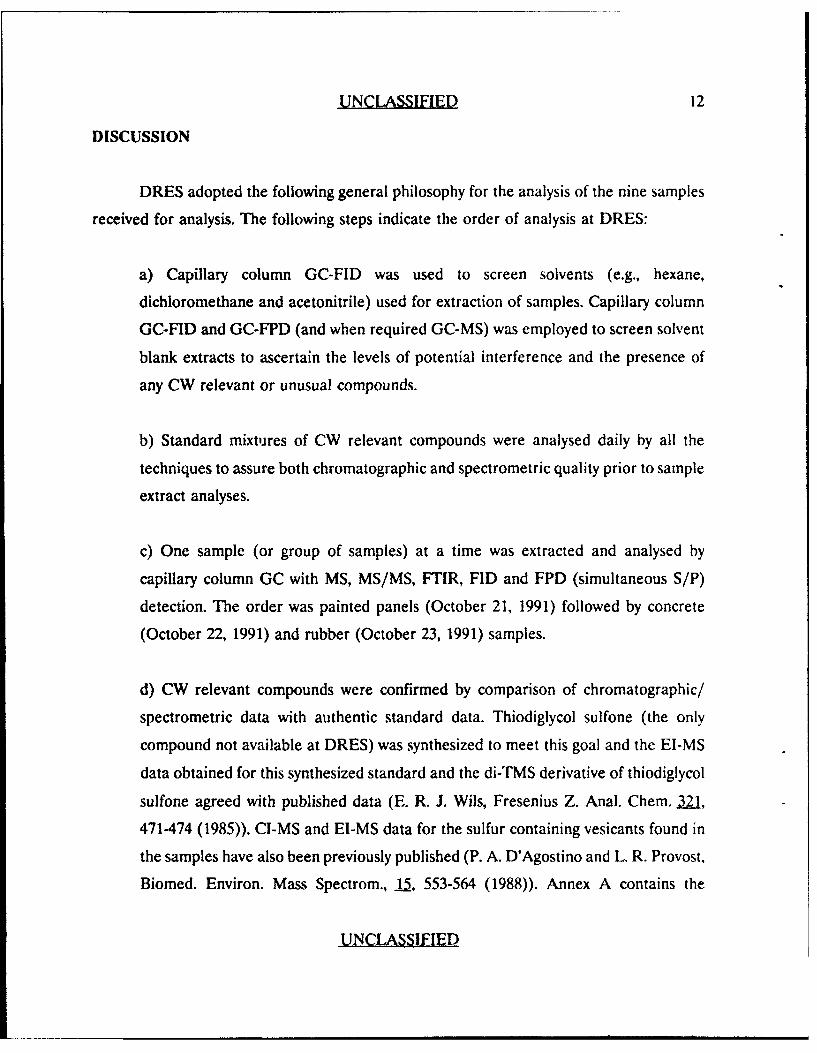
d) CW relevant compounds were confirmed by comparison of chromatographic/
spectrometric data with authentic standard data. Thiodiglycol sulfone (the only
compound not available at DRES) was synthesized to meet this goal and the El-MS
data obtained for this synthesized standard and the di-TMS derivative of thiodiglycol
sulfone agreed with published data (E. R. J. Wils, Fresenius Z. Anal. Chem. 321,
471-474 (1985)). CI-MS and El-MS data for the sulfur containing vesicants found in
the samples have also been previously published (P. A. D'Agostino and L. R. Provost.
Biomed. Environ. Mass Spectrom., 15, 553-564 (1988)). Annex A contains the
UNCLASSIFIED
UNCLASSIFIED 13
Synthesis and Reference Spectroscopic Data for lniodiglycol Sulfone.
e) Trimethylsilylation of sample extracts was performed to aid in the identification
of nonvolatile degradation products.
f) All sample extract components were screened for the presence of sulfur and
phosphorus atoms by GC-FPD. No phosphorus containing compounds were detected.
g) Capillary column GC-MS (El) chromatograms of all extracts of the samples were
screened for the presence of the common CW agents GB, GD, GA, GF, VX, H, Q
and T using reconstructed ion current chromatograms. Minor or trace sample
component El mass spectra were checked to be sure that they did represent, in the
best opinion of the laboratory, scheduled compounds. Only mustard related
compounds were found in the samples. Table II lists the compounds identified in the
samples and the techniques used to confirm the presence of each component.
h) A semi-quantitative estimate of major sample components was obtained using
capillary column GC-FID and/or GC-FPD data. Table III lists the semi-quantitative
results of the sample analyses.
i) The sample detection limit of GC-FTIR was greatly enhanced over previous round
robin exercises by the use of an 8 m retention gap. This allowed larger volume (50
AL) injections.
j) The high specificity of GC-MS/MS and GC-MS (ammonia CI) is clearly
demonstrated by comparison of sample extract chromatograms with either GC-FID
or GC-MS (El) chromatograms.
UNCLASSIFIED
UNCLASSIFIED 14
CONCLUSIONS
Solvent extracts of the painted panels, concrete and rubber samples circulated for
analysis were analysed by capillary column GC-MS (El and ammonia CI), GC-MS/MS, GC-
FTIR, GC-FPD (simultaneous S/P) and GC-FID. Trimethylsilylation was performed on all
sample extracts in order to identify non-volatile degradation components.
Canada identified and confirmed the presence of the chemical warfare relevant
compounds, sesquimustard, bis[(2-chloroethylthio)ethyl]ether and 2-chloroethyl (2-
chloroethoxy)ethyl sulfide in the hexane extracts of two of the painted panel extracts. The
molecular weight of each of these sulfur vesicants were confirmed by the presence of
(M+NH 4)÷ ions during ammonia CI-MS analysis. Additional MS/MS data were obtained
by acquiring the daughter spectra of m/z 123 (an ion common to sulfur vesicants) for
sesquimustard, 2-chloroethyl (2-chloroethoxy)ethyl sulfide and bis[(2-
chloroethylthio)ethyllether.
Two chemical warfare relevant compounds, mustard and bis(2-chloroethyl)disulfide
were found in the acetonitrile extracts of two rubber samples. The exact mass of the
molecular ion for both compounds was determined at 10,000 resolution during GC-MS (El)
analysis. Additional MS/MS data were obtained by acquiring the daughter spectrum of m/z
123 (an ion common to sulfur vesicants) for mustard. FTIR data were not obtained for
bis(2-chloroethyl)disulfide.
Two chemical warfare relevant compounds associated with mustard degradation,
thiodiglycol and thiodiglycol sulfone, were found in the acetonitrile extracts of two concrete
samples. The molecular weight and presence of each of the compounds was confirmed by
the presence of (M+H)' and/or (M+ NH 4)+ ions during GC-MS (ammonia CI) analysis.
Additional MS/MS data were obtained by acquiring the daughter spectrum of m/z 122
UNCLSSIFIED
UNCLASSIFIED 15
(molecular ion) for thiodiglycol and the daughter spectrum of m/z 111 for thiodiglycol
sulfone. The trimethylsilyl (TMS) derivatives of thiodiglycol and thiodiglycol sulfone were
confirmed by capillary column GC-MS analysis of the concrete acetonitrile extracts. The
presence of sulfur in each of these compounds and their di-TMS derivatives was confirmed
during GC-FPD, and FTIR data were obtained for thiodiglycol, thiodiglycol sulfone and
their di-TMS derivatives.
Thiodiglycoi sulfone was synthesized to provide an authentic reference standard. The
EI-MS data obtained for this synthesized standard and the di-TMS derivative of thiodiglycol
sulfone agreed with published data. CI-MS and EI-MS data for mustard and other sulfur
containing vesicants found in the samples also agreed with published data.
Table II summarizes the mustard related compounds confirmed by DRES in the
painted panels, concrete and rubber samples. Only five of the participating laboratories
including Canada, identified all the spiked compounds. In addition to the spiked compounds
reported, some laboratories also reported false positives, or the presence of compounds
which were not deliberately spiked in the samples.
UNCLASSIFIED
UNCLASSIFIED
Table I: Chemical Warfare and Related Compounds 16
Identified in the Third UN Round Robin
Chrom. STRUCTURE MoL Wt. CAS No.Peak No.
I1. CI 202 114811-38-0
2-chloro(2-chloroethoxy)ethyl sulfide
2. 218 3563-36-8sosquimustard
3. C s O s CI 262 63918-89-8
bisI(2-chloroethylthio)ethyllether
4. CI Vs Ct 158 505-60-2
mustard
5. C , ssS, ^c! 190 1002-41-1
bis(2-chloroethyl)disulfide
6. HO_ s_ OH 122 111-48-8
thiodiglycol
07. HO.ý OH 154 2580-77-0
II
0thiodiglycol sulfone
8. TMSO S,-, OTMS 266
di-TMS der. of thiodiglycol
09. TMSO S TMS 298
If0
di-TMS der. of thiodiglycol sulfone
UNCLASSIFIED
UNCLASSIFIED
17
LL-
6Za
05
x
0
x x x X )
LL - x x x x ,E 0
E v 5co0C)9
E c'-J 0~z ~ -T t C 0 '< n o ' - c
cr
0--
E m 0 ro ) 0
N Cl) (0 Co mD r-C,) 0- - E
0w .0
-C
0~ V
4) C)4V
E 0 >
)( C)Cý I
r U C) :3 V ) HE HE
UNCLASSIFIED
U NCLASSI FIED
a- - - -M 1
0 U
U-. CC
0
a..
Li.
w 0
U-
z U.
w cI- 0iU-
0- fn
LhL
CLN CL
E
U.
Li.
m -a -E Z -6ap 0
00o
0 ED
E _0 WV 4
0, 0o , 0
00 0-C0.
CDI ILU
- - 0)5FIE
UNCLASSIFIED
80000 3
0
5000--01 0i1 15' 201 25'
80000-
C:
500001 51 10, 15 20' 25'
80000 C
C 21
:33
0
5000- "0 51 101 15' 20' 251
Time (min)
Figure 1: Capillary column GC-FID chromatogram of the hexane extract of a) P46, b)P47 and c) P48 painted panels. Numbered components are listed in Table I.
Figure 2: Capillary column GC-MS (El) total-ion-current (400 to 40 u) chromatogramof the hexane extract of a) P46, b) P47 and c) P48 painted panels. Numberedcomponents are listed in Table I.
UNCLASSIFIED
UNCLASSIFIED
[100 1f3 a90180o-
70- 63 109
601460o 45 Cl .I S • S c I
50!
40. 30. I 73
3 0-
20 L2 15 M M
40 60 80 1o0 140 160 1. '260 .. O 1M/z100 139oi b
80o
70-
60: 63
50 C %S O % ' %
40 .45
30-.
20- 86
1010 226
40 60 80 160o' 0 160 10 2 0 20 MIZ
Figure 3: Electron impact mass spectra of a) sesquimustard and b) bis[(2-
chloroethylthio)ethyl]ether (found in P46 and P48).
UNCLASSIFIED
UNCLASSIFIED
10 1, 3'4 Mx
95'
907
8515
809
75-
70 C,
65:
60-
55-170
50-
113
40.
35- 155
30-
25 109
20 L2715141 166 183 202
10.10
10 1k 1 0 40 1 0 0 1 5o, 1ý0 140, J MA
Figure 4: Electron impact mass spectrum of 2-chloroethyl (2-chloroethoxy)ethyl sulfide(found in P46 and P48). This minor component co-elutel with anothercompound and only the ions marked with a triangle and the molecular ion atni/z 202 were due to 2-chloroethyl (2-chloroethoxy)ethyl sulfide.
Figure 5: Capillary column GC-MS (ammonia Cl) total-ion-current (300 to 200 u)chromatogram of the hexane extract of P46 painted panel. Numberedcomponents are listed in Table I.
70 CI s60504030 123 18320 710 890 1 1, ,• [.... l.. ...L I..... ,L . .... I ..- .. h, i ... .... .I. . I... ... M I. i ll
6 80 0 10 20 2 40 02 M/100 2 0
90i (M+NH 4 )+ C8070 CII S "O s CI
50 12340302010 61 89
0 i. hL I . ..j, 1 3 3 1 6 7 1 8 6 2 2 7
60 8o' ' o 160 140 1it i-l6'6 2 160 26o o2 0 M/Z
Figure 6: Ammonia chemical ionization mass spectra of a) 2-chloroethyl (2-chloroethoxy)ethyl sulfide, b) sesquimustard and c) bis[(2-chlorocthylthio)-ethyllether (found in P46 and P48).
UNCLASSIFIED
UNCLASSIFIED
100 M--x20.00----- 3
95,90_
85:
80-
75-
70.
65:
60: 2
55_"
50_
45-
40_
35-
30.
25.
20.
15.
10
5.
5: 00 10: 00 120:00 TIME425 851 1277 1703 SCAN
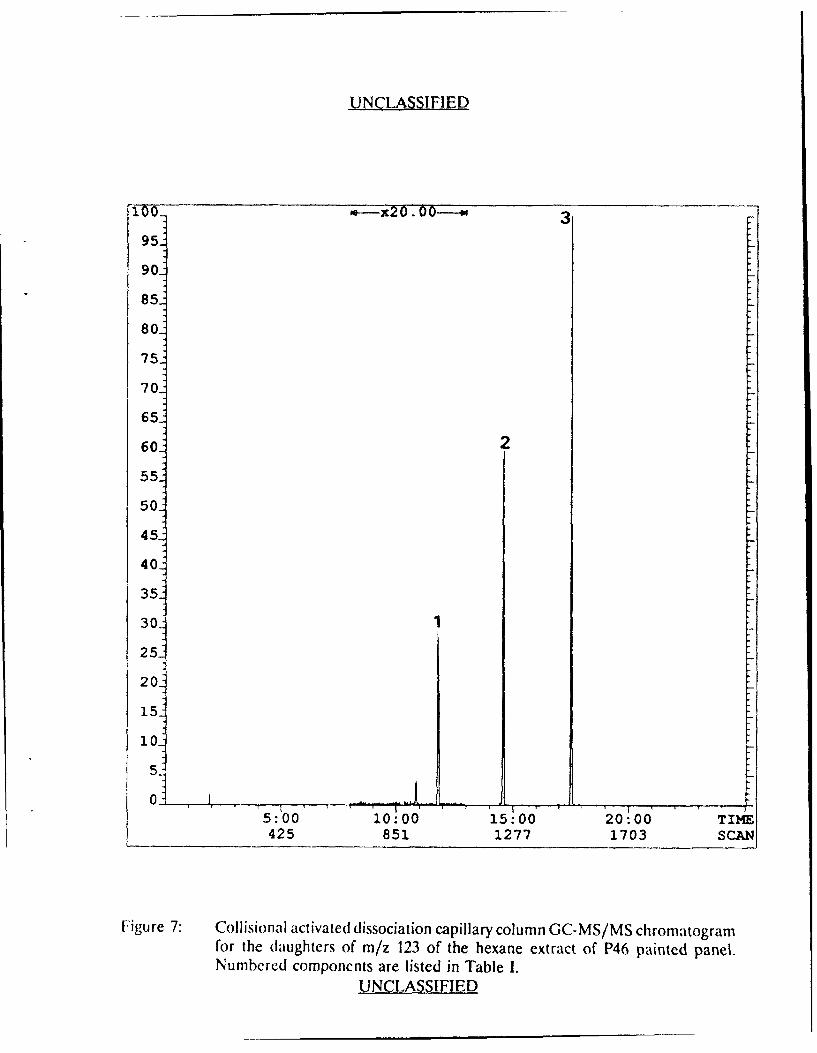
Figure 7: Collisional activated dissociation capillary column GC-MS/MS chromatogramfor the daughters of m/z 123 of the hexane extract of P46 painted panel.Numbered components are listed in Table I.
UNCLASSIFIED
UNCLASSIFIED
100 1908070506040302010 63
5o0 6'0 70 80 '9'0o . 60 1i10 10Z 14o100 1390 b-807060 C I sS50403020o10 63
5'0 60 70 80 90... 161 1410 o M/z100 13
90C8070 ci Q%~%• •.dN• cI60150-40-30-20 6310
50 60 70 P 0 90 1o0 13o 1•0 1 0 14 M/Z
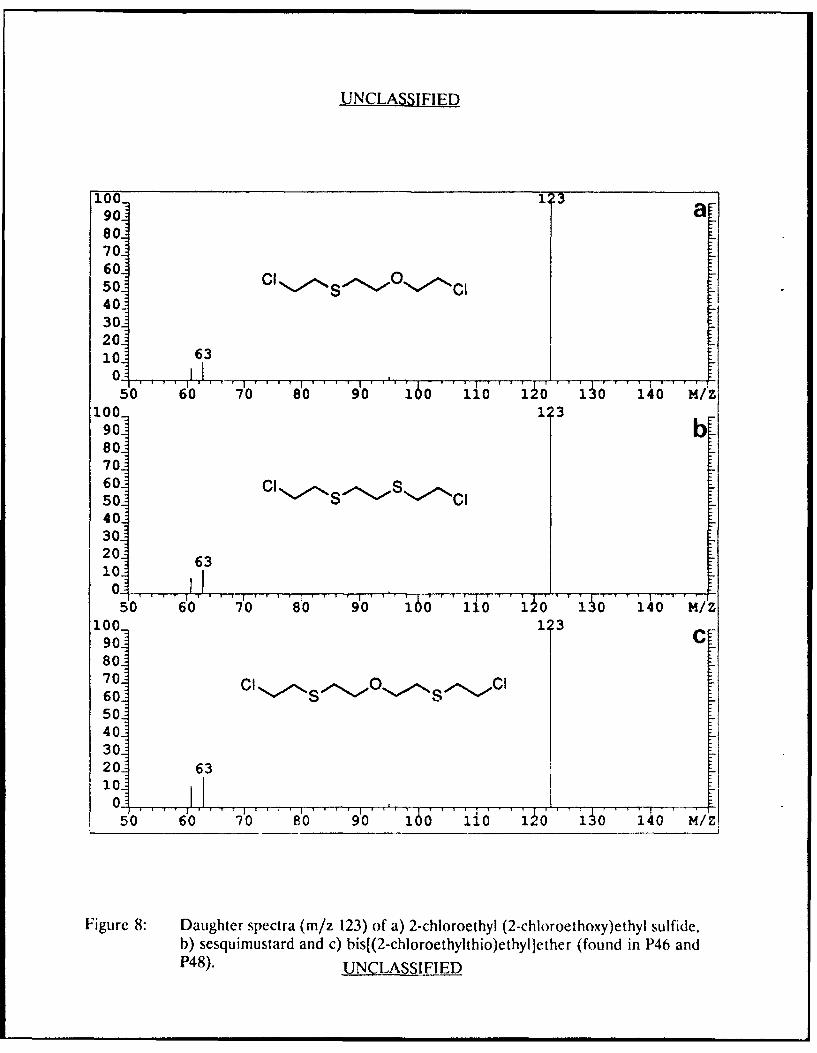
Figure 8: Daughter spectra (m/z 123) of a) 2-chloroethyl (2-chloroethoxy)ethyl sulfide,b) sesquimustard and c) bis[(2-chloroethylthio)ethyllether (found in P46 andP48). UNCLASSIFIED
UNCLASSIFIED
175000 2 31
0
3500-r-0151 101 15' 20'
175000- b(n4J
0C-
3500-t-'-0 51 101 j51 20'
175000- 2 3 C
0
3500- __K
of 51 1OI 15' 201
Time (min)
Figure 9: Capillary column GC-FPD (sulfur mode) chromatogram of the hexane extractof a) P46, b) P47 and c) P48 painted panels. Numbered components are listedin Table I.
UNCLASSIFIED
UNCLAS~IFIED0
0-4
z
q 00 3qq1* 2880 2 20 1760 1200 1*00
z
zCE~
'000 31*1* 2880 2k 20 160 1 00 q*0
z
T-ir-i
H0
q 00 341*0 2680 2320 17ý60 1 kO 61*0WHVE NUMBEF3
Figure 10: FTIR spectra of a) 2-chioroethyl (2-chloroethoxy)ethyl sulfide, b)sesquimustard and c) bis((2-chloroethylthio)ethyllether (found in P46 andP48). UNCLASSIFIED
UNCLASSIFIED
80000- a
U,4-)c
0
4 5
5000- "
0 51 101 151 20' 25' 30
80000- b
C:"-)
:3
04 5
5000 - "-- -- -A--"
0 51 1O0 15' 20' 25' 30
80000- C
4.)
0
5000-or 51 10, 15' 20' 251 30
Time (min)
Figure 11: Capillary column GC-FID chromatogram of the acetonitrile extract of a) R46,b) R47 and c) R48 rubber samples. Numbered components are listed in TableI.
Figure 12: Capillary column GC-MS (El) total-ion-current (400 to 40 u) chromatogramof the acetonitrile extract of a) R46, b) R47 and c) R48 rubber samples.Numbered components are listed in Table I.
Figure 14: Collisional activated dissociation capillary column GC-MS/MS chromatogramfor the daughters of m/z 123 of the acetonitrile extract of R46 rubber sample.Numbered components are listed in Table 1.
-UNCLASSIFIED
UNCLASSIFIED
100-
95:
90-
85-
8 0-
75-
70-
65-
60-
55:
50.
45:
4 0-
3 5-
3 0-
25-
20'
15-63
10-
5
0. _ _ _ _ _ _ _ _ _ _ _ _ _ _ _ _
50' 60' 70 ... 80 90.ýO. 160 116 ~ 10 i40 'M/Z
Figure 15: Daughter spectrum (m/z 123) of mustard (found in R46 and R47).
UNCLASSIFIED
UNCLASSIFIED
175000-
0" 4
(I)
3 0 00 .1)1 --- L
0 5'• F0 15' 20
175000-
30-P
:3
3000-
015' 101 15
Time (min)
Figure 16: Capillary column GC-FPD (sulfur mode) chromatogram of the acetonitrile
extract of a) R46, b) R47 and c) R48 rubber samples. Numbered componentsare listed in Table I.
UNCLASSIFIED
UNCLASSIFIED
0I
LUz
- 0)
o7
Zr.
z f
H-
CA
•3800 3175 2550 1925 1300 675WAVENUMBER
Figure 17: FIIR spectrum of mustard (found in R46 and R47).
UNCLASSIFIED
UNCLASSIFIED
100000-
o
5000 .... .. ...o 55 10 5- 20 • 2 -F
100000-
4 -)
0
9000 _ _ _ _ _ _ _ _ _ __ _ _ _ _ _ _ _
5' O 1 20' 251
100000-
c-P
5000- ______
0- 10o 15T 20 25'Time (min)
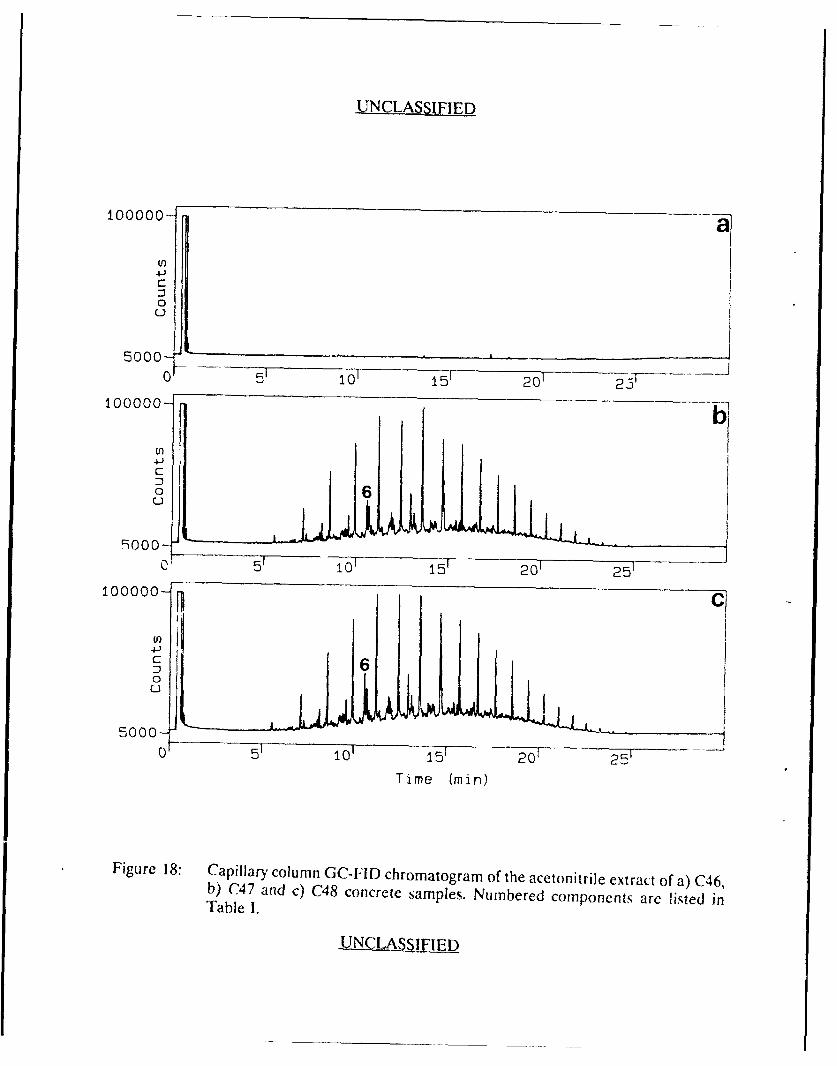
Figure 18: Capillary column GC-FID chromatogram of the acetonitrile extract of a) C46,b) C47 and c) C48 concrete samples. Numbered components are listed inTable 1.
Figure 21: Ammonia chemical ionization mass spectra of a) thiodiglycol and b)thiodiglycol suifone (found in C47 and C48).
UNCLASSIFIED
UNCLASSIFIED
95-
90:OIE
852780-
70 H65-
6 0-
55-
50-
45:
40-
35:
30-
25:
20-
15
10-
5:00 10:00 15:00200 IE425 851 1277 1684 S CAN
Figure 22: Collisional activated dissociation capillary column GC-MS/MS chromatogramfor the daughters of m/z 122 of the acetonitrile extract of C48 concretesample. Numbered components are listed in Table I.
UNCLASSIFIED
UNCLASSIFIED
100- 1 4 122
95-
85:
8 0-
75-
70-
65-
55 svOH
50-
45:
40:
35:
30:
2 5:
2 0-
15"
10-
5- 60
0 _ _ _ _ _ _ _ _ _ _
s0 60 70 80 90 1 0 110 1 0 10 1,406 M,/Z
Figure 23: Daughter spectrum (m/z 122) of thiodiglycol (found in C47 and C48).
Figure 24: Collisional activated dissociation capillary column CC-MS/MS chromatogramfor the daughters of m/z 111 of the acetonitrile extract of C48 concretesample. Numbered components are listed in Table 1.
UNCLASSIFIED
UNCLASSIFIED
100 11
95:
90.
85-
8 0-
75_
70:
65 6
60 0 o0S OH
55- 0
50-
45:
40-
35-93
30:
25-
20-
15-
10- 63
5-
0---i.
50 60 70 80 90 10 ~ a 1Hi0'1o 140 '/z
Figure 25: Daughter spectrum (m/z 111) of thiodiglycol sulfone (found in C47 and C48).
UNCLASSIFIED
UNCLASSIFIED
300000-
C')
00
5000-o 51, 15' 20' 25' 30
300000- 8
(r)%4-)9
0
5000 "__
0- 5i 10i 15' 201 25' 3
300000-
4j)CZY00
5000-0 51 101 151 201 25'
Time (min)
Figure 26: Capillary column GC-FID chromatogram of trimethylsilylated acetonitrileextract of a) C46, b) C47 and c) C48 concrete samples. Numberedcomponents are listed in Table I.
of trimethylsilylated acetonitrile extract of a) C46, b) C47 and c) C48 concretesamples. Numbered components are listed in Table I.
UNCLASSIFIED
UNCLASSIFIED
100- a90
80 116
70
60147
501: TMSO,,-,--,S OTMS103
40
30-
20 87 133 176
10 1 191 251
5o 10 .0 260 20o 360 .. 35') ,/Z
100 7390 b80
70 028360 TMSO% .. ,ý OTMS
60:
50- 0
40
30 117
20.. 9 101 147: 59
S87 133 239 -
50 10 150 20 250 30 350 M/Z
Figure 28: Electron impact mass spectra of a) di-TMS derivative of thiodiglycol and b)di-TMS derivative of thiodiglycol sulfone (found in C47 and C48).


![R : ¹ ³P47 ± Òº ¹P Ðb4 ±Ò E C(± E; · 2009-03-31 · E ÒP ± ]9 c ¯ C-](https://static.documents.pub/doc/80x56/5f5bc6d135900a7247621012/r-p47-p-b4-e-c-e-2009-03-31-e-p-9-c-c.jpg)


![HIGH COURT OF AUSTRALIA - LexisNexis...Woodside Energy Ltd v Electricity Generation Corporation [2014] HCA 7 5 March 2014 P47/2013 & P48/2013 ORDER Matter No P47/2013 Appeal dismissed](https://static.documents.pub/doc/80x56/6048feac048dad414956efad/high-court-of-australia-lexisnexis-woodside-energy-ltd-v-electricity-generation.jpg)