23
BY Engr. Munawar Iqbal Director (Hydropower) PPIB, Ministry of Water and Power, Government of Pakistan Kathmandu, Nepal 9-10 May 2016
BY
Engr. Munawar Iqbal Director (Hydropower)
PPIB, Ministry of Water and Power,
Government of Pakistan
Kathmandu, Nepal
9-10 May 2016
C O N T E N T S
Background
Key Stakeholders
Current Power Generation
Power Sector Players
Power Generation Expansion

PAKISTAN POWER SECTOR - TIMELINE JOURNEY
3
Initially two vertically integrated utilities i.e. WAPDA and KESC, were
responsible for generation, transmission and distribution in their areas
UPTO 70s: KESC and WAPDA performed well
IN 80s: Demand-Supply shortfall started
IN 90s: Budget constraints. Involvement of private sector
1992: Govt.’s strategic plan to reform Pakistan power sector
1993: Power Policy 1994 formulated
1994: Creation of PPIB & National Power Plan by WAPDA
1997: Regulatory body NEPRA created
2001: WAPDA Vision 2025 prepared
2002: NEPRA issued a future plan for Pakistan Power Sector
2005: Medium Term Development Framework prepared
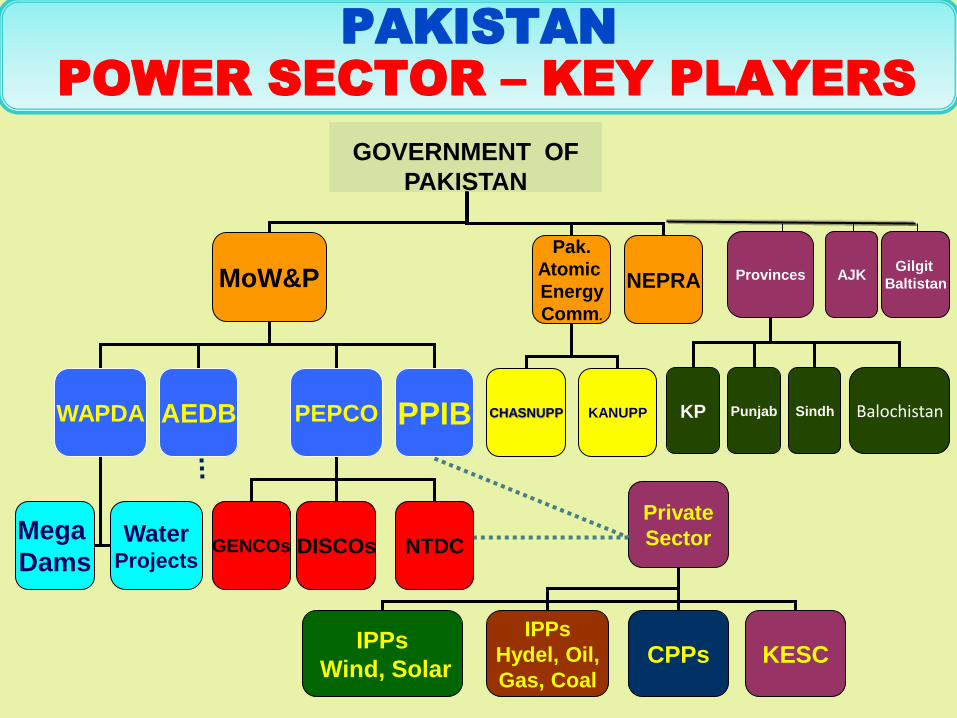
Private
Sector
IPPs
Hydel, Oil,
Gas, Coal CPPs KESC
Provinces
KP Punjab Sindh Balochistan
AJK Gilgit
Baltistan
IPPs
Wind, Solar
MoW&P
Pak.
Atomic
Energy
Comm.
NEPRA
WAPDA AEDB PEPCO PPIB
Mega
Dams Water
Projects GENCOs DISCOs NTDC
CHASNUPP KANUPP
GOVERNMENT OF
PAKISTAN
PAKISTAN
POWER SECTOR – KEY PLAYERS
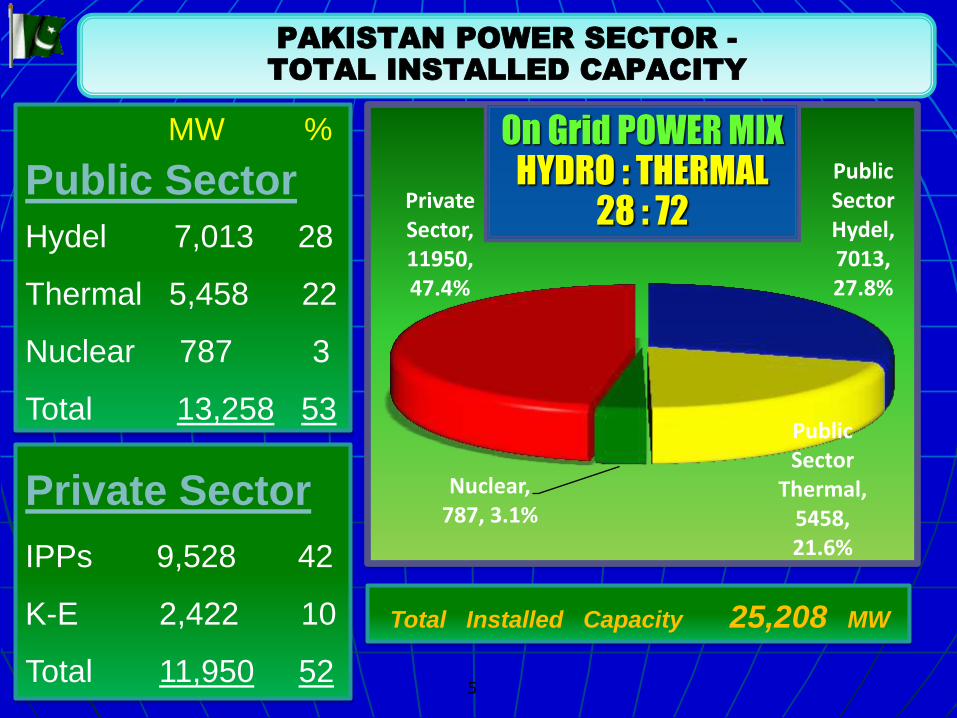
PAKISTAN POWER SECTOR -
TOTAL INSTALLED CAPACITY
5
Total Installed Capacity 25,208 MW
MW %
Public Sector
Hydel 7,013 28
Thermal 5,458 22
Nuclear 787 3
Total 13,258 53
Private Sector
IPPs 9,528 42
K-E 2,422 10
Total 11,950 52
Public Sector Hydel, 7013, 27.8%
Public Sector
Thermal, 5458, 21.6%
Nuclear, 787, 3.1%
Private Sector, 11950, 47.4%
On Grid POWER MIX HYDRO : THERMAL
28 : 72
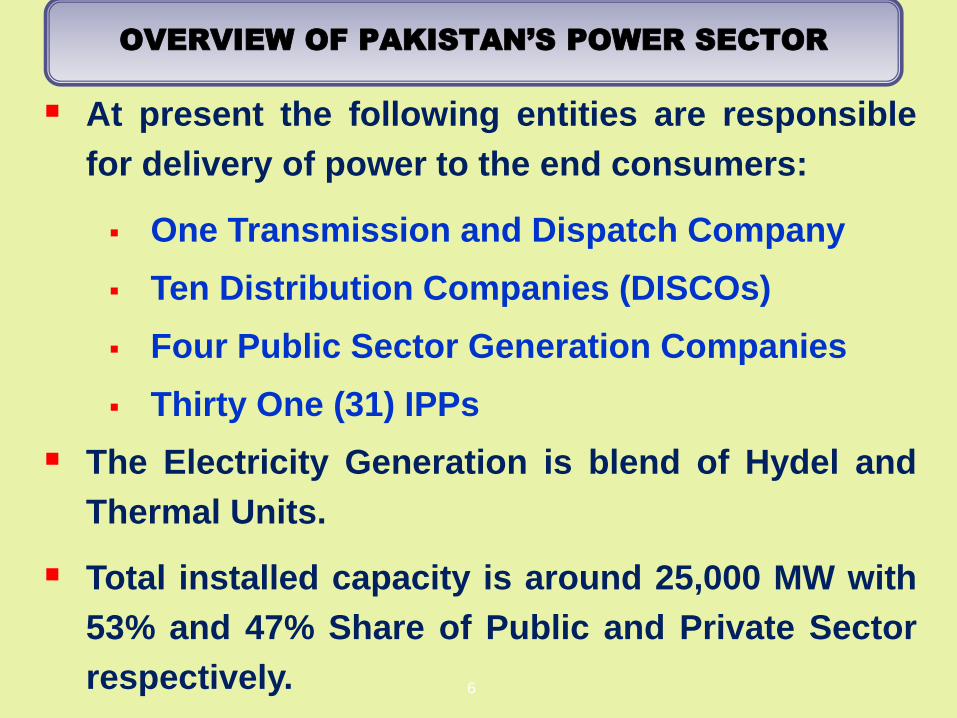
OVERVIEW OF PAKISTAN’S POWER SECTOR
6
At present the following entities are responsible
for delivery of power to the end consumers:
One Transmission and Dispatch Company
Ten Distribution Companies (DISCOs)
Four Public Sector Generation Companies
Thirty One (31) IPPs
The Electricity Generation is blend of Hydel and
Thermal Units.
Total installed capacity is around 25,000 MW with
53% and 47% Share of Public and Private Sector
respectively.

PUBLIC SECTOR
WAPDA
GoKP Province
GoAJ&K
GoPunjab
PAKISTAN POWER SECTOR
GENERATION
PRIVATE SECTOR
PPIB (Hydel, Coal, Gas, Oil)
AEDB (Wind, Solar, Bio,)
GoKP (Hydel)
GoAJ&K (Hydel)
GoPunjab (Hydel, Coal)
Fed
eral
P
rovi
nci
al

PAKISTAN POWER SECTOR
TRANSMISSION
NATIONAL TRANSMISSION
AND DISPATCH COMPANY
(NTDC)
CENTRAL POWER PURCHASING AGENCY
(CPPA-G)
220 KV
500 KV
TRANSMISSION
PURCHASING
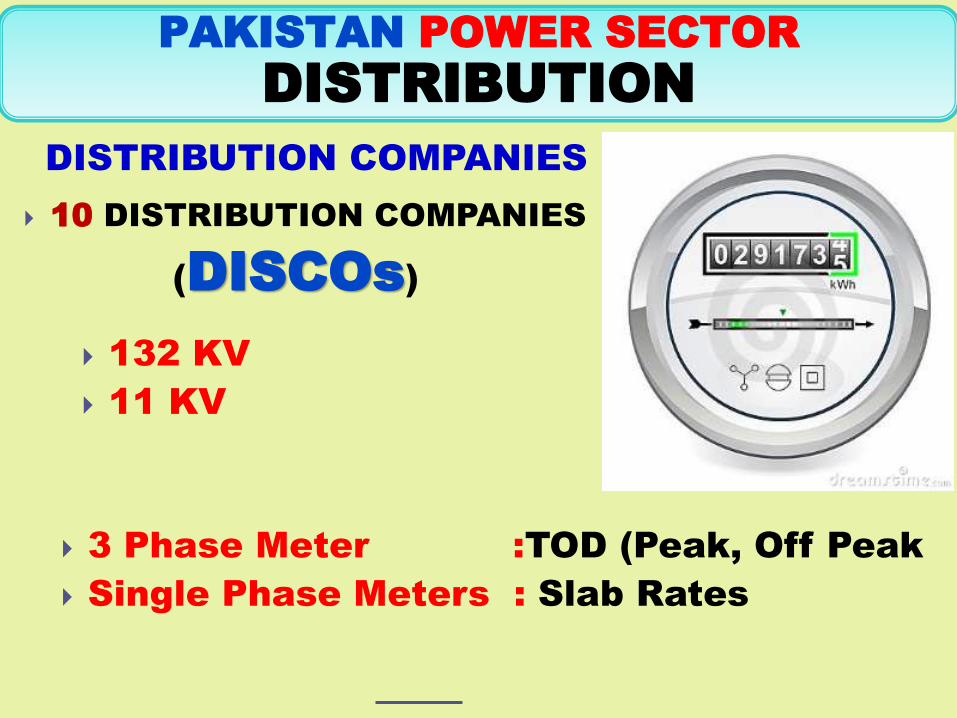
PAKISTAN POWER SECTOR
DISTRIBUTION
10 DISTRIBUTION COMPANIES
(DISCOs)
DISTRIBUTION COMPANIES
132 KV
11 KV
3 Phase Meter :TOD (Peak, Off Peak
Single Phase Meters : Slab Rates
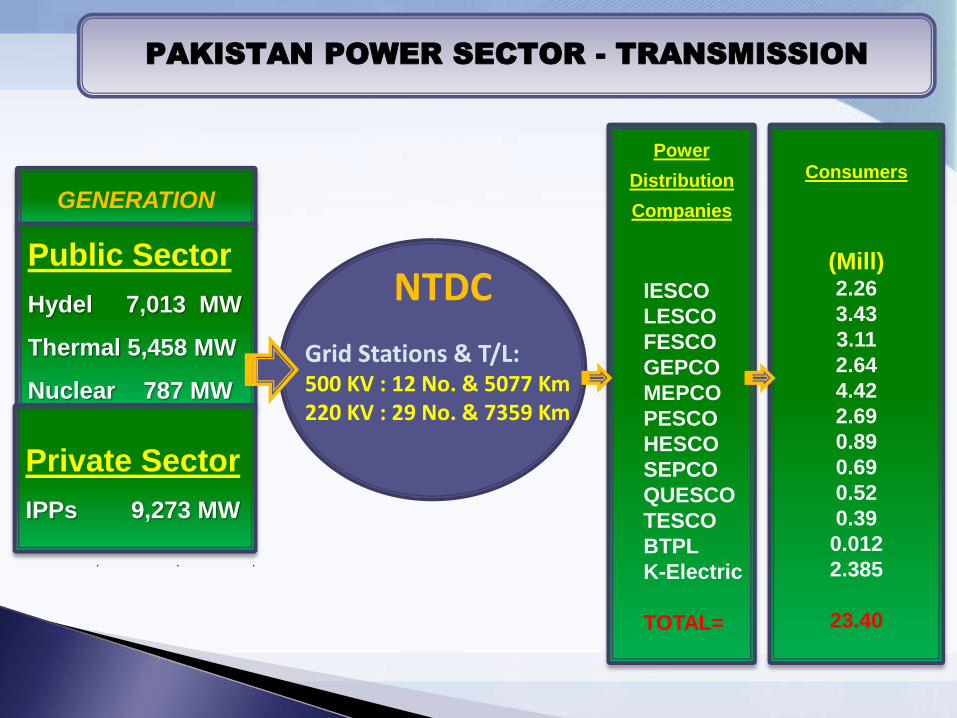
PAKISTAN POWER SECTOR - TRANSMISSION
GENERATION
Public Sector
Hydel 7,013 MW
Thermal 5,458 MW
Nuclear 787 MW
Private Sector
IPPs 9,273 MW
NTDC
Grid Stations & T/L: 500 KV : 12 No. & 5077 Km 220 KV : 29 No. & 7359 Km
Power
Distribution
Companies
IESCO
LESCO
FESCO
GEPCO
MEPCO
PESCO
HESCO
SEPCO
QUESCO
TESCO
BTPL
K-Electric
TOTAL=
Consumers
(Mill) 2.26
3.43
3.11
2.64
4.42
2.69
0.89
0.69
0.52
0.39
0.012
2.385
23.40

HYDEL = 7-9 C/kWh
COAL = 8 to 9.5 C/kWh (imported to local)
GAS = 6-7 C/kwh (but no sufficient gas reserves)
RFO = 20 C/kWh
WIND = 15 C/kWh
Solar = 14-15 C/kWh
LNG = to be re-determined by NEPRA
MARDAN
WARSAK
BANNU
DAUDKHEL
BURHAN NEW RAWAT
I.S.P.R
MANGLA
TARBELA
GAKHAR
SAHOWALA
K.S.KAKU
RAVI
JAPAN
KEL N.ABAD
SABA
YOUSAF WALA
VEHARI
KAPCO
ROUSCH
UCH
AES
N.G.P.S M.GARH
GUDDU
LIBERTY
DADU
HALARD
LAKHRA
JAMSHORO
KOTRI
HUBCO
KDA-33
(KESC)
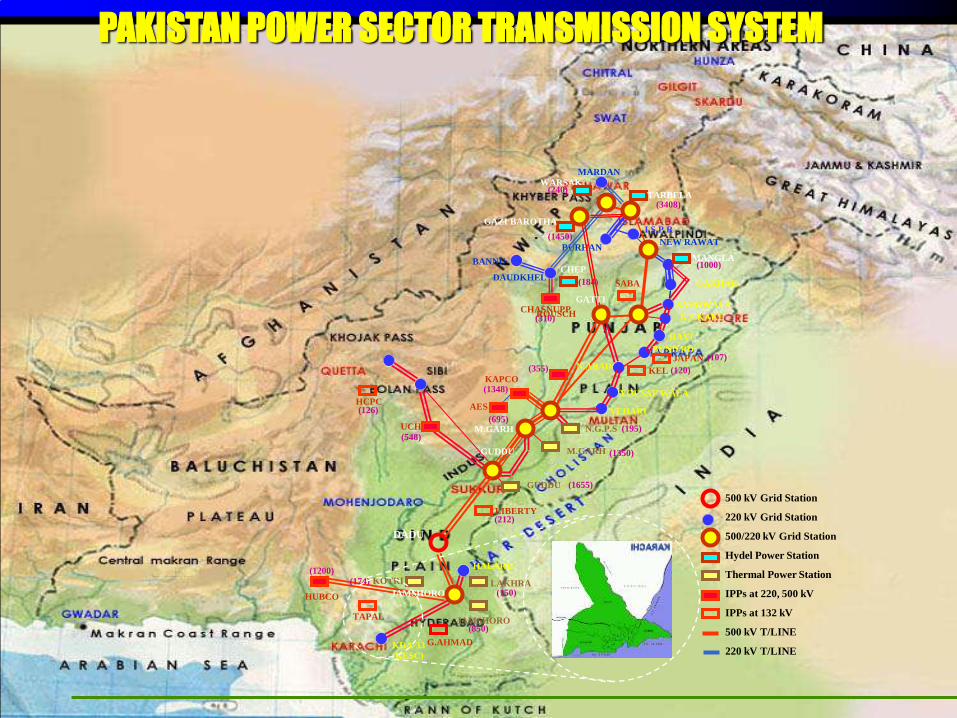
500 kV Grid Station
220 kV Grid Station
500/220 kV Grid Station
Hydel Power Station
Thermal Power Station
IPPs at 220, 500 kV
IPPs at 132 kV
500 kV T/LINE
220 kV T/LINE
(240)
(3408)
(1000)
(107)
(120)
(195)
(1350)
(310)
CHEP
(184)
(355)
(1348)
(695)
HCPC (126)
(548)
(1655)
(212)
(150)
(850)
(174)
(1200)
GAZI BAROTHA
(1450)
CHASNUPP GATTI
BUND RD:
M.GARH GUDDU
JAMSHORO
PAKISTAN POWER SECTOR TRANSMISSION SYSTEM
TAPAL
G.AHMAD
13
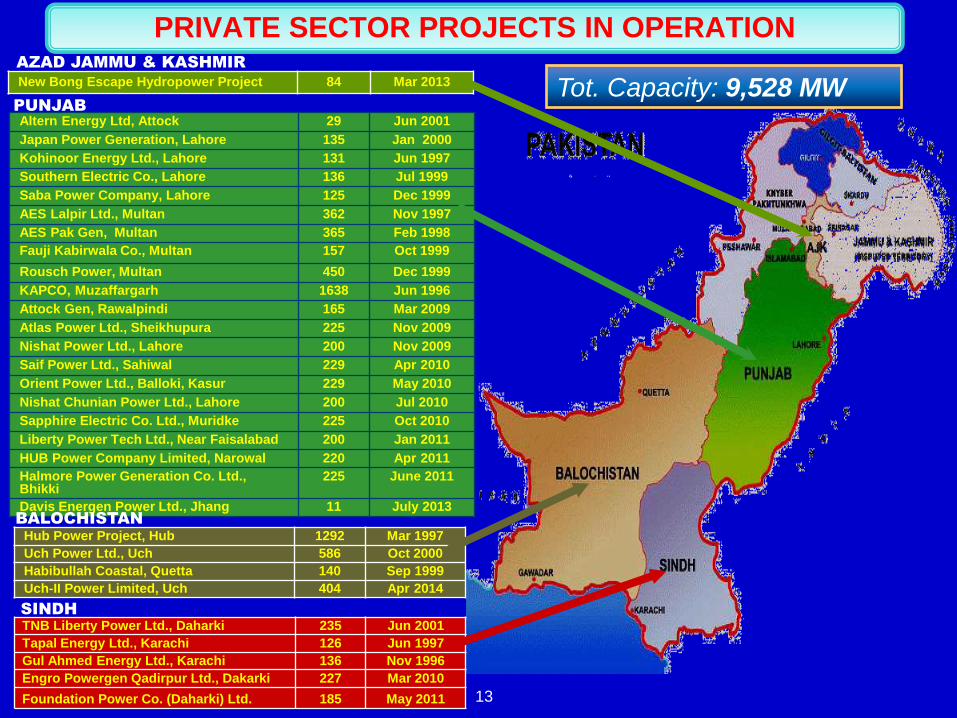
Altern Energy Ltd, Attock 29 Jun 2001
Japan Power Generation, Lahore 135 Jan 2000
Kohinoor Energy Ltd., Lahore 131 Jun 1997
Southern Electric Co., Lahore 136 Jul 1999
Saba Power Company, Lahore 125 Dec 1999
AES Lalpir Ltd., Multan 362 Nov 1997
AES Pak Gen, Multan 365 Feb 1998
Fauji Kabirwala Co., Multan 157 Oct 1999
Rousch Power, Multan 450 Dec 1999
KAPCO, Muzaffargarh 1638 Jun 1996
Attock Gen, Rawalpindi 165 Mar 2009
Atlas Power Ltd., Sheikhupura 225 Nov 2009
Nishat Power Ltd., Lahore 200 Nov 2009
Saif Power Ltd., Sahiwal 229 Apr 2010
Orient Power Ltd., Balloki, Kasur 229 May 2010
Nishat Chunian Power Ltd., Lahore 200 Jul 2010
Sapphire Electric Co. Ltd., Muridke 225 Oct 2010
Liberty Power Tech Ltd., Near Faisalabad 200 Jan 2011
HUB Power Company Limited, Narowal 220 Apr 2011
Halmore Power Generation Co. Ltd., Bhikki
225 June 2011
Davis Energen Power Ltd., Jhang 11 July 2013
Hub Power Project, Hub 1292 Mar 1997
Uch Power Ltd., Uch 586 Oct 2000
Habibullah Coastal, Quetta 140 Sep 1999
Uch-II Power Limited, Uch 404 Apr 2014
TNB Liberty Power Ltd., Daharki 235 Jun 2001
Tapal Energy Ltd., Karachi 126 Jun 1997
Gul Ahmed Energy Ltd., Karachi 136 Nov 1996
Engro Powergen Qadirpur Ltd., Dakarki 227 Mar 2010
Foundation Power Co. (Daharki) Ltd. 185 May 2011
PUNJAB
BALOCHISTAN
SINDH
Tot. Capacity: 9,528 MW AZAD JAMMU & KASHMIR
New Bong Escape Hydropower Project 84 Mar 2013
PRIVATE SECTOR PROJECTS IN OPERATION
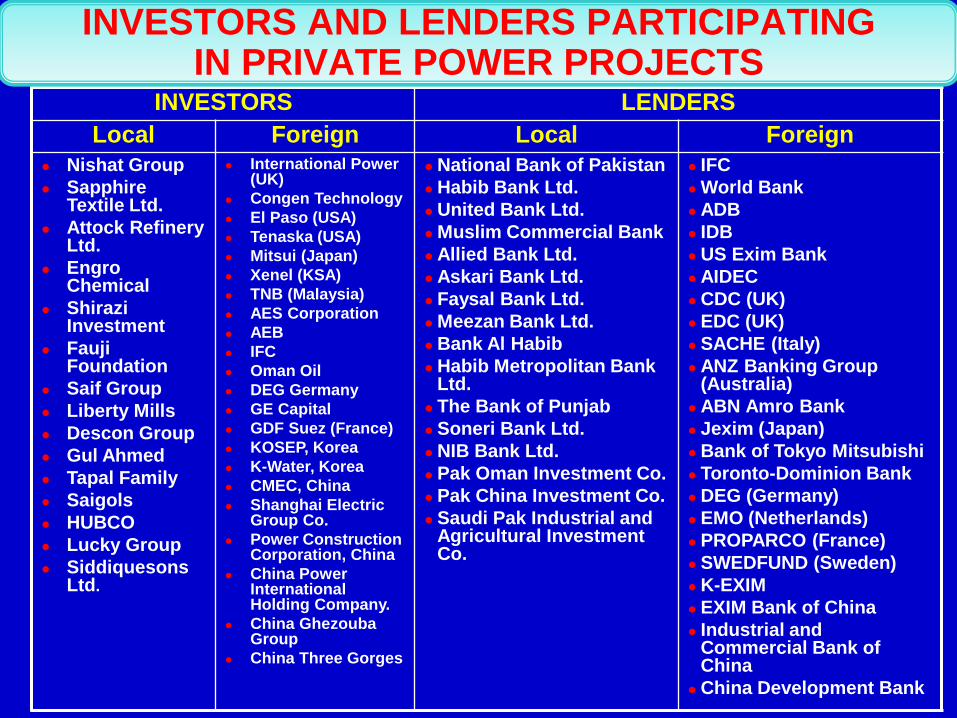
INVESTORS LENDERS
Local Foreign Local Foreign
Nishat Group
Sapphire Textile Ltd.
Attock Refinery Ltd.
Engro Chemical
Shirazi Investment
Fauji Foundation
Saif Group
Liberty Mills
Descon Group
Gul Ahmed
Tapal Family
Saigols
HUBCO
Lucky Group
Siddiquesons Ltd.
International Power (UK)
Congen Technology
El Paso (USA)
Tenaska (USA)
Mitsui (Japan)
Xenel (KSA)
TNB (Malaysia)
AES Corporation
AEB
IFC
Oman Oil
DEG Germany
GE Capital
GDF Suez (France)
KOSEP, Korea
K-Water, Korea
CMEC, China
Shanghai Electric Group Co.
Power Construction Corporation, China
China Power International Holding Company.
China Ghezouba Group
China Three Gorges
National Bank of Pakistan
Habib Bank Ltd.
United Bank Ltd.
Muslim Commercial Bank
Allied Bank Ltd.
Askari Bank Ltd.
Faysal Bank Ltd.
Meezan Bank Ltd.
Bank Al Habib
Habib Metropolitan Bank Ltd.
The Bank of Punjab
Soneri Bank Ltd.
NIB Bank Ltd.
Pak Oman Investment Co.
Pak China Investment Co.
Saudi Pak Industrial and Agricultural Investment Co.
IFC
World Bank
ADB
IDB
US Exim Bank
AIDEC
CDC (UK)
EDC (UK)
SACHE (Italy)
ANZ Banking Group (Australia)
ABN Amro Bank
Jexim (Japan)
Bank of Tokyo Mitsubishi
Toronto-Dominion Bank
DEG (Germany)
EMO (Netherlands)
PROPARCO (France)
SWEDFUND (Sweden)
K-EXIM
EXIM Bank of China
Industrial and Commercial Bank of China
China Development Bank
INVESTORS AND LENDERS PARTICIPATING IN PRIVATE POWER PROJECTS
POWER GENERATION EXPANSION PLAN
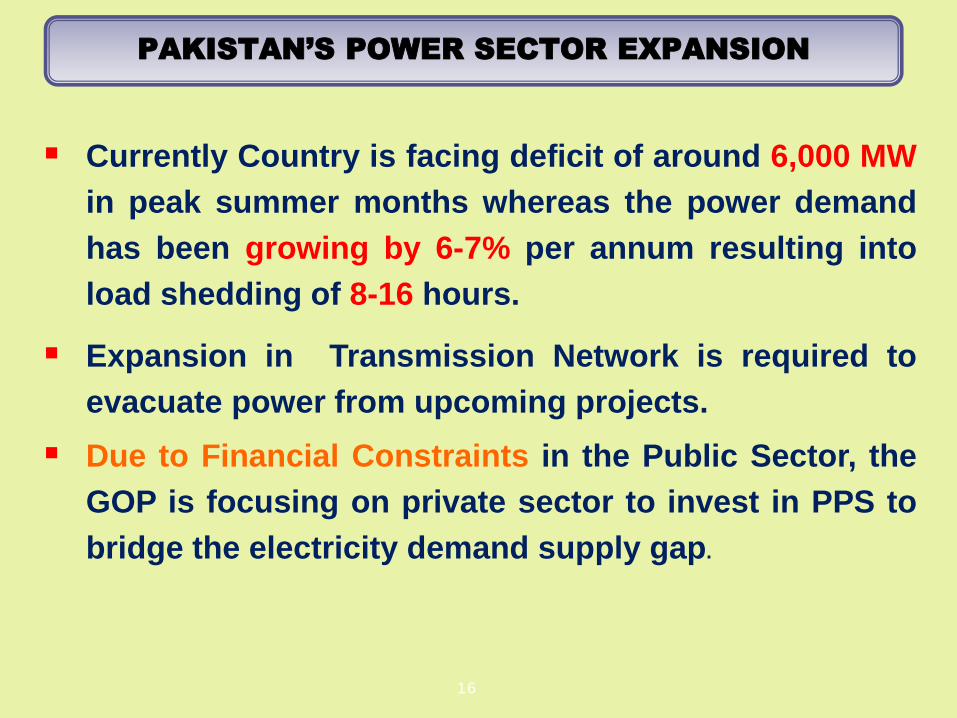
PAKISTAN’S POWER SECTOR EXPANSION
16
Currently Country is facing deficit of around 6,000 MW
in peak summer months whereas the power demand
has been growing by 6-7% per annum resulting into
load shedding of 8-16 hours.
Expansion in Transmission Network is required to
evacuate power from upcoming projects.
Due to Financial Constraints in the Public Sector, the
GOP is focusing on private sector to invest in PPS to
bridge the electricity demand supply gap.
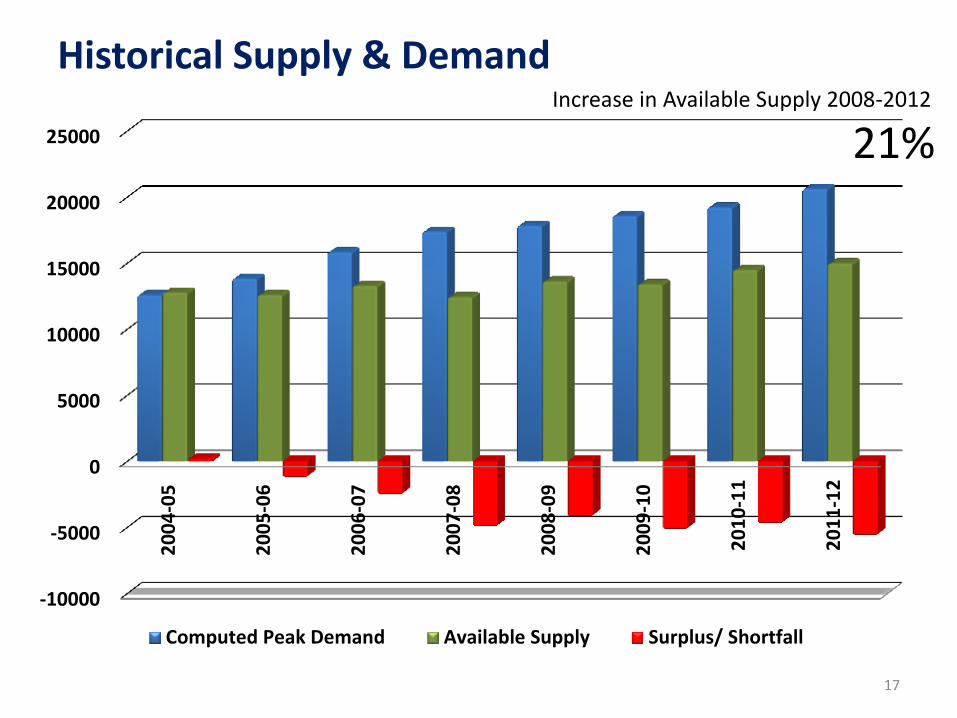
Historical Supply & Demand
17
-10000
-5000
0
5000
10000
15000
20000
25000
20
04
-05
20
05
-06
20
06
-07
20
07
-08
20
08
-09
20
09
-10
20
10
-11
20
11
-12
Computed Peak Demand Available Supply Surplus/ Shortfall
Increase in Available Supply 2008-2012
21%
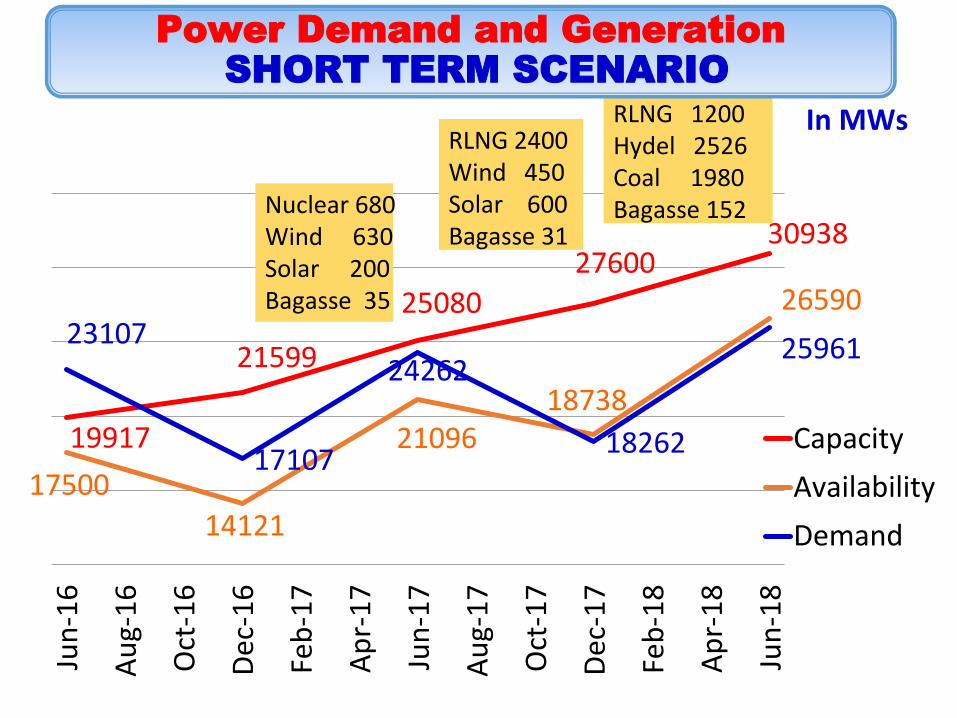
19917
21599
25080
27600 30938
17500
14121
21096 18738
26590 23107
17107
24262
18262
25961
Jun
-16
Au
g-1
6
Oct
-16
Dec
-16
Feb
-17
Ap
r-1
7
Jun
-17
Au
g-1
7
Oct
-17
Dec
-17
Feb
-18
Ap
r-1
8
Jun
-18
Capacity
Availability
Demand
Nuclear 680 Wind 630 Solar 200 Bagasse 35
RLNG 2400 Wind 450 Solar 600 Bagasse 31
RLNG 1200 Hydel 2526 Coal 1980 Bagasse 152
In MWs
Power Demand and Generation
SHORT TERM SCENARIO
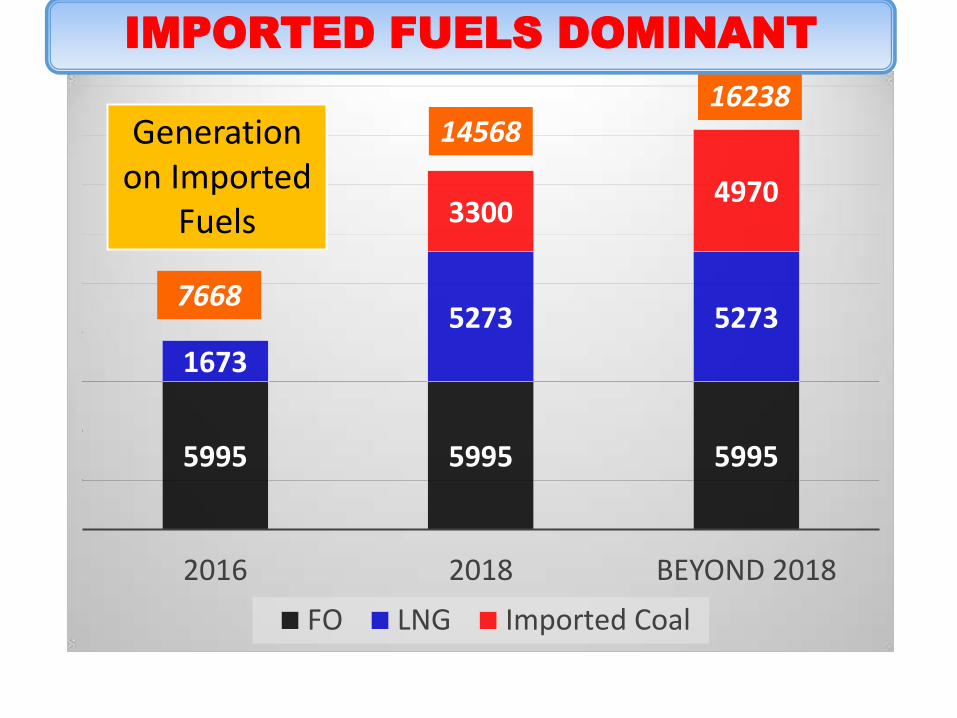
5995 5995 5995
1673
5273 5273
3300 4970
2016 2018 BEYOND 2018
FO LNG Imported Coal
14568 16238
7668
Generation on Imported
Fuels
IMPORTED FUELS DOMINANT
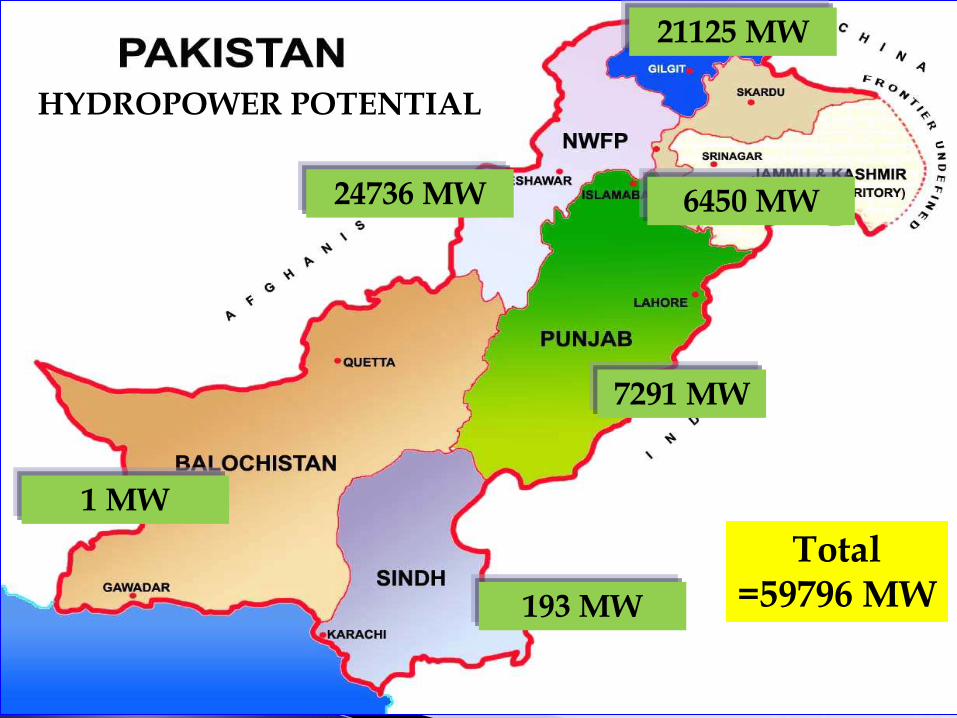
24736 MW
21125 MW
6450 MW
7291 MW
193 MW
1 MW
HYDROPOWER POTENTIAL
Total =59796 MW
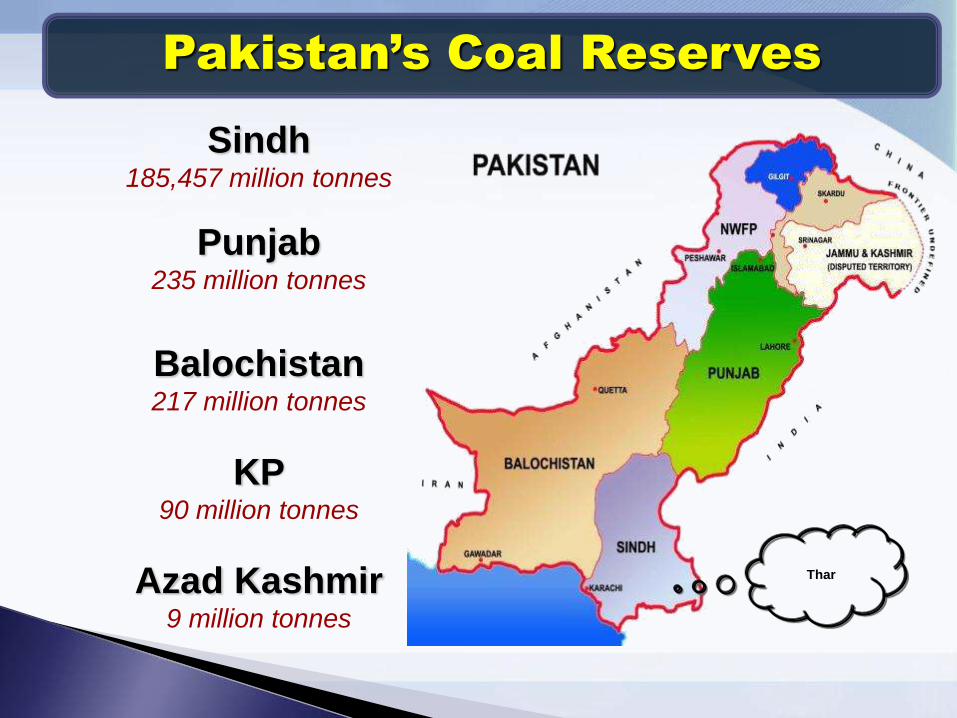
Pakistan’s Coal Reserves
Sindh 185,457 million tonnes
Punjab 235 million tonnes
Balochistan 217 million tonnes
KP 90 million tonnes
Azad Kashmir 9 million tonnes
Thar

UPCOMING IPPs
Description/ Year Hydel Coal Gas
Total
(MW)
No. of
Projects MW No. MW No. MW No.
2017 150 1 3,300 3 0 0 3,450 4
2018 0 0 2,640 2 1000 4 3,640 6
2019 232 2 1910 4 0 0 2,142 6
2020 1,360 2 0 0 0 0 1,360 2
2021 870 1 0 0 0 0 870 1
2022 2,033 5 0 0 120 1 2,153 6
2023 1,690 2 0 0 0 0 1,690 2
2024 1,088 4 0 0 0 0 1,088 4
2025 80 1 0 0 0 0 80 1
Grand Total 7,503 18 7,850 9 1120 5 16,473 32
22