66
Working Paper Document ECONOMIC IMPORTANCE OF THE BELGIAN PORTS : Flemish maritime ports, Liège port complex and the port of Brussels – Report 2014 by George van Gastel June 2016 No 299

Working Paper Document
ECONOMIC IMPORTANCE OF THE BELGIAN PORTS :
Flemish maritime ports, Liège port complex and the port of Brussels – Report 2014
by George van Gastel
June 2016 No 299

NBB WORKING PAPER No. 299 - JUNE 2016
Editor Jan Smets, Governor of the National Bank of Belgium Statement of purpose:
The purpose of these working papers is to promote the circulation of research results (Research Series) and analytical studies (Documents Series) made within the National Bank of Belgium or presented by external economists in seminars, conferences and conventions organised by the Bank. The aim is therefore to provide a platform for discussion. The opinions expressed are strictly those of the authors and do not necessarily reflect the views of the National Bank of Belgium. Orders
For orders and information on subscriptions and reductions: National Bank of Belgium, Documentation - Publications service, boulevard de Berlaimont 14, 1000 Brussels Tel +32 2 221 20 33 - Fax +32 2 21 30 42 The Working Papers are available on the website of the Bank: http://www.nbb.be © National Bank of Belgium, Brussels All rights reserved. Reproduction for educational and non-commercial purposes is permitted provided that the source is acknowledged. ISSN: 1375-680X (print) ISSN: 1784-2476 (online)

NBB WORKING PAPER No. 299 - JUNE 2016
Abstract
This paper is an annual publication issued by the Microeconomic Analysis service of the National Bank of Belgium. The Flemish maritime ports (Antwerp, Ghent, Ostend, Zeebrugge), the Autonomous Port of Liège and the port of Brussels play a major role in their respective regional economies and in the Belgian economy, not only in terms of industrial activity but also as intermodal centers facilitating the commodity flow. This update paper1 provides an extensive overview of the economic importance and development of the Flemish maritime ports, the Liège port complex and the port of Brussels for the period 2009 - 2014, with an emphasis on 2014. Focusing on the three major variables of value added, employment and investment, the report also provides some information based on the social balance sheet and an overview of the financial situation in these ports as a whole. These observations are linked to a more general context, along with a few cargo statistics. Annual accounts data from the Central Balance Sheet Office were used for the calculation of direct effects, the study of financial ratios and the analysis of the social balance sheet. The indirect effects of the activities concerned were estimated in terms of value added and employment, on the basis of data from the National Accounts Institute. As a result of the underlying calculation method the changes of indirect employment and indirect value added can differ from one another. The developments concerning economic activity in the six ports in 2013 - 2014 are summarised in the table on the next page: In 2014 the growth of maritime traffic in the Flemish sea ports was once again due solely to developments in the port of Antwerp. However, that did not necessarily mean that direct value added followed the same trend: except for the port of Zeebrugge, all other Flemish ports recorded an increase. Direct employment is continuing to decline, except in the port of Ghent where it remains steady. Investment appears to be picking up, after last year’s weak figures. Cargo traffic in the ports of Liège and Brussels was up in 2014, but that did not result in any increase in value added. The decline in direct employment also persisted, certainly in the port of Liège. This report provides a comprehensive account of these issues, giving details for each economic sector, although the comments are confined to the main changes that occurred in 2014. This report is available for download at the following address http://www.nbb.be. Key words: branch survey, maritime cluster, subcontracting, indirect effects, transport, intermodality,
public investments. JEL classification: C67, H57, J21, L22, L91, L92, R15, R34 and R41.
1 Update of Van Nieuwenhove F. (June 2015), Economic importance of the Belgian ports: Flemish maritime ports, Liège port
complex and the port of Brussels - Report 2013, NBB, Working Paper No. 283 (Document series). All figures have been updated. This paper is available at the following address: http://www.nbb.be > Publications and research > Working papers > 2015 – No. 283.

NBB WORKING PAPER No. 299 - JUNE 2016
Ports Value added (current prices)
Employment Investment (current prices)
Cargo traffic
____
€ million
Change 2013-2014
(in p.c.)
FTE
Change 2013-2014
(in p.c.)
€ million
Change 2013-2014
(in p.c.)
x 1,000 tonnes
Change 2013-2014
(in p.c.)
ANTWERP Direct ................................9,923.8 + 1.4 60,586 - 1.2 3,229.0 + 37.0
Indirect ................................9,035.7 + 2.7 82,068 - 0.7
TOTAL ................................18,959.5 + 2.0 142,654 - 0.9 3,229.0 + 37.0 199,012 + 4.2
GHENT Direct ................................3,575.4 + 4.9 27,602 + 0.6 403.6 - 4.3
Indirect ................................3,898.2 + 6.8 34,443 + 0.4
TOTAL ................................7,473.6 + 5.9 62,044 + 0.5 403.6 - 4.3 25,889 - 0.3
OSTEND Direct ................................492.4 + 1.4 4,957 - 1.7 118.9 + 56.1
Indirect ................................355.2 - 0.4 4,275 - 0.4
TOTAL ................................847.6 + 0.7 9,232 - 1.1 118.9 + 56.1 1,431 - 21.3
ZEEBRUGGE Direct ................................935.8 - 4.5 9,365 - 3.7 220.1 + 0.2 Indirect ................................767.4 - 2.6 10,192 - 0.8
TOTAL ................................1,703.2 - 3.7 19,557 - 2.2 220.1 + 0.2 42,548 - 0.7
FLEMISH Direct ................................14,927.4 + 1.9 102,510 - 1.0 3,971.6 + 29.2 MARITIME Indirect ................................13,040.2 + 3.0 123,917 - 0.5 PORTS TOTAL ................................27,967.6 + 2.4 226,427 - 0.7 3,971.6 + 29.2 268,880 + 2.8
LIÈGE Direct ................................1,130.9 - 5.9 8,165 - 7.9 195.7 - 8.4 Indirect ................................1,186.0 - 7.8 11,773 - 8.2
TOTAL ................................2,316.9 - 6.9 19,937 - 8.1 195.7 - 8.4 15,001 + 0.4
BRUSSELS Direct ................................473.8 - 2.2 4,032 - 1.3 53.0 - 22.6 Indirect ................................342.2 - 3.4 3,706 - 3.8
TOTAL ................................816.0 - 2.7 7,738 - 2.5 53.0 - 22.6 4,439 + 2.7
BELGIAN Direct ................................16,532.0 + 1.2 114,706 - 1.5 4,220.3 + 25.7 PORTS Indirect ................................14,089.9 + 2.2 135,736 - 1.1 TOTAL ................................30,622.0 + 1.6 250,442 - 1.3 4,220.3 + 25.7 288,320 + 2.7
Source: NBB (calculations based on the Belgian accounts filed with the Central Balance Sheet Office, and the Belgian IOTs). For ports with economic linkages between them, a portion of the indirect effect calculated by port is cancelled out when the calculation is done at a more aggregate level, i.e. for a group of ports. The sum of the indirect effects by port is thus greater than the total indirect effects calculated for the ports as a whole.
Corresponding author: NBB, Microeconomic Information department, e-mail: [email protected] This paper was made with the technical support and the expertise of Mr Marc Van Kerckhoven. Research results and conclusions expressed are those of the author and do not necessarily reflect the views of the National Bank of Belgium or any other institution to which the author is affiliated. All remaining errors are ours. The author would like to thank his colleagues from the Microeconomic Information department for their assistance and support as well as the colleagues from the National and regional accounts service for their input. Special thanks go to Messrs Rudy Trogh, head of department at the NBB, and Jean-Pierre Merckx of the Flemish Port Commission for their support and their comments on this paper.

NBB WORKING PAPER No. 299 - JUNE 2016
Contents Foreword ............................................................................................................................................. 4 Introduction ......................................................................................................................................... 5
1 ECONOMIC IMPORTANCE OF THE BELGIAN PORTS............................................................. 8 1.1 Traffic in the Belgian ports ........................................................................................................... 8 1.2 Competitive position of the Belgian ports ..................................................................................... 9 1.3 Direct and indirect value added in the Belgian ports................................................................... 11 1.4 Direct and indirect employment in the Belgian ports ................................................................... 12 1.5 Investment in the Belgian ports ................................................................................................. 13 1.6 Demography of the Belgian ports .............................................................................................. 14 1.7 Breakdown of the variables by company size ............................................................................ 15 1.8 Social balance sheet in the Belgian ports .................................................................................. 16 1.9 Financial ratios in the Belgian ports ........................................................................................... 19 1.10 Financial health in the Belgian ports .......................................................................................... 20
2 PORT OF ANTWERP ............................................................................................................... 22 2.1 Port developments .................................................................................................................... 22 2.2 Value added .............................................................................................................................. 22 2.3 Employment .............................................................................................................................. 23 2.4 Investment ................................................................................................................................ 23
3 PORT OF GHENT..................................................................................................................... 27 3.1 Port developments .................................................................................................................... 27 3.2 Value added .............................................................................................................................. 27 3.3 Employment .............................................................................................................................. 27 3.4 Investment ................................................................................................................................ 28
4 PORT OF OSTEND .................................................................................................................. 32 4.1 Port developments .................................................................................................................... 32 4.2 Value added .............................................................................................................................. 32 4.3 Employment .............................................................................................................................. 32 4.4 Investment ................................................................................................................................ 32
5 PORT OF ZEEBRUGGE ........................................................................................................... 37 5.1 Port developments .................................................................................................................... 37 5.2 Value added .............................................................................................................................. 37 5.3 Employment .............................................................................................................................. 38 5.4 Investment ................................................................................................................................ 38
6 LIÈGE PORT COMPLEX .......................................................................................................... 42 6.1 Port developments .................................................................................................................... 42 6.2 Value added .............................................................................................................................. 42 6.3 Employment .............................................................................................................................. 42 6.4 Investment ................................................................................................................................ 42
7 PORT OF BRUSSELS .............................................................................................................. 47 7.1 Port developments .................................................................................................................... 47 7.2 Value added .............................................................................................................................. 47 7.3 Employment .............................................................................................................................. 47 7.4 Investment ................................................................................................................................ 47
8 BRIEF SUMMARY .................................................................................................................... 52 ANNEX 1: LIST OF NACE-BEL BRANCHES .................................................................................... 54 ANNEX 2: DEFINITION OF THE FINANCIAL RATIOS ....................................................................... 59 BIBLIOGRAPHY ................................................................................................................................ 60 NATIONAL BANK OF BELGIUM - WORKING PAPERS SERIES ...................................................... 62

4 NBB WORKING PAPER No. 299 - JUNE 2016
Foreword
Every year the National Bank of Belgium publishes an update of the study of the economic importance of the Flemish maritime ports, the Liège port complex and the port of Brussels. Two aspects of the sector’s economic impact are highlighted: the direct effects and the indirect effects. The former concerns the activities resulting from the presence of maritime and non-maritime enterprises and public services in or near the ports, while the latter relates to the value added and employment generated by suppliers and subcontractors serving these enterprises and based in Belgium. The statistical data covers the period 2009 - 2014, but only the main developments recorded in the period 2013 - 2014 are discussed in detail. The number of annexes is limited to: the list of NACE-BEL 2008 branches. the definition of the financial ratios.
The methodology remains mainly unchanged: the criteria for selecting firms and the analysis are the same as in previous editions. The NACE-BEL 2008 code is used to select and classify companies by sector. Owing to the use of the latest available statistical data (see introduction), the estimates of the indirect effects may differ from those in previous publications. Following a brief introduction, the study is split into six parts devoted to the four Flemish maritime ports, the Liège port complex, and the port of Brussels. For reasons explained in the introduction, the commentary in this study will be very brief, and the emphasis will be on the statistical section.

NBB WORKING PAPER No. 299 - JUNE 2016 5
Introduction
Objectives of the study and some comments on the methodology
The economic importance of the ports examined is analysed from three angles, namely the purely economic angle, and the social and financial angles. The study only covers firms belonging to branches of activity which have an economic link with the ports. That link is defined in relation to both a functional and a geographical criterion. The main developments in the period 2009 - 2014 concern the study of the following variables: value added at current prices2: the value which a firm adds to its inputs during the financial year via
the production process. The value added of a firm indicates its contribution to the wealth of the country or region (in percentages of GDP). In accounting terms, this is calculated as the sum of staff costs, depreciation and value adjustments, the operating profit or loss, provisions for liabilities and charges, and certain operating expenses;
employment in full-time equivalents (FTE): the average workforce during the financial year. Direct employment only covers employees on the payroll of the businesses concerned, indirect employment also includes self-employed workers.
investment at current prices3: this corresponds to the tangible fixed assets acquired during the year, including capitalised production costs4.
The economic impact of the ports under review is described on the basis of these three variables. Employment and the social balance sheet are also taken into account in the analysis of the social impact. That section deals in particular with working time, labour costs, the extent to which use is made of external personnel, and the composition, movements and training of the labour force. The financial analysis forms the third angle of the study; it is based on the examination of three financial ratios and a financial health indicator, using a model designed by the Bank5. The ratios in question are the return on equity after taxes, liquidity in the broad sense, and solvency. The current edition presents a financial analysis of Belgian ports taken as a whole. Readers wishing to compare the financial ratios of an individual company with its sector ratios can find this information in the company reports published by the Central Balance Sheet Office. These company reports are composed of five parts6, one of which is devoted to comparing the financial ratios of the company with those of its sector, and another of which is devoted to situating the company in one of the ten categories of financial health based on its composite financial health indicator. This comparison is more relevant than a comparison based principally on geographic location, which would include a variety of business activities. The financial health indicator is based on Belgian companies' annual accounts. This indicator is designed as a weighted combination of variables, created by means of a model constructed in the same way as a failure prediction model. The model takes the form of a logistic regression discriminating between failing and non-failing companies. The indicator summarizes each company’s situation in a single value which takes account simultaneously of the solvency, liquidity and profitability dimensions.
2 Unless otherwise stated, the text always indicates value added at current prices. Developments at constant prices (by volume)
are explicitly mentioned. Value added at constant prices is calculated by means of the deflator of gross domestic product. 3 Unless otherwise stated, investment is always indicated at current prices. Developments at constant prices (by volume) are
explicitly mentioned. Investment at constant prices is calculated by means of the deflator of gross fixed capital formation. 4 Decommissioning of assets is not taken into account. 5 See Vivet D. (2011), Development of a financial health indicator based on companies’ annual accounts, NBB, Working Paper
No. 213 (Document series), Brussels. 6 An interactive online application "Company file" is available on the Central Balance Sheet Office's website. It enables, based on
several annual accounts drawn up according to a standard model for recent financial years, to analyze the financial situation of a company and to compare it with its sector. The five parts of the company report are: identifying company information, a survey of the major elements of the annual accounts, a survey of the cash flow, a comparison of company ratios with those of its economic sector, the company’s positioning in one of the ten pre-defined categories of financial health based on its composite financial health indicator (See http://cri.nbb.be).
6 NBB WORKING PAPER No. 299 - JUNE 2016
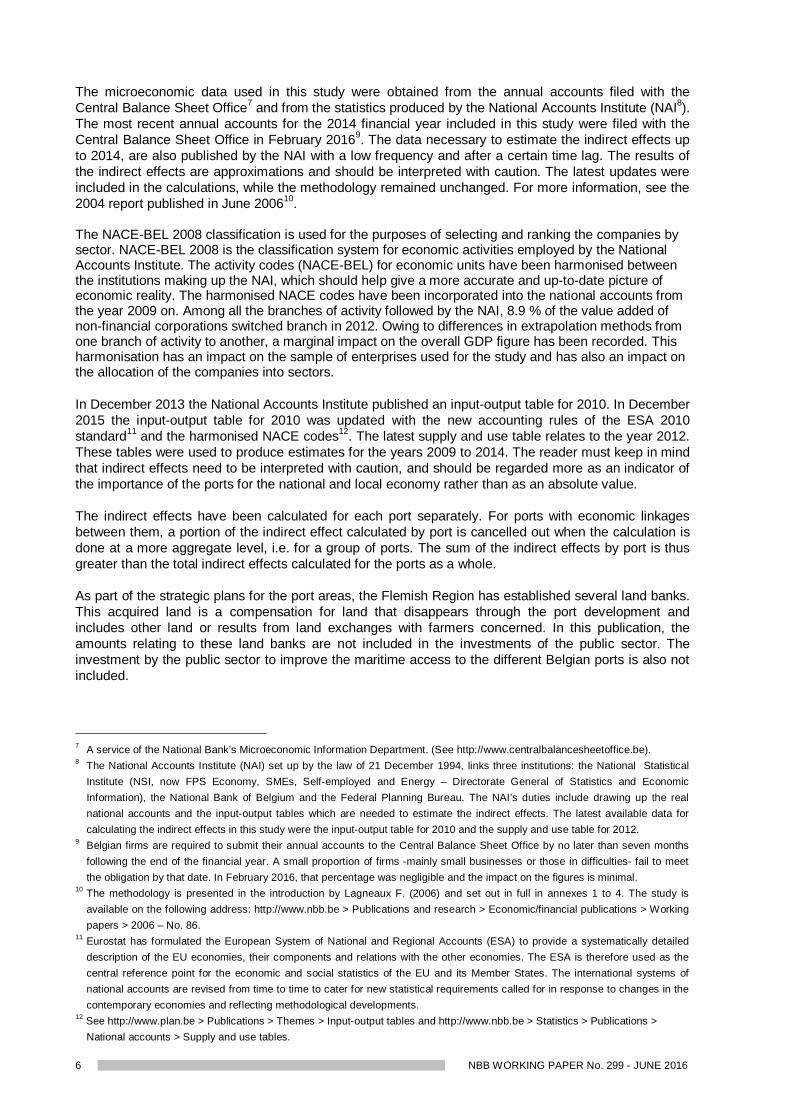
The microeconomic data used in this study were obtained from the annual accounts filed with the Central Balance Sheet Office7 and from the statistics produced by the National Accounts Institute (NAI8). The most recent annual accounts for the 2014 financial year included in this study were filed with the Central Balance Sheet Office in February 20169. The data necessary to estimate the indirect effects up to 2014, are also published by the NAI with a low frequency and after a certain time lag. The results of the indirect effects are approximations and should be interpreted with caution. The latest updates were included in the calculations, while the methodology remained unchanged. For more information, see the 2004 report published in June 200610. The NACE-BEL 2008 classification is used for the purposes of selecting and ranking the companies by sector. NACE-BEL 2008 is the classification system for economic activities employed by the National Accounts Institute. The activity codes (NACE-BEL) for economic units have been harmonised between the institutions making up the NAI, which should help give a more accurate and up-to-date picture of economic reality. The harmonised NACE codes have been incorporated into the national accounts from the year 2009 on. Among all the branches of activity followed by the NAI, 8.9 % of the value added of non-financial corporations switched branch in 2012. Owing to differences in extrapolation methods from one branch of activity to another, a marginal impact on the overall GDP figure has been recorded. This harmonisation has an impact on the sample of enterprises used for the study and has also an impact on the allocation of the companies into sectors. In December 2013 the National Accounts Institute published an input-output table for 2010. In December 2015 the input-output table for 2010 was updated with the new accounting rules of the ESA 2010 standard11 and the harmonised NACE codes12. The latest supply and use table relates to the year 2012. These tables were used to produce estimates for the years 2009 to 2014. The reader must keep in mind that indirect effects need to be interpreted with caution, and should be regarded more as an indicator of the importance of the ports for the national and local economy rather than as an absolute value. The indirect effects have been calculated for each port separately. For ports with economic linkages between them, a portion of the indirect effect calculated by port is cancelled out when the calculation is done at a more aggregate level, i.e. for a group of ports. The sum of the indirect effects by port is thus greater than the total indirect effects calculated for the ports as a whole. As part of the strategic plans for the port areas, the Flemish Region has established several land banks. This acquired land is a compensation for land that disappears through the port development and includes other land or results from land exchanges with farmers concerned. In this publication, the amounts relating to these land banks are not included in the investments of the public sector. The investment by the public sector to improve the maritime access to the different Belgian ports is also not included.
7 A service of the National Bank’s Microeconomic Information Department. (See http://www.centralbalancesheetoffice.be). 8 The National Accounts Institute (NAI) set up by the law of 21 December 1994, links three institutions: the National Statistical
Institute (NSI, now FPS Economy, SMEs, Self-employed and Energy – Directorate General of Statistics and Economic Information), the National Bank of Belgium and the Federal Planning Bureau. The NAI’s duties include drawing up the real national accounts and the input-output tables which are needed to estimate the indirect effects. The latest available data for calculating the indirect effects in this study were the input-output table for 2010 and the supply and use table for 2012.
9 Belgian firms are required to submit their annual accounts to the Central Balance Sheet Office by no later than seven months following the end of the financial year. A small proportion of firms -mainly small businesses or those in difficulties- fail to meet the obligation by that date. In February 2016, that percentage was negligible and the impact on the figures is minimal.
10 The methodology is presented in the introduction by Lagneaux F. (2006) and set out in full in annexes 1 to 4. The study is available on the following address: http://www.nbb.be > Publications and research > Economic/financial publications > Working papers > 2006 – No. 86.
11 Eurostat has formulated the European System of National and Regional Accounts (ESA) to provide a systematically detailed description of the EU economies, their components and relations with the other economies. The ESA is therefore used as the central reference point for the economic and social statistics of the EU and its Member States. The international systems of national accounts are revised from time to time to cater for new statistical requirements called for in response to changes in the contemporary economies and reflecting methodological developments.
12 See http://www.plan.be > Publications > Themes > Input-output tables and http://www.nbb.be > Statistics > Publications > National accounts > Supply and use tables.

NBB WORKING PAPER No. 299 - JUNE 2016 7
Some of the results for years up to 2013 may differ from those stated in the earlier studies. That is due mainly to the harmonisation of the NACE codes and in a lesser extent to the availability of more accurate data on certain firms, information that is extrapolated into the past to ensure consistent time series. For a number of years, the National Bank’s port studies have been an important statistical source for the various stakeholders concerned with their economic analysis. Since most port authorities and various government bodies provide detailed accounts of maritime activities, the Bank sought scope for efficiency and synergy. For that reason, this year’s publication will place more emphasis on the statistical section. The commentary will give the general outline via the contribution from the port authorities. For the more detailed, comprehensive account of developments, see the annual reports of the Belgian port authorities and specialised publications such as those issued by the Flemish Port Commission. International environment
Global GDP grew by 2.6 % in 2014. The advanced economies saw 1.7 % growth, roughly 0.5 percentage point higher than in the previous year. The United Kingdom and the United States recorded growth of 2.9 % and 2.4 % respectively. In the euro zone, the negative growth was converted to expansion of 0.9 %. However, growth in Russia was down by 0.7 percentage point to 0.6 %. In the emerging economies, the growth slowdown continued, primarily owing to the disappointing performance in Brazil, where GDP growth dropped from 3 % in 2013 to 0.1 % in 2014. China’s growth figure remained relatively strong (7.4 %), despite a 0.4 percentage point fall. In 2014, the growth of the volume of total world trade was more or less equal to the previous year (3.4 %). World seaborne trade also increased by that figure overall. Container traffic did particularly well, with growth of 5.6 %. This was reflected to some extent in higher freight prices, though the increase was very modest owing to the persistent excess capacity.

8 NBB WORKING PAPER No. 299 - JUNE 2016
1 ECONOMIC IMPORTANCE OF THE BELGIAN PORTS
1.1 Traffic in the Belgian ports
CHART 1 CARGO TRAFFIC IN THE BELGIAN PORTS (indices 2009 = 100)
Sources: Port Authorities.
In 2014, maritime traffic in Flanders increased by around 2.8 % overall. That increase was due solely to the substantial growth in the port of Antwerp. However, the decline in tonnage at Zeebrugge and Ghent was modest in 2014. The port of Zeebrugge will see a decrease in 2015 owing to the tendency towards cooperation and rationalisation in the shipping companies. The continuing downward trend at Ostend is due to the port’s repositioning, focusing on a number of niche activities. The port of Brussels recorded strong growth of 2.7 % while in Liège the increase was rather modest (0.4 %). In regard to container traffic, only two ports really count, namely Zeebrugge (representing almost 15.9 % of total traffic) and Antwerp (83.8 %). Antwerp alone recorded significant growth of 5.9 %, while traffic in Zeebrugge was more or less stable with an increase of 0.5 %. All things considered, that is still a pleasing figure in view of the said developments in the shipping companies. The expansion of container traffic in Antwerp seems to have halted the downward trend evident in recent years, so that the relative share is now up slightly at 48 % of total traffic. Furthermore, traffic has now regained its 2010 level. Roll-on/roll-off traffic recorded a modest rise of around 0.7 % in 2014. That growth was largely due to developments at the biggest RoRo port, Zeebrugge, where this traffic was up by 4 %. In that port it is cars which account for most of the growth, with an increase of 13.2 %. The port of Ghent also saw a substantial 9 % rise in roll-on/roll-off traffic. Conversely, in the port of Antwerp the downward trend continued, with a 2 % decline. Except at the port of Ghent, where the figure of 0.5 % implied virtual stabilisation, the pressure on conventional general cargo appeared to persist in all other ports in 2014. That category declined by more than 4.6 % overall, In the biggest port – Antwerp – traffic was down by 2.5 %. In Zeebrugge there was a notable decline of 28.8 %, but that appears to be a correction following 23.1 % growth in 2013. As regards liquid bulk, the total increase of 3.5 % is almost entirely attributable to the port of Antwerp (+5.6 %). The ports of Ghent and Zeebrugge recorded steep falls of 11.9 % and 5.1 % respectively.
0102030405060708090
100110120130140150
2009 2010 2011 2012 2013 2014
Antwerp Ghent Ostend Zeebrugge Liège Brussels

NBB WORKING PAPER No. 299 - JUNE 2016 9
The overall decline of 1.7 % in bulk cargo was due mainly to the 6.5 % fall in the port of Antwerp. In Ghent, the main port for dry bulk, there was an increase of 2.3 %. Zeebrugge and Ostend, both representing shares of around 4 %, respectively recorded 5 % growth and a 3.8 % decline.
TABLE 1 MARITIME TRAFFIC IN THE FLEMISH PORTS IN 2014 (in thousands of tonnes, unless otherwise stated)
Antwerp Ghent Ostend Zeebrugge Total Change from 2013 to 2014
(in p.c.)
Share in 2014 (in p.c.)
Containers ........................................................ 108,317 414 0 20,514 129,244 + 4.8 48.1
Change 2013 - 2014 (p.c.) .......................... + 5.9 - 29.6 n, + 0.5
Roll-on/roll-off13 ................................................ 4,470 2,149 0 13,043 19,662 + 0.7 7.3
Conventional general cargo14 .......................... 9,885 3,175 65 1,193 14,317 - 4.6 5.3
Liquid bulk ........................................................ 62,834 3,412 57 6,562 72,865 + 3.5 27.1
Dry bulk ............................................................ 13,506 16,740 1,309 1,236 32,792 - 1.7 12.2
TOTAL 2014 .................................................... 199,012 25,889 1,431 42,548 268,880 + 2.8 100.0 Change 2013 - 2014 (p.c. ) .......................... + 4.2 - 0.3 - 21.3 - 0.7 + 2.8
TOTAL 2015 (p.m.) .......................................... 208,419 26,362 1,295 38,318 274,394 Change 2014 - 2015 (p.c. ) .......................... + 4.7 + 1.8 - 9.5 - 9.9 + 2.1
Source: Port authorities and Flemish Port Commission.
1.2 Competitive position of the Belgian ports
To refine the analysis of the competitive position of the Flemish maritime ports, all cargo traffic is compared with that of the other ports in the Hamburg - Le Havre range15. The share of the four Flemish ports in that range increased slightly in 2014 from 22.9 to 23.0 %. In 2014 the port of Rotterdam lost ground to some extent in favour of Antwerp, since the recorded growth was significantly lower. Owing to that development in Antwerp, the overall market share of the Flemish ports remained unchanged. Rotterdam declined in dry bulk (-0.7 %) and in liquid bulk (-2.1 %). Together these two categories account for 65 % of total traffic, so that any decline has a substantial impact on the overall figure. However, container traffic expanded strongly in 2014: +8.1 %. Conventional general cargo, in which Rotterdam is traditionally less strong, was up by 28.1 %. This primarily concerns a correction following the very weak figures for conventional general cargo in 2013. For Rotterdam, developments in 2015 nevertheless imply a strong revival. The port of Amsterdam which had been expanding over the past few years recorded further growth of around 1.5 %, just below the average for recent years. There was no resulting increase in its market share. The growth was achieved in dry bulk (+2.7 %) and liquid bulk (+2.3 %), the core business of the port of Amsterdam (share of bulk: 96 %). Containers, RoRo and other general cargo declined. In 2014 total traffic came to 79.7 million tonnes. Zeeland Seaports regained its 2011 level with strong growth of more than 6 %. Liquid bulk is the main item, in which traffic was up by 1.7 million tonnes (+12.9 %); that is also the main factor behind the overall growth of the ports of Flessingue and Terneuzen. Dry bulk, containers and RoRo also recorded an increase. Conventional general cargo, which is quite important for Zeeland Seaports with a 22 % share of the traffic portfolio, was down by 2.5 % in 2014. Total traffic came to 35.1 million tonnes in 2014. After a very strong performance in 2011 and 2012, the port of Bremen recorded a decline in traffic in 2013. In 2014 there was a further decrease, albeit small. For the ports of Bremen and Bremerhaven,
13 Abbreviated as RoRo. Horizontal handling of goods using wheeled equipment inside and outside the ship, unlike LoLo (lift on/
lift-off), which entails vertical handling. The RoRo data presented in this report do not take into account containerised cargo, this category of goods being included in the line entitled "containers".
14 The term "general cargo" comprises the following categories: containerised goods, RoRo and conventional general cargo. 15 For the purposes of this study, the range comprises the ports of Hamburg, Bremen, Amsterdam, Rotterdam, the Zeeland
Seaports complex (port of Terneuzen and Flessingue), Antwerp, Ghent, Zeebrugge, Ostend, Dunkirk and Le Havre.

10 NBB WORKING PAPER No. 299 - JUNE 2016
containers account for three-quarters of traffic. There are regular shifts in the container market and these have a major impact on total traffic for Bremen. In Hamburg the upward trend peaked in 2014 with very strong growth of +4.8 %, and traffic totalling 145.7 million tonnes. In 2015 this expansion apparently came to a halt, when a very sharp decline was recorded. In 2014 growth in Hamburg occurred mainly in the sectors where the port is strong: containers (+6.2 %) and dry bulk (+2.9 %). In 2014 the port of Dunkirk achieved the strongest relative growth in the range (+7.9 %),with traffic totalling 47,0 million tonnes. That growth is due mainly to the increase in dry bulk (+9.3 %), which accounts for the major part (50 %) of traffic at the port. The second largest sector, RoRo, also recorded a big rise (+13 %). Le Havre’s position was more or less stable in 2014. A loss of dry bulk was offset by relatively strong growth in container traffic (+4.9 %). Le Havre has yet to regain the level prevailing before the economic crisis. The total traffic of 67.6 million tonnes in 2014 is still well below the 2008 figure of 80.5 million tonnes.
TABLE 2 TOTAL MARITIME TRAFFIC IN THE HAMBURG - LE HAVRE RANGE (INCLUDING OSTEND AND ZEELAND SEAPORTS) (in millions of tonnes,unless otherwise stated16)
Port 2009 2010 2011 2012 2013 2014 2015(p.m.)
Annual average change
from 2009 to
2014
Change from
2013 to 2014
Average share in
the range from
2009 to 2014
Share in 2014
(in p.c.) (in p.c.) (in p.c.) (in p.c.)
Antwerp .............................. 157.8 178.2 187.2 184.1 191.0 199.0 208.4 + 4.7 + 4.2 16.4 17.1
Ghent ................................ 20.8 27.3 27.2 26.3 26.0 25.9 26.4 + 4.5 - 0.3 2.3 2.2
Ostend ............................... 5.4 4.9 3.8 3.2 1.8 1.4 1.3 - 23.2 - 21.3 0.3 0.1
Zeebrugge ......................... 44.9 49.6 47.0 43.5 42.8 42.5 38.3 - 1.1 - 0.7 4.0 3.6 Total Flemish ports ......... 228.8 260.0 265.2 257.2 261.6 268.9 274.4 + 3.3 + 2.8 23.0 23.0 Amsterdam17 ...................... 73.4 72.7 74.9 77.1 78.5 79.7 78.4 + 1.7 + 1.5 6.8 6.8
Bremen .............................. 63.1 68.9 80.6 84.0 78.8 78.3 73.4 + 4.4 - 0.6 6.8 6.7
Dunkirk ............................... 45.0 42.7 47.5 47.6 43.6 47.0 46.6 + 0.9 + 7.9 4.1 4.0
Hamburg ............................ 110.4 120.0 132.2 130.9 139.0 145.7 137.8 + 5.7 + 4.8 11.6 12.5
Le Havre ............................ 73.8 70.2 67.6 63.5 67.2 67.6 68.9 - 1.7 + 0.6 6.1 5.8
Rotterdam .......................... 387.0 430.2 434.6 441.5 440.5 444.7 466.4 + 2.8 + 1.0 38.5 38.1
Zeeland Seaports18 ............ 28.8 33.0 35.5 34.0 33.0 35.1 0.0 + 4.0 + 6.3 3.0 3.0
Total for the 11 ports .........1,010.3 1,097.6 1,138.0 1,135.8 1,142.1 1,166.9 1,145.9 + 2.9 + 2.2
Total world traffic 7,858.0 8,408.9 8,784.3 9,196.7 9,513.6 9,841.7 + 4.6 + 3.4
Share for the 11 ports in world traffic (in p.c.) ........ 12.9 13.1 13.0 12.4 12.0 11.9
Sources: For the traffic in the range: port authorities; for world traffic (tonnes loaded): Unctad, Review of Maritime Transport 2015. Duisburg is maintaining its position as Europe’s biggest inland port. With the exception of the port of Paris all other major inland ports recorded positive growth.
16 In principle, maritime traffic excludes bunkering. However, some ports’ traffic figures do include bunkering, which may lead to
minor differences in mutual comparisons. 17 The figures stated here refer to the port of Amsterdam only, and not the entire complex which also includes the ports of
Beverwijk, Velsen/IJmuiden and Zaanstad. 18 Zeeland Seaports = ports of Flessingue and Terneuzen

NBB WORKING PAPER No. 299 - JUNE 2016 11
TABLE 3 CARGO TRAFFIC BY SHIP IN THE PORTS OF DUISBURG, PARIS, LIÈGE AND BRUSSELS (in thousands of tonnes,unless otherwise stated)
Port 2009 2010 2011 2012 2013 2014 2015 (p.m.)
Annual average change
from 2009 to 2014
Change from
2013 to 2014
(in p.c.) (in p.c.)
Duisburg19 .................................... 34,500 49,200 50,400 38,200 47,200 51,100 n. + 8.2 + 8.3
Paris ............................................. 20,214 20,865 22,338 22,600 21,200 20,100 20,550 - 0.1 - 5.2
Liège20 .......................................... 16,287 19,095 19,455 16,477 14,947 15,001 14,605 -1.6 + 0.4
Brussels ........................................ 4,011 4,385 4,855 4,606 4,324 4,439 4,364 + 2.0 + 2.7
Sources: Port of Duisburg, Port of Paris, Liège Port Authority and Brussels Port Authority.
1.3 Direct and indirect value added in the Belgian ports
The direct growth of value added recorded in the Belgian ports (+1.2 %) was almost entirely in line with GDP growth. The increase is due primarily to growth in the ports of Ghent and Antwerp. Ostend also recorded expansion. The noteworthy rise in Ghent was due mainly to strong expansion in the non-maritime cluster. In the port of Antwerp there were widely varying growth figures, and the increase came mainly from developments in shipping companies and the chemical sector. In Zeebrugge, the maritime cluster recorded an increase but that growth was negated by the decline in the non-maritime cluster, and more particularly by the departure of an industrial firm in the electronics sector. In the port of Ostend, growth figures were generally positive with the exception of trade. In the port of Liège there was an overall decline in both clusters, one factor being developments in the metalworking industry, a key industrial sector. Finally, in the port of Brussels, trade was the only sector to record a favourable trend. As regards indirect value added, the downward trend which had begun in 2010 was reversed. For all ports together, growth came to 2.2 %, driven mainly by shipping companies, chemicals and the metalworking industry. In 2014 direct value added of the Belgian ports accounted for 4.1 % of Belgium’s GDP (and 7.6 % including indirect value added).
19 The traffic considered here is the total of the cargo handled in all Duisburg Ports, thus, totalling the Duisport Group and the
private company ports. 20 The traffic considered here is the total of the cargo handled on the public and the private quays. As from 2015 the traffic of the
Liège Port Complex will only include the public quays. The private quays are gradually managed by the Autonomous Port of Liège.

12 NBB WORKING PAPER No. 299 - JUNE 2016
TABLE 4 VALUE ADDED IN THE BELGIAN PORTS (in € million - current prices)
2009
2010 2011 2012 2013 2014 Relative share in
2014
Change from 2013
to 2014
Annual average change
from 2009 to 2014
(in p.c.) (in p.c.) (in p.c.) _______________________ _____________________ ____________________ _____________________ ____________________ _____________________ ________________________ _____________________ ____________________________
1. DIRECT EFFECTS ........... 15,061.1 16,680.9 16,459.3 16,382.5 16,340.5 16,532.0 100.0 + 1.2 + 1.9
Antwerp .............................. 8,794.5 10,006.4 9,710.8 10,020.9 9,782.0 9,923.8 60.0 + 1.4 + 2.4
Ghent ................................. 3,091.2 3,371.5 3,361.9 3,203.7 3,407.1 3,575.4 21.6 + 4.9 + 3.0
Ostend ............................... 450.7 494.6 470.5 485.7 485.4 492.4 3.0 + 1.4 + 1.8
Zeebrugge .......................... 925.8 960.3 976.2 944.7 979.4 935.8 5.7 - 4.5 + 0.2
Liège .................................. 1,271.1 1,311.0 1,413.9 1,186.1 1,202.2 1,130.9 6.8 - 5.9 - 2.3
Brussels ............................. 527.8 537.0 526.0 541.4 484.4 473.8 2.9 - 2.2 - 2.1
Outside the ports (p.m)21 ... 80.8 115.8 136.7 132.2 128.0 135.0 - + 5.5 + 10.8
2. INDIRECT EFFECTS ....... 12,860.8 15,167.2 14,301.2 14,346.0 13,788.6 14,089.9 - + 2.2 + 1.8
TOTAL VALUE ADDED ....... 27,921.9 31,848.1 30,760.4 30,728.5 30,129.1 30,622.0 - + 1.6 + 1.9
Source: NBB (calculations based on the Belgian accounts filed with the Central Balance Sheet Office, and the Belgian IOTs). The data necessary to estimate the indirect effects are published by the NAI with a low frequency and after a certain time lag. The indirect effects for the period 2009-2014 are based on IOT 2010 and SUT 2010, 2011 and 2012. The calculated indirect effects are approximations and should be interpreted with caution.
CHART 2 CHANGE IN DIRECT VALUE ADDED (in € million, current prices)
Source: NBB (calculations based on the Belgian accounts filed with the Central Balance Sheet Office).
1.4 Direct and indirect employment in the Belgian ports
In contrast to value added, direct employment in the Belgian ports declined by -1.5 %, thus continuing the downward trend of recent years. Only the ports of Ghent and Ostend have managed to improve or stabilise their level of employment since 2009. Zeebrugge and Liège recorded the steepest falls. In Zeebrugge – as already mentioned – that was due to the departure of an industrial firm in the electronics branch. In the maritime cluster, employment
21 The firms in certain maritime branches may be selected from anywhere in the country, since their definition is sufficient in itself to
link them to the port activity. These are branches directly connected with the activity of the sea ports. Their results are therefore allocated among the Flemish ports, using the formula for the allocation of value added per branch. For each year and for each branch, this formula is calculated on the basis of the ratio between the direct value added generated in a given Flemish port and the direct value added generated in all the Flemish maritime ports. The line "Outside the ports (p.m.)" included in the tables 4, 5 and 6 collates these data, which are also allocated respectively in the tables showing value added, employment and investment in chapters 2 to 5 on the line entitled "Allocation (p.m.)".
-1.000
-500
0
500
1.000
1.500
2.000
2010 2011 2012 2013 2014
Maritime cluster Non-maritime cluster Belgian ports

NBB WORKING PAPER No. 299 - JUNE 2016 13
actually increased. In Liège, just as in the case of value added, both clusters saw a predominantly downward trend, owing to the metalworking industry. Indirect employment has been declining since 2011. Although that fall can be attributed to developments within various branches, the decline in indirect employment caused by the metalworking industry merits a mention. The share of port jobs in total Belgium employment came to 2.9 % for direct employment and 6.3 % for total employment in 2014 (3.1 and 6.7 % respectively in 2009).
TABLE 5 EMPLOYMENT IN THE BELGIAN PORTS (FTE)
2009 2010 2011 2012 2013 2014 Relative share in
2014
Change from 2013
to 2014
Annual average change
from 2009 to 2014
(in p.c.) (in p.c.) (in p.c.) _______________________ ____________________ ______________________ _____________________ ____________________ _____________________ __________________________________________________ ____________________ ___________________________
1. DIRECT EFFECTS ........... 120,175 116,165 115,507 117,446 116,486 114,706 100.0 - 1.5 - 0.9
Antwerp ............................. 63,180 61,341 60,120 61,181 61,325 60,586 52.8 - 1.2 - 0.8
Ghent ................................. 26,642 25,813 26,550 27,148 27,445 27,602 24.1 + 0.6 + 0.7
Ostend ............................... 4,902 4,860 4,718 5,098 5,041 4,957 4.3 - 1.7 + 0.2
Zeebrugge ......................... 10,752 10,250 10,072 9,962 9,726 9,365 8.2 - 3.7 - 2.7
Liège .................................. 10,366 9,673 9,750 9,555 8,862 8,165 7.1 - 7.9 - 4.7
Brussels ............................. 4,334 4,227 4,297 4,502 4,087 4,032 3.5 - 1.3 - 1.4
Outside the ports (p.m.)22 .. 2,331 2,240 2,187 2,140 2,091 2,002 - - 4.2 - 3.0
2. INDIRECT EFFECTS ....... 142,187 138,460 140,763 140,440 137,310 135,736 - - 1.1 - 0.9
TOTAL EMPLOYMENT ....... 262,362 254,625 256,270 257,886 253,797 250,442 - - 1.3 - 0.9
Source: NBB (calculations based on the Belgian accounts filed with the Central Balance Sheet Office, and the Belgian IOTs). The data necessary to estimate the indirect effects are published by the NAI with a low frequency and after a certain time lag.The indirect effects for the period 2009-2014 are based on IOT 2010 and SUT 2010, 2011 and 2012.The calculated indirect effects are approximations and should be interpreted with caution.
CHART 3 CHANGE IN DIRECT EMPLOYMENT (FTE)
Source: NBB (calculations based on the Belgian accounts filed with the Central Balance Sheet Office).
1.5 Investment in the Belgian ports
Investments recorded strong growth of 25.7 % overall. There were wide variations between ports. The pattern of investment is closely linked to projects and consequently highly volatile, so that the figures require a nuanced interpretation.
22 These figures stand for the activity of the maritime enterprises located outside the port limits and are divided among the Flemish
ports according to the breakdown of value added.
-5.000
-4.000
-3.000
-2.000
-1.000
0
1.000
2.000
3.000
2010 2011 2012 2013 2014Maritime cluster Non-maritime cluster Belgian ports

14 NBB WORKING PAPER No. 299 - JUNE 2016
TABLE 6 INVESTMENT IN THE BELGIAN PORTS23 (in € million - current prices)
2009 2010 2011 2012 2013 2014 Relative share in
2014
Change from 2013
to 2014
Annual average change
from 2009 to 2014
(in p.c.) (in p.c.) (in p.c.) ____________________________________________ ____________________ _____________________ _____________________ _____________________ _________________________ ________________________ ____________________________
Antwerp .............................. 3,080.0 2,521.8 2,402.6 2,321.4 2,356.5 3,229.0 76.5 + 37.0 + 0.9
Ghent ................................. 601.3 501.7 445.8 460.2 421.6 403.6 9.6 - 4.3 - 7.7
Ostend ............................... 125.7 105.9 90.3 95.5 76.2 118.9 2.8 + 56.1 - 1.1
Zeebrugge .......................... 194.7 349.6 293.9 254.6 219.7 220.1 5.2 + 0.2 + 2.5
Liège .................................. 534.6 186.5 203.2 238.1 213.7 195.7 4.6 - 8.4 - 18.2
Brussels ............................. 66.8 66.7 52.3 51.9 68.4 53.0 1.3 - 22.6 - 4.6
Outside the ports (p.m.)24 ... 247.9 454.5 306.7 213.5 208.4 285.0 - + 36.8 + 2.8
DIRECT INVESTMENT ........ 4,603.1 3,732.3 3,488.2 3,421.6 3,356.1 4,220.3 - + 25.7 - 1.7
Source: NBB (calculations based on the Belgian accounts filed with the Central Balance Sheet Office and on surveys).
CHART 4 CHANGE IN DIRECT INVESTMENT (in € million, current prices)
Source: NBB (calculations based on the Belgian accounts filed with the Central Balance Sheet Office).
1.6 Demography of the Belgian ports
The table entitled 'Demography of the Belgian Ports' gives an overview of changes in the sample population used for the study for the period 2009-2014. The public sector is not taken into consideration in this table. As a reminder, besides Belgian commercial enterprises, the study also covers a limited number of legal entities such as non-profit organizations or branches of foreign firms. The two columns, entitled '2009' and '2014', with the heading "Population" indicate the number of legal persons (regardless of the legal form of the entity) included in the study for the years 2009 and 2014 respectively. The 'Migrate-out' column lists firms that left the population during the period 2010 - 2014. Obviously, it is the other way round for the 'Migrate-in' column. There are several explanations justifying the exclusion from the survey population from one year to the next: the company has moved, changed activity, merged with another firm already established in the port (in which case, only the surviving company continues to feature in the study). The three last columns of the table give the number of firms affected by corporate restructuring (absorption, merger, takeover or split), by a stoppage or failure. The firms included in the 'Migrate-in' column can either be newly established firms (after 2009) coming into the population studied or existing companies that have, for instance, started activities or taken over another enterprise in the
23 Investment by the public authority Flemish Region is limited to the projects linked to a specific port. 24 These figures stand for the activity of the maritime enterprises located outside the port limits and are divided among the Flemish
ports according to the breakdown of value added.
-1.500
-1.000
-500
0
500
1.000
1.500
2010 2011 2012 2013 2014
Maritime cluster Non-maritime cluster Belgian ports

NBB WORKING PAPER No. 299 - JUNE 2016 15
port. The 'Missing account' column adds the number of firms that have not filed their annual accounts for the year 2014 and which, as far as we know, should not be excluded from the study25.
TABLE 7 DEMOGRAPHY OF THE BELGIAN PORTS FOR THE PERIOD 2009 - 2014 (Number of firms)
Sectors Population26 Death
2009 Migrate-In Migrate-Out Missing account
2014 Restructuring Stoppage Failure
MARITIME CLUSTER ............... 1,799 458 523 41 1,693 48 203 140 Shipping agents and forwarders 708 190 205 18 675 22 66 51
Cargo handling ....................... 375 77 89 5 358 19 37 12
Shipping companies ............... 362 133 119 10 366 3 60 39
Shipbuilding and repair .......... 160 36 56 7 133 1 18 25
Port construction and dredging 13 2 1 0 14 0 1 0
Fishing and fish industry ........ 134 14 37 0 111 3 18 12
Port trade ................................ 40 5 16 1 28 0 3 1
Port authority .......................... 7 1 0 0 8 0 0 0
Public sector ........................... n. n. n. n. n. n. n. n.
NON-MARITIME CLUSTER ..... 2,012 1,042 890 36 2,128 116 217 197
TRADE ...................................... 578 233 243 10 558 25 61 63
INDUSTRY ................................. 591 240 203 8 620 28 51 50
Energy .................................... 15 14 7 0 22 1 2 1
Fuel production ....................... 8 2 1 0 9 0 0 1
Chemicals ............................... 91 24 17 0 98 1 9 3
Car manufacturing .................. 25 2 7 0 20 1 2 0
Electronics .............................. 15 5 5 0 15 0 1 2
Metalworking industry ............. 122 35 30 1 126 5 8 9
Construction ........................... 178 111 88 7 194 9 16 26
Food industry .......................... 29 4 4 0 29 0 3 0
Other industries ...................... 108 43 44 0 107 11 10 8
LAND TRANSPORT .................. 201 85 79 4 203 8 18 24
Road transport ........................ 199 80 78 4 197 8 18 24
Other land transport ................ 2 5 1 0 6 0 0 0
OTHER LOGISTIC SERVICES.. 642 484 365 14 747 55 87 60
TOTAL ....................................... 3,811 1,500 1,413 77 3,821 164 420 337
Migrate-In = New in population after 2009. Migrate-Out = Left the population in the period 2010-2014. This category includes the category 'Death', the enterprises which moved their acitivities outside the port area or whose NACE-BEL branch changed. Death = legal situation at the closing date of this report Restructuring = Absorption + Takeover + Merger +Split Source: NBB (calculations based on the Crossroads Bank for Enterprises CBE).
Over the period considered, net additions to the total survey population amounted to only a small number of firms. In relative terms, it was mainly the maritime cluster that saw significant changes. In particular, two branches - shipping agents and forwarders and shipping companies - experienced both restructuring and a rise in bankruptcies. In the non-maritime cluster, firms generally come and go more frequently than in the case of maritime firms. That need not be a bad sign, because newcomers may create a more efficient and competitive market situation. Branches with a noticeably high rate of change are other logistic services and construction. On balance, over the period considered those branches did gain additional firms, but they are also the branches with the biggest percentage of failures. 1.7 Breakdown of the variables by company size
Note that the distribution of the firms according to size depends on the format of the annual accounts filed by the firms. Thus, companies submitting their annual accounts to the Central Balance Sheet Office
25 See Coppens F., Verduyn F. (2009), Analysis of business demography using markov chains: an application to Belgian data,
NBB, Working Paper No. 170 (Research series), Brussels. 26 The results of the public sector are not included in this table.

16 NBB WORKING PAPER No. 299 - JUNE 2016
in the full format are considered to be large firms. The SME category covers companies submitting their annual accounts in an abbreviated format. In 2014 there was a 2 % fall in the number of SMEs, thus maintaining the downward trend of recent years. In contrast to last year, the number of large firms was also down slightly (-0.8 %). However, that fall had no impact on the creation of value added, which increased by roughly 0.5 % in large firms and by over 1.8 % in SMEs. Nevertheless, employment declined in both groups, but mainly in large firms where it contracted by -1.8 %.
TABLE 8 BREAKDOWN OF FINDINGS IN THE BELGIAN PORTS IN 2014
Ports Number of firms27 Direct value added Direct employment Direct investment
(in € million)
(FTE) ____
(in € million)
Large firms SMEs Large firms SMEs Large firms SMEs Large firms SMEs
Antwerp ................................. 836 1,001 9,311.5 365.5 53,788 3,524 2,926.7 54.9
Ghent .................................... 279 321 3,354.0 190.0 25,051 2,235 356.1 33.2
Ostend .................................. 58 135 390.6 40.1 3,628 493 85.4 16.8
Zeebrugge ............................ 158 229 716.4 91.5 6,401 1,031 146.2 11.9
Liège ..................................... 91 87 1,097.6 33.3 7,656 509 190.8 4.9
Brussels ................................ 116 238 409.6 64.0 3,176 853 38.3 14.7
Outside the ports ................ 26 360 73.7 61.3 1,571 432 256.2 28.8
TOTAL ................................ 1,564 2,371 15,353.5 845.8 101,271 9,076 3,999.7 165.2
Source: NBB (calculations based on the Belgian accounts filed with the Central Balance Sheet Office and on surveys).
1.8 Social balance sheet in the Belgian ports28
The social balance sheet presents a coherent set of data on various aspects of employment in firms: composition of the workforce, staff rotation, type of employment contracts, level of education, working time, labour costs and training efforts. The results presented below concerning direct employment in the six Belgian ports are not exhaustive. The figures are based on a constant sample29 relating to the period 2012 - 2014. The national data is calculated from a constant sample of filed annual accounts with the Central Balance Sheet Office. The findings per individual port are also based on a constant sample. 1.8.1 Working time and labour costs
For a detailed analysis of the social balance sheet data, see the article by P. Heuse in the June 2016 Economic Review of the National Bank of Belgium. In 2013 the reduction in employment in the constant sample of firms active in the Belgian ports was still relatively modest (-0.2 %). In contrast, in 2014 the decline was considerably bigger (-3.9 %) and exceeded the findings based on the general results in table 5. The number of hours worked fell faster than the number of FTEs in 2014, so that the average number of hours worked per FTE declined further.
27 For each port, this is the number of firms located in the port zone. A firm may in fact be recorded in more than one port. The
sample for the year 2014 comprises 1.457 large firms and 2.364 small and medium-sized firms, totalling 3.821 firms. The results of the public sector are not included in this table.
28 The national data mentioned were taken from Heuse P., 2014 social balance sheet, NBB, Economic Review, June 2016. The comparisons are merely an indication, since only firms filing their social balance sheet for a period of 12 months ending on 31 December were taken into account in that study. Moreover, NACE-BEL 78 branches (employment-related activities), 84 (public administration and defence; compulsory social security) and 85 (education) are excluded in that study.
29 The constant sample was determined on the basis of the firms which filed full-format accounts throughout the period 2012 - 2014, and the financial year must comprise a period of twelve months. The employer's organisations (e.g. Cepa), with NACE-BEL 78200, are included in the constant sample. The constant sample comprises 981 firms and 93,873 FTEs, or 25.6 % of the firms considered for this study in 2014 and 81.8 % of the direct employment calculated in this study.

NBB WORKING PAPER No. 299 - JUNE 2016 17
TABLE 9 HOURS WORKED AND ASSOCIATED COSTS OF INTERNAL HUMAN RESOURCES (reduced population: constant population) (percentage change compared with the previous year, unless otherwise stated)
2012
2013
2014
Change in the average number of employees on the staff register (p.c.) ..................................... -0.2 -3.9
Change in the number of hours actually worked (p.c.) ................................................................... -0.5 -4.2
Change in staff costs (p.c.) ............................................................................................................. +2.0 -1.0
Average number of hours worked per annum per full-time equivalent (hours) .............................. 1,513 1,508 1,504
Average annual staff costs per full-time equivalent (euros) ............................................................ 76,545 78,251 80,621
Average staff costs per hour worked (euros) .................................................................................. 51 52 54
Source: NBB (full presentation accounts only).
1.8.2 Composition of the workforce
The changes recorded for 2014 in table 10 are relatively minor. The proportion of blue collar workers has remained virtually unchanged for a number of years, as has the proportion of employees with higher education qualifications. In contrast to previous years, female employment increased by 1 percentage point in 2014. The article by P. Heuse mentioned above discusses female employment in more detail.
TABLE 10 INTERNAL WORKFORCE AT THE END OF THE FINANCIAL YEAR (reduced population: constant population) (share as a percentage of the total)
2012
2013
2014
By professional category
White-collar ....................................................................................................................... 44 44 44
Blue-collar ......................................................................................................................... 52 52 52
Other staff ......................................................................................................................... 4 4 4
By sex
Males ................................................................................................................................ 84 84 83
Females ............................................................................................................................ 16 16 17
By working time
Full-time ............................................................................................................................ 90.1 90.1 89.1
Part-time ........................................................................................................................... 9.9 9.9 10.9
By educational level
Males
Primary education (p.c.) ................................................................................................. 19.9 19.1 18.6
Secondary education (p.c.)............................................................................................. 54.8 55.3 55.4
Higher non-university education (p.c.)............................................................................ 16.4 16.7 16.9
University education (p.c.) .............................................................................................. 8.9 8.9 9.0
Females
Primary education (p.c.) ................................................................................................. 7.1 7.0 7.1
Secondary education (p.c.)............................................................................................. 45.2 44.6 44.0
Higher non-university education (p.c.)............................................................................ 31.9 32.5 32.7
University education (p.c.) .............................................................................................. 15.7 15.9 16.2
Source: NBB (full presentation accounts only).
1.8.3 External staff
The general tendency to employ more temporary workers is also apparent in firms in the ports. Some years ago this form of work occurred mainly in a number of specific sectors, but has now become more widespread. Demand for more flexible labour to cater for cyclical fluctuations is part of the reason. Since the increase in the number of hours worked exceeded the change in labour costs, there was a reduction in the average hourly cost of external staff.

18 NBB WORKING PAPER No. 299 - JUNE 2016
TABLE 11 HIRED TEMPORARY STAFF AND STAFF PLACED AT THE ENTERPRISE’S DISPOSAL (reduced population: constant population) (percentage change compared with the previous year, unless otherwise stated)
2012
2013
2014
Share of external staff in total employment (on the basis of the number of hours actually worked) (share as a percentage of the total) .................................................................................................... 13.9 14.0 15.8
Change in the number of hours actually worked ................................................................................. - 0.1 + 9.4
Change in costs ................................................................................................................................... + 1.8 + 8.2
Source: NBB (full presentation accounts only).
1.8.4 Staff turnover
In the constant sample, staff turnover was again decidedly negative. It is noteworthy that the number of workers in the ‘unemployment with company allowance’ category more than doubled. It could be that both employers and employees still want to make use of the bridging pension system which will be subject to severe government restrictions from now on.
TABLE 12 STAFF TURNOVER (reduced population: constant population) (share as a percentage of the total, unless otherwise stated)
2012
2013
2014
Net number of staff hired during the year (FTE) ..................................................................... + 1,502 + 314 - 1,479
Staff leaving, by reason for termination of contract
Retirement ......................................................................................................................... 6.9 8.6 7.4
Unemployment with company allowance .......................................................................... 4.3 4.3 9.0
Dismissal ........................................................................................................................... 18.0 18.5 16.5
Other reason30 ................................................................................................................... 70.6 68.6 67.0
Source: NBB (full presentation accounts only).
1.8.5 Training31
Almost two-thirds of the constant sample reported training initiatives in the social balance sheet (63.0 %); however, in 2014 that figure was down slightly against the previous year. The participation rate increased for both men and women, but the number of hours’ training attended was down, so that the firms’ training costs were nevertheless lower than in the previous year.
30 Spontaneous departures, death in service, expiry of the period of fixed-term contracts, provided that they are not immediately
followed by a new contract, and the completion of the work for which the contract was concluded. 31 Here, training is meant in the formal sense, i.e. courses in premises reserved for that purpose, within the firm or outside. For
example, on-the-job training, mentoring and self-training study are outside the scope of this study.

NBB WORKING PAPER No. 299 - JUNE 2016 19
TABLE 13 EFFORTS DEVOTED TO FORMAL TRAINING (reduced population: constant population) (share as a percentage of the total, unless otherwise stated)
2012
2013
2014
P.c. of firms reporting training on the social balance sheet .................................................. 62.6 63.4 62.3
Participation rate .................................................................................................................... 56.8 57.2 58.4
Males ................................................................................................................................ 57.4 58.3 59.2
Females ............................................................................................................................ 54.2 52.2 54.6
Number of hours’ training per person (hours) ........................................................................ 32.5 33.2 29.0
Males (hours) .................................................................................................................... 33.5 34.0 29.7
Females (hours) ................................................................................................................ 27.3 29.1 25.6
Training costs per hour (euros) .............................................................................................. 73.2 70.7 71.9
Males (euros) .................................................................................................................... 72.6 69.6 71.8
Females (euros) ................................................................................................................ 76.8 77.4 72.2
P.c. of the number of hours worked devoted to training ......................................................... 1.3 1.3 1.1
Training costs as a percentage of total staff costs.................................................................. 1.8 1.8 1.5
Source: NBB (full presentation accounts only).
1.9 Financial ratios in the Belgian ports
The ratios presented below show the net return on equity after tax, liquidity in the broad sense (the current ratio), and solvency (see Annex 2 for the definition of the ratios). The first ratio concerns the firms’ ability to generate profits, and to give shareholders an idea of the firm’s return after tax. The second ratio shows the firm’s ability to mobilise in due time the cash resources that it needs in order to meet its short-term liabilities. Finally, the third ratio gives an idea of the firm’s ability to honour all its financial commitments in the short and long term. This section gives information on the movement in the ratios for the six Belgian ports together32. The study of the financial ratios is based on a constant sample33 composed for the years 2012 to 2014. Consequently, the firms studied in the financial section of this report are not the same as those in the constant sample of the previous report, which may explain some discrepancies between the figures in the two publications. To permit comparison with the national data, i.e. all Belgian non-financial firms companies, the same calculation method – namely globalisation – was used. In 2014, firms included in the constant sample saw a further rise in their profitability, which reached a level exceeding the average for all non-financial corporations. However, that favourable trend did not occur in every port and was in fact due to the substantial improvement in Antwerp and Liège. Liquidity and solvency deteriorated slightly and were below the national averages, although they remain at an acceptable level.
32 Note that readers wishing to compare the financial ratios of a firm with those in the sector where it operates can find that
information in the company file published by the Central Balance Sheet Office. 33 The constant sample composed for the study of the ratios includes all firms which filed their annual accounts in 2012, 2013 and
2014 and whose annual accounts items meet the conditions for the calculation of these ratios. For example, for the purpose of calculating profitability, the financial year must comprise 12 months and the equity must be strictly positive. NACE-BEL branch 70100 (head office activities) is excluded as these companies may distort the results because of their often very high shareholders’ equity figures. This constant sample covers 2,426 firms, € 14,829.2 million of value added and 97,376 FTEs, or 63.3 % of the firms considered for the Belgian ports in 2014, 89.7 % of the direct value added and 84.9 % of the direct employment examined here.

20 NBB WORKING PAPER No. 299 - JUNE 2016
TABLE 14 FINANCIAL RATIOS IN THE BELGIAN PORTS FROM 2012 TO 2014 (reduced population: constant population)
Ports
__________________________________
Return on equity after tax (in p.c.)
__________________________
Liquidity in the broad sense __________________________
Solvency (in p.c.)
__________________________
2012 2013 2014 2012 2013 2014 2012 2013 2014
Antwerp ....................................................... 10.1 3.6 7.5 1.19 1.19 0.97 44.1 44.4 42.6
Ghent .......................................................... 4.1 5.1 5.8 1.24 1.34 1.27 39.2 42.5 40.3
Ostend ........................................................ 15.8 8.8 1.7 0.91 1.00 0.95 48.0 51.2 46.0
Zeebrugge ................................................... 4.9 6.7 5.2 1.15 1.06 1.08 51.5 50.8 52.4
Liège ........................................................... -1.5 -2.6 5.1 0.90 0.82 0.70 40.7 42.0 42.6
Brussels ...................................................... 6.3 2.9 3.0 1.41 1.41 1.40 39.6 39.2 38.1
Belgian ports ......................................... 8.1 3.2 6.8 1.16 1.17 1.00 43.4 44.1 42.7
Non-financial corporations34 ............ 6.8 5.3 5.5 1.26 1.25 1.24 43.1 43.1 43.4
Source: NBB (calculations based on the Belgian accounts filed with the Central Balance Sheet Office).
1.10 Financial health in the Belgian ports
The financial health indicator is designed as a weighted combination of variables, created by means of a model constructed in the same way as a failure prediction model. The model takes the form of a logistic regression discriminating between failing and non-failing companies. The definition of failure is based on a legal criterion, namely that a company is considered to have failed if it has faced bankruptcy or judicial administration in the past. The indicator summarises each company’s situation in a single value which takes account simultaneously of the solvency, liquidity and profitability dimensions. Those dimensions are complementary in the establishment of a financial diagnosis, as a high debt level, for example, may be offset by a plentiful cash flow, and vice versa. The indicator also takes account of the companies’ age and size, particularly through interaction variables. The indicator constitutes a strictly financial assessment of the companies at a given moment. That assessment is based on data from the annual accounts, and therefore disregards any other fundamental elements, such as development prospects, competition, management calibre or shareholders’ willingness to provide financial support. In that respect, it must be regarded as one of the factors enabling an overall appraisal of a firm’s situation. Classes 1, 2, 3 and 4 are associated with below-average failure rates, and therefore correspond to a favourable financial situation. However, the rates are not zero, which means that these classes are not totally risk free. Conversely, classes 6, 7, 8, 9 and 10 are associated with above-average failure rates, and therefore correspond to a situation of vulnerability. That is why belonging to one of these classes can be interpreted as a warning sign, which becomes stronger as we move from class 6 to class 10. Finally, class 5 corresponds to an average failure rate and is therefore neutral in terms of interpretation. The financial health classes are used in the enterprise files compiled by the Central Balance Sheet Office35. The sample of firms for which the financial health index was calculated is naturally much smaller than in the national study. Consequently, the results are more volatile. The result for a particular firm can therefore be obtained from the company file36 and compared to the distribution of firms by financial health class in the ports, or in Belgium as a whole. Tables 15 and 16 show that, in 2014, a substantial majority of firms in the Belgian ports (66.5 % of the number of firms and 81.3 % in terms of jobs) were in classes 1 to 4, i.e. with a below-average failure
34 For additional information see Rubbrecht I., Vivet D., Results and financial situation of firms in 2014, NBB, Economic review,
December 2015, Brussels. 35 See Vivet D. (2011), Development of a financial health indicator based on companies’ annual accounts, NBB, Working Paper
No. 213 (Document series), Brussels. 36 The company file compares the financial position of an entreprise with the financial position of the activity sector the enterprise
belongs to. For more information, see introduction.

NBB WORKING PAPER No. 299 - JUNE 2016 21
risk. It is notable that the distribution according to the number of firms has changed very little since 2008. That is not the case for the distribution according to firm size (number of employees): in the crisis year 2009, the overall share of classes 1 to 3 declined significantly, but in the ensuing years the situation was largely restored.
TABLE 15 FINANCIAL HEALTH IN THE BELGIAN PORTS - IN % OF THE NUMBER OF COMPANIES (reduced population)
2009 2010 2011 2012 2013 2014 _____________________ ______________________ _____________________ _____________________ _____________________ _____________________
Class 1 .................................................. 8.3 8.2 7.9 8.4 8.4 8.6
Class 2 .................................................. 18.1 18.4 19.3 18.6 19.1 19.3
Class 3 .................................................. 17.7 18.5 18.7 18.5 19.2 18.4
Class 4 .................................................. 18.7 19.1 20.2 19.2 19.4 20.2
Class 5 .................................................. 17.9 18.1 17.5 18.3 17.6 17.6
Class 6 .................................................. 13.1 11.8 11.4 12.0 10.7 11.1
Class 7 .................................................. 3.6 3.3 2.6 2.8 3.4 2.8
Class 8 .................................................. 1.5 1.9 1.7 1.6 1.5 1.5
Class 9 .................................................. 0.7 0.4 0.5 0.4 0.5 0.4
Class 10 ................................................ 0.4 0.2 0.3 0.2 0.3 0.1 TOTAL ................................................... 100.0 100.0 100.0 100.0 100.0 100.0
Source: NBB (calculations based on the Belgian accounts filed with the Central Balance Sheet Office).
TABLE 16 FINANCIAL HEALTH IN THE BELGIAN PORTS - IN % OF WORKERS ENTERED IN THE STAFF REGISTER37 (reduced population)
2009 2010 2011 2012 2013 2014 _____________________ ______________________ _____________________ _____________________ _____________________ _____________________
Class 1 .................................................. 6.7 10.0 8.7 7.7 8.0 7.8
Class 2 .................................................. 23.5 23.0 18.7 15.2 22.4 20.9
Class 3 .................................................. 29.4 33.3 35.2 39.2 33.0 35.1
Class 4 .................................................. 24.9 20.9 18.6 16.6 16.7 17.5
Class 5 .................................................. 11.0 8.7 15.5 16.9 16.5 15.8
Class 6 .................................................. 3.4 3.3 2.6 3.7 2.6 2.0
Class 7 .................................................. 0.6 0.5 0.4 0.4 0.5 0.5
Class 8 .................................................. 0.3 0.3 0.2 0.3 0.3 0.2
Class 9 .................................................. 0.0 0.0 0.1 0.0 0.1 0.1
Class 10 ................................................ 0.1 0.0 0.0 0.0 0.0 0.0 TOTAL ................................................... 100.0 100.0 100.0 100.0 100.0 100.0
Source: NBB (calculations based on the Belgian accounts filed with the Central Balance Sheet Office).
37 Full-time equivalents (item 9087)

22 NBB WORKING PAPER No. 299 - JUNE 2016
2 PORT OF ANTWERP
2.1 Port developments38
In 2014, traffic handled by the port of Antwerp totalled over 199 million tonnes, setting a new record. Growth since 2013 came to 4.2 %, As the average growth figure for the Hamburg-Le Havre range39 was 2.2 %, the port of Antwerp increased its market share (from 16.7 to 17.1 %). The port’s overall expansion in 2014 is due to the strong rise in traffic in liquid bulk (+5.5 %) and containers (+5.9 %). In liquid bulk, the volume handled was up for both crude oil and petroleum derivatives, which account for most of the liquid bulk. Chemicals recorded slightly lower growth. Dry bulk declined sharply (-6.5 %). That downward trend has been apparent ever since 2009. Roll-on/roll-off traffic and conventional general cargo were also down in 2014. In 2015 the port of Antwerp established another traffic record: 208.4 million tonnes. In the figures for 2015, the emphasis is again on liquid bulk and containers. Liquid bulk was up by 6.1 % against 2014. Within this group, traffic in chemicals recorded very strong growth (+8.3 %), but there was a decline in the case of oil. Petroleum derivatives were up by 4.0 %. Work proceeded on the implementation or launch of investments announced previously, such as at Total (Optara), ExxonMobil (Delayed Coker Unit) and Evonik (enlargement of butadiene and MTBE installations). Container traffic increased by 4.6 % to a total of 113.3 million tonnes (9.65 million TEU, a new record). Other forms of traffic also recorded growth: dry bulk (+2.1 %), ro/ro (+4.1 %) and conventional general cargo (+1.2 %). In the past 10 years there have been substantial shifts in the composition of traffic at the port of Antwerp. In 2005 containers accounted for almost 47 % of the total volume. In 2015 that share increased to over 54 %. In the past 10 years, containerisation has reduced the share of conventional general cargo from 11 % to 5 %. The share of dry bulk has fallen from 17 % to 7 %. Conversely, liquid bulk has increased sharply, from 23 % to 32 % of total traffic in 2015. The number of ocean-going vessels calling the port increased from 14,009 in 2014 to 14,417 in 2015. In recent years the number of vessels had constantly declined as a result of the increases in scale in the container business. The largest container ship to call the port of Antwerp in 2015 was the MSC Zoë, with a capacity of 19,224 TEU. Every year there are many investment projects, both small and large, in the port of Antwerp, aimed at maintenance, modernisation or expansion of the existing infrastructure. The most noticeable investment is the new lock which will offer a second route into the Waasland port on the left bank of the Scheldt. This lock, which was named the “Kieldrecht lock” at the beginning of 2016, will be 500 metres long and 68 metres wide. The lock will be inaugurated in mid-2016. 2.2 Value added
The 1.4 % increase in direct value added recorded in the port of Antwerp was generated by both the maritime and the non-maritime cluster. However, in the case of the maritime cluster that positive development was very largely due to the shipping companies branch. Here too, there is a need to exercise caution in interpreting the decline in the port construction and dredging sector, where a sharp fall was recorded, because shifts between various subsidiaries and to new created subsidiaries which did not file yet their annnual account. In the non-maritime cluster, there were notable developments in key sectors (chemicals, refineries and trade). The energy branch was an exception here, possibly owing to the protracted technical problems at some power stations. The strong rise in indirect value added is largely attributable to the chemical industry and shipping companies.
38 Source: Jean-Pierre Merckx, Flemish Port Commission 39 For the purposes of this study, the range comprises the ports of Hamburg, Bremen, Amsterdam, Rotterdam, the Zeeland
Seaports complex (ports of Flessingue and Terneuzen), Antwerp, Ghent, Zeebrugge, Ostend, Dunkirk and Le Havre.

NBB WORKING PAPER No. 299 - JUNE 2016 23
Direct value added represented 4.3 % of the GDP of the Flemish region and 2.5 % of the Belgian GDP. Total value added accounted for 4.7 % of the Belgian GDP. 2.3 Employment
In contrast to value added, the growth of direct employment in the port of Antwerp was negative. In recent years, most sectors have displayed a predominantly downward trend, or at best stabilisation. Fortunately, that stable situation applies in the sectors which generate the most jobs, such as cargo handlers, chemicals, trade and fuel production. In contrast to the sharp rise in indirect value added, indirect employment barely increased, reflecting the downward trend in direct employment. The virtual stabilisation of indirect employment cannot be attributed to any particular sector but is due to developments in the principal branches. Direct employment represented 2.6 % of the employment in the Flemish region and 1.5 % of Belgian employment. Total employment accounted for 3.6 % of Belgian employment. 2.4 Investment
In 2014, investment in the port of Antwerp expanded by 37 %. As stated above, that figure must always be interpreted with some caution. The strong growth in the maritime cluster was due mainly to the substantial increase in the shipping companies branch. In the non-maritime cluster the rise came to 27.1 %, driven mainly by the significant investments in chemicals and oil refining.
CHART 5 CHANGE IN DIRECT VALUE ADDED CHART 6 CHANGE IN DIRECT EMPLOYMENT (in € million, current prices) (FTE)
Source: NBB (calculations based on the Belgian accounts filed with the Central Balance Sheet Office).
-2.000
-1.500
-1.000
-500
0
500
1.000
1.500
2010 2011 2012 2013 2014
Maritime Trade
Industry Land transport
Other logistics Port of Antwerp
-3.000
-2.250
-1.500
-750
0
750
1.500
2.250
2010 2011 2012 2013 2014
Maritime Trade
Industry Land transport
Other logistics Port of Antwerp

24 NBB WORKING PAPER No. 299 - JUNE 2016
TABLE 17 VALUE ADDED AT THE PORT OF ANTWERP FROM 2009 TO 2014 (in € million - current prices)
Sectors 2009 2010 2011 2012 2013 2014 Share in 2014
Change from 2013
to 2014
Annual average
change from 2009
to 2014 (in p.c.) (in p.c.) (in p.c.)
DIRECT EFFECTS .......................... 8,794.5 10,006.4 9,710.8 10,020.9 9,782.0 9,923.8 100.0 + 1.4 + 2.4 MARITIME CLUSTER ................. 2,933.8 3,314.1 3,031.0 3,343.7 3,280.2 3,325.5 33.5 + 1.4 + 2.5 Shipping agents and
forwarders ................................ 558.8 572.9 602.2 599.0 628.9 598.2 6.0 - 4.9 + 1.4
Cargo handling ......................... 1,223.6 1,288.3 1,374.8 1,485.9 1,566.6 1,602.6 16.1 + 2.3 + 5.5
Shipping companies ................. 588.5 850.3 479.6 547.2 363.2 429.9 4.3 + 18.4 - 6.1
Shipbuilding and repair ............ 58.4 49.7 45.4 37.5 33.0 37.1 0.4 + 12.4 - 8.7
Port construction and dredging 122.8 161.9 131.4 247.1 272.9 236.2 2.4 - 13.5 + 14.0
Fishing and fish industry .......... 2.0 1.7 1.1 1.1 1.2 1.9 0.0 + 52.1 - 0.7
Port trade .................................. 15.9 19.6 21.1 21.3 19.8 14.5 0.1 - 27.0 - 1.9
Port authority ............................ 222.8 229.2 233.9 255.9 243.6 251.8 2.5 + 3.4 + 2.5
Public sector ............................. 140.9 140.6 141.6 148.7 150.9 153.4 1.5 + 1.6 + 1.7
Allocation (p.m. ) ....................... 54.7 84.3 102.9 95.9 91.6 93.4 - + 2.0 + 11.3
NON-MARITIME CLUSTER ........ 5,860.8 6,692.2 6,679.8 6,677.1 6,501.8 6,598.3 66.5 + 1.5 + 2.4
TRADE ......................................... 703.5 781.6 877.5 879.8 839.3 887.5 8.9 + 5.8 + 4.8
INDUSTRY .................................... 4,501.9 5,227.9 5,077.8 5,013.0 4,859.3 4,948.6 49.9 + 1.8 + 1.9
Energy ...................................... 462.9 453.8 530.1 418.9 415.0 309.2 3.1 - 25.5 - 7.8
Fuel production ........................ 748.4 984.1 898.5 970.8 806.2 824.9 8.3 + 2.3 + 2.0
Chemicals ................................. 2,543.3 2,658.7 3,009.6 2,946.1 2,944.2 3,112.0 31.4 + 5.7 + 4.1
Car manufacturing .................... 259.3 607.2 86.1 107.0 94.0 93.4 0.9 - 0.6 - 18.5
Electronics ................................ 10.1 9.5 8.6 10.6 8.3 10.1 0.1 + 22.0 - 0.1
Metalworking industry .............. 205.3 212.6 225.0 248.5 242.6 243.3 2.5 + 0.3 + 3.5
Construction ............................. 102.3 115.8 129.3 136.2 153.2 159.5 1.6 + 4.2 + 9.3
Food industry ........................... 49.0 59.3 63.6 46.4 61.8 57.4 0.6 - 7.1 + 3.2
Other industries ........................ 121.3 126.9 127.0 128.5 134.0 138.9 1.4 + 3.6 + 2.7
LAND TRANSPORT .................... 257.5 258.0 275.8 305.3 306.6 290.1 2.9 - 5.4 + 2.4
Road transport ......................... 131.7 130.7 140.5 150.0 139.7 135.1 1.4 - 3.3 + 0.5
Other land transport .................. 125.8 127.3 135.2 155.3 166.9 155.0 1.6 - 7.1 + 4.3
OTHER LOGISTIC SERVICES ... 397.9 424.7 448.6 479.0 496.6 472.1 4.8 - 4.9 + 3.5
INDIRECT EFFECTS ...................... 8,222.6 10,223.1 9,241.1 9,696.6 8,798.2 9,035.7 - + 2.7 + 1.9
MARITIME CLUSTER ................. 3,155.0 4,125.6 2,974.4 3,331.8 2,886.8 2,996.0 - + 3.8 - 1.0 NON-MARITIME CLUSTER ......... 5,067.6 6,097.5 6,266.7 6,364.8 5,911.5 6,039.7 - + 2.2 + 3.6
TOTAL VALUE ADDED .................. 17,017.1 20,229.5 18,951.8 19,717.4 18,580.2 18,959.5 - + 2.0 + 2.2 Source: NBB (calculations based on the Belgian accounts filed with the Central Balance Sheet Office, and the Belgian IOTs). The data necessary to estimate the indirect effects are published by the NAI with a low frequency and after a certain time lag. The indirect effects for the period 2009-2014 are based on IOT 2010 and SUT 2010, 2011 and 2012. The calculated indirect effects are approximations and should be interpreted with caution.
TABLE 18 VALUE ADDED TOP 10 AT THE PORT OF ANTWERP IN 2014
Ranking Company name Sector _________________________ __________________________________________________________________________________ __________________________________________________________
1 B.A.S.F. ANTWERPEN Chemicals 2 KUWAIT PETROLEUM (BELGIUM) Trade 3 EXXONMOBIL PETROLEUM & CHEMICAL Fuel production 4 TOTAL RAFFINADERIJ ANTWERPEN Fuel production 5 ANTWERP PORT AUTHORITY Port authority 6 ELECTRABEL Energy 7 MSC PSA EUROPEAN TERMINAL Cargo handling 8 BAYER ANTWERPEN Chemicals 9 DREDGING INTERNATIONAL Port construction and dredging 10 EVONIK DEGUSSA ANTWERPEN Chemicals
Source: NBB. The estimates for the multi-regional firms are based on surveys, annual reports and allocation formulas based on regional statistics. The top ten tables are based on information from annual accounts, surveys, annual reports and allocation formulas based on regional statistics. No individual figures are published as accurate data could not be obtained for all companies.

NBB WORKING PAPER No. 299 - JUNE 2016 25
TABLE 19 EMPLOYMENT AT THE PORT OF ANTWERP FROM 2009 TO 2014 (FTE)
Sectors 2009 2010 2011 2012 2013 2014 Share in 2014
Change from 2013
to 2014
Annual average
change from 2009
to 2014 (in p.c.) (in p.c.) (in p.c.)
DIRECT EFFECTS .......................... 63,180 61,341 60,120 61,181 61,325 60,586 100.0 - 1.2 - 0.8 MARITIME CLUSTER .................. 28,999 28,204 28,138 28,242 28,096 27,574 45.5 - 1.9 - 1.0 Shipping agents and
forwarders ................................. 6,885 6,697 6,876 7,017 6,823 6,740 11.1 - 1.2 - 0.4
Cargo handling ......................... 15,449 14,881 14,760 14,608 14,701 14,683 24.2 - 0.1 - 1.0
Shipping companies ................. 1,040 1,081 1,108 908 888 890 1.5 + 0.2 - 3.1
Shipbuilding and repair ............. 880 761 631 546 438 401 0.7 - 8.6 - 14.6
Port construction and dredging 935 1,030 1,094 1,475 1,513 1,260 2.1 - 16.7 + 6.1
Fishing and fish industry ........... 25 22 18 16 16 19 0.0 + 14.8 - 6.0
Port trade .................................. 191 197 152 153 148 138 0.2 - 7.0 - 6.3
Port authority ............................ 1,699 1,711 1,692 1,697 1,703 1,607 2.7 - 5.6 - 1.1
Public sector ............................. 1,894 1,824 1,808 1,822 1,866 1,838 3.0 - 1.5 - 0.6
Allocation (p.m. ) ........................ 1,855 1,649 1,623 1,527 1,502 1,437 - - 4.4 - 5.0
NON-MARITIME CLUSTER ........ 34,181 33,137 31,982 32,939 33,229 33,012 54.5 - 0.7 - 0.7
TRADE .......................................... 2,292 2,323 2,352 2,350 2,282 2,298 3.8 + 0.7 + 0.1
INDUSTRY .................................... 24,364 23,456 21,754 22,224 22,544 22,426 37.0 - 0.5 - 1.6
Energy ....................................... 1,101 1,075 1,042 1,030 993 995 1.6 + 0.2 - 2.0
Fuel production ......................... 2,585 2,652 2,687 2,678 2,607 2,626 4.3 + 0.7 + 0.3
Chemicals ................................. 10,651 10,671 10,792 10,889 10,982 10,931 18.0 - 0.5 + 0.5
Car manufacturing .................... 3,773 3,022 1,000 1,075 1,013 1,012 1.7 - 0.1 - 23.1
Electronics ................................ 149 158 157 133 127 133 0.2 + 4.3 - 2.3
Metalworking industry ............... 3,400 3,252 3,362 3,591 3,596 3,466 5.7 - 3.6 + 0.4
Construction .............................. 1,124 1,170 1,205 1,328 1,688 1,706 2.8 + 1.0 + 8.7
Food industry ............................ 478 381 392 404 391 394 0.7 + 0.8 - 3.8
Other industries ........................ 1,103 1,076 1,118 1,096 1,146 1,163 1.9 + 1.5 + 1.1
LAND TRANSPORT ..................... 4,169 4,048 4,200 4,523 4,495 4,489 7.4 - 0.1 + 1.5
Road transport .......................... 2,119 1,945 2,026 2,088 1,989 2,050 3.4 + 3.1 - 0.7
Other land transport ................... 2,050 2,103 2,174 2,435 2,506 2,439 4.0 - 2.7 + 3.5
OTHER LOGISTIC SERVICES .... 3,356 3,310 3,676 3,842 3,908 3,798 6.3 - 2.8 + 2.5
INDIRECT EFFECTS ....................... 85,587 83,171 85,755 84,464 82,615 82,068 - - 0.7 - 0.8
MARITIME CLUSTER .................. 33,957 33,428 32,908 32,155 31,570 31,122 - - 1.4 - 1.7 NON-MARITIME CLUSTER ......... 51,630 49,744 52,847 52,308 51,046 50,946 - - 0.2 - 0.3
TOTAL EMPLOYMENT ................... 148,767 144,513 145,875 145,644 143,941 142,654 - - 0.9 - 0.8 Source: NBB (calculations based on the Belgian accounts filed with the Central Balance Sheet Office, and the Belgian IOTs). The data necessary to estimate the indirect effects are published by the NAI with a low frequency and after a certain time lag. The indirect effects for the period 2009-2014 are based on IOT 2010 and SUT 2010, 2011 and 2012. The calculated indirect effects are approximations and should be interpreted with caution.
TABLE 20 EMPLOYMENT TOP 10 AT THE PORT OF ANTWERP IN 2014
Ranking Company name Sector _________________________ __________________________________________________________________________________ __________________________________________________________
1 B.A.S.F. ANTWERPEN Chemicals 2 BNRC GROUP Other land transport 3 PUBLIC SECTOR Public sector 4 ANTWERP PORT AUTHORITY Port authority 5 EXXONMOBIL PETROLEUM & CHEMICAL Fuel production 6 MSC PSA EUROPEAN TERMINAL Cargo handling 7 TOTAL RAFFINADERIJ ANTWERPEN Fuel production 8 PSA ANTWERP Cargo handling 9 EVONIK DEGUSSA ANTWERPEN Chemicals 10 NEW HOLLAND TRACTOR LIMITED Car manufacturing
Source: NBB. The estimates for the multi-regional firms are based on surveys, annual reports and allocation formulas based on regional statistics. The top ten tables are based on information from annual accounts, surveys, annual reports and allocation formulas based on regional statistics. No individual figures are published as accurate data could not be obtained for all companies.

26 NBB WORKING PAPER No. 299 - JUNE 2016
TABLE 21 INVESTMENT AT THE PORT OF ANTWERP FROM 2009 TO 2014 (in € million - current prices)
Sectors 2009 2010 2011 2012 2013 2014 Share in 2014
Change from 2013
to 2014
Annual average
change from 2009
to 2014 (in p.c.) (in p.c.) (in p.c.)
MARITIME CLUSTER ................. 2,065.5 1,628.5 1,493.9 1,375.0 1,220.3 1,785.1 55.3 + 46.3 - 2.9 Shipping agents and
forwarders ................................ 34.2 50.5 61.4 48.3 29.7 31.4 1.0 + 5.9 - 1.7
Cargo handling ......................... 688.5 594.7 675.4 606.6 488.6 540.0 16.7 + 10.5 - 4.7
Shipping companies ................. 1,045.7 630.0 325.3 382.1 425.7 1,000.8 31.0 + 135.1 - 0.9
Shipbuilding and repair ............ 14.6 12.5 6.6 4.7 5.9 2.1 0.1 - 64.1 - 32.1
Port construction and dredging 194.8 268.4 342.7 93.2 14.8 27.4 0.8 + 84.6 - 32.5
Fishing and fish industry .......... 0.3 1.1 0.2 0.2 0.2 0.2 0.0 + 19.7 - 9.9
Port trade .................................. 1.3 1.8 0.9 0.6 0.5 2.5 0.1 + 354.0 + 14.1
Port authority ............................ 44.7 33.9 45.0 194.8 196.3 154.2 4.8 - 21.5 + 28.1
Public sector ............................. 41.4 35.7 36.6 44.5 58.5 26.5 0.8 - 54.7 - 8.5
Allocation (p.m. ) ....................... 208.0 393.4 245.0 164.3 162.8 220.9 - + 35.7 + 1.2
NON-MARITIME CLUSTER ........ 1,014.6 893.3 908.7 946.4 1,136.3 1,443.9 44.7 + 27.1 + 7.3
TRADE ......................................... 38.9 48.5 55.2 54.3 54.8 52.5 1.6 - 4.3 + 6.2
INDUSTRY .................................... 805.0 744.3 748.7 768.7 965.3 1,279.0 39.6 + 32.5 + 9.7
Energy ...................................... 158.0 93.6 74.6 76.0 71.8 71.6 2.2 - 0.3 - 14.6
Fuel production ........................ 185.0 161.8 90.3 127.3 239.0 417.8 12.9 + 74.8 + 17.7
Chemicals ................................. 359.4 374.0 471.8 489.9 576.9 737.0 22.8 + 27.8 + 15.4
Car manufacturing .................... 9.7 5.7 8.7 7.9 8.5 2.2 0.1 - 74.2 - 25.7
Electronics ................................ 0.2 3.7 2.0 0.9 1.0 0.0 0.0 - 98.8 - 44.1
Metalworking industry .............. 11.6 12.8 10.7 13.6 15.3 11.3 0.3 - 26.2 - 0.6
Construction ............................. 11.0 8.0 11.7 11.5 11.2 8.7 0.3 - 22.3 - 4.6
Food industry ........................... 34.6 20.1 17.4 15.1 15.6 12.7 0.4 - 18.3 - 18.1
Other industries ........................ 35.5 64.6 61.5 26.5 26.1 17.7 0.5 - 32.1 - 13.0
LAND TRANSPORT .................... 45.1 39.6 29.9 43.6 38.5 44.9 1.4 + 16.7 - 0.1
Road transport ......................... 24.8 24.2 19.9 28.9 22.8 32.8 1.0 + 43.9 + 5.7
Other land transport .................. 20.3 15.4 10.0 14.6 15.7 12.2 0.4 - 22.7 - 9.8
OTHER LOGISTIC SERVICES ... 125.6 61.0 74.8 79.9 77.7 67.5 2.1 - 13.1 - 11.7
DIRECT INVESTMENT ................... 3,080.0 2,521.8 2,402.6 2,321.4 2,356.5 3,229.0 100.0 + 37.0 + 0.9
Source: NBB (calculations based on the Belgian accounts filed with the Central Balance Sheet Office and on surveys).
TABLE 22 INVESTMENT TOP 10 AT THE PORT OF ANTWERP IN 2014
Ranking Company name Sector _________________________ __________________________________________________________________________________ __________________________________________________________
1 EURONAV TANKERS Shipping companies 2 EURONAV SHIPPING Shipping companies 3 TOTAL RAFFINADERIJ ANTWERPEN Fuel production 4 B.A.S.F. ANTWERPEN Chemicals 5 TOTAL OLEFINS ANTWERP Chemicals 6 EXMAR SHIPPING Shipping companies 7 EXXONMOBIL PETROLEUM & CHEMICAL Fuel production 8 DEURGANCKDOKSLUIS Port authority 9 BAYER ANTWERPEN Chemicals 10 EVONIK OXENO ANTWERPEN Chemicals
Source: NBB. The estimates for the multi-regional firms are based on surveys, annual reports and allocation formulas based on regional statistics. The top ten tables are based on information from annual accounts, surveys, annual reports and allocation formulas based on regional statistics. No individual figures are published as accurate data could not be obtained for all companies.

NBB WORKING PAPER No. 299 - JUNE 2016 27
3 PORT OF GHENT
3.1 Port developments40
In 2014, total maritime traffic in the port of Ghent matched its 2013 level at 25.9 million tonnes. With 16.7 million tonnes of dry bulk, the port of Ghent is the leading dry bulk port in Flanders. This mainly concerns deliveries of iron ore, coal, cereals, construction materials and crude minerals. In 2014 the cargo traffic of dry bulk was slightly higher than in 2013 (+2.3 %). Cargo traffic of liquid bulk and containers declined, and the volume of conventional general cargo remained stable. Roll-on/roll-off traffic was up by 9.0 %. This comprises cars being shipped between Ghent and Göteborg. In 2015 total traffic in the port of Ghent came to 26.4 million tonnes (+1.8 % against 2014). Dry bulk, which accounts for almost 64 % of that total, was stable at 16.7 million tonnes. Liquid bulk and conventional general cargo increased (+9.1 and +12.3 %). Container traffic declined again, but the volume concerned is very small. Roll-on/roll-off was down in 2015 (-3.3 %), following a steep rise in 2014. In 2015, 2,847 ocean-going vessels called the port of Ghent, slightly fewer than in 2014. The average vessel size was 10,792 BT. The principal infrastructure project for the port of Ghent is still the new lock in Terneuzen (Netherlands), which will enable the port of Ghent to receive larger vessels. In February 2015, Flanders and the Netherlands signed the contract for installation of the new lock, agreeing the political, legal and financial arrangements. The contract was approved by both parliaments and took effect on 1 March 2016. In the second quarter of 2016 the market will be approached with a view to appointing the firms to carry out the work. The work is to start in the third quarter of 2017, and completion of the project is scheduled for 2021. 3.2 Value added
The 4.9 % increase in direct value added in the port of Ghent was the strongest rise among Belgian ports in the range in 2014. In the past 6 years this port has also achieved a steady increase in value added, primarily in the non-maritime cluster, although the maritime cluster is also holding up well, despite the fact that 2014 was not exactly the best year for cargo handlers who form an important maritime branch (-3.3 %). In the non-maritime cluster the major branches (metalworking, chemicals, food and other industries) recorded good growth figures in 2014, with the exception of car manufacturing. The marked rise in indirect value added, up by 6.8 %, is due largely to developments in the metalworking industry, chemicals and food industry. The indirect value added generated by car manufacturing was down slightly. Direct value added represented 1.5 % of the GDP of the Flemish region and 0.9 % of the Belgian GDP. Total value added accounted for 1.9 % of the Belgian GDP.
3.3 Employment
Overall, direct employment remained stable in the port of Ghent. However, that figure masks wide variations. In the maritime cluster there was a notable 2 % fall in the case of cargo handlers, while in the non-maritime cluster significant increases were recorded in major industrial branches such as metalworking, other industries and other logistic services. Indirect employment in the port of Ghent stabilized (+0,4 %). Indirect employment has been expanding since 2009 at this port. The metalworking industry and car manufacturing are the main branches generating jobs in the supplier sectors.
40 Source: Jean-Pierre Merckx, Flemish Port Commission.

28 NBB WORKING PAPER No. 299 - JUNE 2016
Direct employment represented 1.2 % of the employment in the Flemish region and 0.7 % of Belgian employment. Total employment accounted for 1.6 % of Belgian employment. 3.4 Investment
Owing to the completion of a number of major expansion projects here, investment in the port of Ghent was down sharply in the maritime cluster. This is particularly noticeable in the case of the cargo handlers. However, the port authority is continuing with investment projects. In the non-maritime sectors, investment in the main branches is still rising strongly, certainly in car manufacturing. The other industries branch is an exception to that trend in 2014.
CHART 7 CHANGE IN DIRECT VALUE ADDED CHART 8 CHANGE IN DIRECT EMPLOYMENT (in € million, current prices) (FTE)
Source: NBB (calculations based on the Belgian accounts filed with the Central Balance Sheet Office).
-450
-300
-150
0
150
300
450
2010 2011 2012 2013 2014
Maritime Trade
Industry Land transport
Other logistics Port of Ghent
-1.200
-800
-400
0
400
800
1.200
2010 2011 2012 2013 2014
Maritime Trade
Industry Land transport
Other logistics Port of Ghent

NBB WORKING PAPER No. 299 - JUNE 2016 29
TABLE 23 VALUE ADDED AT THE PORT OF GHENT FROM 2009 TO 2014 (in € million - current prices)
Sectors 2009 2010
2011 2012 2013 2014 Share in 2014
Change from 2013
to 2014
Annual average
change from 2009
to 2014 (in p.c.) (in p.c.) (in p.c.)
DIRECT EFFECTS .......................... 3,091.2 3,371.5 3,361.9 3,203.7 3,407.1 3,575.4 100.0 + 4.9 + 3.0 MARITIME CLUSTER .................. 318.7 335.7 342.8 346.4 335.8 337.1 9.4 + 0.4 + 1.1 Shipping agents and
forwarders ................................. 33.3 36.3 31.4 32.3 34.0 35.6 1.0 + 4.9 + 1.3
Cargo handling ......................... 226.4 240.9 255.3 253.4 244.5 236.4 6.6 - 3.3 + 0.9
Shipping companies ................. 10.6 9.1 7.8 9.9 7.9 13.3 0.4 + 67.7 + 4.6
Shipbuilding and repair ............. 4.1 4.3 4.0 5.8 4.8 5.4 0.1 + 10.7 + 5.6
Port construction and dredging 0.0 0.0 0.0 0.0 0.0 0.0 0.0 n. n.
Fishing and fish industry ........... 0.0 0.0 0.0 0.0 0.0 0.0 0.0 n. n.
Port trade .................................. 0.1 0.1 0.1 0.2 0.2 0.2 0.0 + 15.6 + 8.1
Port authority ............................ 23.6 25.5 24.7 23.6 23.4 24.8 0.7 + 5.9 + 1.0
Public sector ............................. 20.5 19.4 19.4 21.3 20.9 21.5 0.6 + 2.7 + 0.9
Allocation (p.m. ) ........................ 6.9 6.2 5.3 8.7 6.9 9.8 - + 42.5 + 7.4
NON-MARITIME CLUSTER ........ 2,772.5 3,035.8 3,019.1 2,857.3 3,071.3 3,238.3 90.6 + 5.4 + 3.2
TRADE .......................................... 737.9 749.8 811.7 780.9 772.2 802.7 22.5 + 4.0 + 1.7
INDUSTRY .................................... 1,877.8 2,131.5 2,031.8 1,872.9 2,083.6 2,218.2 62.0 + 6.5 + 3.4
Energy ....................................... 59.7 68.3 75.0 66.6 53.9 23.0 0.6 - 57.2 - 17.3
Fuel production ......................... 24.5 43.3 30.5 50.5 54.7 41.4 1.2 - 24.3 + 11.1
Chemicals ................................. 278.2 368.2 401.6 321.8 326.0 388.4 10.9 + 19.1 + 6.9
Car manufacturing .................... 573.0 678.9 653.7 649.6 734.9 713.6 20.0 - 2.9 + 4.5
Electronics ................................ 27.3 31.6 31.2 27.4 28.5 34.1 1.0 + 19.6 + 4.5
Metalworking industry ............... 609.9 636.3 499.8 402.4 525.0 629.0 17.6 + 19.8 + 0.6
Construction .............................. 89.6 101.9 98.2 109.3 106.5 106.9 3.0 + 0.4 + 3.6
Food industry ............................ 63.9 88.5 82.6 74.3 91.9 104.4 2.9 + 13.5 + 10.3
Other industries ........................ 151.7 114.5 159.1 171.0 162.1 177.4 5.0 + 9.4 + 3.2
LAND TRANSPORT ..................... 80.6 77.4 81.0 75.7 75.4 76.9 2.1 + 2.0 - 0.9
Road transport .......................... 62.3 59.6 66.6 63.0 63.8 66.8 1.9 + 4.7 + 1.4
Other land transport ................... 18.3 17.9 14.4 12.7 11.6 10.1 0.3 - 12.8 - 11.2
OTHER LOGISTIC SERVICES .... 76.3 77.2 94.6 127.8 140.2 140.5 3.9 + 0.2 + 13.0
INDIRECT EFFECTS ....................... 3,266.6 3,656.9 3,554.0 3,355.8 3,649.5 3,898.2 - + 6.8 + 3.6
MARITIME CLUSTER .................. 238.3 246.7 258.1 257.2 250.8 248.7 - - 0.8 + 0.9 NON-MARITIME CLUSTER ......... 3,028.2 3,410.1 3,295.9 3,098.6 3,398.7 3,649.5 - + 7.4 + 3.8
TOTAL VALUE ADDED .................. 6,357.8 7,028.4 6,915.8 6,559.4 7,056.6 7,473.6 - + 5.9 + 3.3 Source: NBB (calculations based on the Belgian accounts filed with the Central Balance Sheet Office, and the Belgian IOTs). The data necessary to estimate the indirect effects are published by the NAI with a low frequency and after a certain time lag. The indirect effects for the period 2009-2014 are based on IOT 2010 and SUT 2010, 2011 and 2012. The calculated indirect effects are approximations and should be interpreted with caution.
TABLE 24 VALUE ADDED TOP 10 AT THE PORT OF GHENT IN 2014
Ranking Company name Sector _________________________ __________________________________________________________________________________ __________________________________________________________
1 ARCELORMITTAL BELGIUM Metalworking industry 2 TOTAL BELGIUM Trade 3 VOLVO CAR BELGIUM NV Car manufacturing 4 VOLVO GROUP BELGIUM Car manufacturing 5 BELGIAN SHELL Trade 6 STORA ENSO LANGERBRUGGE Other industries 7 TAMINCO Chemicals 8 DSV SOLUTIONS Cargo handling 9 CRI CATALYST COMPANY BELGIUM Chemicals 10 OLEON Chemicals
Source: NBB. The estimates for the multi-regional firms are based on surveys, annual reports and allocation formulas based on regional statistics. The top ten tables are based on information from annual accounts, surveys, annual reports and allocation formulas based on regional statistics. No individual figures are published as accurate data could not be obtained for all companies.

30 NBB WORKING PAPER No. 299 - JUNE 2016
TABLE 25 EMPLOYMENT AT THE PORT OF GHENT FROM 2009 TO 2014 (FTE)
Sectors 2009 2010
2011 2012 2013 2014 Share in 2014
Change from 2013
to 2014
Annual average
change from 2009
to 2014 (in p.c.) (in p.c.) (in p.c.)
DIRECT EFFECTS .......................... 26,642 25,813 26,550 27,148 27,445 27,602 100.0 + 0.6 + 0.7 MARITIME CLUSTER ................. 3,033 2,963 3,042 3,113 3,096 3,050 11.1 - 1.5 + 0.1 Shipping agents and
forwarders ................................ 344 349 346 359 373 389 1.4 + 4.2 + 2.5
Cargo handling ......................... 2,162 2,094 2,202 2,221 2,213 2,169 7.9 - 2.0 + 0.1
Shipping companies ................. 46 49 33 42 34 40 0.1 + 15.7 - 2.8
Shipbuilding and repair ............ 69 66 57 90 75 67 0.2 - 11.3 - 0.8
Port construction and dredging 0 0 0 0 0 0 0.0 n. n.
Fishing and fish industry .......... 0 0 0 0 0 0 0.0 n. n.
Port trade .................................. 1 1 1 1 1 1 0.0 + 0.0 + 0.0
Port authority ............................ 155 160 156 156 156 148 0.5 - 5.1 - 0.9
Public sector ............................. 255 246 247 243 244 237 0.9 - 2.8 - 1.5
Allocation (p.m. ) ....................... 88 82 68 108 83 78 - - 6.0 - 2.3
NON-MARITIME CLUSTER ........ 23,609 22,849 23,508 24,035 24,348 24,552 88.9 + 0.8 + 0.8
TRADE ......................................... 2,171 2,196 2,214 2,246 2,107 2,055 7.4 - 2.5 - 1.1
INDUSTRY .................................... 19,423 18,748 19,213 19,789 20,190 20,390 73.9 + 1.0 + 1.0
Energy ...................................... 175 167 160 166 170 130 0.5 - 23.2 - 5.7
Fuel production ........................ 31 33 35 36 39 42 0.2 + 7.8 + 6.3
Chemicals ................................. 2,073 2,091 2,132 2,132 2,110 2,104 7.6 - 0.3 + 0.3
Car manufacturing .................... 8,150 7,786 8,324 8,762 9,026 9,088 32.9 + 0.7 + 2.2
Electronics ................................ 242 240 240 245 235 253 0.9 + 7.9 + 0.9
Metalworking industry .............. 5,894 5,601 5,581 5,613 5,767 5,924 21.5 + 2.7 + 0.1
Construction ............................. 1,294 1,311 1,234 1,290 1,283 1,206 4.4 - 6.0 - 1.4
Food industry ........................... 608 605 587 590 601 632 2.3 + 5.1 + 0.8
Other industries ........................ 957 913 922 955 961 1,011 3.7 + 5.2 + 1.1
LAND TRANSPORT .................... 1,099 1,039 1,000 917 932 952 3.4 + 2.1 - 2.8
Road transport ......................... 802 744 767 717 758 792 2.9 + 4.5 - 0.2
Other land transport .................. 298 295 232 200 174 160 0.6 - 8.2 - 11.7
OTHER LOGISTIC SERVICES ... 916 867 1,081 1,084 1,118 1,155 4.2 + 3.2 + 4.7
INDIRECT EFFECTS ...................... 33,398 32,942 33,631 34,233 34,302 34,443 - + 0.4 + 0.6
MARITIME CLUSTER ................. 3,278 3,118 3,177 3,280 3,256 3,207 - - 1.5 - 0.4 NON-MARITIME CLUSTER ......... 30,120 29,824 30,455 30,954 31,046 31,236 - + 0.6 + 0.7
TOTAL EMPLOYMENT .................. 60,040 58,754 60,182 61,381 61,747 62,044 - + 0.5 + 0.7
Source: NBB (calculations based on the Belgian accounts filed with the Central Balance Sheet Office, and the Belgian IOTs). The data necessary to estimate the indirect effects are published by the NAI with a low frequency and after a certain time lag. The indirect effects for the period 2009-2014 are based on IOT 2010 and SUT 2010, 2011 and 2012. The calculated indirect effects are approximations and should be interpreted with caution.
TABLE 26 EMPLOYMENT TOP 10 AT THE PORT OF GHENT IN 2014
Ranking Company name Sector _________________________ __________________________________________________________________________________ __________________________________________________________
1 ARCELORMITTAL BELGIUM Metalworking industry 2 VOLVO CAR BELGIUM Car manufacturing 3 VOLVO GROUP BELGIUM Car manufacturing 4 DSV SOLUTIONS Cargo handling 5 DENYS Construction 6 HONDA MOTOR EUROPE LOGISTICS Trade 7 STORA ENSO LANGERBRUGGE Other industries 8 TAMINCO Chemicals 9 PLASTAL Car manufacturing 10 TOWER AUTOMOTIVE BELGIUM Car manufacturing
Source: NBB. The estimates for the multi-regional firms are based on surveys, annual reports and allocation formulas based on regional statistics. The top ten tables are based on information from annual accounts, surveys, annual reports and allocation formulas based on regional statistics. No individual figures are published as accurate data could not be obtained for all companies.

NBB WORKING PAPER No. 299 - JUNE 2016 31
TABLE 27 INVESTMENT AT THE PORT OF GHENT FROM 2009 TO 2014 (in € million - current prices)
Sectors 2009 2010 2011 2012 2013 2014 Share in 2014
Change from 2013
to 2014
Annual average
change from 2009
to 2014 (in p.c.) (in p.c.) (in p.c.)
MARITIME CLUSTER .................. 147.1 93.7 67.9 77.3 87.4 54.6 13.5 - 37.5 - 18.0 Shipping agents and
forwarders ................................. 2.6 9.5 4.7 2.4 2.0 2.0 0.5 + 0.2 - 5.2
Cargo handling ......................... 99.0 48.9 39.2 57.9 62.5 35.0 8.7 - 44.0 - 18.8
Shipping companies ................. 14.7 5.3 3.7 1.9 5.2 7.6 1.9 + 45.6 - 12.3
Shipbuilding and repair ............. 1.6 3.5 0.8 0.6 0.4 0.5 0.1 + 27.7 - 22.3
Port construction and dredging 0.0 0.0 0.0 0.0 0.0 0.0 0.0 n. n.
Fishing and fish industry ........... 0.0 0.0 0.0 0.0 0.0 0.0 0.0 n. n.
Port trade .................................. 0.0 0.0 0.0 0.0 0.0 0.1 0.0 n. n.
Port authority ............................ 21.6 15.2 9.9 6.7 6.4 6.6 1.6 + 3.3 - 21.1
Public sector ............................. 7.7 11.2 9.6 7.8 11.0 3.0 0.7 - 73.2 - 17.5
Allocation (p.m. ) ........................ 11.4 10.4 9.8 6.5 8.2 11.4 - + 38.0 + 0.0
NON-MARITIME CLUSTER ........ 454.2 408.0 377.9 382.9 334.2 349.1 86.5 + 4.4 - 5.1
TRADE .......................................... 26.5 27.2 24.7 31.2 36.1 43.5 10.8 + 20.6 + 10.4
INDUSTRY .................................... 394.7 349.1 307.6 303.0 243.1 248.0 61.4 + 2.0 - 8.9
Energy ....................................... 136.6 110.5 35.4 35.6 27.2 5.9 1.5 - 78.4 - 46.7
Fuel production ......................... 10.8 1.3 2.8 3.0 3.0 2.2 0.5 - 26.6 - 27.5
Chemicals ................................. 39.6 45.3 69.0 69.1 56.0 68.8 17.0 + 22.9 + 11.7
Car manufacturing .................... 54.7 53.9 87.5 71.3 34.1 50.6 12.5 + 48.4 - 1.5
Electronics ................................ 1.3 1.8 1.2 1.1 0.9 1.8 0.4 + 94.5 + 6.4
Metalworking industry ............... 54.9 54.3 53.1 67.9 67.8 74.4 18.4 + 9.7 + 6.2
Construction .............................. 13.5 15.2 28.3 18.6 12.4 10.1 2.5 - 18.7 - 5.7
Food industry ............................ 21.1 12.1 15.2 16.2 17.3 15.1 3.7 - 12.8 - 6.5
Other industries ........................ 62.0 54.7 15.2 20.1 24.5 19.2 4.7 - 21.6 - 20.9
LAND TRANSPORT ..................... 15.9 14.3 23.4 33.4 34.8 31.1 7.7 - 10.4 + 14.4
Road transport .......................... 14.7 8.5 12.0 9.5 17.5 14.6 3.6 - 16.3 - 0.1
Other land transport ................... 1.2 5.7 11.4 23.9 17.3 16.5 4.1 - 4.4 + 70.4
OTHER LOGISTIC SERVICES .... 17.2 17.4 22.2 15.3 20.3 26.4 6.6 + 30.3 + 9.0
DIRECT INVESTMENT .................... 601.3 501.7 445.8 460.2 421.6 403.6 100.0 - 4.3 - 7.7
Source: NBB (calculations based on the Belgian accounts filed with the Central Balance Sheet Office and on surveys).
TABLE 28 INVESTMENT TOP 10 AT THE PORT OF GHENT IN 2014
Ranking Company name Sector _________________________ __________________________________________________________________________________ __________________________________________________________
1 ARCELORMITTAL BELGIUM Metalworking industry 2 VOLVO CAR BELGIUM Car manufacturing 3 TAMINCO Chemicals 4 VOLVO GROUP BELGIUM Car manufacturing 5 HONDA MOTOR EUROPE LOGISTICS Trade 6 BNRC GROUP Other land transport 7 RÜTGERS BELGIUM Chemicals 8 STORA ENSO LANGERBRUGGE Other industries 9 TOTAL BELGIUM Trade 10 OILTANKING GHENT Cargo handling
Source: NBB. The estimates for the multi-regional firms are based on surveys, annual reports and allocation formulas based on regional statistics. The top ten tables are based on information from annual accounts, surveys, annual reports and allocation formulas based on regional statistics. No individual figures are published as accurate data could not be obtained for all companies.

32 NBB WORKING PAPER No. 299 - JUNE 2016
4 PORT OF OSTEND
4.1 Port developments41
In 2014, for the first time in many years the port of Ostend recorded no further roll-on/roll-off traffic. This traffic has been entirely absent since April 2013, following the failure of Transeuropa Ferries, which operated the roll-on/roll-off service between Ostend and Ramsgate. The total loss of roll-on/roll-off traffic is the main reason for the 21.3 % decline in total traffic, down to 1.4 million tonnes. The principal remaining traffic comprises deliveries of sand and gravel, which at 1.2 million tonnes account for 85 % of the traffic. In 2014 that traffic increased by 5 %. In 2015 total traffic in the port of Ostend declined further to 1.3 million tonnes (-9.5 %). The main reason is the fall in deliveries of sand and gravel (-8.9 %). The loss of the roll-on/roll-off business has meant a decline in the number of passengers since 2013. In 2015, cruise ship traffic comprised 11,277 passengers. The port’s focus is shifting from the simple transhipment of cargo and tonnages to added value projects requiring a port and water. In recent years the port of Ostend has positioned itself as an “Energy Port”. The port handles the maintenance of the 3 offshore wind farms in the North Sea which are already operational (C-Power, Belwind & Northwind). It also aims to win projects for the installation of wind farms. These activities are generating additional shipping movements to and from the port. 4.2 Value added
In recent years, in view of the changed circumstances, the smallest Flemish port – Ostend – has been trying to refocus and position itself, and has been relatively successful in doing so. Over the past six years both the maritime and the non-maritime cluster have achieved growth in most branches. 2014 was another fairly good year, with the possible exception of dredging, chemicals and construction. However, the main branches – metalworking and fishing industry – again recorded positive growth of direct value added. The change of indirect value added was very modest (-0.4 %) and is attributable primarily to the metalworking industry, construction and dredging. Direct value added represented 0.2 % of the GDP of the Flemish region and 0.1 % of the Belgian GDP. Total value added accounted for 0.2 % of the Belgian GDP.
4.3 Employment
As in most ports, direct employment in the port of Ostend is under some pressure. Nevertheless, it should be noted that employment in the fishing industry and in cargo handling increased considerably in 2014. In the non-maritime cluster, employment in the key branch – the metalworking industry – was virtually stable (+0.4 %). There was a particularly sharp fall in the other logistic services branch (-26.2 %). In 2014 there was little change in employment generated in the supplier sector. Direct employment represented 0.2 % of the employment in the Flemish region and 0.1 % of Belgian employment. Total employment accounted for 0.2 % of Belgian employment. 4.4 Investment
In regard to investment, the notable growth recorded by the maritime cluster is due mainly to the port construction and dredging branch. The fishing industry posted its lowest growth figure in six years. In the non-maritime cluster, investment in the metalworking industry was down sharply (-28.4 %). 41 Source: Jean-Pierre Merckx, Flemish Port Commission.

NBB WORKING PAPER No. 299 - JUNE 2016 33
CHART 9 CHANGE IN DIRECT VALUE ADDED CHART 10 CHANGE IN DIRECT EMPLOYMENT (in € million, current prices) (FTE)
Source: NBB (calculations based on the Belgian accounts filed with the Central Balance Sheet Office).
-40
-30
-20
-10
0
10
20
30
40
50
60
2010 2011 2012 2013 2014
Maritime Trade
Industry Land transport
Other logistics Port of Ostend
-300
-225
-150
-75
0
75
150
225
300
375
450
2010 2011 2012 2013 2014
Maritime Trade
Industry Land transport
Other logistics Port of Ostend

34 NBB WORKING PAPER No. 299 - JUNE 2016
TABLE 29 VALUE ADDED AT THE PORT OF OSTEND FROM 2009 TO 2014 (in € million - current prices)
Sectors 2009 2010
2011 2012 2013 2014 Share in 2014
Change from 2013
to 2014
Annual average
change from 2009
to 2014 (in p.c.) (in p.c.) (in p.c.)
DIRECT EFFECTS .......................... 450.7 494.6 470.5 485.7 485.4 492.4 100.0 + 1.4 + 1.8 MARITIME CLUSTER ................. 158.6 153.6 163.0 168.2 169.3 171.8 34.9 + 1.5 + 1.6 Shipping agents and
forwarders ................................ 4.5 4.5 4.6 7.0 4.5 2.2 0.4 - 52.3 - 13.8
Cargo handling ......................... 2.5 2.2 2.2 3.3 2.2 3.1 0.6 + 39.3 + 4.9
Shipping companies ................. 0.3 0.5 0.6 0.2 0.8 1.1 0.2 + 41.4 + 32.0
Shipbuilding and repair ............ 12.1 12.5 12.2 12.4 13.1 12.2 2.5 - 6.7 + 0.1
Port construction and dredging 50.0 42.5 55.4 57.0 59.4 57.6 11.7 - 3.1 + 2.9
Fishing and fish industry .......... 38.2 39.7 35.8 34.3 38.7 43.3 8.8 + 11.9 + 2.5
Port trade .................................. 0.0 0.0 0.0 0.0 0.0 0.0 0.0 n. n.
Port authority ............................ 3.0 3.2 2.0 3.6 2.3 2.4 0.5 + 5.8 - 4.2
Public sector ............................. 47.9 48.4 50.1 50.3 48.2 49.9 10.1 + 3.4 + 0.8
Allocation (p.m. ) ....................... 9.9 10.8 9.6 8.6 9.9 11.7 - + 18.5 + 3.5
NON-MARITIME CLUSTER ........ 292.1 341.0 307.5 317.5 316.2 320.6 65.1 + 1.4 + 1.9
TRADE ......................................... 21.0 18.5 13.3 13.7 14.0 13.1 2.7 - 6.8 - 9.1
INDUSTRY .................................... 236.7 275.0 250.7 265.1 265.1 271.7 55.2 + 2.5 + 2.8
Energy ...................................... 13.5 27.8 22.0 19.0 13.4 18.8 3.8 + 40.3 + 6.8
Fuel production ........................ 0.0 0.0 0.0 0.0 0.0 0.0 0.0 n. n.
Chemicals ................................. 34.5 36.5 34.3 36.0 38.3 36.7 7.5 - 4.1 + 1.2
Car manufacturing .................... 0.0 2.2 2.4 2.1 2.2 0.8 0.2 - 62.2 n.
Electronics ................................ 0.0 0.5 -0.1 0.0 0.0 0.0 0.0 n. n.
Metalworking industry .............. 156.1 176.2 152.9 153.7 161.5 167.4 34.0 + 3.7 + 1.4
Construction ............................. 16.8 17.7 21.2 37.3 33.1 31.7 6.4 - 4.2 + 13.5
Food industry ........................... 9.1 8.7 11.2 12.2 12.3 11.6 2.4 - 5.7 + 4.9
Other industries ........................ 6.5 5.5 6.6 4.7 4.3 4.7 1.0 + 7.9 - 6.3
LAND TRANSPORT .................... 24.8 24.4 25.1 24.2 24.6 22.4 4.6 - 8.8 - 2.0
Road transport ......................... 24.8 24.4 25.1 23.6 24.6 22.4 4.6 - 8.8 - 2.0
Other land transport .................. 0.0 0.0 0.0 0.6 0.0 0.0 0.0 n. n.
OTHER LOGISTIC SERVICES ... 9.6 23.0 18.5 14.6 12.5 13.3 2.7 + 7.1 + 6.8
INDIRECT EFFECTS ...................... 314.9 330.4 327.7 358.5 356.5 355.2 - - 0.4 + 2.4
MARITIME CLUSTER ................. 111.8 103.9 116.7 121.4 124.6 122.9 - - 1.4 + 1.9 NON-MARITIME CLUSTER ......... 203.1 226.5 211.1 237.0 231.9 232.3 - + 0.1 + 2.7
TOTAL VALUE ADDED .................. 765.5 825.0 798.2 844.2 842.0 847.6 - + 0.7 + 2.1 Source: NBB (calculations based on the Belgian accounts filed with the Central Balance Sheet Office, and the Belgian IOTs). The data necessary to estimate the indirect effects are published by the NAI with a low frequency and after a certain time lag. The indirect effects for the period 2009-2014 are based on IOT 2010 and SUT 2010, 2011 and 2012. The calculated indirect effects are approximations and should be interpreted with caution.
TABLE 30 VALUE ADDED TOP 10 AT THE PORT OF OSTEND IN 2014
Ranking Company name Sector _________________________ __________________________________________________________________________________ __________________________________________________________
1 DAIKIN EUROPE Metalworking industry 2 BAGGERWERKEN DECLOEDT EN ZOON Port construction and dredging 3 PUBLIC SECTOR Public sector 4 PROVIRON FUNCTIONAL CHEMICALS Chemicals 5 BIOSTOOM OOSTENDE Energy 6 VERHELST AANNEMINGEN Construction 7 MORUBEL Fishing and fish industry 8 ALGEMENE ONDERNEMINGEN SOETAERT Construction 9 BELGIAN NAVY Public sector 10 CLEMACO CONTRACTING Shipbuilding and repair
Source: NBB. The estimates for the multi-regional firms are based on surveys, annual reports and allocation formulas based on regional statistics. The top ten tables are based on information from annual accounts, surveys, annual reports and allocation formulas based on regional statistics. No individual figures are published as accurate data could not be obtained for all companies.

NBB WORKING PAPER No. 299 - JUNE 2016 35
TABLE 31 EMPLOYMENT AT THE PORT OF OSTEND FROM 2009 TO 2014 (FTE)
Sectors 2009 2010 2011 2012 2013 2014 Share in 2014
Change from 2013
to 2014
Annual average
change from 2009
to 2014 (in p.c.) (in p.c.) (in p.c.)
DIRECT EFFECTS .......................... 4,902 4,860 4,718 5,098 5,041 4,957 100.0 - 1.7 + 0.2 MARITIME CLUSTER .................. 1,983 1,925 1,821 1,928 1,917 1,885 38.0 - 1.7 - 1.0 Shipping agents and
forwarders ................................. 64 60 59 53 12 12 0.2 - 0.9 - 28.5
Cargo handling ......................... 118 89 55 58 55 66 1.3 + 19.6 - 11.0
Shipping companies ................. 2 1 2 1 2 3 0.1 + 45.3 + 10.4
Shipbuilding and repair ............. 235 230 211 194 201 192 3.9 - 4.6 - 4.0
Port construction and dredging 259 270 276 428 426 381 7.7 - 10.4 + 8.0
Fishing and fish industry ........... 501 491 421 423 453 477 9.6 + 5.3 - 1.0
Port trade .................................. 0 0 0 0 0 0 0.0 n. n.
Port authority ............................ 44 40 43 44 42 38 0.8 - 7.9 - 2.8
Public sector ............................. 760 744 756 726 727 716 14.4 - 1.5 - 1.2
Allocation (p.m. ) ........................ 140 136 116 110 128 120 - - 6.0 - 3.1
NON-MARITIME CLUSTER ........ 2,918 2,935 2,897 3,170 3,124 3,072 62.0 - 1.7 + 1.0
TRADE .......................................... 295 262 180 173 169 160 3.2 - 5.4 - 11.5
INDUSTRY .................................... 2,142 2,182 2,197 2,411 2,412 2,415 48.7 + 0.1 + 2.4
Energy ....................................... 46 53 63 62 55 56 1.1 + 2.6 + 3.9
Fuel production ......................... 0 0 0 0 0 0 0.0 n. n.
Chemicals ................................. 342 320 318 321 311 312 6.3 + 0.4 - 1.8
Car manufacturing .................... 0 27 29 29 31 33 0.7 + 6.6 n.
Electronics ................................ 0 11 1 0 0 0 0.0 n. n.
Metalworking industry ............... 1,342 1,336 1,337 1,338 1,391 1,396 28.2 + 0.4 + 0.8
Construction .............................. 231 248 259 476 439 413 8.3 - 5.9 + 12.3
Food industry ............................ 118 124 133 135 130 142 2.9 + 9.3 + 3.8
Other industries ........................ 62 63 57 50 56 63 1.3 + 11.0 + 0.2
LAND TRANSPORT ..................... 369 363 380 413 413 401 8.1 - 2.8 + 1.7
Road transport .......................... 369 363 380 404 413 401 8.1 - 2.8 + 1.7
Other land transport ................... 0 0 0 9 0 0 0.0 n. n.
OTHER LOGISTIC SERVICES .... 113 128 140 173 130 96 1.9 - 26.2 - 3.1
INDIRECT EFFECTS ....................... 4,061 4,061 3,851 4,406 4,292 4,275 - - 0.4 + 1.0
MARITIME CLUSTER .................. 1,259 1,239 1,096 1,293 1,268 1,222 - - 3.6 - 0.6 NON-MARITIME CLUSTER ......... 2,802 2,822 2,754 3,112 3,024 3,053 - + 1.0 + 1.7
TOTAL EMPLOYMENT ................... 8,963 8,921 8,569 9,504 9,333 9,232 - - 1.1 + 0.6 Source: NBB (calculations based on the Belgian accounts filed with the Central Balance Sheet Office, and the Belgian IOTs). The data necessary to estimate the indirect effects are published by the NAI with a low frequency and after a certain time lag. The indirect effects for the period 2009-2014 are based on IOT 2010 and SUT 2010, 2011 and 2012. The calculated indirect effects are approximations and should be interpreted with caution.
TABLE 32 EMPLOYMENT TOP 10 AT THE PORT OF OSTEND IN 2014
Ranking Company name Sector _________________________ __________________________________________________________________________________ __________________________________________________________
1 DAIKIN EUROPE Metalworking industry 2 PUBLIC SECTOR Public sector 3 BAGGERWERKEN DECLOEDT EN ZOON Port construction and dredging 4 VERHELST AANNEMINGEN Construction 5 PROVIRON FUNCTIONAL CHEMICALS Chemicals 6 BELGIAN NAVY Public sector 7 WIM BOSMAN LOGISTIC SERVICES Road transport 8 ALGEMENE ONDERNEMINGEN SOETAERT Construction 9 CLEMACO CONTRACTING Shipbuilding and repair 10 MORUBEL Fishing and fish industry
Source: NBB. The estimates for the multi-regional firms are based on surveys, annual reports and allocation formulas based on regional statistics. The top ten tables are based on information from annual accounts, surveys, annual reports and allocation formulas based on regional statistics. No individual figures are published as accurate data could not be obtained for all companies.

36 NBB WORKING PAPER No. 299 - JUNE 2016
TABLE 33 INVESTMENT AT THE PORT OF OSTEND FROM 2009 TO 2014 (in € million - current prices)
Sectors 2009 2010 2011 2012 2013 2014 Share in 2014
Change from 2013
to 2014
Annual average
change from 2009
to 2014 (in p.c.) (in p.c.) (in p.c.)
MARITIME CLUSTER ................. 79.0 48.4 21.7 26.3 25.6 71.1 59.8 + 177.9 - 2.1 Shipping agents and
forwarders ................................ 1.2 0.2 0.2 0.4 1.9 0.2 0.2 - 87.1 - 27.5
Cargo handling ......................... 0.8 0.1 4.5 1.7 1.8 1.8 1.5 + 2.5 + 18.3
Shipping companies ................. 0.0 0.2 0.5 0.0 0.3 0.5 0.4 + 96.8 n.
Shipbuilding and repair ............ 3.0 1.5 2.4 1.2 1.9 1.2 1.0 - 36.3 - 16.7
Port construction and dredging 28.6 24.6 2.0 3.2 0.2 46.4 39.0 + 21217.0 + 10.1
Fishing and fish industry .......... 6.8 8.9 6.0 7.9 6.3 5.5 4.6 - 12.8 - 4.1
Port trade .................................. 0.0 0.0 0.0 0.0 0.0 0.0 0.0 n. n.
Port authority ............................ 1.6 0.9 2.0 2.0 1.5 2.9 2.4 + 85.5 + 12.9
Public sector ............................. 37.0 12.1 4.2 9.9 11.7 12.6 10.6 + 8.2 - 19.3
Allocation (p.m. ) ....................... 5.3 5.1 3.4 4.6 3.6 4.1 - + 12.4 - 5.2
NON-MARITIME CLUSTER ........ 46.6 57.5 68.6 69.2 50.6 47.8 40.2 - 5.5 + 0.5
TRADE ......................................... 3.2 2.6 4.6 5.2 4.0 7.0 5.9 + 74.5 + 16.8
INDUSTRY .................................... 32.3 45.0 45.9 40.8 34.6 35.3 29.6 + 1.9 + 1.8
Energy ...................................... 8.9 21.4 13.2 2.1 0.2 0.2 0.2 + 46.1 - 51.6
Fuel production ........................ 0.0 0.0 0.0 0.0 0.0 0.0 0.0 n. n.
Chemicals ................................. 1.3 3.5 5.6 9.2 6.6 5.7 4.8 - 13.2 + 33.7
Car manufacturing .................... 0.0 0.3 0.3 0.2 0.2 0.1 0.1 - 70.1 n.
Electronics ................................ 0.0 0.0 0.0 0.0 0.0 0.0 0.0 n. n.
Metalworking industry .............. 15.7 6.0 14.4 16.4 15.6 11.2 9.4 - 28.4 - 6.5
Construction ............................. 5.0 7.5 6.7 11.3 9.4 13.6 11.4 + 43.6 + 22.2
Food industry ........................... 0.7 6.2 1.2 0.9 1.4 3.7 3.1 + 163.1 + 39.9
Other industries ........................ 0.7 0.1 4.6 0.6 1.2 0.8 0.6 - 34.3 + 1.2
LAND TRANSPORT .................... 2.5 4.1 7.0 6.5 5.6 1.7 1.5 - 68.5 - 6.9
Road transport ......................... 2.5 2.9 6.6 6.5 5.4 1.7 1.5 - 68.1 - 7.1
Other land transport .................. 0.0 1.2 0.4 0.0 0.1 0.0 0.0 - 86.2 n.
OTHER LOGISTIC SERVICES ... 8.6 5.8 11.1 16.8 6.4 3.8 3.2 - 40.5 - 15.1
DIRECT INVESTMENT ................... 125.7 105.9 90.3 95.5 76.2 118.9 100.0 + 56.1 - 1.1
Source: NBB (calculations based on the Belgian accounts filed with the Central Balance Sheet Office and on surveys).
TABLE 34 INVESTMENT TOP 10 AT THE PORT OF OSTEND IN 2014
Ranking Company name Sector _________________________ __________________________________________________________________________________ __________________________________________________________
1 BAGGERWERKEN DECLOEDT EN ZOON Port construction and dredging 2 PUBLIC SECTOR Public sector 3 DAIKIN EUROPE Metalworking industry 4 TOPASFALT Construction 5 GREEN POINT SUPPLIES Trade 6 PROVIRON FUNCTIONAL CHEMICALS Chemicals 7 FIDES PETFOOD Food industry 8 VERHELST AANNEMINGEN Construction 9 VERHELST MACHINES Metalworking industry 10 OSTEND PORT AUTHORITY Port authority
Source: NBB. The estimates for the multi-regional firms are based on surveys, annual reports and allocation formulas based on regional statistics. The top ten tables are based on information from annual accounts, surveys, annual reports and allocation formulas based on regional statistics. No individual figures are published as accurate data could not be obtained for all companies.

NBB WORKING PAPER No. 299 - JUNE 2016 37
5 PORT OF ZEEBRUGGE
5.1 Port developments42
In 2014, the traffic handled by the port of Zeebrugge totalled 42.5 million tonnes (-0.7 % against 2013). Containers, the main type of traffic in the port of Zeebrugge, recorded a further small rise in 2014 to reach 20.5 million tonnes. Roll-on/roll-off traffic, the second most important type, was up by 4.0 % in 2014. Containers and roll-on/roll-off together account for 79 % of the total traffic. The third important category in Zeebrugge is liquid bulk, with a large proportion of liquid natural gas (the LNG terminal in the outer port). There was a steep decline in container traffic in 2015: down from 20.5 to 15.6 million tonnes (-23.8 %). That is due entirely to changes in container alliances. Following the formation of the O3 alliance (CMA CGM – CSCL - UASC), the main alliance services were transferred to Zeebrugge. However, the formation of the M2 alliance led to the departure of Maersk and MSC. CMA CGM took away the feeder network, and in mid-2015 the FAL 3 service was terminated in order to tackle the excess capacity. In 2015, roll-on/roll-off traffic increased from 13.0 to 13.5 million tonnes (+3.1 %). The main traffic growth concerned the United Kingdom (+6.2 %) and Scandinavia (+11 %). Within the roll-on/roll-off sector, the handling of new cars is generating good results: 2,427,950 cars were handled in Zeebrugge in 2015 (+10.3 % against 2014), making Zeebrugge the world’s largest car shipping port. Liquid bulk transhipment increased by 2.9 % in 2015 to 6.8 million tonnes. LNG was up by 9 %. Fluxys LNG ordered the construction of a fifth storage tank at the LNG terminal in Zeebrugge. The new storage tank will have a capacity of 180,000 m³ of liquid natural gas, much bigger than the existing tanks (3 with a capacity of 80,000 m³ and 1 of 140.000 m³). Dry bulk accounts for a relatively small share of traffic in Zeebrugge: 1.3 million tonnes in 2015 (+6.3 %). Conventional general cargo was down by 1.6 % to 1.2 million tonnes. Altogether, 7,888 ships called the port of Zeebrugge (+2.2 %). The average ship size was 24,553 BT (compared to 26,073 BT in 2014). In 2015, 111 cruise ships called the port of Zeebrugge, with a total of 471,084 cruise passengers on board. In 2014 the number of cruise ships was 107. Another notable feature of 2015 was the call of the very largest container vessels, such as the CSCL Globe (19,100 TEU) owned by China Shipping Container Lines, the CMA CGM Kerguelen and CMA CGM Georg Forster (17,772 TEU) and the UASC Barzan and UASC Al Muraykh (18,800 TEU) owned by United Arab Shipping Container Lines. Consolidation of the container traffic at the APM Terminal in Zeebrugge was announced in 2015 and is scheduled to take place in 2016. Two CMA CGM services (FAL1 and FAL8) previously handled by the CHZ terminal in Zeebrugge are transferring to the Albert II dock. In addition to the existing services of APM Terminal Zeebrugge, all container services will be retained and thus concentrated on a single terminal. 5.2 Value added
In 2014, the overall growth of direct value added in Zeebrugge was remarkably weak at -4.5 %, but that figure masks numerous opposing trends in the various branches. The marked declined is due almost entirely to the relocation of one industrial company in the electronics branch, whereas the other important industrial branches in the non-maritime cluster did well in 2014. A number of branches in the maritime cluster also recorded strong growth figures: examples include the cargo handlers (+6.4 %), fishing industry (+2.9 %), shipping companies (+2.7 %) and the port authority (+12.9 %). Conversely, the port construction and dredging branch did less well in 2014 (-24.4 %). Due to the departure of a company from the electronics branch, indirect value added decreased overall.
42 Source: Jean-Pierre Merckx, Flemish Port Commission.

38 NBB WORKING PAPER No. 299 - JUNE 2016
Direct value added represented 0.4 % of the GDP of the Flemish region and 0.2 % of the Belgian GDP. Total value added accounted for 0.4 % of the Belgian GDP. 5.3 Employment
In regard to direct employment, viewed overall, Zeebrugge has also experienced the general downward trend of the past six years. Nevertheless, both clusters featured some exceptions, such as the cargo handlers, port construction and dredging, the energy sector and chemicals. The growth figures for 2014, the latest available year, vary widely. The virtual stabilisation of indirect employment in the port of Zeebrugge is due almost exclusively to the aforesaid developments in the electronics branch and road transport. The indirect employment created by the shipping companies was predominantly positive. Direct employment represented 0.4 % of the employment in the Flemish region and 0.2 % of Belgian employment. Total employment accounted for 0.5 % of Belgian employment. 5.4 Investment
Being project-linked, investment is highly volatile. However, over the past six years it is clear that the main branches in the port of Zeebrugge, such as cargo handling and the energy sector, have had a strong propensity to invest, although there was a sharp fall in investment spending in the latter sector in 2014 (-28 %).
CHART 11 CHANGE IN DIRECT VALUE ADDED CHART 12 CHANGE IN DIRECT EMPLOYMENT (in € million, current prices) (FTE)
Source: NBB (calculations based on the Belgian accounts filed with the Central Balance Sheet Office).
-125
-100
-75
-50
-25
0
25
50
75
100
125
2010 2011 2012 2013 2014
Maritime Trade
Industry Land transport
Other logistics Port of Zeebrugge
-625
-500
-375
-250
-125
0
125
250
375
500
625
2010 2011 2012 2013 2014
Maritime Trade
Industry Land transport
Other logistics Port of Zeebrugge

NBB WORKING PAPER No. 299 - JUNE 2016 39
TABLE 35 VALUE ADDED AT THE PORT OF ZEEBRUGGE FROM 2009 TO 2014 (in € million - current prices)
Sectors 2009 2010
2011 2012 2013 2014 Share in 2014
Change from 2013
to 2014
Annual average
change from 2009
to 2014 (in p.c.) (in p.c.) (in p.c.)
DIRECT EFFECTS .......................... 925.8 960.3 976.2 944.7 979.4 935.8 100.0 - 4.5 + 0.2 MARITIME CLUSTER .................. 450.6 490.8 505.6 518.8 537.8 546.9 58.4 + 1.7 + 3.9 Shipping agents and
forwarders ................................. 62.8 48.0 49.8 58.6 69.8 68.4 7.3 - 2.0 + 1.7
Cargo handling ......................... 174.3 191.8 191.9 193.9 194.7 207.2 22.1 + 6.4 + 3.5
Shipping companies ................. 12.0 33.1 45.3 45.6 50.7 52.0 5.6 + 2.7 + 34.1
Shipbuilding and repair ............. 8.0 8.8 9.3 10.3 9.8 9.0 1.0 - 9.1 + 2.3
Port construction and dredging 13.3 17.6 15.3 20.0 24.6 18.6 2.0 - 24.4 + 6.9
Fishing and fish industry ........... 43.1 48.5 49.3 47.8 45.0 46.3 4.9 + 2.9 + 1.5
Port trade .................................. 0.7 0.6 0.6 0.6 0.7 0.8 0.1 + 17.8 + 3.7
Port authority ............................ 31.8 33.5 35.2 34.1 32.5 36.7 3.9 + 12.9 + 2.9
Public sector ............................. 104.7 108.7 108.9 107.8 109.9 107.8 11.5 - 1.9 + 0.6
Allocation (p.m. ) ........................ 9.3 14.6 18.9 19.0 19.6 20.0 - + 2.2 + 16.5
NON-MARITIME CLUSTER ........ 475.2 469.5 470.6 425.8 441.7 388.9 41.6 - 12.0 - 3.9
TRADE .......................................... 86.5 85.3 96.1 100.3 74.2 70.2 7.5 - 5.5 - 4.1
INDUSTRY .................................... 286.9 280.5 283.1 235.0 278.6 245.1 26.2 - 12.0 - 3.1
Energy ....................................... 92.0 97.6 107.3 95.0 92.5 98.3 10.5 + 6.2 + 1.3
Fuel production ......................... 0.0 0.0 0.0 0.0 0.0 0.0 0.0 n. n.
Chemicals ................................. 25.9 27.8 28.0 25.4 30.7 36.1 3.9 + 17.5 + 6.9
Car manufacturing .................... 0.5 0.6 0.6 0.9 1.1 1.3 0.1 + 24.6 + 20.0
Electronics ................................ 70.2 52.6 55.1 23.8 54.7 3.2 0.3 - 94.1 - 45.9
Metalworking industry ............... 7.0 9.0 9.1 8.8 7.4 8.2 0.9 + 10.9 + 3.3
Construction .............................. 35.3 34.6 26.1 22.1 24.1 23.3 2.5 - 3.2 - 7.9
Food industry ............................ 20.2 24.5 24.3 27.7 32.4 35.5 3.8 + 9.5 + 11.9
Other industries ........................ 35.8 33.8 32.4 31.4 35.8 39.2 4.2 + 9.6 + 1.8
LAND TRANSPORT ..................... 79.3 81.7 76.2 70.7 64.4 53.9 5.8 - 16.3 - 7.4
Road transport .......................... 65.0 68.1 65.2 61.2 57.3 47.2 5.0 - 17.6 - 6.2
Other land transport ................... 14.2 13.6 11.0 9.5 7.2 6.7 0.7 - 5.8 - 13.9
OTHER LOGISTIC SERVICES .... 22.6 22.1 15.3 19.8 24.4 19.7 2.1 - 19.3 - 2.7
INDIRECT EFFECTS ....................... 689.3 787.0 777.6 764.0 788.3 767.4 - - 2.6 + 2.2
MARITIME CLUSTER .................. 315.7 397.4 423.4 430.1 444.0 453.8 - + 2.2 + 7.5 NON-MARITIME CLUSTER ......... 373.6 389.7 354.1 333.9 344.3 313.6 - - 8.9 - 3.4
TOTAL VALUE ADDED .................. 1,615.1 1,747.4 1,753.8 1,708.6 1,767.7 1,703.2 - - 3.7 + 1.1 Source: NBB (calculations based on the Belgian accounts filed with the Central Balance Sheet Office, and the Belgian IOTs). The data necessary to estimate the indirect effects are published by the NAI with a low frequency and after a certain time lag. The indirect effects for the period 2009-2014 are based on IOT 2010 and SUT 2010, 2011 and 2012. The calculated indirect effects are approximations and should be interpreted with caution.
TABLE 36 VALUE ADDED TOP 10 AT THE PORT OF ZEEBRUGGE IN 2014
Ranking Company name Sector _________________________ __________________________________________________________________________________ __________________________________________________________
1 BELGIAN NAVY Public sector 2 FLUXYS LNG Energy 3 ZEEBRUGGE PORT AUTHORITY Port authority 4 COBELFRET FERRIES Shipping companies 5 C.RO PORTS ZEEBRUGGE Cargo handling 6 INTERNATIONAL CAR OPERATORS Cargo handling 7 FLUXYS BELGIUM Energy 8 WALLENIUS WILHELMSEN LOGISTICS ZEEBRUGGE Cargo handling 9 PUBLIC SECTOR Public sector 10 P.B.I. FRUIT JUICE COMPANY Food industry
Source: NBB. The estimates for the multi-regional firms are based on surveys, annual reports and allocation formulas based on regional statistics. The top ten tables are based on information from annual accounts, surveys, annual reports and allocation formulas based on regional statistics. No individual figures are published as accurate data could not be obtained for all companies.

40 NBB WORKING PAPER No. 299 - JUNE 2016
TABLE 37 EMPLOYMENT AT THE PORT OF ZEEBRUGGE FROM 2009 TO 2014 (FTE)
Sectors 2009 2010
2011 2012 2013 2014 Share in 2014
Change from 2013
to 2014
Annual average
change from 2009
to 2014 (in p.c.) (in p.c.) (in p.c.)
DIRECT EFFECTS .......................... 10,752 10,250 10,072 9,962 9,726 9,365 100.0 - 3.7 - 2.7 MARITIME CLUSTER ................. 6,222 6,251 6,169 6,155 6,092 6,156 65.7 + 1.1 - 0.2 Shipping agents and
forwarders ................................ 621 612 605 633 652 652 7.0 + 0.0 + 1.0
Cargo handling ......................... 2,571 2,633 2,593 2,663 2,640 2,699 28.8 + 2.2 + 1.0
Shipping companies ................. 329 283 244 203 189 207 2.2 + 10.0 - 8.8
Shipbuilding and repair ............ 138 140 139 143 138 123 1.3 - 10.4 - 2.3
Port construction and dredging 171 173 177 176 168 213 2.3 + 26.7 + 4.4
Fishing and fish industry .......... 575 581 604 601 563 551 5.9 - 2.1 - 0.8
Port trade .................................. 9 9 9 10 9 11 0.1 + 17.4 + 3.3
Port authority ............................ 138 133 134 132 134 135 1.4 + 0.4 - 0.4
Public sector ............................. 1,670 1,688 1,664 1,595 1,600 1,566 16.7 - 2.1 - 1.3
Allocation (p.m. ) ....................... 248 374 380 396 377 367 - - 2.7 + 8.1
NON-MARITIME CLUSTER ........ 4,529 3,999 3,903 3,807 3,635 3,209 34.3 - 11.7 - 6.7
TRADE ......................................... 568 550 681 656 653 642 6.9 - 1.7 + 2.5
INDUSTRY .................................... 2,318 1,996 1,893 1,902 1,862 1,654 17.7 - 11.2 - 6.5
Energy ...................................... 114 127 127 129 125 135 1.4 + 7.7 + 3.4
Fuel production ........................ 0 0 0 0 0 0 0.0 n. n.
Chemicals ................................. 245 224 231 237 246 263 2.8 + 6.9 + 1.5
Car manufacturing .................... 13 11 11 12 11 13 0.1 + 11.5 - 0.3
Electronics ................................ 524 324 358 354 309 45 0.5 - 85.3 - 38.7
Metalworking industry .............. 137 145 146 147 137 142 1.5 + 3.6 + 0.6
Construction ............................. 463 445 367 341 351 328 3.5 - 6.3 - 6.6
Food industry ........................... 305 285 260 273 293 298 3.2 + 1.5 - 0.5
Other industries ........................ 517 435 393 410 391 431 4.6 + 10.3 - 3.6
LAND TRANSPORT .................... 1,315 1,264 1,152 1,055 913 758 8.1 - 17.0 - 10.4
Road transport ......................... 1,082 1,038 974 906 806 652 7.0 - 19.1 - 9.6
Other land transport .................. 232 225 177 149 108 107 1.1 - 0.8 - 14.4
OTHER LOGISTIC SERVICES ... 329 190 177 193 206 154 1.6 - 25.0 - 14.1
INDIRECT EFFECTS ...................... 11,897 11,803 10,707 10,499 10,274 10,192 - - 0.8 - 3.0
MARITIME CLUSTER ................. 7,161 7,030 6,503 6,158 5,989 6,210 - + 3.7 - 2.8 NON-MARITIME CLUSTER ......... 4,736 4,772 4,204 4,341 4,285 3,981 - - 7.1 - 3.4
TOTAL EMPLOYMENT .................. 22,649 22,053 20,779 20,461 20,000 19,557 - - 2.2 - 2.9 Source: NBB (calculations based on the Belgian accounts filed with the Central Balance Sheet Office, and the Belgian IOTs). The data necessary to estimate the indirect effects are published by the NAI with a low frequency and after a certain time lag. The indirect effects for the period 2009-2014 are based on IOT 2010 and SUT 2010, 2011 and 2012. The calculated indirect effects are approximations and should be interpreted with caution.
TABLE 38 EMPLOYMENT TOP 10 AT THE PORT OF ZEEBRUGGE IN 2014
Ranking Company name Sector _________________________ __________________________________________________________________________________ __________________________________________________________
1 BELGIAN NAVY Public sector 2 WALLENIUS WILHELMSEN LOGISTICS ZEEBRUGGE Cargo handling 3 C.RO PORTS ZEEBRUGGE Cargo handling 4 INTERNATIONAL CAR OPERATORS Cargo handling 5 PUBLIC SECTOR Public sector 6 MARINE HARVEST PIETERS Fishing and fish industry 7 P.B.I. FRUIT JUICE COMPANY Food industry 8 ARTES DEPRET Port construction and dredging 9 I.V.B.O. Other industries 10 CONTAINER HANDLING ZEEBRUGGE Cargo handling
Source: NBB. The estimates for the multi-regional firms are based on surveys, annual reports and allocation formulas based on regional statistics. The top ten tables are based on information from annual accounts, surveys, annual reports and allocation formulas based on regional statistics. No individual figures are published as accurate data could not be obtained for all companies.

NBB WORKING PAPER No. 299 - JUNE 2016 41
TABLE 39 INVESTMENT AT THE PORT OF ZEEBRUGGE FROM 2009 TO 2014 (in € million - current prices)
Sectors 2009 2010 2011 2012 2013 2014 Share in 2014
Change from 2013
to 2014
Annual average
change from 2009
to 2014 (in p.c.) (in p.c.) (in p.c.)
MARITIME CLUSTER .................. 115.5 227.7 166.7 135.7 103.3 140.4 63.8 + 36.0 + 4.0 Shipping agents and
forwarders ................................. 9.2 19.6 11.9 7.3 4.6 15.0 6.8 + 228.3 + 10.2
Cargo handling ......................... 41.0 114.5 62.9 54.8 40.2 74.7 33.9 + 86.0 + 12.7
Shipping companies ................. 2.4 10.5 2.7 2.2 3.4 4.1 1.9 + 20.3 + 11.4
Shipbuilding and repair ............. 3.9 1.1 1.9 1.4 1.0 1.6 0.7 + 58.5 - 15.8
Port construction and dredging 1.3 1.7 1.1 1.1 1.6 1.3 0.6 - 22.3 - 0.0
Fishing and fish industry ........... 9.2 13.1 10.4 14.8 7.6 8.3 3.8 + 9.2 - 2.2
Port trade .................................. 0.1 0.1 0.2 0.0 0.2 0.0 0.0 - 76.6 - 11.8
Port authority ............................ 27.3 34.2 33.6 34.0 28.3 22.0 10.0 - 22.4 - 4.3
Public sector ............................. 21.0 32.9 42.0 20.0 16.4 13.4 6.1 - 18.1 - 8.6
Allocation (p.m. ) ........................ 23.3 45.5 48.5 38.0 33.7 48.6 - + 44.3 + 15.9
NON-MARITIME CLUSTER 79.2 121.9 127.2 118.9 116.4 79.6 36.2 - 31.6 + 0.1
TRADE .......................................... 7.9 8.8 11.1 12.1 10.0 7.0 3.2 - 29.7 - 2.2
INDUSTRY .................................... 51.3 72.5 68.2 71.0 69.0 49.6 22.5 - 28.1 - 0.7
Energy ....................................... 14.8 38.1 27.1 24.4 44.0 31.7 14.4 - 28.0 + 16.5
Fuel production ......................... 0.0 0.0 0.0 0.0 0.0 0.0 0.0 n. n.
Chemicals ................................. 2.0 2.7 4.5 3.3 3.1 4.3 2.0 + 40.3 + 16.6
Car manufacturing .................... 0.0 0.0 0.0 0.1 0.3 0.0 0.0 - 94.9 n.
Electronics ................................ 5.8 7.3 5.9 4.7 5.5 0.5 0.2 - 90.8 - 38.5
Metalworking industry ............... 1.1 0.9 0.5 0.6 0.3 0.6 0.3 + 69.2 - 11.9
Construction .............................. 6.9 6.9 6.4 5.3 3.3 2.5 1.1 - 23.7 - 18.4
Food industry ............................ 14.9 6.1 6.4 15.2 4.7 5.9 2.7 + 26.2 - 16.8
Other industries ........................ 5.8 10.6 17.5 17.5 7.8 4.0 1.8 - 48.4 - 7.1
LAND TRANSPORT ..................... 13.0 27.5 41.2 32.4 28.8 17.8 8.1 - 38.1 + 6.5
Road transport .......................... 11.8 17.1 16.2 7.3 12.3 7.4 3.4 - 39.8 - 8.8
Other land transport ................... 1.2 10.4 25.0 25.2 16.5 10.4 4.7 - 36.8 + 53.5
OTHER LOGISTIC SERVICES .... 7.0 13.2 6.7 3.3 8.6 5.2 2.4 - 39.7 - 5.7
DIRECT INVESTMENT .................... 194.7 349.6 293.9 254.6 219.7 220.1 100.0 + 0.2 + 2.5
Source: NBB (calculations based on the Belgian accounts filed with the Central Balance Sheet Office and on surveys).
TABLE 40 INVESTMENT TOP 10 AT THE PORT OF ZEEBRUGGE IN 2014
Ranking Company name Sector _________________________ __________________________________________________________________________________ __________________________________________________________
1 FLUXYS LNG Energy 2 ZEEBRUGGE PORT AUTHORITY Port authority 3 PUBLIC SECTOR Public sector 4 VERBRUGGE TERMINALS ZEEBRUGGE Cargo handling 5 BNRC GROUP Other land transport 6 2XL Shipping agents and forwarders 7 C.RO PORTS ZEEBRUGGE Cargo handling 8 FLUXYS BELGIUM Energy 9 CONTAINER HANDLING ZEEBRUGGE Cargo handling 10 P.B.I. FRUIT JUICE COMPANY Food industry
Source: NBB. The estimates for the multi-regional firms are based on surveys, annual reports and allocation formulas based on regional statistics. The top ten tables are based on information from annual accounts, surveys, annual reports and allocation formulas based on regional statistics. No individual figures are published as accurate data could not be obtained for all companies.

42 NBB WORKING PAPER No. 299 - JUNE 2016
6 LIÈGE PORT COMPLEX
6.1 Port developments43
The Liège port complex comprises private and public quays. The traffic figures in table 3 of this study present the picture for both. In 2014 there was an increase of around 0.5 %, representing over 15 million tonnes. The traffic figures for the public quays, operated by the Autonomous Port of Liège, indicate an increase of 2 % in 2014 to 13.5 million tonnes. However, the growth figures need to be interpreted with caution because the private quays are gradually managed by the Autonomous Port of Liège. Substantial increases were recorded in the goods categories coal, recycling materials and containers. Timber, chemicals, coke and petroleum products were down sharply. Factors include the closure of the coke oven in Seraing, the mild winter and and closure of the Les Awirs pellet-fired power stations. 6.2 Value added
The favourable trend in traffic was not reflected in value added growth. In both the maritime and the non-maritime cluster, value added fell by around 5.8 %. The port of Liège is heavily dependent on industry for the creation of value added. Various industrial restructurings and problems in some electricity generating stations therefore had a significant negative impact on growth. The restructurings in the steel industry also had a major adverse effect on indirect value added, which declined sharply in 2014 (-7.8 %). However, that fall was due solely to the metal industry; with the exception of chemicals and construction, most branches generated less indirect value added. Direct value added represented 1.2 % of the GDP of the Walloon region and 0.3 % of the Belgian GDP. Total value added accounted for 0.6 % of the Belgian GDP. 6.3 Employment
The port of Liège has for some years experienced quite a sharp downward trend in direct employment, mainly as a result of major restructuring in the steel industry. In the other branches, the picture is variable. In energy – the most important branch – employment is expanding strongly, and the trend over a longer period has been very favourable. The same applies to the fuel production and chemicals branches, where employment is also increasing or at least remaining stable. The said restructuring in the steel industry was the main reason for the steep 8.2 % decline in indirect employment in 2014. Direct employment represented 0.8 % of the employment in the Walloon region and 0.2 % of Belgian employment. Total employment accounted for 0.5 % of Belgian employment. 6.4 Investment
The port authority is embarking on ambitious projects in an effort to maintain and stimulate business activity in the port. Projects such as Trilogiport encourage investment in a number of branches, but have not yet succeeded in reversing the downward trend in total investment, seen over a longer period.
43 Source: www.portdeliege.be, Press release 4 March 2015 from the Liège Port Authority.

NBB WORKING PAPER No. 299 - JUNE 2016 43
CHART 13 CHANGE IN DIRECT VALUE ADDED CHART 14 CHANGE IN DIRECT EMPLOYMENT (in € million, current prices) (FTE)
Source: NBB (calculations based on the Belgian accounts filed with the Central Balance Sheet Office).
-250
-200
-150
-100
-50
0
50
100
150
200
250
2010 2011 2012 2013 2014
Maritime Trade
Industry Land transport
Other logistics Port of Liège
-1.500
-1.200
-900
-600
-300
0
300
600
900
1.200
1.500
2010 2011 2012 2013 2014
Maritime Trade
Industry Land transport
Other logistics Port of Liège

44 NBB WORKING PAPER No. 299 - JUNE 2016
TABLE 41 VALUE ADDED IN THE LIÈGE PORT COMPLEX FROM 2009 TO 2014 (in € million - current prices)
Sectors 2009 2010
2011 2012 2013 2014 Share in 2014
Change from 2013
to 2014
Annual average
change from 2009
to 2014 (in p.c.) (in p.c.) (in p.c.)
DIRECT EFFECTS .......................... 1,271.1 1,311.0 1,413.9 1,186.1 1,202.2 1,130.9 100.0 - 5.9 - 2.3 MARITIME CLUSTER ................. 30.5 33.2 33.2 30.2 25.0 23.5 2.1 - 5.8 - 5.1 Shipping agents and
forwarders ................................ 8.8 11.4 11.5 8.7 4.0 3.6 0.3 - 8.0 - 16.3
Cargo handling ......................... 15.4 15.1 14.9 14.4 14.5 13.1 1.2 - 9.4 - 3.2
Shipping companies ................. 3.4 3.9 3.7 4.0 3.2 3.6 0.3 + 10.3 + 0.8
Shipbuilding and repair ............ 0.4 0.4 0.5 0.5 0.6 0.6 0.0 - 3.1 + 9.0
Port construction and dredging 0.0 0.0 0.0 0.0 0.0 0.0 0.0 n. n.
Fishing and fish industry .......... 0.0 0.0 0.0 0.0 0.0 0.0 0.0 n. n.
Port trade .................................. 0.0 0.0 0.0 0.0 0.0 0.0 0.0 n. n.
Port authority ............................ 2.5 2.4 2.5 2.6 2.7 2.6 0.2 - 2.9 + 1.3
Public sector ............................. 0.0 0.0 0.0 0.0 0.0 0.0 0.0 n. n.
Allocation (p.m. ) .......................
NON-MARITIME CLUSTER ........ 1,240.6 1,277.8 1,380.7 1,155.9 1,177.2 1,107.4 97.9 - 5.9 - 2.2
TRADE ......................................... 82.8 84.9 93.6 89.2 68.6 65.1 5.8 - 5.2 - 4.7
INDUSTRY .................................... 1,140.5 1,175.0 1,267.1 1,047.4 1,089.5 1,023.7 90.5 - 6.0 - 2.1
Energy ...................................... 409.8 409.3 496.7 388.0 382.6 324.7 28.7 - 15.1 - 4.5
Fuel production ........................ -10.7 -5.3 42.4 34.6 59.7 39.2 3.5 - 34.3 n.
Chemicals ................................. 62.1 126.4 119.6 97.7 116.9 139.8 12.4 + 19.6 + 17.6
Car manufacturing .................... 0.4 0.5 0.4 0.4 0.4 0.4 0.0 + 0.8 - 0.9
Electronics ................................ 2.7 3.4 5.5 4.6 3.3 4.2 0.4 + 26.6 + 9.0
Metalworking industry .............. 444.8 412.3 383.8 338.5 333.5 285.6 25.3 - 14.4 - 8.5
Construction ............................. 143.4 133.2 128.8 103.0 104.2 141.6 12.5 + 35.9 - 0.3
Food industry ........................... 25.1 22.8 20.5 23.1 29.4 26.9 2.4 - 8.3 + 1.5
Other industries ........................ 62.8 72.4 69.6 57.5 59.6 61.2 5.4 + 2.8 - 0.5
LAND TRANSPORT .................... 8.3 8.5 8.5 7.4 6.7 6.1 0.5 - 9.0 - 6.1
Road transport ......................... 7.2 7.5 7.5 6.5 5.7 5.0 0.4 - 11.4 - 7.0
Other land transport .................. 1.1 1.0 1.0 0.9 1.0 1.1 0.1 + 5.0 - 0.9
OTHER LOGISTIC SERVICES ... 9.0 9.5 11.6 11.9 12.4 12.5 1.1 + 0.5 + 6.9
INDIRECT EFFECTS ...................... 1,303.2 1,313.4 1,441.9 1,204.4 1,286.8 1,186.0 - - 7.8 - 1.9
MARITIME CLUSTER ................. 24.3 26.0 24.9 22.6 19.2 17.4 - - 9.3 - 6.4 NON-MARITIME CLUSTER ......... 1,278.9 1,287.4 1,416.9 1,181.8 1,267.6 1,168.6 - - 7.8 - 1.8
TOTAL VALUE ADDED .................. 2,574.3 2,624.4 2,855.8 2,390.5 2,489.0 2,316.9 - - 6.9 - 2.1
Source: NBB (calculations based on the Belgian accounts filed with the Central Balance Sheet Office, and the Belgian IOTs). The data necessary to estimate the indirect effects are published by the NAI with a low frequency and after a certain time lag. The indirect effects for the period 2009-2014 are based on IOT 2010 and SUT 2010, 2011 and 2012. The calculated indirect effects are approximations and should be interpreted with caution.
TABLE 42 VALUE ADDED TOP 10 AT THE LIÈGE PORT COMPLEX IN 2014
Ranking Company name Sector _________________________ __________________________________________________________________________________ __________________________________________________________
1 ELECTRABEL Energy 2 ARCELORMITTAL BELGIUM Metalworking industry 3 PRAYON Chemicals 4 CIMENTERIES CBR CEMENTBEDRIJVEN Construction 5 COCKERILL MAINTENANCE & INGENIERIE Metalworking industry 6 EDF LUMINUS Energy 7 BIOWANZE Fuel production 8 CARRIERES ET FOURS A CHAUX DUMONT-WAUTIER Construction 9 RAFFINERIE TIRLEMONTOISE - TIENSE SUIKERRAFFINADERERIJ Food industry 10 IMERYS MINERAUX BELGIQUE Chemicals
Source: NBB. The estimates for the multi-regional firms are based on surveys, annual reports and allocation formulas based on regional statistics. The top ten tables are based on information from annual accounts, surveys, annual reports and allocation formulas based on regional statistics. No individual figures are published as accurate data could not be obtained for all companies.
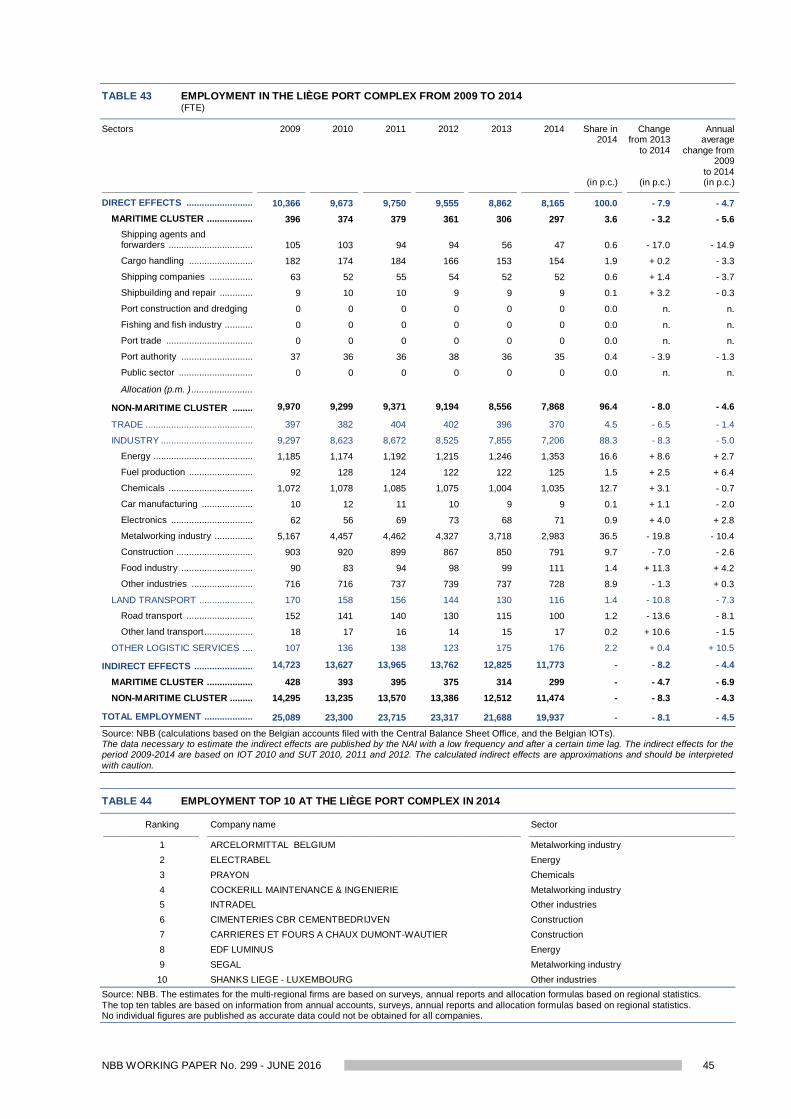
NBB WORKING PAPER No. 299 - JUNE 2016 45
TABLE 43 EMPLOYMENT IN THE LIÈGE PORT COMPLEX FROM 2009 TO 2014 (FTE)
Sectors 2009 2010
2011 2012 2013 2014 Share in 2014
Change from 2013
to 2014
Annual average
change from 2009
to 2014 (in p.c.) (in p.c.) (in p.c.)
DIRECT EFFECTS .......................... 10,366 9,673 9,750 9,555 8,862 8,165 100.0 - 7.9 - 4.7 MARITIME CLUSTER .................. 396 374 379 361 306 297 3.6 - 3.2 - 5.6 Shipping agents and
forwarders ................................. 105 103 94 94 56 47 0.6 - 17.0 - 14.9
Cargo handling ......................... 182 174 184 166 153 154 1.9 + 0.2 - 3.3
Shipping companies ................. 63 52 55 54 52 52 0.6 + 1.4 - 3.7
Shipbuilding and repair ............. 9 10 10 9 9 9 0.1 + 3.2 - 0.3
Port construction and dredging 0 0 0 0 0 0 0.0 n. n.
Fishing and fish industry ........... 0 0 0 0 0 0 0.0 n. n.
Port trade .................................. 0 0 0 0 0 0 0.0 n. n.
Port authority ............................ 37 36 36 38 36 35 0.4 - 3.9 - 1.3
Public sector ............................. 0 0 0 0 0 0 0.0 n. n.
Allocation (p.m. ) ........................
NON-MARITIME CLUSTER ........ 9,970 9,299 9,371 9,194 8,556 7,868 96.4 - 8.0 - 4.6
TRADE .......................................... 397 382 404 402 396 370 4.5 - 6.5 - 1.4
INDUSTRY .................................... 9,297 8,623 8,672 8,525 7,855 7,206 88.3 - 8.3 - 5.0
Energy ....................................... 1,185 1,174 1,192 1,215 1,246 1,353 16.6 + 8.6 + 2.7
Fuel production ......................... 92 128 124 122 122 125 1.5 + 2.5 + 6.4
Chemicals ................................. 1,072 1,078 1,085 1,075 1,004 1,035 12.7 + 3.1 - 0.7
Car manufacturing .................... 10 12 11 10 9 9 0.1 + 1.1 - 2.0
Electronics ................................ 62 56 69 73 68 71 0.9 + 4.0 + 2.8
Metalworking industry ............... 5,167 4,457 4,462 4,327 3,718 2,983 36.5 - 19.8 - 10.4
Construction .............................. 903 920 899 867 850 791 9.7 - 7.0 - 2.6
Food industry ............................ 90 83 94 98 99 111 1.4 + 11.3 + 4.2
Other industries ........................ 716 716 737 739 737 728 8.9 - 1.3 + 0.3
LAND TRANSPORT ..................... 170 158 156 144 130 116 1.4 - 10.8 - 7.3
Road transport .......................... 152 141 140 130 115 100 1.2 - 13.6 - 8.1
Other land transport ................... 18 17 16 14 15 17 0.2 + 10.6 - 1.5
OTHER LOGISTIC SERVICES .... 107 136 138 123 175 176 2.2 + 0.4 + 10.5
INDIRECT EFFECTS ....................... 14,723 13,627 13,965 13,762 12,825 11,773 - - 8.2 - 4.4
MARITIME CLUSTER .................. 428 393 395 375 314 299 - - 4.7 - 6.9 NON-MARITIME CLUSTER ......... 14,295 13,235 13,570 13,386 12,512 11,474 - - 8.3 - 4.3
TOTAL EMPLOYMENT ................... 25,089 23,300 23,715 23,317 21,688 19,937 - - 8.1 - 4.5 Source: NBB (calculations based on the Belgian accounts filed with the Central Balance Sheet Office, and the Belgian IOTs). The data necessary to estimate the indirect effects are published by the NAI with a low frequency and after a certain time lag. The indirect effects for the period 2009-2014 are based on IOT 2010 and SUT 2010, 2011 and 2012. The calculated indirect effects are approximations and should be interpreted with caution.
TABLE 44 EMPLOYMENT TOP 10 AT THE LIÈGE PORT COMPLEX IN 2014
Ranking Company name Sector _________________________ __________________________________________________________________________________ __________________________________________________________
1 ARCELORMITTAL BELGIUM Metalworking industry 2 ELECTRABEL Energy 3 PRAYON Chemicals 4 COCKERILL MAINTENANCE & INGENIERIE Metalworking industry 5 INTRADEL Other industries 6 CIMENTERIES CBR CEMENTBEDRIJVEN Construction 7 CARRIERES ET FOURS A CHAUX DUMONT-WAUTIER Construction 8 EDF LUMINUS Energy 9 SEGAL Metalworking industry 10 SHANKS LIEGE - LUXEMBOURG Other industries
Source: NBB. The estimates for the multi-regional firms are based on surveys, annual reports and allocation formulas based on regional statistics. The top ten tables are based on information from annual accounts, surveys, annual reports and allocation formulas based on regional statistics. No individual figures are published as accurate data could not be obtained for all companies.

46 NBB WORKING PAPER No. 299 - JUNE 2016
TABLE 45 INVESTMENT IN THE LIÈGE PORT COMPLEX FROM 2009 TO 2014 (in € million - current prices)
Sectors 2009 2010 2011 2012 2013 2014 Share in 2014
Change from 2013
to 2014
Annual average
change from 2009
to 2014 (in p.c.) (in p.c.) (in p.c.)
MARITIME CLUSTER ................. 3.8 3.6 5.0 4.0 4.0 5.2 2.7 + 29.8 + 6.3 Shipping agents and
forwarders ................................ 0.9 0.7 1.0 1.0 0.2 2.1 1.1 + 896.7 + 18.8
Cargo handling ......................... 2.6 2.2 3.0 2.4 3.4 2.6 1.3 - 21.9 - 0.2
Shipping companies ................. 0.2 0.3 0.7 0.5 0.4 0.2 0.1 - 58.1 - 2.3
Shipbuilding and repair ............ 0.0 0.0 0.0 0.0 0.0 0.0 0.0 n. n.
Port construction and dredging 0.0 0.0 0.0 0.0 0.0 0.0 0.0 n. n.
Fishing and fish industry .......... 0.0 0.0 0.0 0.0 0.0 0.0 0.0 n. n.
Port trade .................................. 0.0 0.0 0.0 0.0 0.0 0.0 0.0 n. n.
Port authority ............................ 0.1 0.3 0.2 0.0 0.0 0.3 0.1 n. + 26.4
Public sector ............................. 0.0 0.0 0.0 0.0 0.0 0.0 0.0 n. n.
Allocation (p.m. ) .......................
NON-MARITIME CLUSTER ........ 530.8 183.0 198.2 234.1 209.7 190.5 97.3 - 9.2 - 18.5
TRADE ......................................... 6.2 4.9 7.0 4.6 2.8 4.5 2.3 + 57.6 - 6.4
INDUSTRY .................................... 522.1 174.4 186.4 220.8 202.8 182.5 93.2 - 10.0 - 19.0
Energy ...................................... 99.4 58.8 82.0 82.3 88.9 79.8 40.8 - 10.2 - 4.3
Fuel production ........................ 51.8 16.8 10.5 7.6 5.9 7.2 3.7 + 22.3 - 32.7
Chemicals ................................. 41.2 36.4 20.2 26.6 21.5 18.1 9.3 - 15.6 - 15.2
Car manufacturing .................... 0.1 0.1 0.0 0.0 0.1 0.0 0.0 - 71.3 - 28.5
Electronics ................................ 0.3 0.4 0.7 2.4 0.5 0.6 0.3 + 36.0 + 14.8
Metalworking industry .............. 35.7 26.6 40.6 68.3 40.1 32.1 16.4 - 20.0 - 2.1
Construction ............................. 13.9 23.8 20.4 17.1 29.6 28.3 14.4 - 4.6 + 15.2
Food industry ........................... 1.6 1.1 1.6 1.7 1.9 1.9 0.9 - 1.2 + 3.6
Other industries ........................ 278.1 10.3 10.5 14.8 14.5 14.5 7.4 - 0.1 - 44.6
LAND TRANSPORT .................... 1.7 1.6 2.6 1.0 2.1 1.2 0.6 - 43.5 - 6.8
Road transport ......................... 0.9 1.0 1.8 0.5 1.2 0.5 0.3 - 58.6 - 11.4
Other land transport .................. 0.8 0.6 0.8 0.5 0.9 0.7 0.4 - 24.3 - 2.6
OTHER LOGISTIC SERVICES ... 0.7 2.1 2.3 7.7 1.9 2.4 1.2 + 25.2 + 26.6
DIRECT INVESTMENT ................... 534.6 186.5 203.2 238.1 213.7 195.7 100.0 - 8.4 - 18.2
Source: NBB (calculations based on the Belgian accounts filed with the Central Balance Sheet Office and on surveys).
TABLE 46 INVESTMENT TOP 10 AT THE LIÈGE PORT COMPLEX IN 2014
Ranking Company name Sector _________________________ __________________________________________________________________________________ __________________________________________________________
1 ELECTRABEL Energy 2 ARCELORMITTAL BELGIUM Metalworking industry 3 PRAYON Chemicals 4 CARRIERES ET FOURS A CHAUX DUMONT-WAUTIER Construction 5 EDF LUMINUS Energy 6 BIOWANZE Fuel production 7 INTRADEL Other industries 8 SEGAL Metalworking industry 9 COCKERILL MAINTENANCE & INGENIERIE Metalworking industry 10 CIMENTERIES CBR CEMENTBEDRIJVEN Construction
Source: NBB. The estimates for the multi-regional firms are based on surveys, annual reports and allocation formulas based on regional statistics. The top ten tables are based on information from annual accounts, surveys, annual reports and allocation formulas based on regional statistics. No individual figures are published as accurate data could not be obtained for all companies.

NBB WORKING PAPER No. 299 - JUNE 2016 47
7 PORT OF BRUSSELS
7.1 Port developments44
After two successive years of decline, 2014 saw positive growth of 3 % in the port’s own traffic; transhipment totalled around 4.4 million tonnes. Conversely, transit traffic – i.e. goods which pass through the port but are not loaded or unloaded – was down by 2 % and came to just under 2.3 million tonnes. Growth is attributable largely to the building materials category, and more particularly to the substantial rise in soil removal, which has quadrupled since 2013. The projects concerning the new shopping centre Docks Bruxsel and Tour&Taxis are the reason for that. The petroleum products category recorded a decline, but that was likely due to the very mild weather conditions in 2014. In preceding years, the successive changes in the container terminal operator resulted in a downward trend in the number of containers. While a further 4 % fall was recorded in the 2014 financial year, that is due to circumstances unconnected with the operator, more specifically the disruption to shipping between Antwerp and Brussels in 2014 caused by major maintenance work on the Zemst lock and a defect in the Vilvoorde bridge. 7.2 Value added
The direct value added of the port of Brussels was down by 2.2 % in 2014 against the previous year. That decline was due largely to the chemical industry and the port authority. In regard to the latter, that fall was due to an accounting operation in 2013 when an exceptional increase in value added was recorded via the provisions. Those provisions were used for dredging in 2014. The stated decline in the chemical industry is due primarily to the halving of turnover at Peptisyntha. That firm made a loss in 2014 owing to the excess capacity on the peptides market. The strong expansion in trade was due to a substantial increase in profit at Solvay Chemicals International45 and to the arrival of two new firms. The almost 3,4 % fall in indirect value added is attributable largely to developments in the other industries sector, in contrast to the previous year when the fall was due mainly to the construction industry. Direct value added represented 0.6 % of the GDP of the Brussels Capital Region and 0.1 % of the Belgian GDP. Total value added accounted for 0.2 % of the Belgian GDP. 7.3 Employment
In 2014 direct employment in the port of Brussels recorded a further decline, though it was smaller than in the previous year (-2.2 %). In the maritime cluster, cargo handlers alone recorded expansion. In the non-maritime cluster, there were particularly marked falls in construction, the food industry and trade. In the last case, the decline may be due to one firm concentrating its activities on a branch outside the port area. The 3.8 % decline in indirect employment is due mainly to developments in the other services branch. Direct employment represented 0.7 % of the employment in the Brussels Capital Region and 0.1 % of Belgian employment. Total employment accounted for 0.2 % of Belgian employment. 7.4 Investment
As already repeatedly mentioned, year-on-year investment figures are highly volatile because they relate to specific, major projects. However, a longer term view indicates that, in the maritime cluster, only cargo handlers are exhibiting positive growth. In the non-maritime cluster, the pattern is more varied.
44 Sources: www.portdebruxelles.be, Annual Report 2014 of the Brussels Port Authority and press release 30 January 2015. 45 Firms in the Solvay group come under various industrial branches (see previous port studies).

48 NBB WORKING PAPER No. 299 - JUNE 2016
CHART 15 CHANGE IN DIRECT VALUE ADDED CHART 16 CHANGE IN DIRECT EMPLOYMENT (in € million, current prices) (FTE)
Source: NBB (calculations based on the Belgian accounts filed with the Central Balance Sheet Office).
-100
-80
-60
-40
-20
0
20
40
60
80
100
2010 2011 2012 2013 2014
Maritime TradeIndustry Land transportOther logistics Port of Brussels
-500
-400
-300
-200
-100
0
100
200
300
400
500
2010 2011 2012 2013 2014
Maritime TradeIndustry Land transportOther logistics Port of Brussels

NBB WORKING PAPER No. 299 - JUNE 2016 49
TABLE 47 VALUE ADDED AT THE PORT OF BRUSSELS FROM 2009 TO 2014 (in € million - current prices)
Sectors 2009 2010
2011 2012 2013 2014 Share in 2014
Change from 2013
to 2014
Annual average
change from 2009
to 2014 (in p.c.) (in p.c.) (in p.c.)
DIRECT EFFECTS .......................... 527.8 537.0 526.0 541.4 484.4 473.8 100.0 - 2.2 - 2.1 MARITIME CLUSTER .................. 29.9 41.7 47.3 25.0 26.2 21.3 4.5 - 18.8 - 6.6 Shipping agents and
forwarders ................................. 21.5 32.5 36.1 17.4 15.2 15.6 3.3 + 2.4 - 6.2
Cargo handling ......................... 5.5 6.2 7.3 6.8 6.1 6.4 1.3 + 4.1 + 3.2
Shipping companies ................. 0.4 1.0 1.3 1.5 1.5 1.0 0.2 - 33.2 + 23.9
Shipbuilding and repair ............. 0.0 0.0 0.0 0.0 0.0 0.0 0.0 n. n.
Port construction and dredging 0.0 0.0 0.0 0.0 0.0 0.0 0.0 n. n.
Fishing and fish industry ........... 0.0 0.0 0.0 0.0 0.0 0.0 0.0 n. n.
Port trade .................................. 0.7 0.6 0.5 0.0 0.0 0.0 0.0 n. - 59.7
Port authority ............................ 1.8 1.4 1.9 -0.9 3.1 -1.9 -0.4 - 160.0 n.
Public sector ............................. 0.2 0.2 0.2 0.2 0.2 0.2 0.0 + 0.2 + 0.3
Allocation (p.m. ) ........................
NON-MARITIME CLUSTER ........ 497.9 495.3 478.7 516.4 458.2 452.5 95.5 - 1.2 - 1.9
TRADE .......................................... 156.3 177.0 173.1 211.7 154.1 163.9 34.6 + 6.4 + 1.0
INDUSTRY .................................... 116.7 111.6 114.9 125.8 101.3 87.1 18.4 - 14.1 - 5.7
Energy ....................................... 1.1 1.5 1.3 1.5 1.1 0.7 0.1 - 37.4 - 10.1
Fuel production ......................... 0.0 0.0 0.0 0.0 0.0 0.0 0.0 n. n.
Chemicals ................................. 10.5 7.1 5.6 5.8 4.8 0.9 0.2 - 80.7 - 38.3
Car manufacturing .................... 0.0 0.0 0.0 0.0 0.0 0.0 0.0 n. n.
Electronics ................................ 0.0 0.0 0.0 0.0 0.0 0.0 0.0 - 19.7 n.
Metalworking industry ............... 4.0 4.7 5.8 6.3 7.3 8.1 1.7 + 10.5 + 15.3
Construction .............................. 33.1 30.8 33.6 38.3 19.0 19.3 4.1 + 1.6 - 10.2
Food industry ............................ 21.5 15.2 16.9 14.8 13.8 14.8 3.1 + 7.0 - 7.2
Other industries ........................ 46.5 52.2 51.6 59.0 55.2 43.2 9.1 - 21.8 - 1.5
LAND TRANSPORT ..................... 24.3 24.4 23.9 21.8 17.2 18.1 3.8 + 5.2 - 5.7
Road transport .......................... 24.2 24.4 23.7 21.6 17.1 18.0 3.8 + 5.6 - 5.7
Other land transport ................... 0.1 0.1 0.2 0.2 0.1 0.1 0.0 - 52.5 - 13.3
OTHER LOGISTIC SERVICES .... 200.6 182.3 166.9 157.2 185.6 183.4 38.7 - 1.2 - 1.8
INDIRECT EFFECTS ....................... 395.2 398.3 396.7 408.0 354.1 342.2 - - 3.4 - 2.8
MARITIME CLUSTER .................. 30.8 40.9 45.7 31.3 32.6 28.3 - - 13.1 - 1.7 NON-MARITIME CLUSTER ......... 364.4 357.4 351.1 376.7 321.6 313.9 - - 2.4 - 2.9
TOTAL VALUE ADDED .................. 923.0 935.3 922.7 949.4 838.5 816.0 - - 2.7 - 2.4 Source: NBB (calculations based on the Belgian accounts filed with the Central Balance Sheet Office, and the Belgian IOTs). The data necessary to estimate the indirect effects are published by the NAI with a low frequency and after a certain time lag. The indirect effects for the period 2009-2014 are based on IOT 2010 and SUT 2010, 2011 and 2012. The calculated indirect effects are approximations and should be interpreted with caution.
TABLE 48 VALUE ADDED TOP 10 AT THE PORT OF BRUSSELS IN 2014
Ranking Company name Sector _________________________ __________________________________________________________________________________ __________________________________________________________
1 SOLVAY Other logistic services 2 INEOS SERVICES BELGIUM Other logistic services 3 SOLVAY CHEMICALS INTERNATIONAL Trade 4 INOVYN BELGIUM Trade 5 PLASTIC OMNIUM ADVANCED INNOVATION AND RESEARCH Other logistic services 6 BRUXELLES ENERGIE - BRUSSEL ENERGIE Other industries 7 CERES Food industry 8 AQUIRIS Other industries 9 SCANIA BELGIUM Trade 10 TOTAL BELGIUM Trade
Source: NBB. The estimates for the multi-regional firms are based on surveys, annual reports and allocation formulas based on regional statistics. The top ten tables are based on information from annual accounts, surveys, annual reports and allocation formulas based on regional statistics. No individual figures are published as accurate data could not be obtained for all companies

50 NBB WORKING PAPER No. 299 - JUNE 2016
TABLE 49 EMPLOYMENT AT THE PORT OF BRUSSELS FROM 2009 TO 2014 (FTE)
Sectors 2009 2010 2011 2012 2013 2014 Share in 2014
Change from 2013
to 2014
Annual average
change from 2009
to 2014 (in p.c.) (in p.c.) (in p.c.)
DIRECT EFFECTS .......................... 4,334 4,227 4,297 4,502 4,087 4,032 100.0 - 1.3 - 1.4 MARITIME CLUSTER ................. 395 429 498 434 428 425 10.6 - 0.7 + 1.5 Shipping agents and
forwarders ................................ 176 203 258 191 194 187 4.6 - 3.6 + 1.2
Cargo handling ......................... 79 85 94 96 93 99 2.5 + 6.2 + 4.6
Shipping companies ................. 1 4 5 16 15 14 0.4 - 4.0 + 74.7
Shipbuilding and repair ............ 0 0 0 0 0 0 0.0 n. n.
Port construction and dredging 0 0 0 0 0 0 0.0 n. n.
Fishing and fish industry .......... 0 0 0 0 0 0 0.0 n. n.
Port trade .................................. 5 5 6 0 0 0 0.0 n. - 100.0
Port authority ............................ 130 130 132 127 123 122 3.0 - 1.1 - 1.3
Public sector ............................. 3 3 3 3 3 3 0.1 + 0.0 + 0.0
Allocation (p.m. ) .......................
NON-MARITIME CLUSTER 3,939 3,798 3,799 4,068 3,658 3,606 89.4 - 1.4 - 1.7
TRADE ......................................... 1,346 1,293 1,242 1,321 1,306 1,283 31.8 - 1.8 - 0.9
INDUSTRY .................................... 1,127 1,129 1,113 1,191 910 889 22.0 - 2.3 - 4.6
Energy ...................................... 11 15 15 22 20 20 0.5 + 0.0 + 13.0
Fuel production ........................ 0 0 0 0 0 0 0.0 n. n.
Chemicals ................................. 72 41 40 45 49 48 1.2 - 3.6 - 8.0
Car manufacturing .................... 0 0 0 0 0 0 0.0 n. n.
Electronics ................................ 0 0 0 0 0 0 0.0 n. n.
Metalworking industry .............. 63 60 71 87 86 89 2.2 + 2.8 + 7.1
Construction ............................. 551 515 525 568 281 264 6.5 - 6.0 - 13.7
Food industry ........................... 151 153 148 148 150 140 3.5 - 6.9 - 1.6
Other industries ........................ 279 346 313 322 323 328 8.1 + 1.7 + 3.3
LAND TRANSPORT .................... 407 404 370 353 282 282 7.0 + 0.0 - 7.1
Road transport ......................... 405 403 367 350 280 281 7.0 + 0.4 - 7.1
Other land transport .................. 2 1 3 3 2 1 0.0 - 50.0 - 13.8
OTHER LOGISTIC SERVICES ... 1,059 972 1,074 1,203 1,160 1,153 28.6 - 0.7 + 1.7
INDIRECT EFFECTS ...................... 4,086 4,054 4,014 4,231 3,851 3,706 - - 3.8 - 1.9
MARITIME CLUSTER ................. 474 500 570 607 589 581 - - 1.2 + 4.2 NON-MARITIME CLUSTER ......... 3,612 3,554 3,444 3,623 3,262 3,124 - - 4.2 - 2.9
TOTAL EMPLOYMENT .................. 8,420 8,281 8,310 8,732 7,938 7,738 - - 2.5 - 1.7 Source: NBB (calculations based on the Belgian accounts filed with the Central Balance Sheet Office, and the Belgian IOTs). The data necessary to estimate the indirect effects are published by the NAI with a low frequency and after a certain time lag. The indirect effects for the period 2009-2014 are based on IOT 2010 and SUT 2010, 2011 and 2012. The calculated indirect effects are approximations and should be interpreted with caution.
TABLE 50 EMPLOYMENT TOP 10 AT THE PORT OF BRUSSELS IN 2014
Ranking Company name Sector _________________________ __________________________________________________________________________________ __________________________________________________________
1 SOLVAY Other logistic services 2 SCANIA BELGIUM Trade 3 CERES Food industry 4 BRUSSELS PORT AUTHORITY Port authority 5 INOVYN BELGIUM Trade 6 SITA WASTE SERVICES Other industries 7 INEOS SERVICES BELGIUM Other logistic services 8 PLASTIC OMNIUM ADVANCED INNOVATION AND RESEARCH Other logistic services 9 BRUXELLES ENERGIE Other industries 10 ZIEGLER Road transport
Source: NBB. The estimates for the multi-regional firms are based on surveys, annual reports and allocation formulas based on regional statistics. The top ten tables are based on information from annual accounts, surveys, annual reports and allocation formulas based on regional statistics. No individual figures are published as accurate data could not be obtained for all companies.

NBB WORKING PAPER No. 299 - JUNE 2016 51
TABLE 51 INVESTMENT AT THE PORT OF BRUSSELS FROM 2009 TO 2014 (in € million - current prices)
Sectors 2009 2010 2011 2012 2013 2014 Share in 2014
Change from 2013
to 2014
Annual average
change from 2009
to 2014 (in p.c.) (in p.c.) (in p.c.)
MARITIME CLUSTER .................. 17.8 19.1 13.9 13.4 24.4 7.6 14.4 - 68.6 - 15.5 Shipping agents and
forwarders ................................. 4.4 9.7 7.7 7.0 13.1 0.6 1.2 - 95.3 - 32.5
Cargo handling ......................... 0.1 0.5 0.9 1.1 0.5 1.6 3.0 + 200.0 + 76.2
Shipping companies ................. 0.0 0.0 0.0 0.8 0.0 0.0 0.0 n. n.
Shipbuilding and repair ............. 0.0 0.0 0.0 0.0 0.0 0.0 0.0 n. n.
Port construction and dredging 0.0 0.0 0.0 0.0 0.0 0.0 0.0 n. n.
Fishing and fish industry ........... 0.0 0.0 0.0 0.0 0.0 0.0 0.0 n. n.
Port trade .................................. 0.0 0.0 0.0 0.0 0.0 0.0 0.0 n. n.
Port authority ............................ 13.2 8.9 5.3 4.6 10.7 5.4 10.2 - 49.6 - 16.4
Public sector ............................. 0.0 0.0 0.0 0.0 0.0 0.0 0.0 n. n.
Allocation (p.m. ) ........................
NON-MARITIME CLUSTER ........ 49.1 47.6 38.4 38.4 44.1 45.3 85.6 + 2.8 - 1.6
TRADE .......................................... 22.3 16.4 9.6 9.7 14.3 12.6 23.8 - 11.9 - 10.7
INDUSTRY .................................... 10.5 19.9 8.5 9.6 7.0 11.6 22.0 + 66.7 + 2.1
Energy ....................................... 0.1 0.1 0.0 0.1 0.0 0.1 0.2 n. + 13.0
Fuel production ......................... 0.0 0.0 0.0 0.0 0.0 0.0 0.0 n. n.
Chemicals ................................. 0.8 0.4 0.5 0.2 0.0 1.7 3.2 n. + 17.0
Car manufacturing .................... 0.0 0.0 0.0 0.0 0.0 0.0 0.0 n. n.
Electronics ................................ 0.0 0.0 0.0 0.0 0.0 0.0 0.0 n. n.
Metalworking industry ............... 0.7 1.0 1.1 1.9 0.7 1.4 2.7 + 95.1 + 15.6
Construction .............................. 2.9 3.0 3.2 4.1 3.5 3.9 7.3 + 11.5 + 6.3
Food industry ............................ 4.2 10.8 2.4 1.2 1.8 1.3 2.5 - 27.1 - 20.8
Other industries ........................ 1.9 4.7 1.2 2.1 0.9 3.3 6.1 + 245.5 + 11.0
LAND TRANSPORT ..................... 3.2 1.6 4.6 2.2 2.4 3.5 6.7 + 47.4 + 1.7
Road transport .......................... 3.1 1.5 4.4 2.1 2.3 3.5 6.6 + 53.6 + 2.0
Other land transport ................... 0.1 0.0 0.1 0.1 0.1 0.0 0.1 - 65.8 - 14.8
OTHER LOGISTIC SERVICES .... 13.0 9.7 15.8 16.9 20.4 17.5 33.1 - 14.0 + 6.1
DIRECT INVESTMENT .................... 66.8 66.7 52.3 51.9 68.4 53.0 100.0 - 22.6 - 4.6
Source: NBB (calculations based on the Belgian accounts filed with the Central Balance Sheet Office and on surveys).
TABLE 52 INVESTMENT TOP 10 AT THE PORT OF BRUSSELS IN 2014
Ranking Company name Sector _________________________ __________________________________________________________________________________ __________________________________________________________
1 SOLVAY Other logistic services 2 BRUSSELS PORT AUTHORITY Port authority 3 HAVELANGE Trade 4 DIMO Other industries 5 GROND- EN AFBRAAKWERKEN G. EN A. DE MEUTER Construction 6 RUSSEL Other logistic services 7 SCANIA BELGIUM Trade 8 INOVYN ELECTROLYSIS SERVICES Chemicals 9 CLEANING COMPANY Road transport 10 J.F. TRANS Road transport
Source: NBB. The estimates for the multi-regional firms are based on surveys, annual reports and allocation formulas based on regional statistics. The top ten tables are based on information from annual accounts, surveys, annual reports and allocation formulas based on regional statistics. No individual figures are published as accurate data could not be obtained for all companies

52 NBB WORKING PAPER No. 299 - JUNE 2016
8 BRIEF SUMMARY
The traffic growth recorded in 2013 continued strongly in 2014 (+2.7 %). Those increases are due solely to developments in the port of Antwerp. In all other ports, traffic declined, though in Ghent and Zeebrugge the decrease was modest overall. Despite the declining traffic in the port of Ghent, that port together with the port of Antwerp represented the driving force behind the growth of value added (respectively +4.9 % and 1.4 %). In the port of Zeebrugge, the maritime cluster also saw an increase in value added, but in the overall figures that was negated by the departure of one industrial company from the electronics branch. In the port of Ostend, growth figures were generally positive except for trade. In recent years the ports of Liège and Brussels have suffered significant falls. Restructuring in certain industrial sectors (including the steel industry) is a factor here. In regard to indirect value added, the downward trend which had begun in 2010 was reversed (+2.2 %). In contrast to value added, direct employment in the Belgian ports declined by 1.5 %, maintaining the downward trend of recent years. Only the ports of Ghent and Ostend have managed to stabilise or improve their employment level since 2009.The steepest falls were recorded in Zeebrugge and Liège. In Zeebrugge that was due mainly to the departure of an industrial company from the electronics branch. In the maritime cluster, employment actually expanded. In Liège, as in the case of value added, employment pursued a predominantly downward trend in both clusters owing to the metalworking industry. Total indirect employment has displayed a downward trend since 2011. Although that fall can be attributed to developments in various branches, it is the metalworking industry that has had a particularly adverse impact on indirect employment. Taking all ports together, investment was up by more than 25 %, but that increase is particularly due to the evolution in the port of Antwerp. Owing to the highly volatile nature of investment expenditure, the figures need to be interpreted with caution.
CHART 17 CHANGE IN DIRECT VALUE ADDED CHART 18 CHANGE IN DIRECT EMPLOYMENT (in € million, by volume) (FTE)
Source: NBB (calculations based on the Belgian accounts filed with the Central Balance Sheet Office).
-2.500
-2.000
-1.500
-1.000
-500
0
500
1.000
1.500
2.000
2010 2011 2012 2013 2014
Antwerp Ghent OstendZeebrugge Liège BrusselsBelgian ports
-5.000
-4.000
-3.000
-2.000
-1.000
0
1.000
2.000
3.000
4.000
2010 2011 2012 2013 2014
Antwerp Ghent OstendZeebrugge Liège BrusselsBelgian ports
NBB WORKING PAPER No. 299 - JUNE 2016 53
LIST OF ABBREVIATIONS
BNRC Belgian National Railway Company
EU European Union
FTE Full-time equivalent
GDP Gross domestic product
IOT Input-Output Table
NAI National Accounts Institute
NBB National Bank of Belgium
SMEs Small and medium-sized enterprises
SUT Supply and Use Table
TEU Twenty-foot Equivalent Unit
CONVENTIONAL SIGNS
n. the datum does not exist, is not available or is meaningless
p.c. per cent
p.m. pro memoria

54 NBB WORKING PAPER No. 299 - JUNE 2016
ANNEX 1: LIST OF NACE-BEL BRANCHES 47
TABLE 53 LIST OF NACE-BEL BRANCHES (NACE-BEL 2008)
SUT NACE-BEL Cluster Sector AN GN OO ZB LG BR Definition
03A 03110 MA VI * * * * * * Marine fishing 08A 08121 IN AI * * * Quarrying of gravel 08A 08122 IN AI * * Quarrying of sand 08A 08910 IN AI * Mining of chemical and fertiliser minerals 08A 08990 IN AI * Other mining and quarrying n.e.c. 10A 10130 IN VO * Production of meat and poultry meat products 10B 10200 MA VI * * Processing and preserving of fish, crustaceans and molluscs 10C 10320 IN VO * Manufacture of fruit and vegetable juice 10D 10410 IN VO * * Manufacture of oils and fats 10E 10510 IN VO * * * * * * Operation of dairies and cheese making 10F 10610 IN VO * * Manufacture of grain mill products 10H 10810 IN VO * Manufacture of sugar 10H 10820 IN VO * * * * Manufacture of cocoa, chocolate and sugar confectionery 10I 10890 IN VO * * Manufacture of other food products n.e.c. 10J 10910 IN VO * * * Manufacture of prepared feeds for farm animals 11A 11010 IN VO * Distilling, rectifying and blending of spirits 11A 11060 IN VO * Manufacture of malt 13A 13100 IN AI * * Preparation and spinning of textile fibres 13B 13929 IN AI * * Manufacture of other textiles, except wearing apparel 16A 16100 IN AI * * * * Sawmilling and planing of wood 16A 16230 IN AI * * * * Manufacture of other builders' carpentry and joinery 16A 16240 IN AI * * * * * * Manufacture of wooden containers 17A 17120 IN AI * Manufacture of paper and paperboard 17A 17210 IN AI * * Manufacture of corrugated paper and paperboard and of containers
of paper and paperboard 17A 17290 IN AI * Manufacture of other articles of paper and paperboard 18A 18120 IN AI * * * * Other printing 18A 18130 IN AI * Pre-press and pre-media services 19A 19200 IN PE * * * * * * Manufacture of refined petroleum products 20A 20110 IN CH * * * Manufacture of industrial gases 20A 20120 IN CH * * Manufacture of dyes and pigments 20B 20130 IN CH * * * * * Manufacture of other inorganic basic chemicals 20A 20140 IN CH * * * * * * Manufacture of other organic basic chemicals 20A 20150 IN CH * * * * Manufacture of fertilisers and nitrogen compounds 20A 20160 IN CH * * Manufacture of plastics in primary forms 20A 20170 IN CH * Manufacture of synthetic rubber in primary forms 20C 20200 IN CH * * * Manufacture of pesticides and other agrochemical products 20D 20300 IN CH * * * * Manufacture of paints, varnishes and similar coatings, printing ink
and mastics 20F 20520 IN CH * Manufacture of glues 20F 20590 IN CH * * * Manufacture of other chemical products n.e.c. 21A 21201 IN CH * Manufacture of medicines 22A 22110 IN CH * Manufacture of rubber tyres and tubes; retreating and rebuilding of
rubber tyres 22A 22190 IN CH * * Manufacture of other rubber products 22B 22210 IN CH * * * * Manufacture of plastic plates, sheets, tubes and profiles 22B 22220 IN CH * * * Manufacture of plastic packing goods 22B 22290 IN CH * * * * Manufacture of other plastic products 23A 23110 IN CS * Manufacture of flat glass 23A 23120 IN CS * * * Shaping and processing of flat glass 23B 23322 IN CS * Manufacture of tiles and construction products, in baked clay 23C 23510 IN CS * * * * * * Manufacture of cement 23C 23520 IN CS * Manufacture of lime and plaster 23D 23610 IN CS * * * Manufacture of concrete products for construction purposes 23D 23620 IN CS * Manufacture of plaster products for construction purposes 23D 23630 IN CS * * * * * * Manufacture of ready-mixed concrete
47 The nomenclature in this list is in accordance with the NACE-BEL revision having taken place in 2008 (Rev.2).

NBB WORKING PAPER No. 299 - JUNE 2016 55
TABLE 53 (continued) LIST OF NACE-BEL BRANCHES (NACE-BEL 2008)
SUT NACE-BEL Cluster Sector AN GN OO ZB LG BR Definition
23D 23640 IN CS * Manufacture of mortars 23D 23700 IN CS * * Cutting, shaping and finishing of stone 23D 23990 IN CS * * * * Manufacture of other non-metallic mineral products n.e.c. 24A 24100 IN ME * * * * * * Manufacture of basic iron and steel and of ferro-alloys 24A 24200 IN ME * Manufacture of tubes, pipes, hollow profiles and related fittings, of
steel 24B 24310 IN ME * Cold drawing of bars 24B 24510 IN ME * * Casting of iron 25A 25110 IN ME * * * * Manufacture of metal structures and parts of structure 25A 25120 IN ME * * * * Manufacture of doors and windows of metal 25A 25290 IN ME * * * * * Manufacture of other tanks, reservoirs and containers of metal 25A 25300 IN ME * * * Manufacture of steam generators, except central heating hot water
boilers 25A 25501 IN ME * * * Forging of metal 25B 25610 IN ME * * * * * Treatment and coating of metals 25B 25620 IN ME * * * * * Machining 25C 25930 IN ME * Manufacture of wire products, chain and springs 25C 25940 IN ME * * Manufacture of fasteners and screw machine products 25C 25999 IN ME * * * * Manufacture of other fabricated metal articles 26A 26110 IN MP * * Manufacture of electronic valves and tubes and other electronic
components 26B 26400 IN MP * * * Manufacture of consumer electronics 26C 26510 IN MP * * Manufacture of instruments and appliances for measuring, testing
and navigation 27A 27110 IN MP * * * * * * Manufacture of electric motors, generators and transformers 27A 27120 IN MP * * Manufacture of electricity distribution and control apparatus 27B 27900 IN MP * * Manufacture of other electrical equipment 28A 28110 IN ME * Manufacture of engines and turbines, except aircraft, vehicle and
cycle engines 28A 28120 IN ME * * Manufacture of fluid power equipment 28A 28220 IN ME * Manufacture of lifting and handling equipment 28A 28250 IN ME * * * * Manufacture of non-domestic cooling and ventilation equipment 28A 28295 IN ME * Manufacture of filter equipment 28A 28299 IN ME * Manufacture of other general-purpose machinery n.e.c. 29A 29100 IN AU * * * * * * Manufacture of motor vehicles 29B 29201 IN AU * * Manufacture of bodies (coachwork) for motor vehicles 29B 29202 IN AU * * Manufacture of trailers and semi-trailers and caravans 29B 29320 IN AU * * * Manufacture of other parts and accessories for motor vehicles 30A 30110 MA SB * * * Building of ships and floating structures 30B 30200 IN AI * Manufacture of railway locomotives and rolling stock 32B 32990 IN AI * Other manufacturing n.e.c. 33A 33110 IN ME * * * Repair of fabricated metal products 33A 33120 IN ME * * * * * Repair of machinery 33A 33150 MA SB * * * * * * Repair and maintenance of ships and boats 33A 33170 IN ME * * Repair and maintenance of other transport equipment 35A 35110 IN EN * * * * * * Production of electricity 35B 35220 IN EN * Distribution of gaseous fuels through mains 37A 37000 IN AI * * * * Sewerage 38A 38110 IN AI * * * * * Collection of non-hazardous waste 38A 38219 IN AI * * * * * * Other processing and disposal of non-hazardous waste 38B 38310 IN AI * * * * Dismantling of wrecks 38B 38321 IN AI * * Sorting of non-hazardous waste for recycling 38B 38322 IN AI * * * * * * Recovery of waste metal 38B 38323 IN AI * * * * * Recovery of inert waste 39A 39000 IN AI * * Remediation activities and other waste management services 41A 41102 IN CS * * * * * * Non-residential development projects 41A 41203 IN CS * * * * * * Construction of other non-residential buildings 42A 42110 IN CS * * * * * * Construction of roads and motorways 42A 42130 IN CS * Construction of bridges and tunnels 42A 42211 IN CS * Construction of water and gas supply networks 42A 42219 IN CS * Civil engineering works relating to fluids n.e.c. 42A 42220 IN CS * * Construction of utility projects for electricity and telecommunications

56 NBB WORKING PAPER No. 299 - JUNE 2016
TABLE 53 (continued) LIST OF NACE-BEL BRANCHES (NACE-BEL 2008)
SUT NACE-BEL Cluster Sector AN GN OO ZB LG BR Definition
42A 42911 MA DR * * * Dredging 42A 42919 MA DR * * * * * * Construction of water projects, except dredging 43A 43110 IN CS * * * * * * Demolition 43A 43120 IN CS * * * * * Site preparation 43B 43211 IN CS * * * * * * Electrical engineering installations in buildings 43B 43221 IN CS * * * * Plumbing 43B 43222 IN CS * * * * * Heat and air conditioning installation 43B 43291 IN CS * Insulation work activities 43C 43320 IN CS * * * * * Joinery installation 43C 43341 IN CS * * * * * * Painting of buildings 43D 43910 IN CS * * * * * * Roofing activities 43D 43999 IN CS * * * * * Other specialised construction activities 45A 45111 CO CO * * * * * * Wholesale of cars and light motor vehicles 45A 45191 CO CO * * * * Wholesale of other motor vehicles (> 3,5 ton) 45A 45193 CO CO * Retail sale of other motor vehicles (> 3,5 ton) 45A 45202 CO CO * * * * Maintenance and general repair of motor vehicles 45A 45205 CO CO * * * * Tyre specialists 45A 45310 CO CO * * * * * * Wholesale trade and intermediary of motor vehicle parts and
accessories 46A 46120 CO CO * * * Agents involved in the sale of fuels, ores, metals and industrial
chemicals 46A 46140 CO CO * * * Agents involved in the sale of machinery, industrial equipment,
ships and aircraft 46A 46170 CO CO * * * Agents involved in the sale of food, beverages and tobacco 46A 46180 CO CO * * * * Agents specialised in the sale of other particular products 46A 46190 CO CO * * * * * Agents involved in the sale of a variety of goods 46A 46216 CO CO * * * * * Wholesale of animal feeds and agricultural raw materials 46A 46319 CO CO * * * Wholesale of fruit and vegetables, except potatoes 46A 46332 CO CO * * Wholesale of edible oils and fats 46A 46349 CO CO * * * * * Wholesale of alcoholic and other beverages, general assortment 46A 46381 CO CO * * * * * Wholesale of fish, crustaceans and molluscs 46A 46389 CO CO * * * * * Wholesale of other food n.e.c. 46A 46391 CO CO * * * Non-specialised wholesale of frozen food 46A 46392 CO CO * * * * Non-specialised wholesale of non-frozen food, beverages and
tobacco 46A 46412 CO CO * * * * Wholesale trade in household textiles and bedding 46A 46423 CO CO * * * * * Wholesale trade in clothing other than work clothes and underwear 46A 46431 CO CO * * * * * Wholesale trade in domestic electrical appliances and audio and
video equipment 46A 46442 CO CO * * * * * Wholesale of cleaning materials 46A 46460 CO CO * * * Wholesale of pharmaceutical goods 46A 46499 CO CO * * * * * * Wholesale of other household goods n.e.c. 46A 46510 CO CO * * * * Wholesale of computers, computer peripheral equipment and
software 46A 46620 CO CO * * * * * Wholesale of machine tools 46A 46630 CO CO * * * * Wholesale of mining, construction and civil engineering machinery 46A 46693 CO CO * * * * * * Wholesale trade in electrical equipment, including installation
materials 46A 46694 CO CO * * Wholesale trade in lifting and transport equipment 46A 46695 CO CO * * Wholesale trade in pumps and compressors 46A 46699 CO CO * * * * * * Wholesale of other machinery and equipment n.e.c 46B 46710 CO CO * * * * * * Wholesale of solid, liquid and gaseaous fuels and related products 46A 46720 CO CO * * * * * Wholesale of metals and metal ores 46A 46731 CO CO * * * * * Wholesale of construction materials, general assortment 46A 46732 CO CO * * * * * * Wholesale of wood 46A 46733 CO CO * * * Wholesale trade in wallpapers, paints and household textiles 46A 46741 CO CO * * * * Wholesale of hardware 46A 46751 CO CO * * * * * * Wholesale of industrial chemical products 46A 46769 CO CO * * * * * Wholesale trade in other intermediate products n.e.c. 46A 46772 CO CO * * * * Wholesale trade in iron and steel scrap and non-ferrous scrap
metals 46A 46900 MA CP * * * * * * Non-specialised wholesale trade 47A 47230 CO CO * * * Retail sale of fish, crustaceans and molluscs in specialised stores

NBB WORKING PAPER No. 299 - JUNE 2016 57
TABLE 53 (continued) LIST OF NACE-BEL BRANCHES (NACE-BEL 2008)
SUT NACE-BEL Cluster Sector AN GN OO ZB LG BR Definition
47B 47300 CO CO * * * * * * Retail sale of automotive fuel in specialised stores 47A 47410 CO CO * * * * * Retail sale of computers, peripheral units and software in
specialised stores 47A 47521 CO CO * * * * Specialist retail trade in building materials and DIY supplies, general
range 47A 47781 CO CO * * * Specialist retail trade in fuels other than road fuel 49A 49200 TR TP * * * * * * Freight rail transport 49C 49410 TR WE * * * * * * Freight transport by road, except removal 49C 49420 TR WE * * * Removal services 49C 49500 TR WE * * Transport via pipelines 50A 50200 MA RE * * * * * * Sea and coastal freight water transport 50B 50400 MA RE * * * * * * Inland freight water transport 52A 52100 MA GO * * * * * * Warehousing and storage, including refrigerating 52A 52210 LO AD * * Service activities incidental to land transportation 52A 52220 MA GO * * * * * * Service activities incidental to water transportation 52A 52241 MA GO * * * * * * Cargo handling in sea ports 52A 52249 MA GO * * * * * * Cargo handling except sea ports 52A 52290 MA SE * * * * * * Other transportation support activities 53A 53200 TR WE * * * Other postal and courier activities 62A 62010 LO AD * * * * * Computer programming activities 66A 66210 LO AD * * * Risk and damage evaluation 66A 66220 LO AD * * * * * * Activities of insurance agents and brokers 66A 66290 LO AD * * Other activities auxiliary to insurance and pension funding 68B 68203 LO AD * * * * * * Renting and operating of own or leased non residential real estate,
except lands 68A 68321 LO AD * * * * * Management of residential real estate on a fee or contract basis 68A 68322 LO AD * * * * * Management of non-residential real estate on a fee or contract
basis 69A 69201 LO AD * * * Accountants and fiscal advisors 70A 70100 LO AD * * * * * * Activities of head offices 70A 70220 LO AD * * * * * * Business and other management consultancy activities 71A 71121 LO AD * * * * * * Engineering activities and related technical consultancy, except
surveyor 71A 71209 LO AD * * * Other technical testing and analysis 72A 72190 LO AD * * * * Other research and experimental development on natural sciences
and engineering 73A 73110 LO AD * * * * * Advertising agencies 77A 77120 LO AD * * * * * Renting and leasing of trucks 77C 77320 LO AD * * * * Renting and leasing of construction and civil engineering machinery
and equipment 77C 77340 LO AD * Renting and leasing of water transport equipment 77C 77399 LO AD * * * * Renting and leasing of other machinery, equipment and tangible
goods 80A 80100 LO AD * * * * * Private security activities 81A 81100 LO AD * * * Combined facilities support activities 81B 81220 LO AD * * * * * * Other building and industrial cleaning activities 81B 81290 LO AD * * * * Other cleaning activities 82A 82110 LO AD * * * * Combined office administrative service activities 82A 82920 LO AD * * * * Packaging activities 82A 82990 LO AD * * * * * * Other business support service activities n.e.c. 84B 84220 MA PU * * Defence activities
Source:NBB.
The asterisks denote the presence of the activity branches in the ports for at least one year over the period 2009 - 2014. For instance the branch 52241 (Cargo handling in sea ports) is or was present in the six ports, at the same time or at least one year in each of these ports between 2009 and 2014, while the branch 30110 (Building of ships and floating structures) was only present in Antwerp, Ghent and Liège.

58 NBB WORKING PAPER No. 299 - JUNE 2016
Legend:
Port code Port Port code Port AN Port of Antwerp ZB Port of Zeebrugge
GN Port of Ghent LG Liège port complex
OO Port of Ostend BR Port of Brussels
Cluster code Cluster definition Sector code Sector definition ___ _ MA Maritime SE Shipping agents and forwarders GO Cargo handling RE Shipping companies SB Shipbuilding and repair DR Port construction and dredging VI Fishing and fish industry CP Port trade HB Port authority PU Public sector CO Trade CO Trade IN Industrie EN Energy PE Fuel production CH Chemicals AU Car manufacturing MP Electronics ME Metalworking industry CS Construction VO Food industry AI Other industries TP Land transport WE Road transport TP Other land transport LO Other logistic services AD Other services

NBB WORKING PAPER No. 299 - JUNE 2016 59
ANNEX 2: DEFINITION OF THE FINANCIAL RATIOS
RATIO ITEMS USED IN THE ANNUAL ACCOUNTS
RETURN ON EQUITY AFTER TAX
Numerator (N) ...................................................................................................................9904
Denominator (D) ................................................................................................................10/15
Ratio = N / D * 100
Conditions for calculating the ratio :12-month financial year and item 10/15 > 0
LIQUIDITY IN THE BROAD SENSE
Numerator (N) ...................................................................................................................3+40/41+50/53+54/58+490/1
Denominator (D) ................................................................................................................42/48+492/3
Ratio = N / D
Conditions for calculating the ratio: none
SOLVENCY
Numerator (N) ...................................................................................................................10/15
Denominator (D) ................................................................................................................10/49
Ratio = N / D * 100
Conditions for calculating the ratio: none

60 NBB WORKING PAPER No. 299 - JUNE 2016
BIBLIOGRAPHY
AG Haven Oostende (2015), Jaarverslag 2014, Ostend.
Bremerhaven, Hafenspiegel Für Die Bremischen Häfen 2014, Bremenports GmbH & Co. KG Bremen, June 2015.
Coppens F., Verduyn F. (2009), Analysis of business demography using markov chains: an application to Belgian data, NBB, Working Paper n°170 (Research series), Brussels.
De Tijd, newspaper articles between 2014 and 2016, Brussels.
Duisport, Annual Report 2014 of the duisport Group, Duisburger Hafen AG, Duisburg, Germany.
Dunkerque Port, Rapport d’activité 2014, June 2015, Dunkerque, France.
Gemeentelijk Havenbedrijf Antwerpen (2015), Annual report 2014, Antwerp.
Gemeentelijk Havenbedrijf Antwerpen (2015), Yearbook of Statistics 2014, Antwerp.
Flows, articles between 2014 and 2016, Antwerp.
Haropa (2015), Rapport d'activité 2014 Port de Paris, Rouen, France.
Havenbedrijf Gent (2015), Annual report 2014, Ghent.
Heuse P., (2016), 2014 social balance sheet, NBB, Economic Review, June 2016, Brussels.
International Monetary Fund (2015), World Economic Outlook (October 2015), IMF, Washington DC (USA).
Lagneaux F. (2006), Economic importance of the Belgian ports: Flemish maritime ports and Liège port complex - Report 2004, NBB, Working Paper n°86 (Document series), Brussels.
Maatschappij Linkerscheldoever (2015), Jaarverslag 2014, Beveren.
Merckx J.-P., D. Neyts, Vlaamse Havencommissie (2015), De Vlaamse havens - Feiten, statistieken en indicatoren voor 2014, Brussels.
National Accounts Institute, Tableaux Entrées-Sorties 2010, Federal Planning Bureau, December 2015, Brussels.
National Accounts Institute, National accounts. Supply and use tables 2010, Brussels.
National Accounts Institute, National accounts. Supply and use tables 2011 Brussels.
National Accounts Institute, National accounts. Supply and use tables 2012, Brussels.
National Accounts Institute (2016), Comptes régionaux 2014, Brussels.
National Accounts Institute (2015), Comptes nationaux. Comptes détaillés et tableaux 2014, Brussels.
NBB (2016), Annual Report 2015 - Economic and financial developments, NBB, Brussels.
NBB, Central Balance Sheet Office, Annual accounts submitted to the Central Balance Sheet Office, from 2009 to 2015, Brussels.
NBB, General Statistics Department, M.Stat - Online Database, Brussels.
Port of Amsterdam (2015), Jaarverslag 2014, Haven Amsterdam, Netherlands.
Port of Brussels (2015), Jaarverslag 2014, Brussels.
Port of Hamburg, www.hafen-hamburg.de, Statistics, Hamburg, Germany.
Havenbedrijf Rotterdam (2015), Jaarverslag 2014, The Port of Rotterdam Authority, Netherlands.
Port of Zeebrugge (2015), Jaarverslag 2014, Zeebrugge.
Rubbrecht I., Vivet D. (2015), Results and financial situation of firms in 2014, NBB, Economic Review, December 2015, Brussels.
United Nations Conference on Trade and Development (2015), Review of Maritime Transport 2015, UNCTAD New York and Geneva.

NBB WORKING PAPER No. 299 - JUNE 2016 61
Vivet D. (2011), Development of a financial health indicator based on companies’ annual accounts , NBB, Working Paper n°213 (Document series), Brussels.
Zeeland Seaports (2015), Jaarbericht 2014, Terneuzen, Netherlands.

62 NBB WORKING PAPER No. 299 - JUNE 2016
NATIONAL BANK OF BELGIUM - WORKING PAPERS SERIES
The Working Papers are available on the website of the Bank: http://www.nbb.be. 251. “Why firms avoid cutting wages: Survey evidence from European firms”, by P. Du Caju, T. Kosma,
M. Lawless, J. Messina and T. Rõõm, Research series, December 2013. 252. “The distribution of debt across euro area countries: The role of individual characteristics,
institutions and credit conditions”, by O. Bover, J. M. Casado, S. Costa, Ph. Du Caju, Y. McCarthy, E. Sierminska, P. Tzamourani, E. Villanueva and T. Zavadil, Research series, December 2013.
253. “Micro-based evidence of EU competitiveness: The CompNet database”, by CompNet Task Force, Research series, March 2013.
254. “Information in the yield curve: A macro-finance approach”, by H. Dewachter, L. Iania and M. Lyrio, Research series, March 2013.
255. “The Single supervisory mechanism or ‘SSM’, part one of the Banking Union”, by E. Wymeersch, Research series, April 2013.
256. “Nowcasting Belgium”, by D. de Antonio Liedo, Research series, April 2013. 257. “Human capital, firm capabilities and productivity growth”, by I. Van Beveren and S. Vanormelingen,
Research series, May 2014. 258. “Monetary and macroprudential policies in an estimated model with financial intermediation”, by P.
Gelain and P. Ilbas, Research series, May 2014. 259. “A macro-financial analysis of the euro area sovereign bond market”, by H. Dewachter, L. Iania, M.
Lyrio and M. de Sola Perea, Research series, June 2014. 260. "Economic importance of the Belgian ports: Flemish maritime ports, Liège port complex and the
port of Brussels - Report 2012", by C. Mathys, Document series, June 2014. 261. “European competitiveness: A semi-parametric stochastic metafrontier analysis at the firm level”, by
M. Dumont, B. Merlevede, G. Rayp and M. Verschelde, Document series, July 2014. 262. “Employment, hours and optimal monetary policy”, by M. Dossche, V. Lewis and C. Poilly,
Research series, September 2014. 263. “On the conjugacy of off-line and on-line Sequential Monte Carlo Samplers”, by A. Dufays,
Research series, September 2014. 264. “The effects of state aid on Total Factor Productivity growth”, by P. Van Cayseele, J. Konings and I.
Sergant, Research series, October 2014. 265. “Assessing the role of ageing, feminising and better-educated workforces on TFP growth”, by A.
Ariu and V. Vandenberghe, Research series, October 2014. 266. “A constrained nonparametric regression analysis of factor-biased technical change and TFP
growth at the firm level”, by M. Verschelde, M. Dumont, B. Merlevede and G. Rayp, Research series, October 2014.
267. “Market imperfections, skills and total factor productivity: Firm-level evidence on Belgium and the Netherlands”, by S. Dobbelaere and M. Vancauteren, Research series, October 2014.
268. “Import competition, productivity and multi-product firms”, by E. Dhyne, A. Petrin, V. Smeets and F. Warzynski, Research series, October 2014.
269. “International competition and firm performance: Evidence from Belgium”, by J. De Loecker, C. Fuss and J. Van Biesebroeck, Research series, October 2014.
270. “Acquisitions, productivity, and profitability: Evidence from the Japanese cotton spinning industry”, by S. Braguinsky, A. Ohyama, T. Okazaki and C. Syverson, Research series, October 2014.
271. “Total factor productivity: Lessons from the past and directions for the future”, by B. van Ark, Research series, October 2014.
272. “Outward Foreign Direct Investment and domestic performance: In search of a causal link”, by E. Dhyne and S. S. Guerin, Research series, October 2014.
273. “Economic importance of air transport and airport activities in Belgium - Report 2012”, by F. Van Nieuwenhove, Document series, November 2014.
274. “Fiscal policy and TFP in the OECD: Measuring direct and indirect effects”, by G. Everaert F. Heylen and R. Schoonackers, Research series, November 2014.
275. “Effectiveness and transmission of the ECB's balance sheet policies”, by J. Boeckx, M. Dossche and G. Peersman, Research series, December 2014.
276. “How do exporters react to changes in cost competitiveness?”, by S. Decramer, C. Fuss and J. Konings, Research series, January 2015.
277. “Optimal monetary policy response to endogenous oil price fluctuations”, by A. Stevens, Research series, January 2015.
278. “Comparing fiscal multipliers across models and countries in Europe”, by J. Kilponen, M. Pisani, S. Schmidt, V. Corbo, T. Hledik, J. Hollmayr, S. Hurtado, P. Júlio, D. Kulikov, M. Lemoine, M. Lozej, H.

NBB WORKING PAPER No. 299 - JUNE 2016 63
Lundvall, J. R. Maria, B. Micallef, D. Papageorgiou, J. Rysanek, D. Sideris, C. Thomas and G. de Walque, Research series, March 2015.
279. “Assessing European competitiveness: The new CompNet micro-based database”, by P. Lopez-Garcia, F. di Mauro and the CompNet Task Force, Research series, April 2015.
280. “FloGARCH: Realizing long memory and asymmetries in returns volatility”, by H. Vander Elst, Research series, April 2015.
281. “Does education raise productivity and wages equally? The moderating roles of age, gender and industry”, by F. Rycx, Y. Saks and I. Tojerow, Research series, April 2015.
282. “Assessing European firms’ exports and productivity distributions: The CompNet trade module”, by A. Berthou, E. Dhyne, M. Bugamelli, A.-M. Cazacu, C.-V. Demian, P. Harasztosi, T. Lalinsky, J. Merikül, F. Oropallo and A. C. Soares, Research series, May 2015.
283. “Economic importance of the Belgian ports: Flemish maritime ports, Liège port complex and the port of Brussels - Report 2013”, by F. Van Nieuwenhove, Document series, June 2015.
284. “Crisis-proof services: Why trade in services did not suffer during the 2008-2009 collapse”, by A. Ariu, Research series, July 2015.
285. “The labour market position of second-generation immigrants in Belgium”, by V. Corluy, J. Haemels, I. Marx and G. Verbist, Research series, September 2015.
286. “The implications of household size and children for life-cycle saving”, by B. Capéau and B. De Rock, Research series, September 2015.
287. “Monetary policy effects on bank risk taking”, by A. Abbate and D. Thaler, Research series, September 2015.
288. “The Belgian production network 2002-2012”, by E. Dhyne, G. Magerman and S. Rubínová, Research series, October 2015.
289. “Portfolio choice and investor preferences: A semi-parametric approach based on risk horizon”, by G. Hübner and T. Lejeune, Research series, October 2015.
290. “Predicting Belgium’s GDP using targeted bridge models”, by Ch. Piette, Research series, January 2016.
291. “Did export promotion help firms weather the crisis?”, by J. Van Biesebroeck, J. Konings and C. Volpe Martincus, Research series, January 2016.
292. “On the role of public policies and wage formation for business investment in R&D: A long-run panel analysis”, by T. Buyse, F. Heylen and R. Schoonackers, Research series, January 2016.
293. “Unraveling firms: Demand, productivity and markups heterogeneity”, by E. Forlani, R. Martin, G. Mion and M. Muûls, Research series, February 2016.
294. “Unemployment risk and over-indebtedness: A micro-econometric perspective”, by Ph. Du Caju, F. Rycx and I. Tojerow, Research series, February 2016.
295. “International shocks and domestic prices: How large are strategic complementarities?”, by A. Amiti, O. Itskhoki and J. Konings, Research series, March 2016.
296. “The supplier network of exporters: Connecting the dots”, by E. Dhyne and S. Rubínová, Research series, May 2016
297. “Does one size fit all at all times? The role of country specificities and state dependencies in predicting banking crises” by S. Ferrari and M. Pirovano, Research series, May 2016
298. “Competition and product mix adjustment of multi-product exporters: Evidence from Belgium”, by K. Breemersch, Research series, June 2016.
299. “Economic importance of the Belgian ports: Flemish maritime ports, Liège port complex and the port of Brussels - Report 2014”, by G. van Gastel, Document series, June 2016.

© Illustrations : National Bank of Belgium
Layout : Analysis and Research Group Cover : NBB AG – Prepress & Image
Published in June 2016
Editor
Jan SmetsGovernor of the National Bank of Belgium
National Bank of Belgium Limited liability company RLP Brussels – Company’s number : 0203.201.340 Registered office : boulevard de Berlaimont 14 – BE -1000 Brussels www.nbb.be


