Observation or Submarine Volcanic Activities at the Kaitoku Seamount and the Hukutoku-Oka-no-Ba Seamount by the Airborne Thermal IDrrared Radiometer Masakazu Tsuchide and Hirokazu Sato Hydrographic Department, Maritime Safety Agency, Japan Commission VII 1. Introduction The Izu-Ogasawara Ridge is an island arc along the Izu-Ogasawara Trench where Pacific Plate subducts beneath the Philippine Sea Plate. Many active volcanic islands and submarine volcanoes exist in a line on the Izu-Ogasawara Ridge, and form a typical volcanic front. New volcanoes have been discovered on the front caused by volcanic activities at points where volcanic activity was not reported since the dawn of history. Recently, new volcanic eruption was recognized at the sea bottom 400 meters east from the south pOint of Nisi-no-Sima (27°15'N, 140 0 53'E) ,west ward of the Ogasawara Islands, in May, 1973 since the dawn of history. This eruption formed a new island called "Nisinosima-Sin To" in September, 1973. .. Hatizyo Sima • Aoga Sima Beyonesu ,x Myozin Syo Retugan Sumisu Sima • Tori Sima . Sohu Gan . Nisi-no-Sima • Titi Sima * to HahaSima Kaitoku Seamount . Kita-Jo Sima .. 10 Sima Minami-Io Sim;r* Hukutoku-Oka-no-Ba I 35°N Moreover a new submarine volcanic activity was broken out at x Minami-Hfyosi Seamount the Minami-Hiyosi Seamount (23°35.3'N, 141°54.3'E) which situated between Minami-Io Sima and Uracas Island in August, 1975. This activity flew out discolored water till March, 1978. In addition, discolored water was reported at the Nikko Seamount (23°04.5'N, 142°18.5'E) in July, 1979, and outflow of pumice caused by submarine eruption was found at the Hukuzin Seamount (21°56.0'N, 143°28.0'E) in August, 1951. The eruptions of the Hukuzin Seamount have often occurred since then. Figure 1 shows the distribution Syoto. x Nikko Seamount I x Hukuzin Seamount x submarine volcano I • UracasI. 2 eN 140· E 145 0 E . 100km 0 I" II! 500 I Figure 1. Distribution Volcanoes in Syoto 1000km of Active the Nanpo of active volcanoes in the Nanpo 629
Transcript
Observation or Submarine Volcanic Activities at
the Kaitoku Seamount and the Hukutoku-Oka-no-Ba Seamount by
the Airborne Thermal IDrrared Radiometer
Masakazu Tsuchide and Hirokazu Sato Hydrographic Department, Maritime Safety Agency, Japan Commission VII
1. Introduction
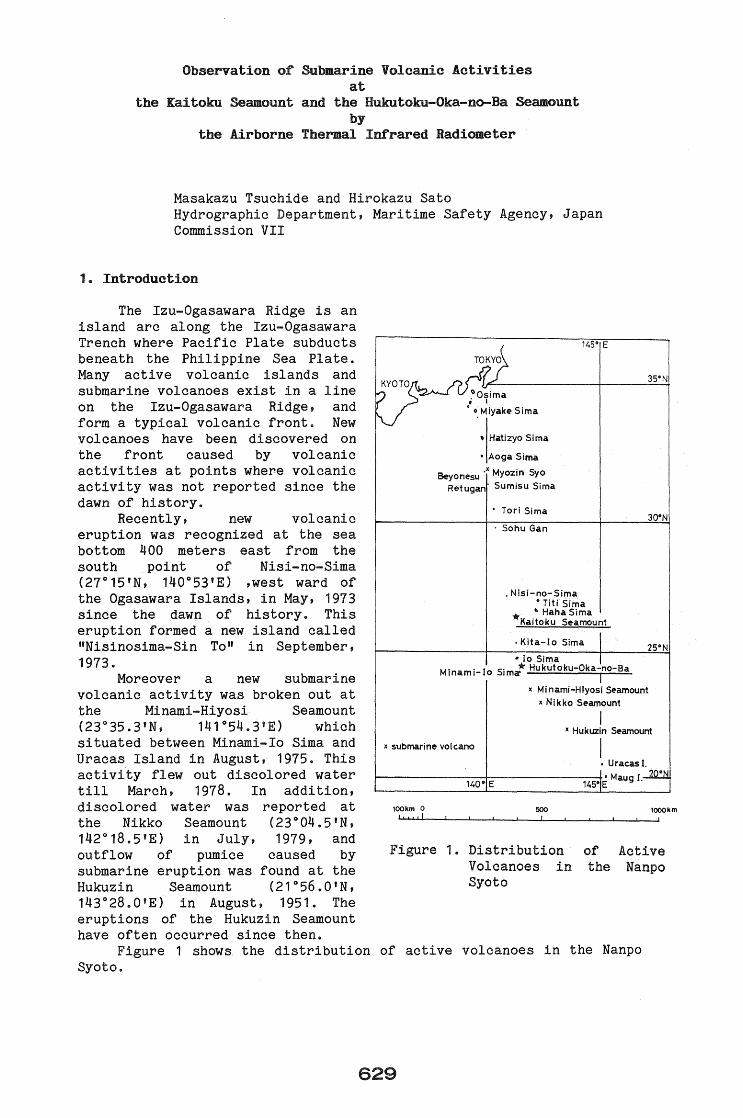
The Izu-Ogasawara Ridge is an island arc along the Izu-Ogasawara Trench where Pacific Plate subducts beneath the Philippine Sea Plate. Many active volcanic islands and submarine volcanoes exist in a line on the Izu-Ogasawara Ridge, and form a typical volcanic front. New volcanoes have been discovered on the front caused by volcanic activities at points where volcanic activity was not reported since the dawn of history.
Recently, new volcanic eruption was recognized at the sea bottom 400 meters east from the south pOint of Nisi-no-Sima (27°15'N, 140 0 53'E) ,west ward of the Ogasawara Islands, in May, 1973 since the dawn of history. This eruption formed a new island called "Nisinosima-Sin To" in September, 1973.
.. Hatizyo Sima
• Aoga Sima
Beyonesu ,x Myozin Syo
Retugan Sumisu Sima
• Tori Sima
. Sohu Gan
. Nisi-no-Sima • Titi Sima
* to HahaSima Kaitoku Seamount
. Kita-Jo Sima
.. 10 Sima Minami-Io Sim;r* Hukutoku-Oka-no-Ba
I
35°N
Moreover a new submarine volcanic activity was broken out at x Minami-Hfyosi Seamount
the Minami-Hiyosi Seamount (23°35.3'N, 141°54.3'E) which situated between Minami-Io Sima and Uracas Island in August, 1975. This activity flew out discolored water till March, 1978. In addition, discolored water was reported at the Nikko Seamount (23°04.5'N, 142°18.5'E) in July, 1979, and outflow of pumice caused by submarine eruption was found at the Hukuzin Seamount (21°56.0'N, 143°28.0'E) in August, 1951. The eruptions of the Hukuzin Seamount have often occurred since then.
Figure 1 shows the distribution Syoto.
x Nikko Seamount
I x Hukuzin Seamount
x submarine volcano I • UracasI.
~------------+--------------4'MaugI 2 eN 140· E 1450 E .
100km 0 I" II!
500 I
Figure 1. Distribution Volcanoes in Syoto
1000km
of Active the Nanpo
of active volcanoes in the Nanpo
629
2.. Kai toku Seamount
(1) The Progress of the eruption Submarine eruption occurred at
26°07.3'N, 141 °06.1 fE, 75 kIn north of the Kita-Io Sima. As this area is a good fishing ground, many fishing boats of our country work at this ground. A fishing boat named Kai toku-Maru (85 tons) discovered the shoal at 26°08.8'N, 141°06.6'E in April, 1927 and at 26°03.1'N, 140 0 56.0'E in June, 1927. Two shoals have been called the Higasi-Kaitoku-Ba and Nisi-Kaitoku-Ba, respectively.
This area has no reliable report of eruption, except one eruption report at 26°00'N, 140 0 46'E in 1543. Consequently the Nisi-Kaitoku-Ba is supposed a submarine volcano. Accordingly, the eruption of this time at the Higasi-Kaitoku-Ba is the first confirmation of submarine volcanic activity since the dawn of history at this area.
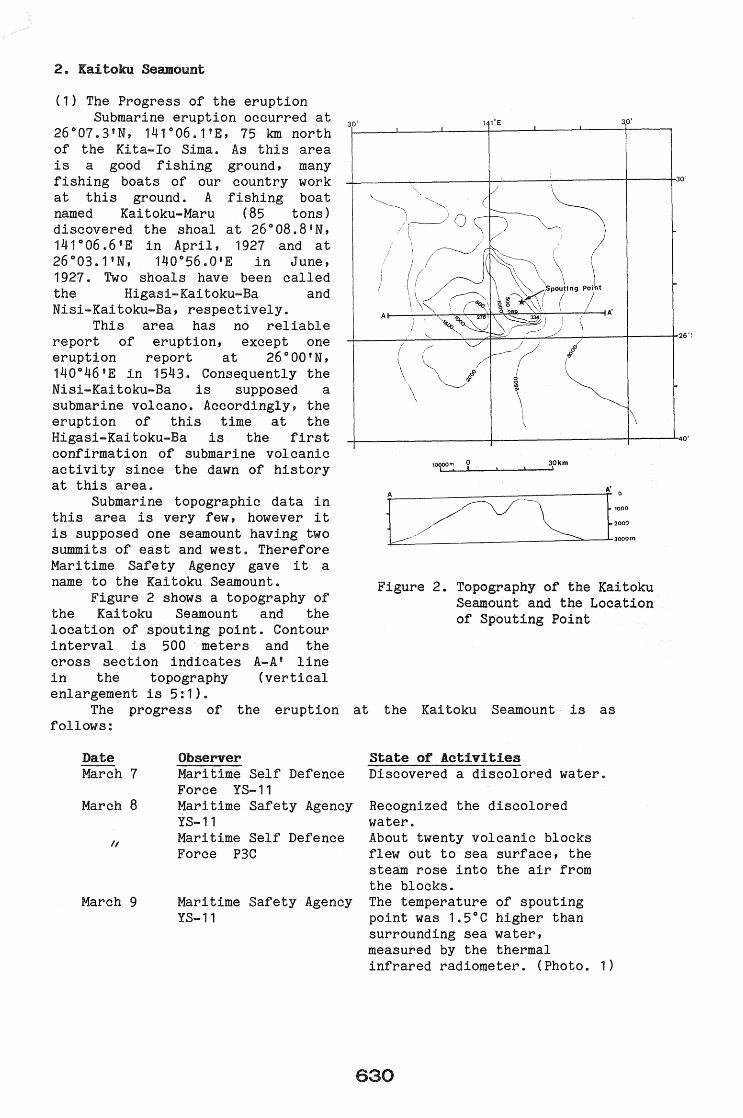
Submarine topographic data in this area is very few, however it is supposed one seamount having two summits of east and west. Therefore Mari time Safety Agency gave ita name to the Kaitoku Seamount.
Figure 2 shows a topography of the Kaitoku Seamount and the location of spouting point. Contour interval is 500 meters and the cross section indicates A-A' line in the topography (vertical enlargement is 5:1).
30' 30'
-+-___ r-____ ~_-_:----_ __r--_r30'
/
I
/
+ ________ t-_______ -t __ ---'-40'
l0000m 0 30km 1-' ...Ao' --1-1 _-.1..-_-'-----"
r 1000
20M
3000",
Figure 2. Topography of the Kaitoku Seamount and the Location of Spouting Point
The progress of the eruption at the Kaitoku Seamount is as follows:
Date March 7
March 8
II
March 9
Observer Maritime Self Defence Force YS-11 Maritime Safety Agency YS-11 Maritime Self Defence Force P3C
Maritime Safety Agency YS-11
State o~ Activities Discovered a discolored water.
Recognized the discolored water. About twenty volcanic blocks flew out to sea surface, the steam rose into the air from the blocks. The temperature of spouting point was 1.5°C higher than surrounding sea water, measured by the thermal infrared radiometer. (Photo. 1)
630
March 12 Maritime Self Defence Force P2J
About ten volcanic blocks on the sea surface and steam from the blocks.
March 13 Maritime Safety Agency YS-11
The temperature of spouting point was more than 2°C higher than surrounding sea water, measured by the thermal infrared radiometer. (Photo. 2) Measured the position of spouting point by Loran C; 26°07.3'N, 141°06.1'E and
March 14 Patrol Vessel "Uraga" and her helicopter, Maritime Safety Agency
March 15 II
/1
took a sample of discolored water. Recognized the drifting of volcanic blocks and rising steam from the blocks. (Photo. 3)
March 17 March 29 Maritime Safety Agency
YS-11
II (Photo 4 and Photo 5) The temperature of discolored water was 0.4°c higher than surrounding sea water, measured by the thermal infrared radiometer. (Photo 6)
(2) Observation The temperature measurements
of spouting point and discolored water were made out on March 9, March 13 and March 29, 1984 by the airborne thermal infrared radiometer AGA 780 installed on an aircraft YS-11 belonging to Maritime Safety Agency. Table 1 shows a specifica tions of the thermal infrared radiometer AGA 780.
In case of temperature measurement using thermal infrared senser, there needs some corrections for emissivity of the objects, for absorption of vapor of the air etc. But we made no correction because it was very difficult to get sea truth and to correct the observed data; discolored water caused by the submarine volcanic activities.
A. March 9, 1984
Table 1. Specifica tiona of the Thermal Infrared Radiometer AGA 780
Item Specification
Scanner HgCdTe sensor
thermal resolusion O.l°C
spectral band 8Pm·14pm
Lens field of view 20' X 20·
geometrical resolusion 3.4 milliradian
focal distance 33mm
Monitor black and white CRT
screen size 50mmX50mm
sensitivity 2 "C -1000"C with isotherm function
Digital 1/2 inch 9 tracks
recording reel size 7 inch
equipment density 1600bpi
(MT) record size 1024 characters
picture elements 112X64
Monitor color video camera with color video monitor
( visible
images)
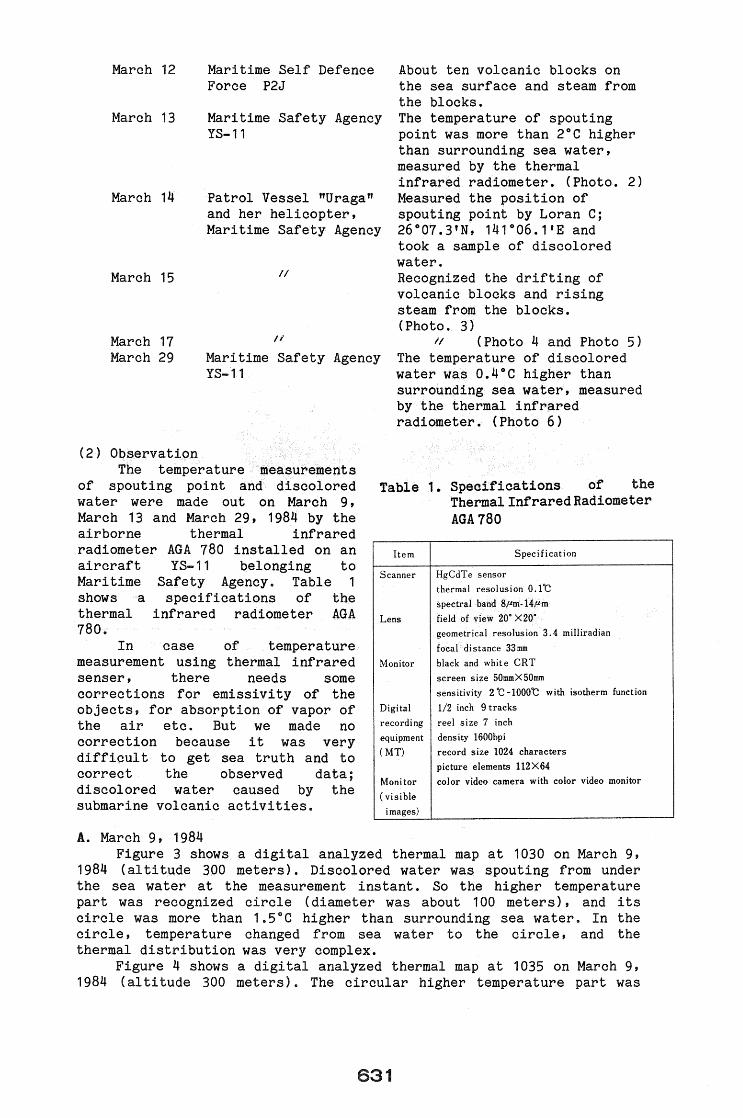
Figure 3 shows a digital analyzed thermal map at 1030 on March 9, 1984 (al ti tude 300 meters). Discolored water was spouting from under the sea water at the measurement instant. So the higher temperature part was recognized circle (diameter was about 100 meters), and its circle was more than 1.5°C higher than surrounding sea water. In the circle, temperature changed from sea water to the circle, and the thermal distribution was very complex.
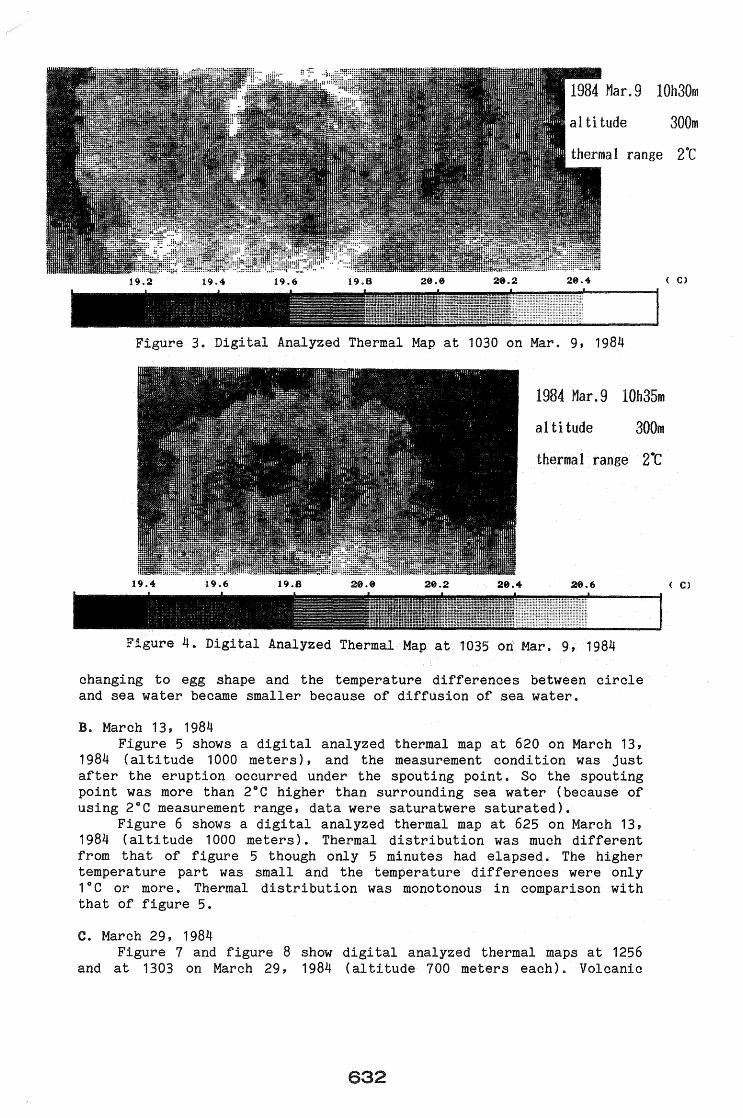
Figure 4 shows a digital analyzed thermal map at 1035 on March 9, 1984 (al ti tude 300 meters). The circular higher temperature part was
631
Figure 3. Digital Analyzed Thermal Map at 1030 on Mar. 9, 1984
10h30m
300m
2t
(C)
1984 Mar.9 10h35m
altitude 300m
thermal range 2t
Figure 4. Digital Analyzed Thermal Map at 1035 on Mar. 9, 1984
changing to egg shape and the temperature differences between circle and sea water became smaller because of diffusion of sea water.
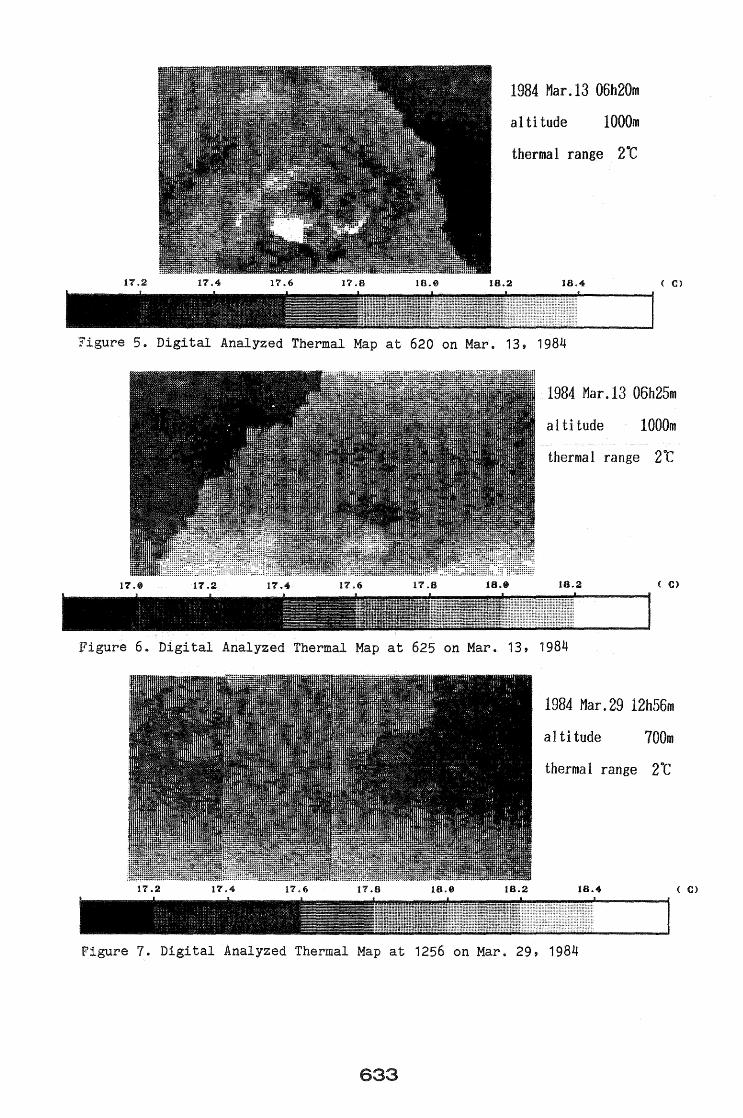
B. March 13, 1984 Figure 5 shows a digital analyzed thermal map at 620 on March 13,
1984 (al ti tude 1000 meters), and the measurement condition was just after the eruption occurred under the spouting point. So the spouting point was more than 2°C higher than surrounding sea water (because of using 2°C measurement range, data were saturatwere saturated).
Figure 6 shows a digital analyzed thermal map at 625 on March 13, 1984 (al ti tude 1000 meters). Thermal distribution was much different from that of figure 5 though only 5 minutes had elapsed. The higher temperature part was small and the temperature differences were only 1 ° C or more. Thermal distribution was monotonous in comparison with that of figure 5.
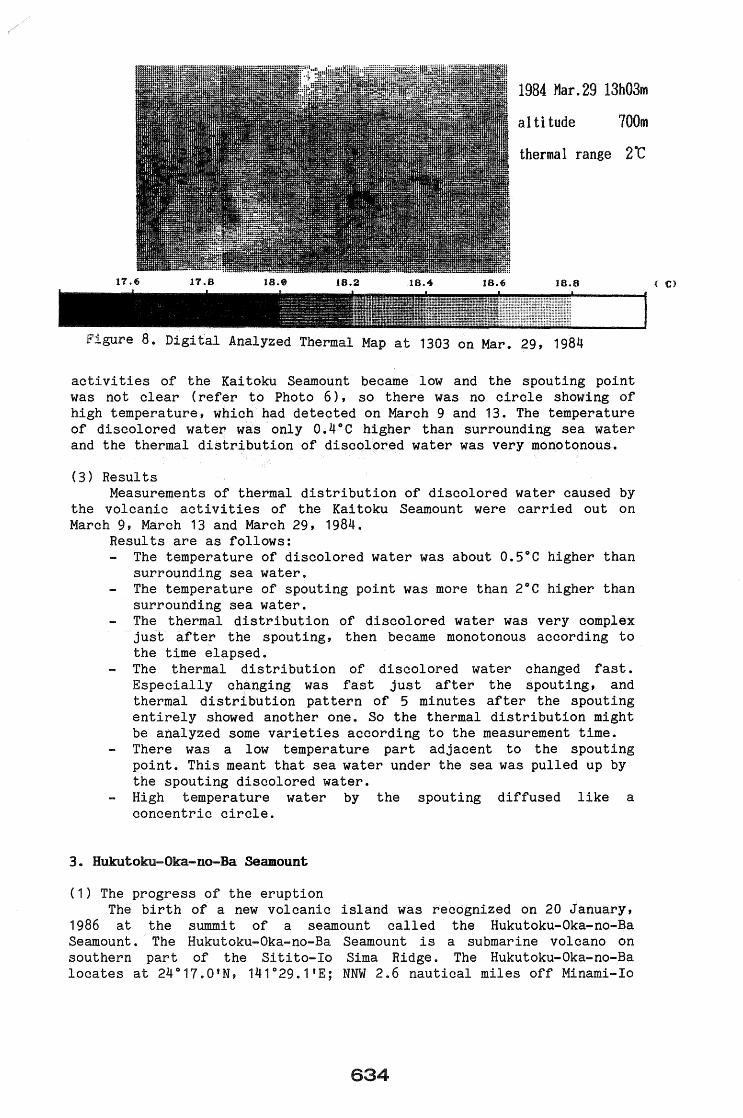
c. March 29, 1984 Figure 7 and figure 8 show digital analyzed thermal maps at 1256
and at 1303 on March 29, 1984 (altitude 700 meters each). Volcanic
632
( C)
1984 Mar.13 06h20m
altitude 1000m
therma I range 2 t
18.4 (C)
Figure 5. Digital Analyzed Thermal Map at 620 on Mar. 13, 1984
1984 Mar.13 06h25m
altitude lOOOm
thermal range 2t
(C)
Figure 6. Digital Analyzed Thermal Map at 625 on Mar. 13, 1984
1984 Mar.29 12h56m
altitude 700m
therma 1 range 2 t
18.4
Figure 7. Digital Analyzed Thermal Map at 1256 on Mar. 29, 1984
633
( C)
1984 Mar.29 13h03m
altitude 700m
thermal range 2·C
F.igure 8. Digi t'al Analyzed Thermal Map at 1303 on Mar. 29, 1984
acti vi ties of the Kai toku Seamount became low and the spouting point was not clear (refer to Photo 6), so there was no circle showing of high temperature, which had detected on March 9 and 13. The temperature of discolored water was only 0.4°c higher than surrounding sea water and the thermal distribution of discolored water was very monotonous.
(3) Results Measurements of thermal distribution of discolored water caused by
the volcanic activities of the Kaitoku Seamount were carried out on March 9, March 13 and March 29, 1984.
Results are as follows: The temperature of discolored water was about 0.5°C higher than surrounding sea water. The temperature of spouting point was more than 2°C higher than surrounding sea water. The thermal distribution of discolored water was very complex just after the spouting, then became monotonous according to the time elapsed. The thermal distribution of discolored water changed fast. Especially changing was fast just after the spouting, and thermal distribution pattern of 5 minutes after the spouting entirely showed another one. So the thermal distribution might be analyzed some varieties according to the measurement time. There was a low temperature part adjacent to the spouting point. This meant that sea water under the sea was pulled up by the spouting discolored water. High temperature water by the spouting diffused like a concentric circle.
3. Hukutoku-Oka-no-Ba Seamount
(1) The progress of the eruption The birth of a new volcanic island was recognized on 20 January,
1986 at the summit of a seamount called the Hukutoku-Oka-no-Ba Seamount. The Hukutoku-Oka-no-Ba Seamount is a submarine volcano on southern part of the Sitito-Io Sima Ridge. The Hukutoku-Oka-no-Ba locates at 24°17.0'N, 141°29.1'E; NNW 2.6 nautical miles off Minami-Io
634
Sima, Ogasawara Islands. This submarine volcano formed
a volcanic island two times; in November, 1904 and in January, 1914. These new islands were vanished wi thin one year in both cases. The Hukutoku-Oka-no-Ba Seamount is one of the most active submarine volcanoes in Japan and discolored water has been found incessantly more than ten years.
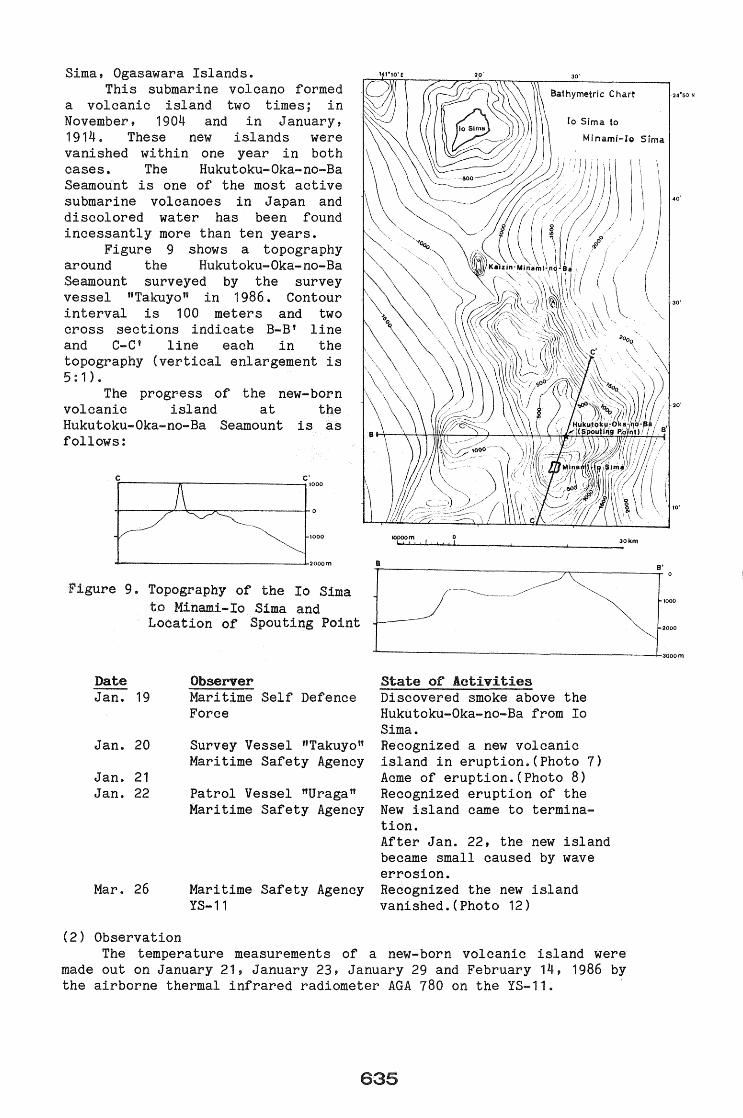
Figure 9 shows a topography around the Hukutoku-Oka-no-Ba Seamount surveyed by the survey vessel "Takuyo" in 1986. Contour interval is 100 meters and two cross sections indicate B-B' line and C-C' line each in the topography (vertical enlargement is 5: 1 ) •
The progress of the new-born volcanic island at the Hukutoku-Oka-no-Ba Seamount is as follows:
C c' r------,r------------11000
1000
"'--------------l-2000rn
Figure 9. Topography of the Io Sima to Minami-Io Sima and Location of Spouting Point
Date Jan. 19
Jan. 20
Jan. 21 Jan. 22
Mar. 26
(2) Observation
Observer Maritime Self Defence Force
Survey Vessel "Takuyo" Maritime Safety Agency
Patrol Vessel "Uraga" Maritime Safety Agency
Maritime Safety Agency YS-11
30'
Bathymetric Chart 24'50'N
10 Sima to
Minaml-Io Sima
20'
10'
S'
1000
2000
--------------------L300orn
State of Activities Discovered smoke above the Hukutoku-Oka-no-Ba from Io Sima. Recognized a new volcanic island in eruption. (Photo 7) Acme of eruption. (Photo 8) Recognized eruption of the New island came to termination. After Jan. 22, the new island became small caused by wave errosion. Recognized the new island vanished.(Photo 12)
The temperature measurements of a new-born volcanic island were made out on January 21, January 23, January 29 and February 14, 1986 by the airborne thermal infrared radiometer AGA 780 on the YS-11.
635
We made no data correction because of same reason as the Kaitoku Seamount.
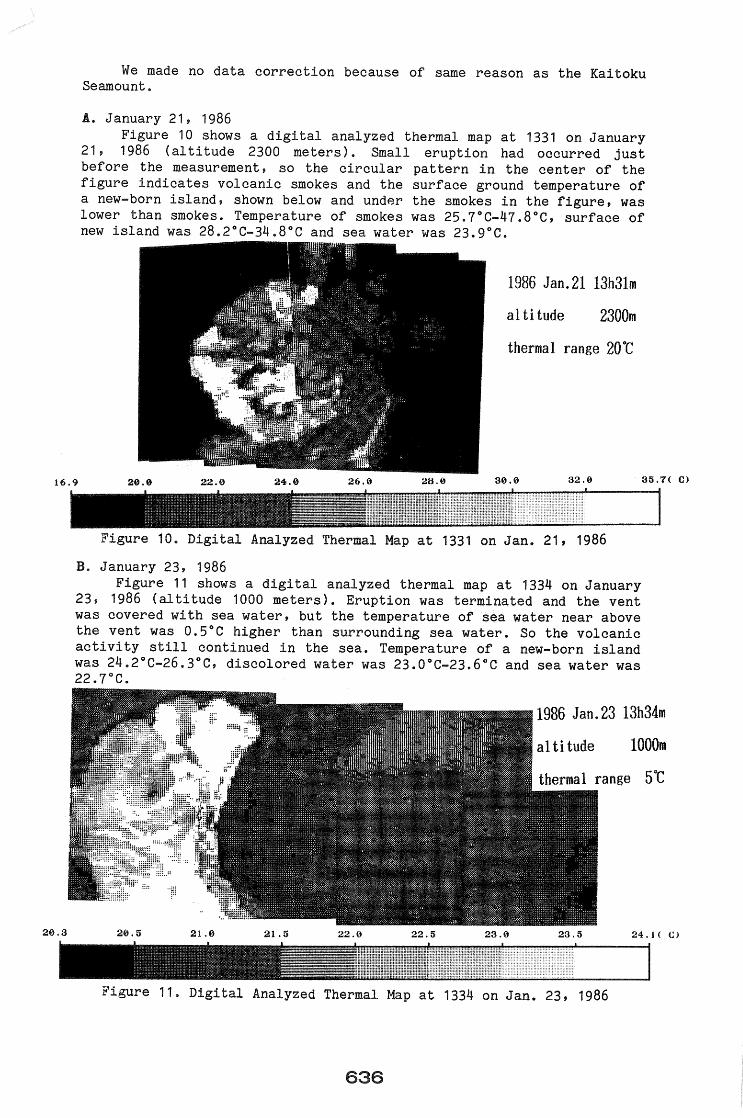
A. January 21, 1986 Figure 10 shows a digital analyzed thermal map at 1331 on January
21, 1986 (altitude 2300 meters). Small eruption had occurred just before the measurement, so the circular pattern in the center of the figure indicates volcanic smokes and the surface ground temperature of a new-born island, shown below and under the smokes in the figure, was lower than smokes. Temperature of smokes was 25.7°C-47.8°c, surface of new island was 28.2°C-34.8°C and sea water was 23.9°C.
1986 Jan.21 13h31m
altitude 2300m
thermal range 20°C
32.0 35.7< C)
Figure 10. Digital Analyzed Thermal Map at 1331 on Jan. 21, 1986
B. January 23, 1986 Figure 11 shows a digital analyzed thermal map at 1334 on January
23, 1986 (altitude 1000 meters). Eruption was terminated and the vent was covered with sea water, but the temperature of sea water near above the vent was 0.5°C higher than surrounding sea water. So the volcanic activity still continued in the sea. Temperature of a new-born island was 24.2°C-26.3°C, discolored water was 23.0°C-23.6°C and sea water was 22.7°C.
1986 Jan.23 13h34m
1000m
Figure 11. Digital Analyzed Thermal Map at 1334 on Jan. 23, 1986
636
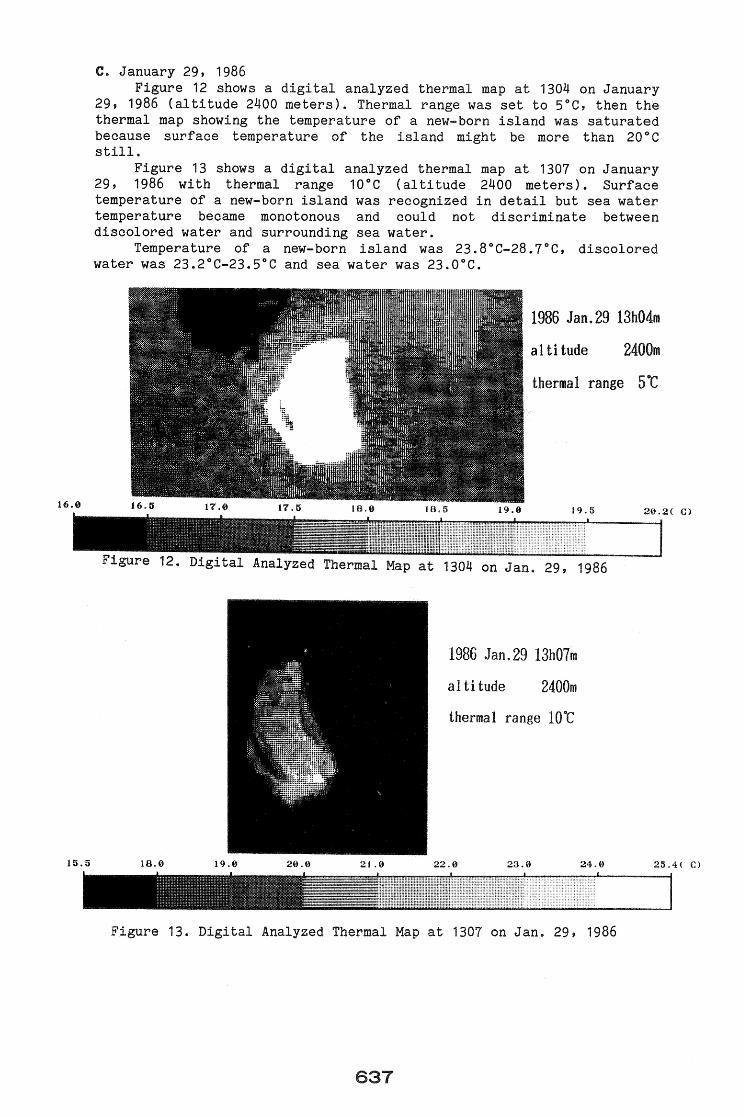
c. January 29, 1986 Figure 12 shows a digital analyzed thermal map at 1304 on January
29, 1986 (altitude 2400 meters). Thermal range was set to 5°C, then the thermal map showing the temperature of a new-born island was saturated because surface temperature of the island might be more still.
Figure 13 shows a digital analyzed thermal map at 1307 on January 29, 1986 with thermal range 10°C (altitude 2400 meters). Surface temperature of a new-born island was recognized in detail but sea water temperature became monotonous and could not discriminate between discolored water and surrounding sea water.
Temperature of a new-born island was 23.8°C-28.7°C, discolored water was 23.2°C-23.5°C and sea water was 23.0°C.
1986 Jan.29 13h04m
2400m
thermal range 5t
19.5 20.2( C)
Figure 12. Digital Analyzed Thermal Map at 1304 on Jan. 29, 1986
1986 Jan.29 13h07m
al ti tude 2400m
thermal range lot
24.0 25.4( C)
Figure 13. Digital Analyzed Thermal Map at 1307 on Jan. 29, 1986
637
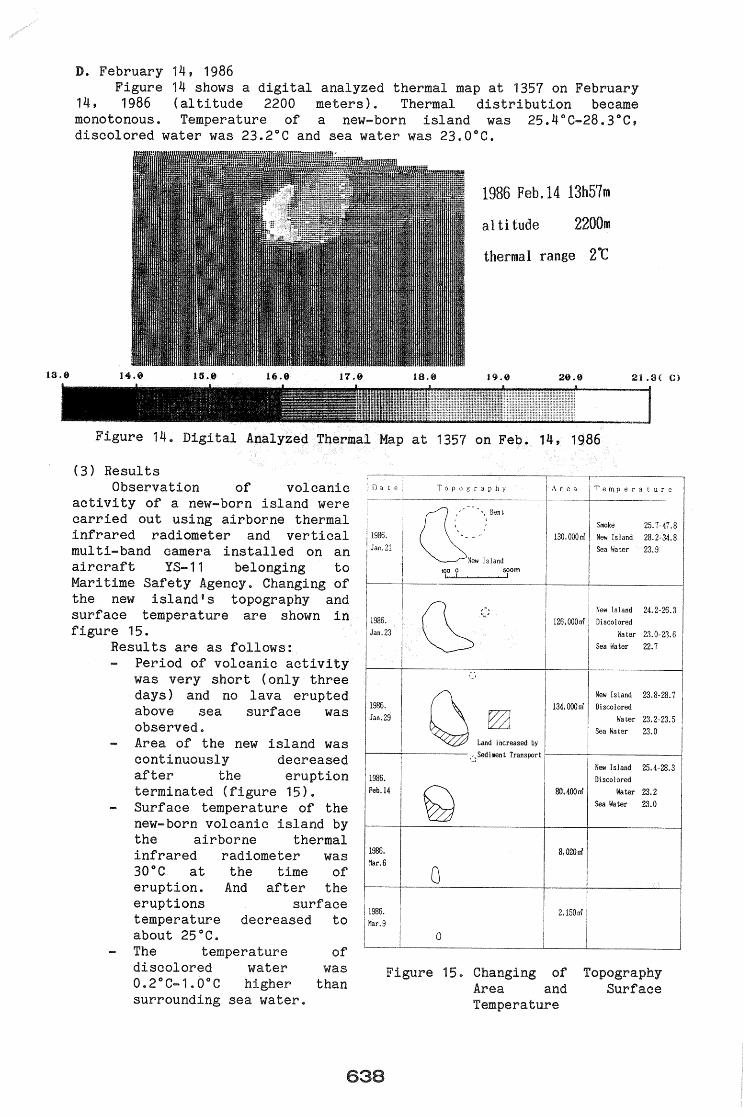
D. February 14, 1986 Figure 14 shows a digital analyzed thermal map at 1357 on February
14, 1986 (al ti tude 2200 meters) . Thermal distribution became monotonous. Temperature of a new-born island was 25.4°C-28.3°C, discolored water was 23.2°C and sea water was 23.0°C.
1986 Feb.14 13h57m
al ti tude 2200m
thermal range 2't
21.3( m
Figure 14. Digital Analyzed Thermal Map at 1357 on Feb. 14, 1986
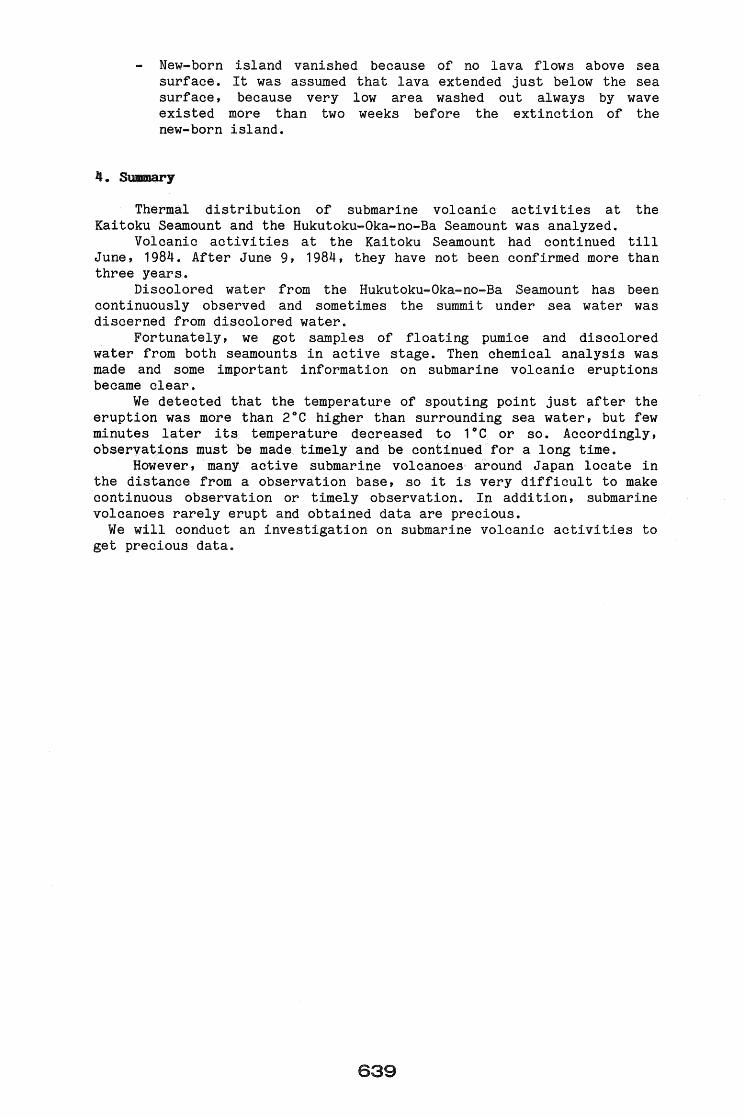
(3) Results Observation of volcanic
activity of a new-born island were carried out using airborne thermal infrared radiometer and vertical mul ti-band camera installed on an aircraft YS-11 belonging to Maritime Safety Agency. Changing of the new island's topography and surface temperature are shown in figure 15.
Results are as follows: Period of volcanic activity was very short (only three days) and no lava erupted above sea surface was observed. Area of the new island was continuously decreased after the eruption terminated (figure 15). Surface temperature of the new-born volcanic island by the airborne thermal infrared radiometer was 30°C at the time of eruption. And after the eruptions surface temperature decreased to about 25°C.
of
: 0 a t
i
1986. Jan.21
1986. Jan. 23
11986• Jan. 29
1986. Feb. 14
1986. Mar.6
1986. Mar.9
Topography
~--'"B''' , I
t.. /
'-~~w' Island
100 0 500m I I I
'-' ~'-
, ,
Q E22 Land increased by
':l Sediment Transport
Q
0
0
a Temperature
Smoke 25.7-47.8 130,OOOIrl New Island 28.2-34.8
Sea Water 23.9
New Island 24.2-26.3 126,OOOIrl Discolored
Water 23.0-23.6 Sea Water 22.7
New Island 23.8-28.7 134,OOOIrl Discolored
Water 23.2-23.5 I
Sea Water 23.0
New Island 25.4-28.3 Discolored
8O,400Irl Water 23.2 Sea Water 23.0
8,020Irl
I
2,150Irl
The temperature discolored water 0.2°C-1.0°C higher surrounding sea water.
was than
Figure 15. Changing of Topography Surface Area and
Temperature
638
New- born island vanished because of no lava flows above sea surface. It was assumed that lava extended just below the sea surface, because very low area washed out always by wave existed more than two weeks before the extinction of the new-born island.
4. Summary
Thermal distribution of submarine volcanic activities at the Kaitoku Seamount and the Hukutoku-Oka-no-Ba Seamount was analyzed.
Volcanic activities at the Kaitoku Seamount had continued till June, 1984. After June 9, 1984, they have not been confirmed more than three years.
Discolored water from the Hukutoku-Oka-no-Ba Seamount has been continuously observed and sometimes the summi t under sea water was discerned from discolored water.
Fortunately, we got samples of floating pumice and discolored water from both seamounts in actiV'e stage. Then chemical analysis was made and some important information on submarine volcanic eruptions became clear.
We detected that the temperature of spouting point just after the eruption was more than 2°C higher than surrounding sea water, but few minutes later its temperature decreased to 1°C or so. Accordingly, observations must be made timely and be continued for a long time.
However, many active submarine volcanoes around Japan locate in the distance from a observation base, so it is very difficult to make continuous observation or timely observation. In addition, submarine volcanoes rarely erupt and obtained data are precious.
We will conduct an investigation on submarine volcanic activities to get precious data.
639
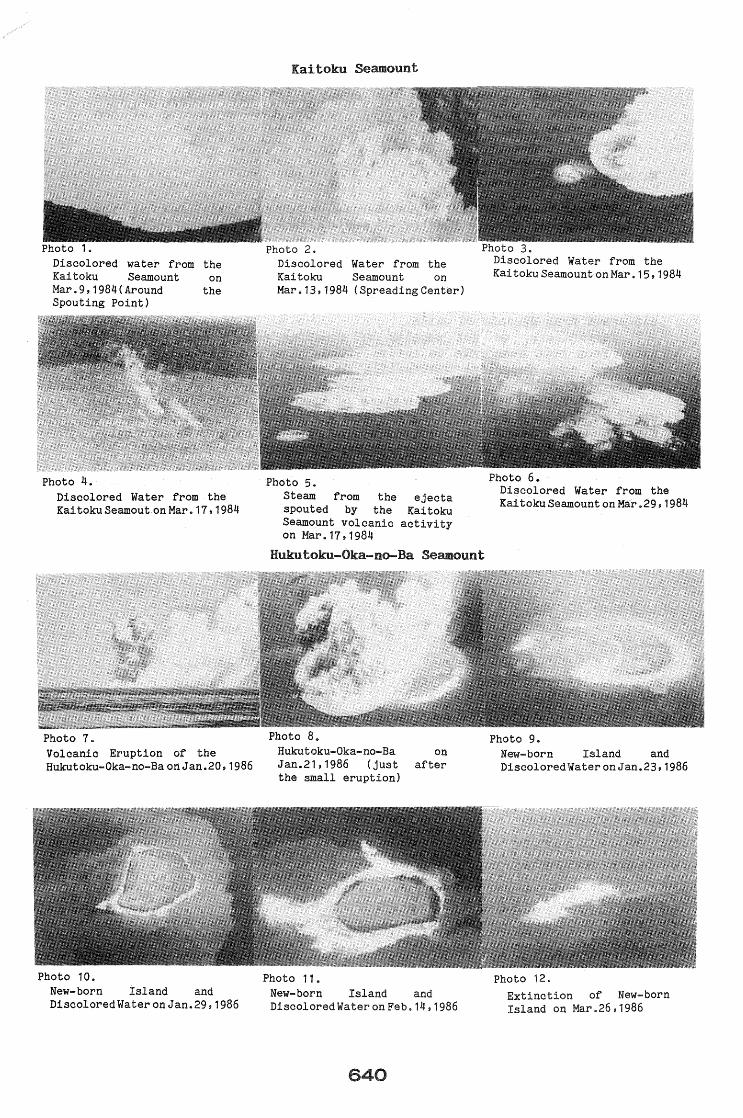
Photo 1. Discolored water from the Kaitoku Seamount on Mar.9,1984(Around the Spouting POint)
Photo 4. Discolored Water from the Kai toku Seamout on Mar. 17,1984
Photo 7. Volcanic Eruption of the Hukutoku-Oka-no-Ba onJan.20, 1986
Photo 10. New-born Island and Discolored Water on Jan.29, 1986
Kaitoku Seamount
Photo 2. Discolored Water from the Kaitoku Seamount on Mar. 13, 1984 (Spreading Center)
Photo 5. Steam from the ejecta spouted by the Kai toku Seamount volcanic activity on Mar. 17,1984
Photo 3. Discolored Water from the KaitokuSeamountonMar.15,1984
Photo 6. Discolored Water from the Kaitoku Seamount on Mar .29,1984
Hukutoku-Oka-no---Ba Seamount
Photo 8. Hukutoku-Oka-no-Ba on Jan.21,1986 (just after the small eruption)
Photo 11. New-born Island and Discolored Water on Feb. 14, 1986
Photo 9. New-born Island and Discolored Water onJan.23, 1986
Photo 12. Extinction of New-born Island on Mar.26,1986