Page 1
FISHERY INTERIM SUMMARY REPORT SERIES NO. 11-01
RICHARDSON LAKES FISHERY MANAGEMENT
By
Jason Seiders
Maine Department of Inland Fisheries and Wildlife
Fisheries and Hatcheries Division
Augusta, Maine
December, 2011
Page 2
1
JOB F-014
RICHARDSON LAKES FISHERY MANAGEMENT
Interim Summary Report No. 8 (2008-2010)
Summary
The Richardson Lakes support fisheries for landlocked salmon (Salmo salar), lake trout
(Salvelinus namaycush), and brook trout (Salvelinus fontinalis). Season-long angler surveys were
conducted seven times from 1998 to 2010 to evaluate the status of the sport fishery. Estimates of total
angler use and harvest were made in 2002, 2007 and 2010; all indicating an increase in angling activity
over that of the late 1990’s.
Salmon growth rates had been stable from 1986-91, but declined in succeeding years,
prompting a reduction in the salmon stocking rate to restore the abundance of rainbow smelt (Osmerus
mordax), the primary forage species. Efforts to close Mill and Metallak Brooks to smelt dipping in
1996 were unsuccessful, but with continued poor salmon growth, they were closed effective 2007.
Additionally, no salmon were stocked in 2006 in response to the sharp decline in salmon growth.
Salmon stocking has since resumed, but at a lower rate to rebuild the forage base. Salmon growth rates
and body condition remain relatively low even with reduced stocking rates and a more protected smelt
population.
Lake trout and brook trout, which are not as dependent on smelt for forage, grew at acceptable
rates over the survey period, and lake trout in particular provided an attractive fishery for large fish.
Lake trout numbers are carefully managed by limiting recruitment through lake level manipulation.
Wild brook trout are present in low numbers in the Richardsons, and continue to be augmented by
increasing numbers of hatchery fish. Brook trout catch rates have improved and provide an
increasingly viable angling opportunity.
This report summarizes season long clerk survey data, volunteer angler data, and other data
collected by MDIFW during 2010. Summer angler surveys will continue on the Richardson Lakes on a
three-year schedule; the next survey year will be 2013.
KEY WORDS: ANGLER EFFORT, ANGLER SURVEY, BKT, FORAGE, HARVEST, LAKE, LLS,
LKT, MEAN SIZE, SEASON LONG ANGLER SURVEY
Page 3
2
Introduction and Study Area
Upper and Lower Richardson Lakes, located in the Rangeley chain of lakes in Oxford County,
are 7,100 acres in size and support fisheries for landlocked salmon, brook trout, and a remnant lake
trout population. Water levels in the Richardson Lakes are controlled by Middle Dam, which is owned
and operated by FPL Energy Maine Hydro (FPLE).
General law regulations are in effect for salmon and lake trout; more restrictive brook trout
regulations have been in effect since 1996. The lakes and their tributaries were closed to smelting in
2007 (Table 1). Previous to complete closure, smelt dipping at Upper Dam Pool was prohibited
effective 1996 and the other smelt spawning tributaries, including Mill and Metallak Brooks, were
closed to the taking of smelts from midnight until noon each day effective 2005.
The Richardsons are closed to ice fishing. There are public boat launch sites at the extreme ends
of the Richardsons; at Mill Brook on the north end and at South Arm on the south end.
The salmon fishery is primarily dependent on annual stockings though there is some drop down
of wild Mooselookmeguntic Lake salmon at Upper Dam. The salmon stocking rate was reduced from
3,500 in 1993 to approximately 2,500 or fewer fish in more recent years. Salmon stocking ceased in
2006 due to poor growth attributed to low smelt abundance. Continued poor salmon growth rates,
despite reductions in the stocking rate, prompted the closure of the tributaries to recreational smelting
in 2007. Salmon stocking has resumed at a reduced rate of approximately 1,700 fish annually.
Lake trout were illegally introduced and efforts continue to reduce their numbers because they
compete with salmon for limited forage. Landlocked alewives (Alosa pseudoherangus) were stocked
in Rangeley Lake in the 1970’s and have since become established in the Richardsons. Although they
serve as forage for larger salmonids, they are utilized less than smelt (particularly by salmon) and likely
compete with smelt for available plankton. Unscheduled brook trout are frequently stocked at the
Richardsons, and provide varying rates of returns to anglers.
Methods
Season-long aerial angler counts and clerk creel surveys conducted in 2002, 2007 and 2010
allowed estimation of total angler use as well as catch, harvest, and age composition of the sport
fishery. Clerk surveys conducted in 1999, 2003 and 2004 provided information on angler catch rates
and fish growth rates, but not on total annual angler use and harvest. Additional information was
gathered by trapnetting (1999, 2001, 2005, 2006, 2008, 2010), gillnetting (2003, 2007), and trawling
(2005, 2006, 2009). In addition, voluntary angler data are collected annually. The voluntary angler data
supplements and corroborates data collected through other methods such as trapnetting. Previous
Page 4
3
sampling efforts have been presented in Interim Summary Reports (Bonney 1999, 2000, 2002, 2006,
2008). Previously reported data are included in the summary tables in this report, and comparisons are
made when appropriate.
Summary of Findings
Estimates of Angler Use and Harvest
Previous angler use estimates indicated a decline in the number of anglers fishing the
Richardson Lakes in the late 1990’s (Figure 1). Since the lowest total of 2,352 angler days in 1998, the
number of anglers has increased to a total of 8,455 in 2010 (Table 2). The total estimate for 2010 is
similar to more recent estimates and estimates from the early to mid 1990’s. The decrease in angler
use observed in the late 1990’s may be attributed to low salmon catch rates. In 1999, it took anglers
approximately 49.7 hours to catch a legal salmon. By 2007, the number of hours required to catch a
legal salmon had decreased to 7.0. By 2010, however, the number of hours required to catch a legal
fish had increased to 30.2. This decrease in angler success for salmon may be related to lower stocking
rates.
Lake trout numbers continued to decline in the Richardson Lakes. No lake trout were sampled
during the clerk survey, illustrating some level of success in reducing lake trout numbers in the
Richardsons. Lake trout still provide an opportunity to catch larger, trophy fish, and are targeted by
certain anglers.
Brook trout contribute to the sport fishery in the Richardson Lakes. MDIFW continues to
augment the relatively low wild brook trout population with unscheduled hatchery trout (Kennebago
strain). In recent years, brook trout stockings have been more frequent and involved larger numbers of
fish (Table 1). As a result, angler success has increased from 0.08 legal fish per angler in 1999, to 0.47
legal fish per angler in 2010.
The Salmon Fishery
Salmon were stocked at a rate of 3,500 spring yearlings per year (0.5/acre) from 1981 through
1993. Growth rate concerns prompted a reduction in the stocking rate to 2,500 per year
(0.35/acre/year) from 2003 through 2005. Due to a severe decline in growth rates, salmon stocking
was suspended for a year in 2006. Stocking resumed in 2007, and as of 2010 remains at a reduced rate
of about 1,700 per year (0.2/acre).
Page 5
4
Larger fall yearling salmon have been stocked experimentally since 2009. We hypothesize that
the lakes’ insect production is low due to the lack of extensive littoral areas and from annual
dewatering. This may negatively impact first-year growth of spring-stocked salmon, which primarily
forage on invertebrates. Larger fall-stocked salmon are less likely to rely on insects and could forage on
smelts shortly after planting, thereby boosting growth rates and shortening the time required to recruit
to attractive sizes. Voluntary angler reports and trapnetting data suggested that fall yearling salmon
stocked in 2009 comprised the majority of the salmon fishery in 2010 as age II fish. This large cohort
of relatively young fish likely explains the overall decrease in mean size of salmon observed in the
2010 clerk and voluntary angler surveys (Tables 3-7). Despite the decrease in mean size, and contrary
to clerk survey data, volunteer angler data through 2010 showed a continued and rapidly increasing
success rate for catching a legal size salmon. Clerk survey data indicate a decreased success rate
decrease from 2007 to 2010 (0.95 to 0.18 legal fish per angler), while volunteer angler data showed an
increase during the same time period (0.45 to 1.18 legal fish).
All data sources showed a decline in overall condition factor for salmon in the Richardson
Lakes. After approximately one year in the system, age II+ salmon exhibit relatively slow growth and
low condition factor (condition factor of 0.74). Age III+ hatchery salmon exhibited slightly better
condition (0.83) but remained well below historical levels, which may suggest that the lakes’ forage
base (smelts) continues to be impaired.
Many factors contribute to the salmon forage problems in the Richardsons. Competition for
smelt from lake trout contributes to salmon growth problems, although lake trout numbers appear to be
stable or in decline. Additional pressure on the smelt population comes from an unknown number of
wild salmon that drop down from Mooselookmeguntic Lake. These salmon contribute to the fishery in
the Richardsons, but their numbers add an unknown variable to managing smelt predators. Landlocked
alewives are not readily utilized by salmon; salmon remain dependant upon high smelt densities to
achieve desirable growth and condition. Alewives compete with smelt for food and may be responsible
for contributing to a decline in smelt abundance. The only variable within MDIFW’s direct control is
the salmon stocking rate, which will continue to be adjusted until a balance can be found between
predatory species and available forage. The performance of the experimental fall yearling plantings and
smelt abundance will be carefully monitored during the next several years as well.
The Lake Trout Fishery
Lake trout were illegally introduced to the Richardsons in the 1970’s and were stocked
intermittently from 1980 to 1995 until there was evidence that the forage base could not support an
Page 6
5
additional predator species. At the request of MDIFW, FPLE implemented a minimum winter
drawdown of five feet below the October 1 lake elevation on an annual basis beginning in 2000. This
drawdown dewaters and kills lake trout eggs that were deposited in the fall when suitable spawning
substrate was still covered with water. This effort appears to be successful, as evidenced by fewer
sublegal fish reported and none captured in recent gillnet or trapnetting efforts. Age V+ lake trout
collected in 2007 originated from eggs laid after the draw down agreement went into effect in 2000,
indicating that not all of the eggs were dewatered. However, no lake trout younger than age V+ were
sampled, suggesting that the effort is largely successful in limiting reproduction.
Lake trout in the Richardsons have grown to attractive sizes, and MDIFW recognizes that they
have provided an attractive fishery for anglers seeking larger fish. Voluntary anglers reported catching
a total of 49 legal-size lake trout from 2001 to 2005, the longest of which was 34 inches, and fish up to
age XV+ were taken (Table 8). Hatchery-reared lake trout sampled by trapnetting (Table 9) and wild
lake trout sampled by clerk survey and gillnetting (Table 10) also grew to attractive sizes of over 30
inches and 9 pounds or larger. However, due to their high reproductive rates and longevity, and
because the lakes’ smelt populations continues to be depressed, MDIFW desires to continue efforts to
minimize the abundance of lake trout in the Richardsons through winter drawdowns.
Although MDIFW currently seeks to limit lake trout numbers in the Richardsons, conditions
may change in the future. If landlocked alewives become overabundant and the smelt population
becomes relict, limited maintenance stockings of lake trout could help to reduce landlocked alewife
numbers and ultimately benefit smelt and salmon.
The Brook Trout Fishery
The Richardsons do not support a substantial wild brook trout population. This situation may
result from a lack of spawning and nursery habitat in the tributaries, the relatively small littoral zone
within the lake, the effect of the drawdown regime, or a combination of these factors. FPLE conducts
annual surveys to ensure unobstructed tributary access as part of their Federal Energy Regulatory
Commission license. This eliminates a possible cause of reproductive failure, and may benefit other
species such as smelt.
Unscheduled hatchery brook trout fry, fall fingerling, and recently spring and fall yearling, have
frequently been stocked to supplement the small wild population. Both voluntary angler and clerk
survey data indicated that brook trout catch rates improved in recent years. Growth rates were
comparable to those observed in other large lakes in the chain, and recruitment to older ages clearly
occurred; ages I+ through V+ were represented in the catch by anglers and in trapnet samples (Tables
Page 7
6
10 and 11). These data are encouraging signs that brook trout stockings could provide significant
benefits to Richardson Lakes anglers. Spring yearling brook trout (local Kennebago strain only) will be
stocked at rates of about 2500 to 5000 fish annually over the next several years to provide a more
consistent fishery.
Forage abundance
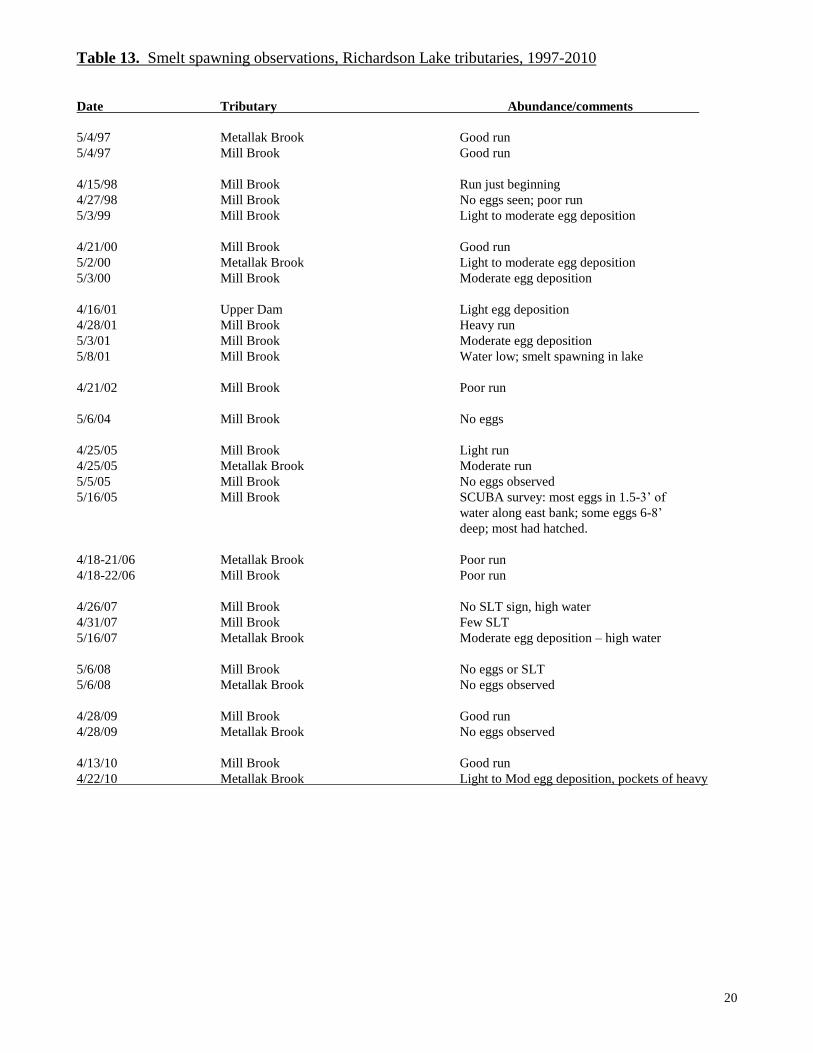
Inspections of annual smelt egg deposits suggested slightly improved spawning runs in two
major tributaries (Mill Brook and Metallak Brook) in 2009 and 2010 (Table 13). Smelt spawning
surveys are based on one or more qualitative observations where smelt egg deposition is visually
assessed. The Department’s hydroacoustic sampling has ceased due to obsolete equipment and a lack
of funding to update and maintain the program.
We will continue to monitor the impact of the 2007 closure of the tributaries to smelt dipping
on forage abundance and salmonid growth rates. We will also initiate annual Scuba surveys of the Mill
Brook and Upper Dam Pool spawning runs to provide more detailed assessments of these important
smelt tributaries, if staffing levels permit.
Recommendations
Continue stockings of fall yearling salmon at an annual rate of 1,800 to 3,000 (0.25 to
0.35/acre), with the specific rate depending on annual assessments of smelt spawning success
and salmon growth rates and body condition.
Continue to monitor smelt spawning runs, and work to maintain a complete closure of
tributaries to smelting.
Initiate annual brook trout stockings with Kennebago-strain spring yearlings in 2011, but
carefully monitor their impact to the lakes’ smelt and salmon populations.
Continue water level manipulations to limit successful lake trout spawning.
Conduct clerk creel surveys in 2013 (a frequency of one survey every third year) to evaluate
changes in angler use, salmon growth rates, lake trout reproduction, and forage preference and
abundance.
Prepared by: Jason Seiders
December, 2011
Page 8
7
Acknowledgments
Funding to hire the clerks who checked anglers was provided by FPLE. Anglers who keep
voluntary fishing log books allow us to monitor the Richardson Lakes fishery on an annual basis, and
we are grateful for the high quantity and quality of the records they maintain. Thanks to the following
anglers: Fern Bosse, Honey Cronin, Lyn Hewey, and Maynard Webster. David Howatt assisted with
data compilation and analysis.
References
Bonney, Forrest R. 1999. Richardson Lakes Fishery Management. Interim Summary Report No. 3
(1998). Maine Department Inland Fisheries and Wildlife. 14 pp. Mimeo.
_____ 2000. Richardson Lakes Fishery Management. Interim Summary Report No. 4 (1998-1999).
Maine Department Inland Fisheries and Wildlife. 17 pp. Mimeo.
_____ 2002. Richardson Lakes Fishery Management. Interim Summary Report No. 5 (2002). Maine
Department Inland Fisheries and Wildlife. 20 pp. Mimeo.
_____ 2006. Richardson Lakes Fishery Management. Interim Summary Report No. 6 (2003-2005).
Maine Department Inland Fisheries and Wildlife. 23 pp. Mimeo.
_____ 2008. Richardson Lakes Fishery Management. Interim Summary Report No. 6 (2003-2005).
Maine Department Inland Fisheries and Wildlife. 23 pp. Mimeo.
SAS [computer software]. Cary, North Carolina: SAS Institute, Inc., diskettes and manuals.
Page 9
8
Table 1. Stocking and regulation history, Richardson Lakes, 2000-2010.
Year Stocking History Special Regulations
2000
2,500 SY LLS
25,760 FR BKT
10,000 FF BKT
No live fish as bait. BKT: 2 fish, min. length 10 in., only 1
may exceed 12 in. LLS and LKT: general law.
2001 2,500 SY LLS
5,000 FR BKT Same as previous year.
2002 1,500 SY LLS Same as previous year.
2003 2,500 SY LLS
6,500 FR BKT Same as previous year.
2004 2,500 SY LLS
4,900 FR BKT Same as previous year.
2005 2,500 SY LLS
12,850 FR BKT
Same as previous year except lake and tributaries closed to the
taking of smelts from midnight until noon each day.
2006 3,956 SY BKT Same as previous year.
2007
1,700 SY LLS
2,590 FR BKT
92 AD BKT
Same as previous year except lake and tributaries closed to the
taking of smelts.
2008
1,700 SY LLS
3,800 FF BKT
198 FY BKT
127 AD BKT
Same as previous year.
2009 1,658 FY LLS Same as previous year.
2010
1,892 FY LLS
2,750 SY BKT
2,000 FF BKT
175 FY BKT
Same as previous year.
LLS = landlocked salmon; BKT = brook trout; LKT = lake trout;
FR = fry; FF = fall yearlings; FY = fall yearling; SY = spring yearlings; AD = adult;
Page 10
9
Figure 1. Angler Use at the Richardson Lakes
0
2000
4000
6000
8000
10000
12000
14000
1986 1991 1996 1998 2002 2007 2010
An
gle
r t
rip
s
Page 11
10
Table 2. Stratified random clerk surveys, 1999-2010. CENSUS YEAR
Statistics Species 1999 2002 2003 2004 2007 2010
No. anglers surveyed 209 110 123 61 122 105
No. angler hours 994 474 643 353 809 575
No.anglers (and %)
successful in catching a
legal fish
LLS
LKT
BKT
33 (16)
16 (8)
14 (7)
10 (9)
9 (8)
4 (4)
24 (20)
3 (2)
4 (3)
11 (18)
0
5 (8)
38 (31)
13 (11)
19 (16)
13 (12)
2 (2)
23 (22)
No. legal fish kept
LLS
LKT
BKT (all)
10-12 in
GE 12 in
17
14
10
3
7
5
8
1
1
0
7
1
1
0
1
3
0
1
1
0
16
3
12
6
6
4
0
14
12
2
No. (and %)
Legal fish
released
LLS
LKT
BKT (all)
10-12 in
GE 12 in
3 (60)
0 (0)
6 (38)
4
2
20 (80)
7 (47)
3 (75)
3 (75)
0
39 (85)
2 (67)
23 (96)
16 (100)
7 (88)
26 (90)
0
3 (75)
0
100 (86)
17 (86)
23 (66)
20 (77)
3 (33)
15 (79)
2 (100)
35 (71)
33
2
No. (and %) sublegal
fish released
LLS
LKT
BKT
102 (69)
10 (32)
7 (30)
80 (76)
0
2 (33)
149 (76)
0
15 (38)
85 (75)
0
7 (64)
73 (39)
3 (13)
24 (41)
53 (74)
3 (60)
17 (26)
No. legal fish per angler
(only those kept)
LLS
LKT
BKT
0.01
0.07
0.08
0.24
0.14
0.04
0.37
0.02
0.20
0.48
0
0.07
0.95
0.17
0.29
0.18
0.02
0.47
Hours to catch a legal
fish (all legal fish
caught)
LLS
LKT
BKT
49.7
71.0
62.1
19.0
31.6
118.5
14.0
214.3
26.8
12.2
0
88.3
7.0
40.5
23.1
30.2
287.3
11.7
Mean length in
inches±SE (and no.)
fish
LLS
LKT
BKT
16.6±0.4
(20)
24.7±0.4
(11)
14.5±1.3
(10)
16.0±0.5
(5)
26.7±1.5
(8)
10.8
(1)
16.5±0.4
(8)
31.1
(1)
14.0
(1)
16.9
(1)
21.1
(1)
10.6
(1)
17.5±0.6
(14)
23.6±2.3
(3)
13.7±1.0
(12)
17.2±0.8
(4)
*
*
11.7±0.5
(14)
Mean weight in lbs±SE
(and no.) of fish
sampled
LLS
LKT
BKT
1.7±0.2
(18)
6.4±0.4
(11)
1.6±0.6
(10)
1.4±0.2
(5)
6.7±0.8
(7)
0.5
(1)
1.5±0.1
(8)
11.0
(1)
1.0
(1)
1.5
(1)
3.3
(1)
0.4
(1)
1.9±0.2
(13)
5.1±1.5
(3)
1.3±0.4
(12)
1.7±0.2
(4)
*
*
0.66±0.0
(14)
Estimated total fish
harvested ± CI (@95%)
during survey period
LLS
LKT
BKT
344±51
551±82
69±10
. 758±155
117±24
583±120
151±26
0
490±84
Estimated total angler days ± CI (@95%)
during survey period
. 6,882
(5,863-7,901)
. . 5,828
(4,637-7,019)
8,455
(7,159-9,751)
Page 12
11
Table 3. Voluntary angler surveys, 2006-2010.
CENSUS YEAR
Statistics Species 2006 2007 2008 2009 2010
No. anglers
surveyed 49 69 30 30 44
No. angler hours 313 223.25 162.5 151 165
No. anglers(and %)
successful in
catching a legal fish
LLS
LKT
BKT
15 (30)
19 (39)
20 (41)
19 (28)
13 (19)
24 (35)
18 (60)
4 (13)
15 (50)
7 (23)
4 (13)
16 (53)
28 (64)
2 (5)
25 (57)
No. legal fish kept
LLS
LKT
BKT
4
2
0
12
9
10
0
0
0
5
4
1
6
1
3
No. (and %) legal
fish released
LLS
LKT
BKT10-
12”
BKT>12”
11 (73)
22 (92)
6 (26)
17 (74)
19 (61)
6 (40)
13 (72)
17 (77)
30 (100)
4 (100)
13 (100)
4 (100)
9 (64)
0
43 (100)
22 (96)
46 (88)
4 (80)
18 (90)
13 (93)
No. (and %)
sublegal
fish released
LLS
LKT
BKT
41 (73)
0
4 (15)
20 (39)
0
7 (15)
0
0
1 (6)
15 (52)
0
18 (21)
40 (44)
1 (17)
10 (23)
No. legal fish per
angler(only those
kept)
LLS
LKT
BKT
0.31 (0.08)
0.49 (0.04)
0.47 (0)
0.45 (0.17)
0.22 (0.13)
0.58 (0.14)
1 (0)
0.13 (0)
0.57 (0)
0.47 (0.17)
0.13 (0.13)
2.20 (0.03)
1.18 (0.14)
0.11 (0.02)
0.77 (0.07)
Hours to catch a
legal fish(all legal
fish caught
LLS
LKT
BKT
9.2
43.1
10.4
7.2
14.9
5.6
5.4
40.6
9.6
10.8
37.8
2.3
3.2
33.0
4.9
Mean length in
inches ± SE(and no.)
fish sampled or
reported
LLS
LKT
BKT
16.6±0.4 (24)
23.4±1.1 (6)
13.9±0.8 (25)
16.1±0.3(27)
22.8±1.3 (15)
13.4±0.4 (39)
16.8±0.3 (30)
14.3±0.7 (12)
16.6±0.6 (12)
32.1±0.3 (4)
12.6±0.2 (69)
15.3±0.2 (51)
24.4±2.1 (5)
12.8±0.4 (29)
Page 13
12
Table 4. Average size by age of hatchery salmon sampled by clerks at Richardson Lakes, summers of 1999-2010.
Ages
Year Variable III+ IV+ V+ VI+ VII+ All
1999
Length 15.8±0.4 17.2±0 16.1±0.4
Weight 1.4±0.1 1.7±0.1 1.4±0.1
Condition 0.94±0.01 0.95±0.06 0.94±0.01
No. 7 2 9
Mark Ad RV All
2002
Length 17.4 16.5 17.0±0.5
Weight 2.2 1.5 1.8±0.4
Condition 1.16 0.89 1.03±0.14
No. 1 1 2
Mark BV LV
2003
Length 16.4±0.1 16.4±0.1
Weight 1.5±0.4 1.5±0.4
Condition 0.89±0.03 0.89±0.03
No. 2 2
Mark Ad
2004
Length 16.9 16.9
Weight 1.5 1.5
Condition 0.88 0.88
No. 1 1
Mark Ad
2007
Length 15.2 18.9±0.1 20.2 17.2±0.7 17.8±0.8
Weight 1.2 2.4±0.7 3.2 1.8±0.3 2.1±0.3
Condition 0.94 0.97±0.0 1.07 0.99±0.05 0.99±0.03
No. 1 2 1 3 7
Mark Ad LV RV Ad
2010
Length 15.3 19.0 17.1±1.9
Weight 1.2 2.0 1.6±0.4
Condition 0.94 0.80 0.87±0.07
No. 1 1 2
Mark BV AD
Page 14
13
Table 5. Average size by age of hatchery salmon sampled by trapnetting at Richardson Lakes, falls of 1999-2010.
Ages
Year Variable I+ II+ III+ IV+ V+ VI+ All
1999
Length 12.0±0.4 16.7 19.4±0.7 13.6 15.6±1.3
Weight 0.4±0.07 1.3 2.3±0.3 0.6 1.3±0.3
Cond. 0.68±0.04 0.78 0.85±0.05 0.68 0.76±0.04
No. 3 1 3 1 8
2001
Length 10.4±0.2 15.6±1.9 15.4±0.4 18.1±0.4 21.7±2.2 22.4 15.8±0.5
Weight 0.3±0.01 1.4±0.6 1.1±0.1 2.1±0.2 3.6±1.2 4.3 1.5±0.2
Cond. 0.69±0.02 0.81±0.06 0.82±0.03 0.93±0.02 0.93±0.05 1.05 0.84±0.02
No. 10 5 13 18 2 1 49
2005
Length 11.1±7.2 12.5±0.6 13.9±0.2 16.1±1.3 12.8±0.3
Weight 0.4±0.01 0.6±0.1 0.8±0.05 1.4±0.4 0.7±0.06
Cond. 0.82±0.04 0.79±0.03 0.83±0.01 0.84±0.08 0.82±0.02
No. 14 7 14 4 39
2006
Length 12.2 15.6±0.81 16.7±1.0 15.6 15.4±0.63
Weight 0.35 1.2±0.22 1.2±1.0 1.1 1.08±0.17
Cond. 0.537 0.827±0.04 0.857 0.805 0.792±0.05
No. 1 5 2 1 9
2008
Length 11.0±0.03 12.6±0.3 19.1±0.29 21.6 19.9 16.1±0.63
Weight 0.37±0.01 0.57±0.03 2.3±0.12 3.56 2.62 1.6±0.17
Cond. 0.78±0.03 0.79±0.03 0.90±0.17 0.98 0.92 0.86±0.02
No. 5 11 18 1 1 36
2010
Length 14.1±0.1 14.6±0.2 17.2±1.4 20.3±0.5 14.5±0.2
Weight 0.76±0.0 0.94±0.1 1.53±0.1 2.64±0.2 0.87±0.0
Cond. 0.74±0.02 0.83±0.02 0.81±0.02 0.86±0.02 0.76±0.04
No. 86 17 2 4 109
Page 15
14
Table 6. Average size by age of wild salmon sampled by clerks at Richardson Lakes, summers of 1999-2010.
Ages
Year Variable IV+ V+ VI+ VII+ VIII+ All
1999
Length 13.9 16.9 16.7±0.3 18.0±2.5 18.7±0.2 17.2±0.7
Weight . . 1.7±0.3 2.6±1.4 2.0±0.1 2.1±0.4
Cond. . . 0.99±0.13 1.10±0.18 0.84±0.02 0.98±0.07
No. 1 1 2 2 2 8
2002
Length 14.6 15.7±0.1 15.4±0.4
Weight 0.9 1.2±0.8 1.1±0.1
Cond. 0.77 0.87 0.84±0.04
No. 1 2 3
2003
Length 17.1 16.7±1.2 16.8±0.7
Weight 1.8 1.2±0.1 1.4±0.2
Cond. 0.973 0.71±0.12 0.80±0.11
No. 1 2 3
2004
Length 19.2 19.2
Weight . .
Cond. . .
No. 1 1
2007
Length 15.0 18.0±1.5 16.9±2.5 17.9±0.4 17.2±0.8
Weight 1.1 1.9±0.5 2.5 1.5±0.03 1.7±0.2
Cond. 0.93 0.89 0.95 0.74 0.86±0.04
No. 1 2 2 2 7
2010
Length 16.7 17.7 17.2
Weight 1.8 1.8 1.8
Cond. 1.04 0.88 0.96±0.08
No. 1 1 2
Page 16
15
Table 7. Average size by age of wild salmon sampled by trapnetting at Richardson Lakes, falls of 1999-2010.
Ages
Year Variable II+ III+ IV+ V+ VI+ VII+ All
1999
Length 16.1±2.2 19.1 17.1±1.6
Weight 1.2±0.5 1.9 1.4±0.4
Cond. 0.75±0.02 0.75 0.75±0.01
No. 2 1 3
2001
Length 11.3±0.6 12.0±0.3 14.0±0.5 16.2±1.2 18.7 13.3±0.4
Weight 0.4±0.04 0.4±0.03 0.8±0.1 1.3±0.4 1.8 0.7±0.1
Cond. 0.66±0.03 0.67±0.04 0.77±0.04 0.77±0.08 0.75 0.72±0.02
No. 4 12 11 4 1 32
2005
Length 11.9 11.8 13.0±0.3 13.7±1.1 13.0±0.4
Weight 0.5 0.4 0.6±0.1 0.8±0.2 0.6±0.01
Cond. 0.76 0.71 0.72±0.04 0.71±0.06 0.72±0.02
No. 1 1 5 4 11
2006
Length 13.4 13.8 13.6±0.197
Weight 0.67 0.771 0.716±0.055
Cond. 0.763 0.816 0.960±0.082
No. 1 1 2
2008
Length 9.1±2.3 12.1±0.1 13.5±0.4 14.7±0.4 16.9±0.2 15.8 13.8±0.5
Weight 0.2±0.1 0.5±0.0 0.7±0.1 0.9±0.1 1.4±0.2 1.0 0.8±0.1
Cond. 0.87±0.22 0.70±0.02 0.82±0.02 0.77±0.03 0.80±0.08 0.73 0.78±0.02
No. 2 4 5 10 2 1 24
2010
Length 10.8±0.3 13.7±0.9 13.5±0.9 19.02 13.4±0.7
Weight 0.3±0.0 0.8±0.2 0.7±0.2 1.65 0.7±0.1
Cond. 0.76±0.08 0.81±0.03 0.70±0.04 0.67 0.74±0.03
No. 3 4 6 1 14
Page 17
16
Table 8. Average size and age of hatchery-reared lake trout sampled by clerks at Richardson Lakes,
summers of 1999-2010.
Ages
Year Variable V+ VIII+ XII+ XV+ All
1999
Length 24.7±0.4 24.7±0.4
Weight 6.2±0.4 6.2±0.4
Cond. 1.13±0.03 1.13±0.03
No. 10 10
Mark LP LP
2002
Length 28.9±0.9 34.3 30.7±1.9
Weight 8.9±0.9 . 8.9±0.9
Cond. 1.02±0.01 1.02±0.01
No. 2 1 3
Mark LP LV
2003
Length 31.1 31.1
Weight 11.0 11.0
Cond. 1.02 1.02
No. 1 1
Mark RV
Table 9. Average size and age of hatchery-reared lake trout sampled by trapnetting at Richardson Lakes, falls of 1999-2010.
Ages
Year Variable V+ VII+ VIII+ XI+ XII+ XIV XVI All
1999
Length 24.7±0.6 27.3 30.5±0.7 26.5±0.9
Weight 5.4±0.5 9.5 9.5±0.3 6.6±0.7
Cond. 0.96±0.04 1.29 0.99±0.06 1.00±0.04
No. 7 1 3 11
2001
Length 26.9±0.5 26.9±0.5
Weight 6.7±0.6 6.7±0.6
Cond. 0.95±0.04 0.95±0.04
No. 5 5
2005
Length 27.9 27.9
Weight 8.0 8.0
Cond. 1.02 1.02
No. 1 1
2008
Length 32.4 32.4
Weight 12.0 12.0
Cond. 0.97 0.97
No. 1 1
2010
Length 30.8 30.8
Weight 9.0 9.0
Cond. 0.86 0.86
No. 1 1
Page 18
17
Table 10. Average size and age of wild lake trout sampled at Richardson Lakes, summers of 1999-2010.
Ages
Year Method Variable V+ VII+ VIII+ All
1999 Clerk survey
Length 24.8 24.8
Weight 7.9 7.9
Condition 1.44 1.44
No. 1 1
2002* Clerk survey
Length 23.9±2.1
Weight 6.4±1.9
Condition 1.26±0.04
No. 2
2004 Clerk survey
Length 21.2 21.1
Weight 3.3 3.3
Condition 0.97 0.97
No. 1 1
2007 Clerk survey
Length 17.5±0.4 17.5±0.4
Weight 1.5±0.03 1.5±0.03
Condition 0.75±0.06 0.75±0.06
No. 2 2
2007 Gillnet
Length 18.9±0.4 18.9±0.4
Weight 2.2±0.12 2.2±0.12
Condition 0.88±0.03 0.88±0.03
No. 5 5
2008* Trapnet
Length 23.6
Weight 4.2
Condition 0.88
No. 1
*Note: Age unknown
Page 19
18
Table 11. Average size and age of brook trout sampled at Richardson Lakes, summers of 1999-2010
Ages
Year Method Variable I+ II+ III+ IV+ V+ All
1999 Clerk
survey
Length 11.8±0.7 13.2 18.9 14.5±1.3
Weight 0.6±0.1 0.9 2.4 1.6±0.6
Cond. 1.04±0.11 1.06 1.00 1.07±0.07
No. 4 1 1 10
2002 Clerk
survey
Length 10.8 10.8
Weight 0.5 0.5
Cond. 1.034 1.034
No. 1 1
2003 Clerk
survey
Length 14.0 14.0
Weight 1.0 1.0
Cond. 1.01 1.01
No. 1 1
2004 Clerk
survey
Length 10.6 10.6
Weight 0.4 0.4
Cond. 0.91 0.91
No. 1 1
2007 Clerk
survey
Length 12.2±0.6 11.6±0.4 14.4±2.1 17.7 13.0±0.7
Weight 0.7±0.2 0.6±0.1 1.6±0.6 2.4 1.0±0.2
Cond. 1.08±0.07 0.97±0.04 1.17±0.02 1.21 1.07±0.04
No. 4 4 2 1 11
2007 Gillnet
Length 12.2±2.2 11.4 11.9±1.3
Weight 0.7±0.5 0.5 0.6±0.3
Cond. 0.88±0.18 0.87 0.87±0.10
No. 2 1
2010 Clerk
survey
Length 11.2±0.4 10.4 11.6±0.6 11.3±0.2 16.6 11.7±0.5
Weight 0.5±0.1 0.4 0.6±0.1 0.5±0.0 2.0 0.6±0.1
Cond. 1.00±0.02 0.914 0.98±0.05 0.94±0.02 1.20 0.99±0.03
No. 3 1 6 3 1 14
Page 20
19
Table 12. Average size by age of brook trout sampled by trapnetting at Richardson Lakes, falls of 1999-2010.
Ages
Year Variable 0+ I+ II+ III+ IV+ V+ VI All
1999
Length 8.1±0.2 14.6 15.0±0.6 11.5±1.3
Weight 0.2±0.01 1.1 1.1±0.2 0.6±0.2
Condition 0.91±0.03 0.98 0.92±0.04 0.92±0.02
No. 4 1 3 8
2001
Length 8.7±0.3 11.1±0.3 17.1±0.7 12.3±1.3
Weight 0.2±0.01 0.4±0.04 1.8±0.3 0.8±0.3
Condition 0.87±0.09 0.78±0.03 1.01±0.09 0.89±0.05
No. 3 3 3 9
2005
Length 6.1 9.2±0.5 10.8±0.6 6.5 9.3±0.5
Weight . 0.2±0.02 0.5±0.1 0.1 0.3±0.1
Condition . 0.78±0.09 0.91±0.04 1.34 0.89±0.06
No. 2 6 7 1 16
2006
Length 9.7±0.2 11.0 10.1±0.5
Weight 0.2±0.0 0.3 0.3±0.0
Condition 0.676±0.004 0.683 0.678±0.003
No. 2 1 3
2008
Length 6.9 9.3±0.3 13.0±0.5 16.4 18.3 12.2±0.6
Weight 0.1 0.2±0.0 0.7±0.1 1.3 2.4 0.7±0.1
Condition 1.01 0.82±0.03 0.82±0.03 0.80 1.08 0.84±0.02
No. 1 6 16 1 1 25
2010
Length 10.8±0.2 10.9±0.5 11.2±0.4 14.3 16.1±0.6 22.4 11.6±0.4
Weight 0.4±0.0 0.4±0.1 0.4±0.0 0.8 1.3±0.2 4.5 0.6±0.1
Condition 0.81±0.03 0.77±0.02 0.77±0.02 0.75 0.84±0.01 1.11 0.80±0.02
No. 20 13 4 1 3 1
Page 21
20
Table 13. Smelt spawning observations, Richardson Lake tributaries, 1997-2010
Date Tributary Abundance/comments
5/4/97 Metallak Brook Good run
5/4/97 Mill Brook Good run
4/15/98 Mill Brook Run just beginning
4/27/98 Mill Brook No eggs seen; poor run
5/3/99 Mill Brook Light to moderate egg deposition
4/21/00 Mill Brook Good run
5/2/00 Metallak Brook Light to moderate egg deposition
5/3/00 Mill Brook Moderate egg deposition
4/16/01 Upper Dam Light egg deposition
4/28/01 Mill Brook Heavy run
5/3/01 Mill Brook Moderate egg deposition
5/8/01 Mill Brook Water low; smelt spawning in lake
4/21/02 Mill Brook Poor run
5/6/04 Mill Brook No eggs
4/25/05 Mill Brook Light run
4/25/05 Metallak Brook Moderate run
5/5/05 Mill Brook No eggs observed
5/16/05 Mill Brook SCUBA survey: most eggs in 1.5-3’ of
water along east bank; some eggs 6-8’
deep; most had hatched.
4/18-21/06 Metallak Brook Poor run
4/18-22/06 Mill Brook Poor run
4/26/07 Mill Brook No SLT sign, high water
4/31/07 Mill Brook Few SLT
5/16/07 Metallak Brook Moderate egg deposition – high water
5/6/08 Mill Brook No eggs or SLT
5/6/08 Metallak Brook No eggs observed
4/28/09 Mill Brook Good run
4/28/09 Metallak Brook No eggs observed
4/13/10 Mill Brook Good run
4/22/10 Metallak Brook Light to Mod egg deposition, pockets of heavy