52
Page 1 by JOHN GUSCIC, Managing Director August 31, 2017

Page 1
by JOHN GUSCIC, Managing Director
August 31, 2017

B2C TRAVEL
Leading online consumer travel brands
Webjet
• Market leading OTA in Australia and New Zealand
Online Republic
• Global coverage in online Rental Car hire and Motorhomes
• Australasian leader in online Cruise
B2B TRAVEL - WebBeds
Online fulfillment of hotel bookings for our travel industry partners
WebBeds Global Coverage:
• Europe – Sunhotels; JacTravel
• MEA – Lots of Hotels (LOH)
• Americas – LOH; JacTravel
• Asia – FIT Ruums; JacTravel
spanning both consumer markets (through B2C)
and global wholesale markets (through B2B)
Page 3
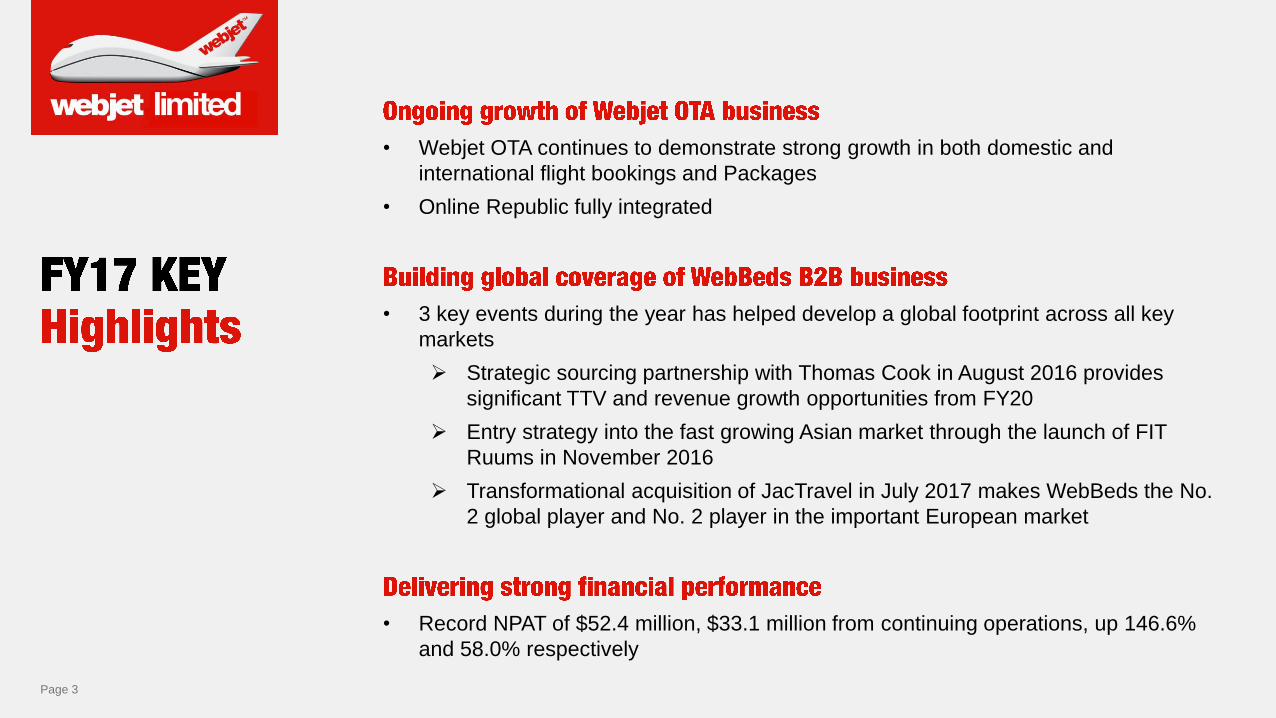
• Webjet OTA continues to demonstrate strong growth in both domestic and
international flight bookings and Packages
• Online Republic fully integrated
• 3 key events during the year has helped develop a global footprint across all key
markets
➢ Strategic sourcing partnership with Thomas Cook in August 2016 provides
significant TTV and revenue growth opportunities from FY20
➢ Entry strategy into the fast growing Asian market through the launch of FIT
Ruums in November 2016
➢ Transformational acquisition of JacTravel in July 2017 makes WebBeds the No.
2 global player and No. 2 player in the important European market
• Record NPAT of $52.4 million, $33.1 million from continuing operations, up 146.6%
and 58.0% respectively

Page 4
Continues to gain market
share in Middle East;
North America gaining
momentum
New markets delivering
growth; Thomas Cook
contracts novating across
to WebBeds system
From start up to $90
million annualised TTV
run rate in just 8 months
Continues to gain share;
bookings growth more than
6 times the market
Robust bookings growth;
providing car hire for Webjet
since January 2017

Page 5

Page 6
• On 28 July 2017 Webjet notified the market of a disagreement with its auditor, BDO Audit (SA) Pty Ltd
(BDO), on a technical accounting matter relating to its financial statements for the year ending 30 June
2017
• In August 2016, Webjet entered into an agreement with Thomas Cook as preferred supplier for the majority
of the volume of Thomas Cook’s complementary hotel business (Contract). Webjet paid £21 million to
Thomas Cook for the transfer of around 3,000 hotel contracts and for the implementation costs of the deal
• During a 2 year "transitional period", Thomas Cook agreed to pay Webjet a fixed management fee (in
instalments) in order to retain access to the hotel contracts. Thereafter, Thomas Cook will pay a volume
based fee
• The accounting treatment applied by Webjet was to record an intangible asset (10 year amortisation), and
to recognise the fixed management fee as revenue on a monthly straight-line basis over the transitional
period. The volume based fee (post transitional period) will be treated as revenue on an accrual basis
⁻ intangible asset amortised over 10 years based on the assessment of the economic life of the hotel
contracts
• In completing its half year review, BDO accepted this treatment in its Independent Auditor’s Review Report
in respect of Webjet’s 31 December 2016 financial statements (lodged on 22 February 2017)
• Subsequently, BDO advised Webjet that it may no longer agree with the above accounting treatment (i.e. it
being recorded as an intangible asset) and the recognition of the fixed management fee as income. On 27
July 2017, BDO advised Webjet of its final decision in which it confirmed that it had indeed amended its
determination concerning the accounting treatment of the Thomas Cook contract and the transactions
under that contract
• Further to the announcement on 28 July 2017, the Company has engaged with its advisors and ASIC in
respect to its disagreement with the auditor in relation to the technical accounting treatment related
specifically to the Thomas Cook agreement
Page 7
• Since 28 July 2017, Webjet has worked closely with its financial and accounting advisors
and with ASIC to resolve the most appropriate way to account for this transaction
• Webjet has decided to adopt BDO’s treatment
• Webjet’s leadership team is better engaged in focusing on executing its growth strategy and
integrating JacTravel without the distraction of a protracted debate over a technical
accounting matter that has no bearing on future cash flows or the economics of the Thomas
Cook agreement
• In any event, the issue only relates to management fee payments received during the
transition period ending May 2019

Page 8
Statutory Result
FY17 FY16 FY17 FY16
$m $m $m % $m $m $m %
TTV 2,043 1,630 413 25.3% 1,950 1,437 513 35.7%
Revenue 218.7 154.5 64.2 41.5% 188.8 137.6 51.2 37.2%
Revenue as Principal 16.2 0.0 16.2 n/a 16.2 0.0 16.2 n/a
Total Revenue 234.9 154.5 80.3 52.0% 204.9 137.6 67.3 48.9%
EBITDA 69.9 36.6 33.2 90.7% 51.0 36.3 14.6 40.3%
EBIT 61.7 30.6 31.0 101.4% 44.1 30.3 13.8 45.4%
PBT 61.6 30.1 31.5 104.6% 44.0 29.8 14.2 47.6%
NPAT 52.4 21.3 31.2 146.6% 33.1 21.0 12.2 58.0%
EPS (cents)
- Basic 53.8 26.2 27.6 105.5% 34.0 26.2 7.8 29.8%
- Diluted 52.9 25.8 27.1 105.1% 33.4 25.8 7.6 29.6%
Margins (1)
Revenue Margin 10.7% 9.5% 12.9% 9.7% 9.6% 1.1%
EBITDA Margin 32.0% 23.7% 34.8% 27.0% 26.4% 2.2%
Marketing % TTV 1.7% 1.8% (7.5%) 1.5% 1.8% (16.1%)
Marketing % Revenue 14.5% 19.0% (23.8%) 14.7% 19.2% (23.5%)
Effective Tax Rate 14.9% 29.4% (49.3%) 24.8% 29.7% (16.7%)
Continuing Operations (2)
Incr / (Decr)Incr / (Decr)
TTV Revenue
EBITDA
PBT NPAT
Costs
35.7% 37.2%
36.1% 40.3%
47.6% 58.0%
(1) Revenue margin excludes revenue from Webjet Exclusives acting as principal.(2) Continuing operations exclude Zuji, proceeds from sale of Zuji and one-off adjustments including change in accounting treatment for Exclusives
now acting as principal, termination of car hire contract, performance rights and related incentives

Page 9
Group TTV (continuing) up 35.7%
• B2C TTV up 34.5%
• Webjet TTV up more than 15%
• First full year contribution from Online Republic
• B2B TTV up 39.5%
• Both LOH and Sunhotels up more than 33%
Group EBITDA (continuing) up 40.3%
• B2C EBITDA up 50.3%
• Webjet EBITDA up 14%
• Online Republic up 25%
• B2C EBITDA margin up 5.5%
• B2B EBITDA $0.4m, down 89.7%, includes
• Significant OPEX in the delivery of our obligations
under Thomas Cook services agreement
• $3.8 million investment in launch of Fit Ruums
• Underlying B2B FY17 EBITDA (inclusive of Thomas
Cook) $11.9 million up 248%
• Corporate costs separated out to better demonstrate
underlying performance of B2C and B2B divisions
• Effective tax rate 24.8%. Long term effective tax rate
expected to be 20-25%
(1) Continuing operations exclude Zuji,
proceeds from sale of Zuji and one off
adjustments including change in
accounting treatment for Exclusives now
acting as principal, termination of car hire
contact, performance rights & related
incentives
(2) To demonstrate underlying performance on
a comparative basis, FY17 B2C revenue
and revenue margins exclude $16.2 million
revenue earned by Webjet Exclusives
acting as Principal
Continuing Operations (1) FY17 FY16
$m $m $m %
TTV
Webjet 1,141 990 152 15.3%
Online Republic 267 22 245 1096.4%
Zuji 59 80 (20) (25.5%)
LOH 217 162 56 34.3%
Sunhotels 245 184 62 33.5%
Fit Ruums 19 0 19 n/a
TTV Continuing Operations 1,950 1,437 513 35.7%
Zuji HK & SG 93 193 (100) (51.9%)
Total TTV 2,043 1,630 413 25.3%
Booking
B2C 1,851 1,288 562 43.6%
B2B 726 486 240 49.4%
Segment TTV
B2C 1,468 1,092 377 34.5%
B2B 482 346 137 39.5%
Revenue
B2C 151.2 106.6 44.6 41.8%
B2B 37.6 31.0 6.6 21.3%
Operating Costs
B2C 93.0 67.9 25.1 37.0%
B2B 37.3 27.6 9.7 35.0%
Corporate 7.5 5.8 1.8 30.3%
EBITDA
B2C (2) 58.1 38.7 19.4 50.3%
B2B 0.4 3.4 (3.1) (89.7%)
Corporate (7.5) (5.8) (1.8) 30.3%
EBITDA Margin %
B2C 38.5% 36.3% 2.2% 5.9%
B2B 0.9% 11.0% (46.3%) (421.3%)
Margins
Revenue Margin 9.7% 9.6% 1.1%
EBITDA Margin 27.0% 26.4% 2.2%
Marketing % TTV 1.5% 1.8% (16.1%)
Marketing % Revenue 14.7% 19.2% (23.5%)
Effective Tax rate 24.8% 29.7% (16.7%)
Inc. / (Dec.)
Page 10
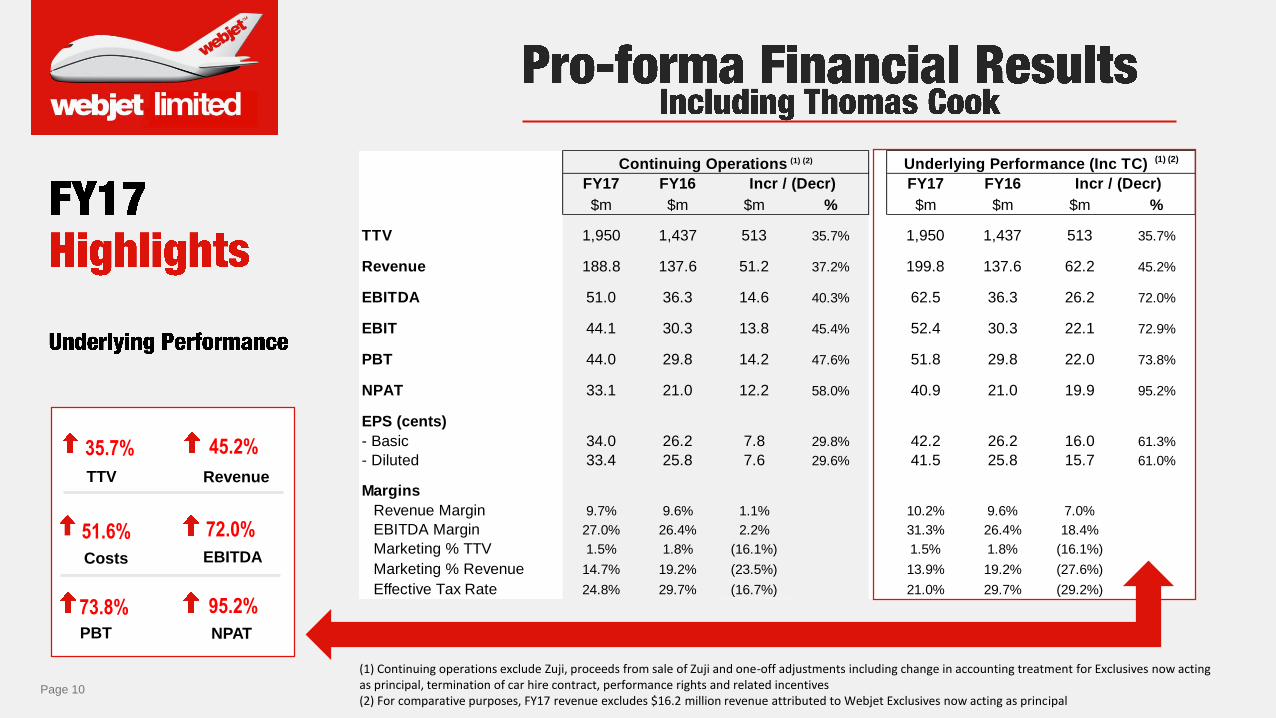
FY17 FY16 FY17 FY16
$m $m $m % $m $m $m %
TTV 1,950 1,437 513 35.7% 1,950 1,437 513 35.7%
Revenue 188.8 137.6 51.2 37.2% 199.8 137.6 62.2 45.2%
EBITDA 51.0 36.3 14.6 40.3% 62.5 36.3 26.2 72.0%
EBIT 44.1 30.3 13.8 45.4% 52.4 30.3 22.1 72.9%
PBT 44.0 29.8 14.2 47.6% 51.8 29.8 22.0 73.8%
NPAT 33.1 21.0 12.2 58.0% 40.9 21.0 19.9 95.2%
EPS (cents)
- Basic 34.0 26.2 7.8 29.8% 42.2 26.2 16.0 61.3%
- Diluted 33.4 25.8 7.6 29.6% 41.5 25.8 15.7 61.0%
Margins
Revenue Margin 9.7% 9.6% 1.1% 10.2% 9.6% 7.0%
EBITDA Margin 27.0% 26.4% 2.2% 31.3% 26.4% 18.4%
Marketing % TTV 1.5% 1.8% (16.1%) 1.5% 1.8% (16.1%)
Marketing % Revenue 14.7% 19.2% (23.5%) 13.9% 19.2% (27.6%)
Effective Tax Rate 24.8% 29.7% (16.7%) 21.0% 29.7% (29.2%)
Incr / (Decr)
Underlying Performance (Inc TC) (1) (2)Continuing Operations (1) (2)
Incr / (Decr)
TTV Revenue
EBITDA
PBT NPAT
Costs
35.7% 45.2%
51.6% 72.0%
73.8% 95.2%
(1) Continuing operations exclude Zuji, proceeds from sale of Zuji and one-off adjustments including change in accounting treatment for Exclusives now acting as principal, termination of car hire contract, performance rights and related incentives(2) For comparative purposes, FY17 revenue excludes $16.2 million revenue attributed to Webjet Exclusives now acting as principal

Page 11
Cash balance
• $178.1 million as at 30 June
2017 includes $21.2 million of
client funds
• $116.2 million as at 30 June
2016 includes $21.6 million of
client funds
Working Capital
• Increases commensurate with
growth
• Trade & receivables up
$40 million
• Payables up $38.5 million
Equity
• Capital raised for Online
Republic $31million
Summary Balance Sheet Jun-17 Jun-16 Change
$m $m $m
Cash & equivalents 178.1 116.2 61.9
Trade & receivables 120.8 80.8 40.0
Other current assets 40.9 9.4 31.5
Non-current assets 155.7 171.6 (15.9)
Total Assets 495.5 378.0 117.5
Trade & payables 184.6 146.1 38.5
Other current liabilities 43.8 51.0 (7.2)
Non-current liabilities 50.8 29.2 21.5
Equity 216.3 151.7 64.7
Page 12
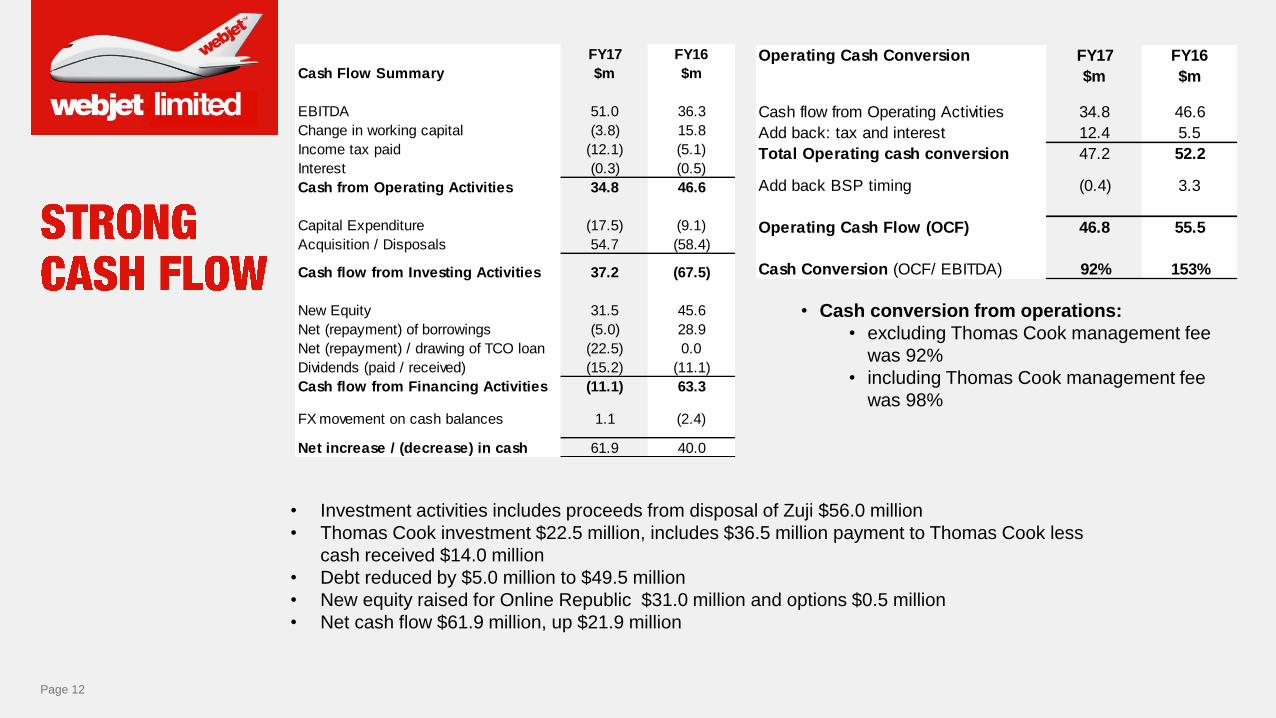
• Investment activities includes proceeds from disposal of Zuji $56.0 million
• Thomas Cook investment $22.5 million, includes $36.5 million payment to Thomas Cook less
cash received $14.0 million
• Debt reduced by $5.0 million to $49.5 million
• New equity raised for Online Republic $31.0 million and options $0.5 million
• Net cash flow $61.9 million, up $21.9 million
• Cash conversion from operations:
• excluding Thomas Cook management fee
was 92%
• including Thomas Cook management fee
was 98%
Operating Cash Conversion FY17 FY16
$m $m
Cash flow from Operating Activities 34.8 46.6
Add back: tax and interest 12.4 5.5
Total Operating cash conversion 47.2 52.2
Add back BSP timing (0.4) 3.3
Operating Cash Flow (OCF) 46.8 55.5
Cash Conversion (OCF/ EBITDA) 92% 153%
FY17 FY16
Cash Flow Summary $m $m
EBITDA 51.0 36.3
Change in working capital (3.8) 15.8
Income tax paid (12.1) (5.1)
Interest (0.3) (0.5)
Cash from Operating Activities 34.8 46.6
Capital Expenditure (17.5) (9.1)
Acquisition / Disposals 54.7 (58.4)
Cash flow from Investing Activities 37.2 (67.5)
New Equity 31.5 45.6
Net (repayment) of borrowings (5.0) 28.9
Net (repayment) / drawing of TCO loan (22.5) 0.0
Dividends (paid / received) (15.2) (11.1)
Cash flow from Financing Activities (11.1) 63.3
FX movement on cash balances 1.1 (2.4)
Net increase / (decrease) in cash 61.9 40.0

Page 13
CAPEX• FY17 CAPEX $17.4 million, up 94.1% year-on
year
• On a like for like basis, B2B and B2C
(excluding Online Republic) CAPEX up 22%,
with the balance due to a range of initiatives
INITIATIVES
• Land & Buildings - Sunhotels office
expansion to support the Thomas Cook
contract
• Innovation - Blockchain initiative
• Corporate - Future Global finance system
• Investment - Thomas Cook intangible
asset

Page 14
.6.00¢ 6.25¢ 6.25¢ 6.50¢
7.50¢
7.00¢7.25¢ 7.25¢
8.00¢
10.00¢
FY13 FY14 FY15 FY16 FY17
Interim Final
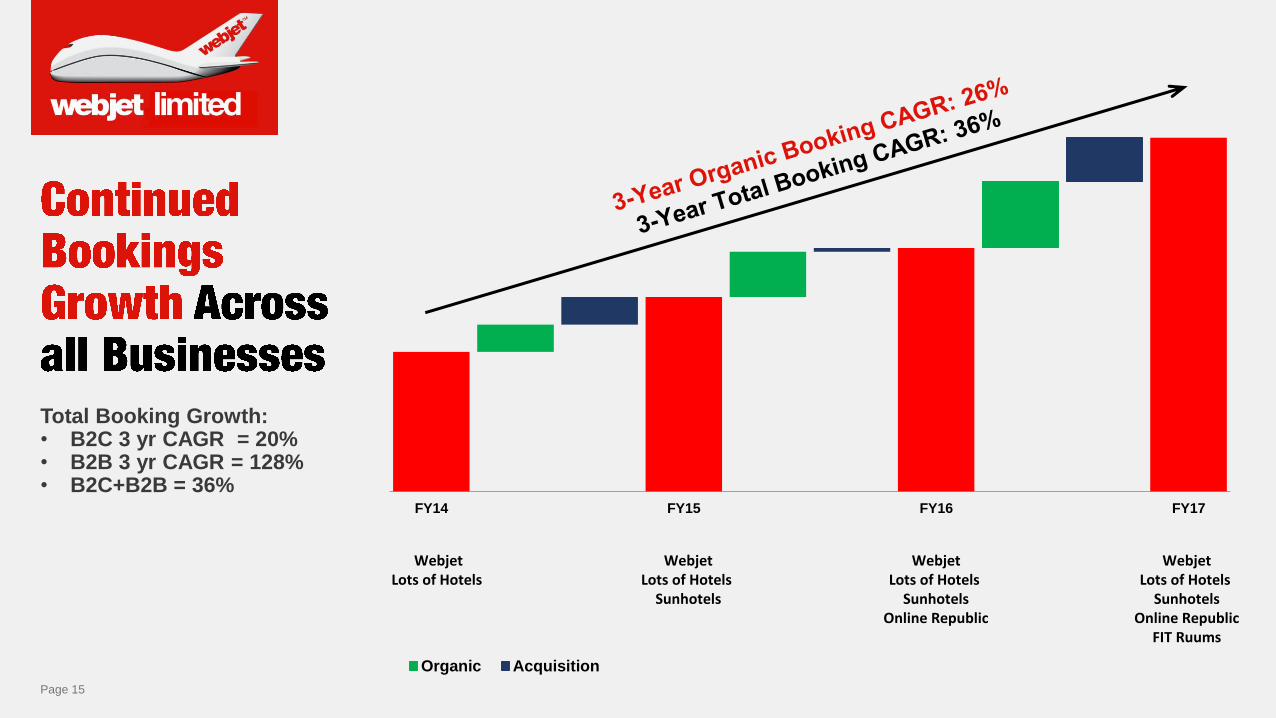
Page 15
Total Booking Growth:• B2C 3 yr CAGR = 20%• B2B 3 yr CAGR = 128%• B2C+B2B = 36%
FY14 FY15 FY16 FY17
Organic Acquisition
WebjetLots of Hotels
SunhotelsOnline Republic
FIT Ruums
WebjetLots of Hotels
SunhotelsOnline Republic
WebjetLots of Hotels
Sunhotels
WebjetLots of Hotels

Page 16
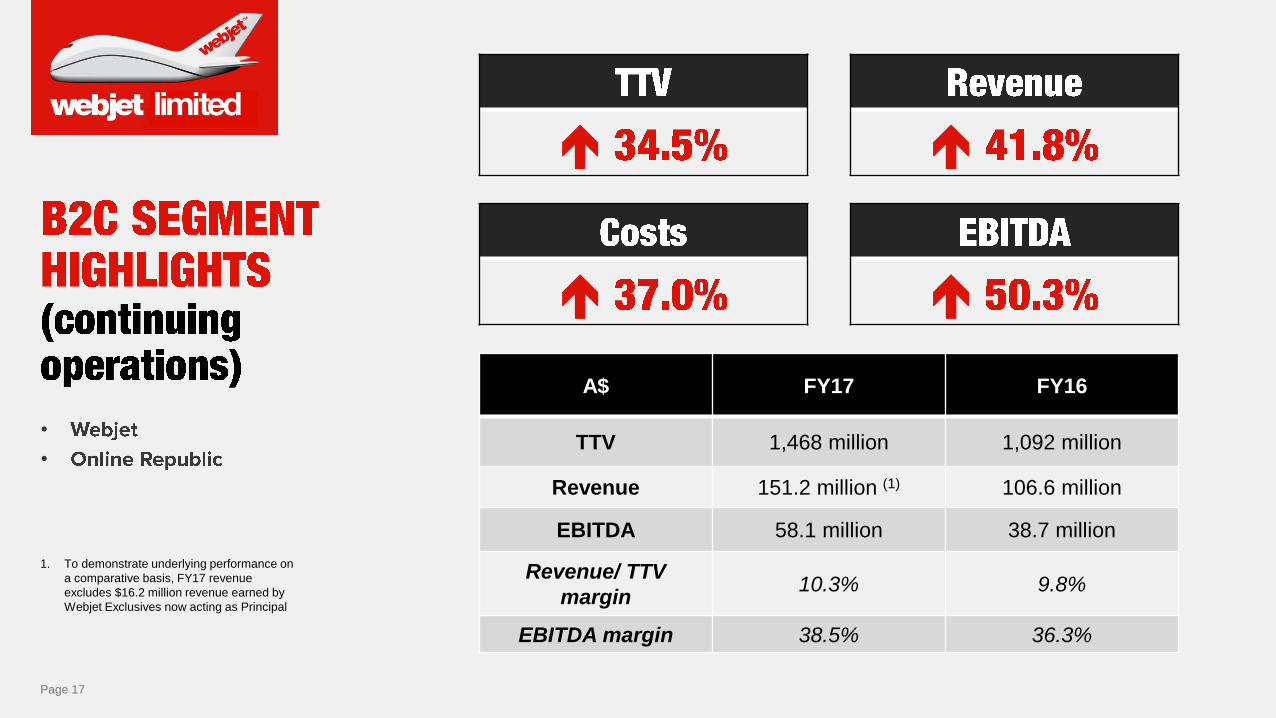
Page 17
•
•
1. To demonstrate underlying performance on
a comparative basis, FY17 revenue
excludes $16.2 million revenue earned by
Webjet Exclusives now acting as Principal
A$ FY17 FY16
TTV 1,468 million 1,092 million
Revenue 151.2 million (1) 106.6 million
EBITDA 58.1 million 38.7 million
Revenue/ TTV
margin10.3% 9.8%
EBITDA margin 38.5% 36.3%

Page 18
Page 19
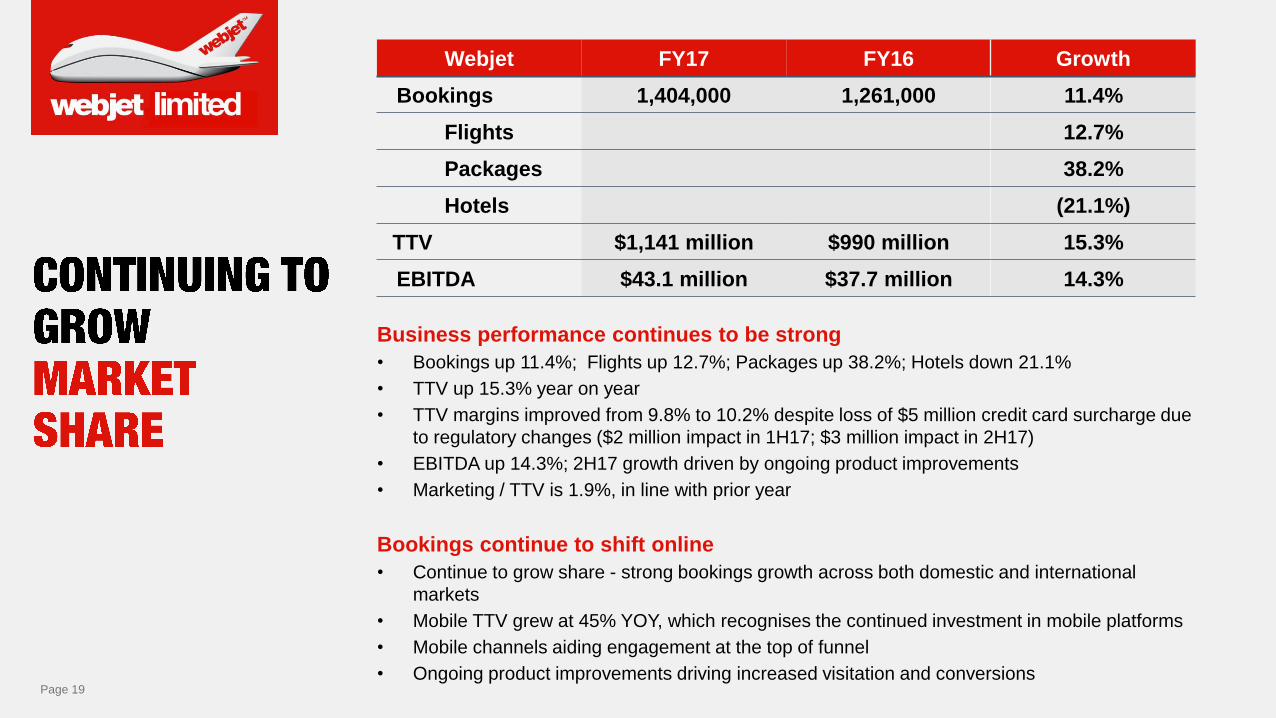
Webjet FY17 FY16 Growth
Bookings 1,404,000 1,261,000 11.4%
Flights 12.7%
Packages 38.2%
Hotels (21.1%)
TTV $1,141 million $990 million 15.3%
EBITDA $43.1 million $37.7 million 14.3%
Business performance continues to be strong
• Bookings up 11.4%; Flights up 12.7%; Packages up 38.2%; Hotels down 21.1%
• TTV up 15.3% year on year
• TTV margins improved from 9.8% to 10.2% despite loss of $5 million credit card surcharge due
to regulatory changes ($2 million impact in 1H17; $3 million impact in 2H17)
• EBITDA up 14.3%; 2H17 growth driven by ongoing product improvements
• Marketing / TTV is 1.9%, in line with prior year
Bookings continue to shift online
• Continue to grow share - strong bookings growth across both domestic and international
markets
• Mobile TTV grew at 45% YOY, which recognises the continued investment in mobile platforms
• Mobile channels aiding engagement at the top of funnel
• Ongoing product improvements driving increased visitation and conversions

Page 20
Ongoing product improvements driving increased
visitation and conversions
Enhanced understanding
of consumer
purchasing behaviours
and successful migration
to Cloud enabling
ongoing refinement of
product offering and
supply
Industry leading
merchandising
capabilities for airline
partners via display
changes and Route
Happy integration
Increased ancillary
product sales for Low
Cost Carriers meeting
consumer demand to
purchase travel their way
Broadening of payment
types (e.g. NAB rewards
pay with points option)
and voucher distribution
partners
Transition to agile
development culture
over the preceding 3
years is delivering
efficiency and rapid
innovation to market.
Also results in higher
quality product with the
ability to deploy daily
without impacting the
customer experience
UX team investment
delivering enhanced
customer driven design,
which is improving
conversion
New team, installed to
deliver superior chat,
messaging and social
engagement services
for our customers
Data and analytics teams
have been expanded to
reflect the ongoing
commitment to data
driven decision making
and customer experience
improvements
Enhanced the booking
change process/flow to
remove friction points
Implemented additional
customer survey
touchpoints to collect
real-time feedback of the
customer experience,
including voice to text
analysis capabilities
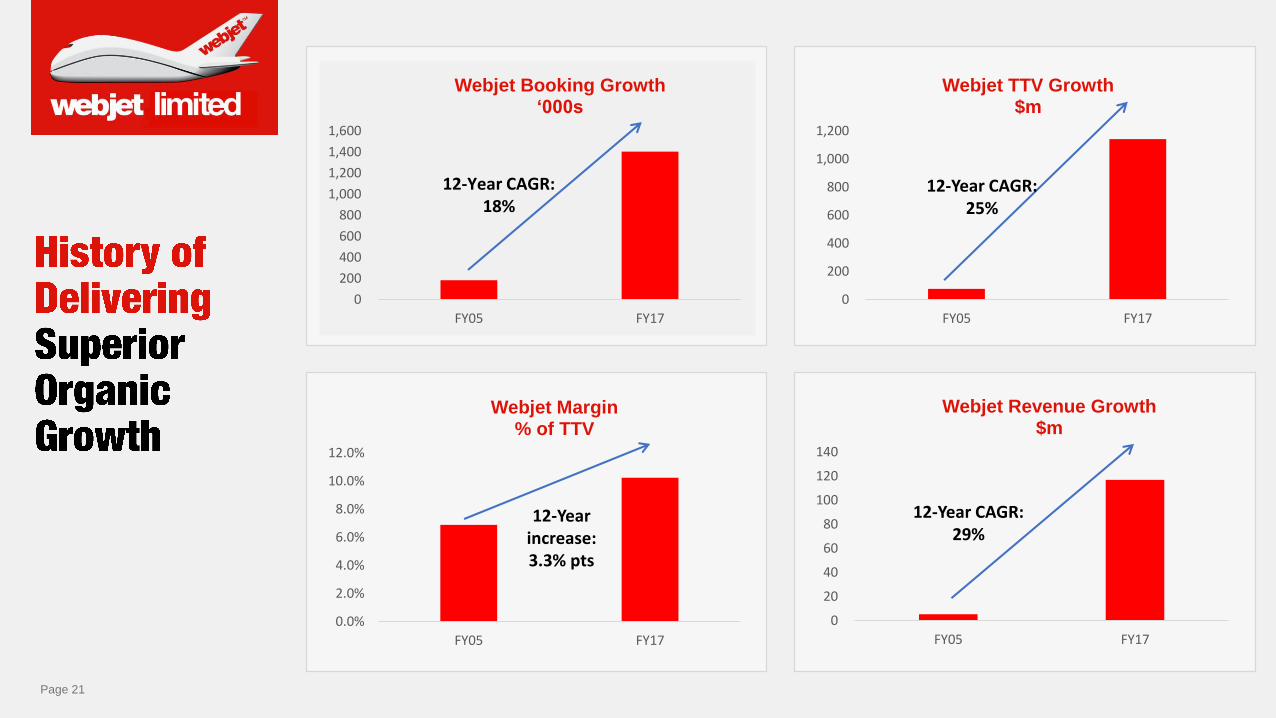
Page 21
0
200
400
600
800
1,000
1,200
1,400
1,600
FY05 FY17
Webjet Booking Growth‘000s
12-Year CAGR: 18%
0.0%
2.0%
4.0%
6.0%
8.0%
10.0%
12.0%
FY05 FY17
Webjet Margin% of TTV
0
200
400
600
800
1,000
1,200
FY05 FY17
Webjet TTV Growth$m
0
20
40
60
80
100
120
140
FY05 FY17
Webjet Revenue Growth$m
12-Year increase: 3.3% pts
12-Year CAGR: 29%
12-Year CAGR: 25%

Page 22
•
12.7%
Year-on-year
Webjet bookings
International
Domestic
11.3%
Webjet Domestic
Bookings
20.7%
Webjet International
Bookings
(1) Domestic Passenger numbers
growth – 12 months to June 2017.
Source: BITRE.
(2) Short Term Resident Departures –
12 months to June 2017 Source
Australian Bureau of Statistics
1.5%
Domestic Bookings (1)
3.7%
International
Bookings (2)
Webjet
outperforming the
market by more
than 6 times
15%
85%61%
39%
% TTV (FY17)

Page 23
• Webjet Packages allows
customers to dynamically
package flights, accommodation
and car hire to best suit their
needs
• Packages TTV up 40%;
bookings up 38% year on year
• Packages growth supported by
billboard and TV campaigns
throughout the year
• Opaque pricing of Webjet
packages enables airlines to
distribute discounted fares without
disrupting their own retail (flight
only) pricing strategies
• Exclusives separated out from
Webjet Packages during the year
to focus on Tour product offerings
• Exclusives TTV up 42%;
bookings up 5% reflecting focus
on higher value itinerary offerings
• Substantial press advertising
provides exposure for the Webjet
brand, as well as direct marketing
benefits for Exclusives
• Travel insurance and car hire
continue to demonstrate strong
TTV growth. Insurance TTV up
more than 25%. Car hire TTV up
more than 60%,
• Continual split testing of
messaging and offer presentation
in path to optimise attachment
rate
• Cruise operated through Online
Republic
• Hotels TTV decreased 19.2% in
line with strategic decision to
focus on flights and Packages and
no longer actively promote stand
alone B2C hotel offering

Page 24
Zuji was sold to Uriel Aviation Holding
Ltd, a Hong Kong based travel
technology business in November
2016
Sale completed effective 31
December 2016
Purchase price of $56 million
represented a $28.0 million gain over
the purchase price of US$25 million
Webjet is currently operating Zuji
Australia under license. It is not
material to the overall Webjet
performance.

Page 25

Page 26
Business meeting acquisition projections after first full year of ownership
• Bookings growth up 28% on pcp(1) Cars and Motorhomes growing in excess of their underlying
markets; Cruises is flat.
• TTV growth of 22%(1) with strong performance from the Cars and Motorhomes divisions.
• While Cruise performed in line with acquisition growth targets, poor regional weather impacted
demand for much of 2H17. Demand has rebounded since May 2017
• TTV margins of 10.4% was in line with pcp
• EBITDA contribution of $15 million, up 25%(1)
• Business integration comprising marketing, technology, business systems and personnel was
completed as per the integration plan, driving the FY17 EBITDA result
Key highlights
• Cars product fully integrated into Webjet
• Awarded CLIA NZ cruise agency of the year for the second year in a row
• Motorhomes saw strong growth in Northern Hemisphere destination markets
1) Figures provided represent the one month
of actual and 11 months of pre-acquisition
performance.
Online Republic FY17 FY16 (1) Change
Bookings 446,000 348,000 28%
TTV $267 million $238 million 22%
EBITDA $15.0 million $12.0 million 25%

Page 27
• Motorhomes generated
bookings growth of 22%
• Growth in foreign language
bookings provided
diversification away from
domestic Australasian
markets into northern
hemisphere markets
• Car hire generated bookings
growth of 31%
• From January 2017, car hire
through Webjet now provided
by Online Republic
• Transition has gone smoothly
and performance is
exceeding expectations
• Broadened car rental supply
in multiple markets
• Continued to grow but
experienced challenging
weather events over March-
April 2017 which impacted
sales for port departures ex
Queensland and NSW
• Bookings growth supressed
as a result, with marginal
growth of 3%

Page 28

Page 29
•
•
•
•
(1) Adjusting the statutory result to reflect the
Thomas Cook Management fee
A$ FY17 FY16
TTV 482 million 346 million
Underlying Revenue 48.7 million (1) 31.0 million
Underlying EBITDA 11.9 million (1) 3.4 million
Statutory Revenue 37.6 million 31.0 million
Statutory EBITDA 0.4 million 3.4 million

Page 30
Page 31
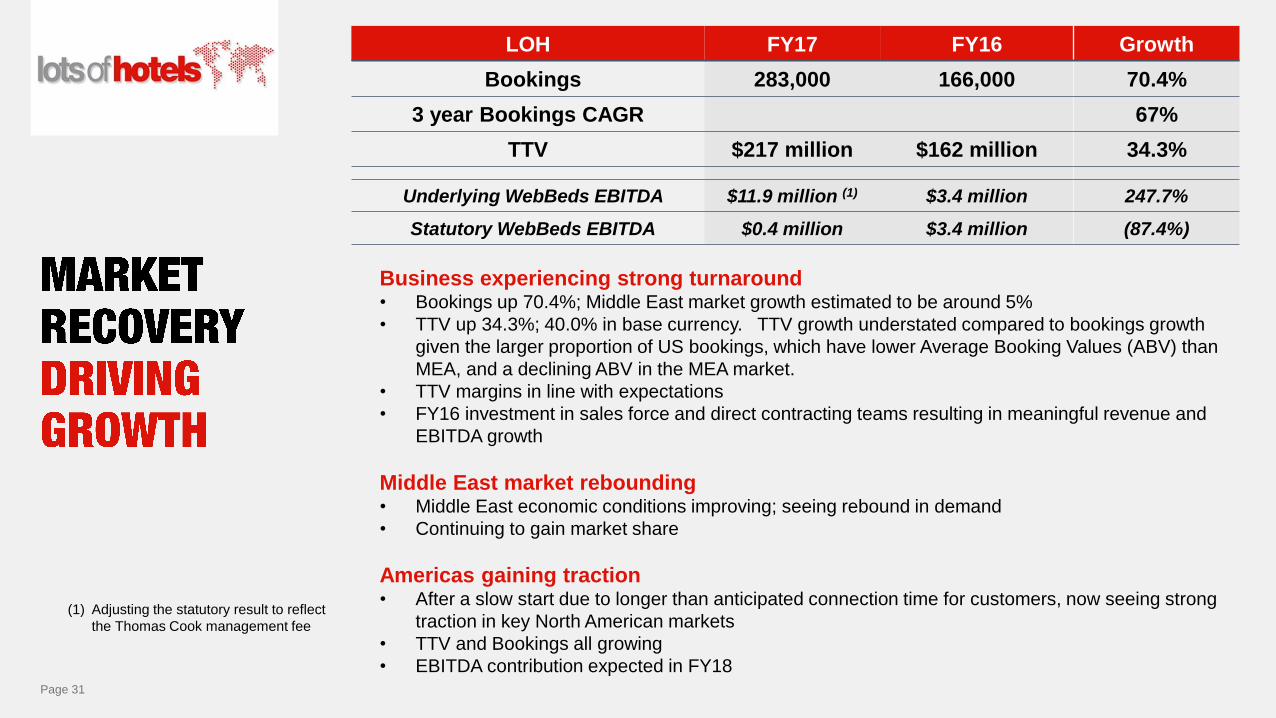
Business experiencing strong turnaround• Bookings up 70.4%; Middle East market growth estimated to be around 5%
• TTV up 34.3%; 40.0% in base currency. TTV growth understated compared to bookings growth
given the larger proportion of US bookings, which have lower Average Booking Values (ABV) than
MEA, and a declining ABV in the MEA market.
• TTV margins in line with expectations
• FY16 investment in sales force and direct contracting teams resulting in meaningful revenue and
EBITDA growth
Middle East market rebounding• Middle East economic conditions improving; seeing rebound in demand
• Continuing to gain market share
Americas gaining traction• After a slow start due to longer than anticipated connection time for customers, now seeing strong
traction in key North American markets
• TTV and Bookings all growing
• EBITDA contribution expected in FY18
LOH FY17 FY16 Growth
Bookings 283,000 166,000 70.4%
3 year Bookings CAGR 67%
TTV $217 million $162 million 34.3%
Underlying WebBeds EBITDA $11.9 million (1) $3.4 million 247.7%
Statutory WebBeds EBITDA $0.4 million $3.4 million (87.4%)
(1) Adjusting the statutory result to reflect
the Thomas Cook management fee

Page 32
•
•
MEA BOOKINGS AMERICAS BOOKINGS
Bookings ABV
29.8% 10.0%
1H
2H
67.6% 13.3%Bookings ABV
Bookings ABV
4,674% 20.3%
1H
2H
1,064% 19.9%Bookings ABV
+ 30%
+ 68%
1H 2H
FY16
FY17
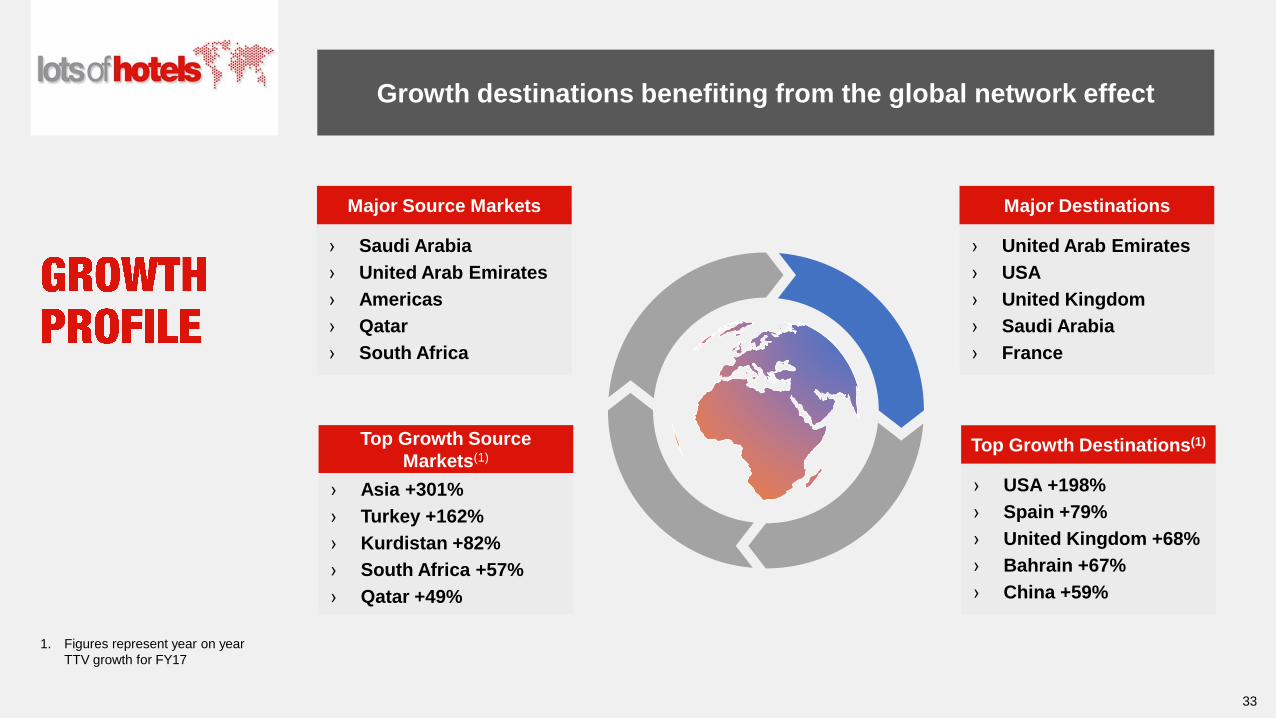
33
1. Figures represent year on year
TTV growth for FY17
Major Source Markets
› Saudi Arabia
› United Arab Emirates
› Americas
› Qatar
› South Africa
› Asia +301%
› Turkey +162%
› Kurdistan +82%
› South Africa +57%
› Qatar +49%
Top Growth Source
Markets(1)
Major Destinations
› United Arab Emirates
› USA
› United Kingdom
› Saudi Arabia
› France
Top Growth Destinations(1)
› USA +198%
› Spain +79%
› United Kingdom +68%
› Bahrain +67%
› China +59%
Growth destinations benefiting from the global network effect

Page 34
•
•
USA +198%Spain +79%
UK +68%%
China +59%
Bahrain +67%
1. Figures represent year on year
TTV growth for FY17

Page 35
Page 36
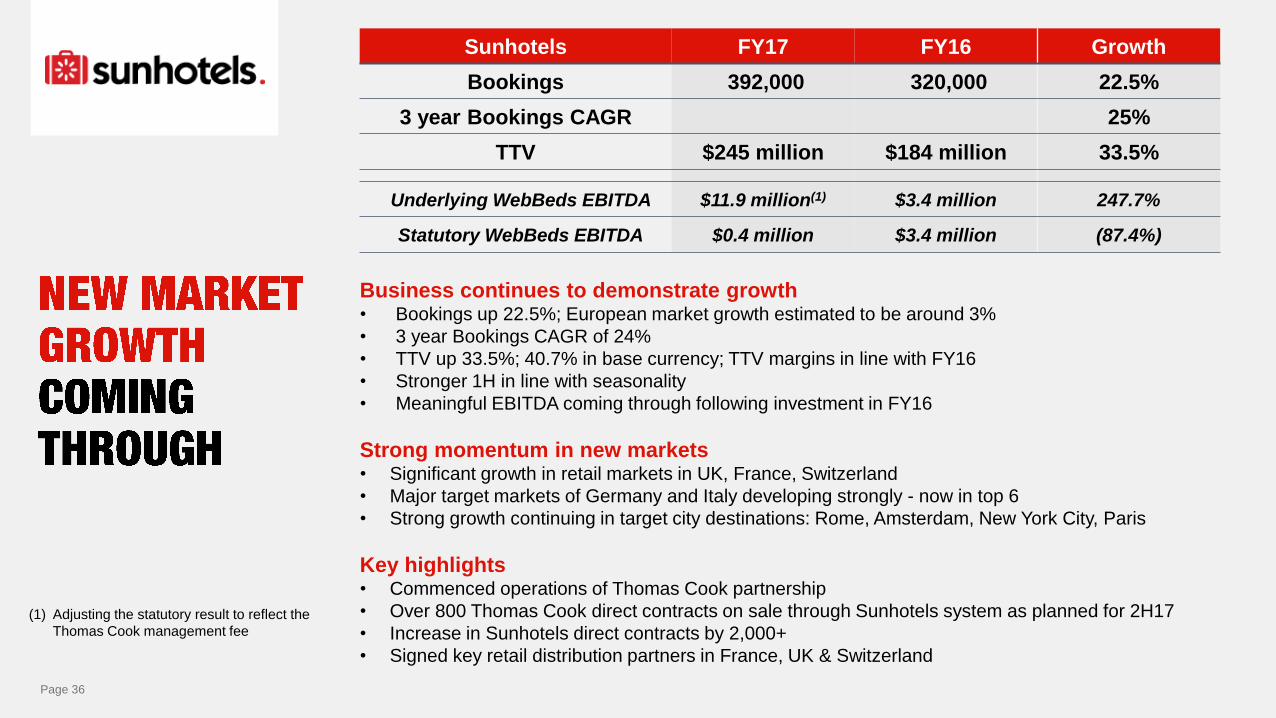
Business continues to demonstrate growth• Bookings up 22.5%; European market growth estimated to be around 3%
• 3 year Bookings CAGR of 24%
• TTV up 33.5%; 40.7% in base currency; TTV margins in line with FY16
• Stronger 1H in line with seasonality
• Meaningful EBITDA coming through following investment in FY16
Strong momentum in new markets• Significant growth in retail markets in UK, France, Switzerland
• Major target markets of Germany and Italy developing strongly - now in top 6
• Strong growth continuing in target city destinations: Rome, Amsterdam, New York City, Paris
Key highlights• Commenced operations of Thomas Cook partnership
• Over 800 Thomas Cook direct contracts on sale through Sunhotels system as planned for 2H17
• Increase in Sunhotels direct contracts by 2,000+
• Signed key retail distribution partners in France, UK & Switzerland
Sunhotels FY17 FY16 Growth
Bookings 392,000 320,000 22.5%
3 year Bookings CAGR 25%
TTV $245 million $184 million 33.5%
Underlying WebBeds EBITDA $11.9 million(1) $3.4 million 247.7%
Statutory WebBeds EBITDA $0.4 million $3.4 million (87.4%)
(1) Adjusting the statutory result to reflect the
Thomas Cook management fee

37
Major Source Markets
› United Kingdom
› Sweden
› Norway
› Spain
› Germany
› Portugal +391%
› France +243%
› Switzerland +113%
› Spain +76%
› Germany +61%
Top Growth Source
Markets(1)
Major Destinations
› Spain
› Greece
› USA
› Italy
› United Kingdom
Top Growth Destinations(1)
› Italy +79%
› Netherlands +64%
› USA +56%
› Spain +47%
› UAE +46%
Gaining traction in important European source travel markets;
Destinations benefiting from the global network effect
1. Figures represent year on year
TTV growth for FY17

Page 38
•
•
1. Figures represent year on year
TTV growth for FY17
USA +56%
Netherlands +64%
Italy +79%Spain +47% UAE +46%
Page 39
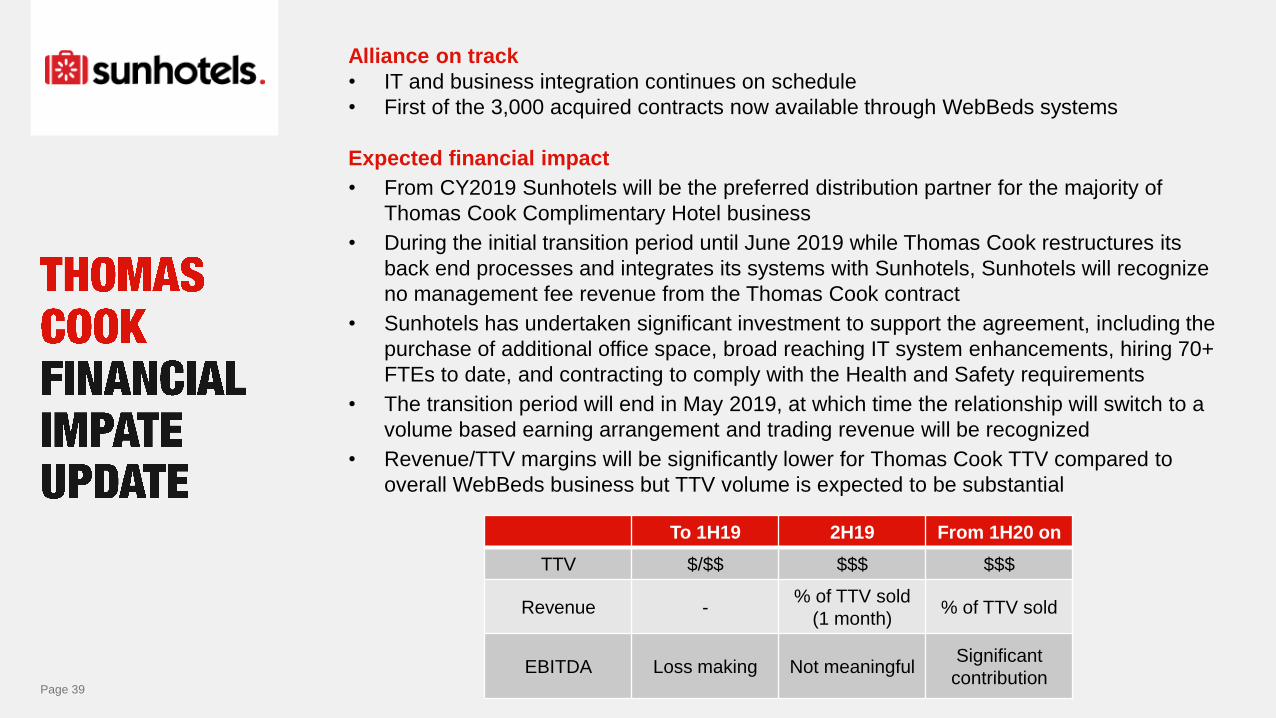
Alliance on track
• IT and business integration continues on schedule
• First of the 3,000 acquired contracts now available through WebBeds systems
Expected financial impact
• From CY2019 Sunhotels will be the preferred distribution partner for the majority of
Thomas Cook Complimentary Hotel business
• During the initial transition period until June 2019 while Thomas Cook restructures its
back end processes and integrates its systems with Sunhotels, Sunhotels will recognize
no management fee revenue from the Thomas Cook contract
• Sunhotels has undertaken significant investment to support the agreement, including the
purchase of additional office space, broad reaching IT system enhancements, hiring 70+
FTEs to date, and contracting to comply with the Health and Safety requirements
• The transition period will end in May 2019, at which time the relationship will switch to a
volume based earning arrangement and trading revenue will be recognized
• Revenue/TTV margins will be significantly lower for Thomas Cook TTV compared to
overall WebBeds business but TTV volume is expected to be substantial
To 1H19 2H19 From 1H20 on
TTV $/$$ $$$ $$$
Revenue -% of TTV sold
(1 month)% of TTV sold
EBITDA Loss making Not meaningfulSignificant
contribution

Page 40

Page 41
Strong start up performance
• $3.8 million investment to launch our B2B operations in Asia. Key costs included 48 staff,
opening 10 representative offices focusing on sales and direct hotel contracting
• $19 million TTV to 30 June. Annualised TTV run rate of $90 million as at August 2017
reflecting strong July and August bookings growth
• Strategic partnership with China’s largest wholesaler, DIDA Travel, is delivering results
Key achievements
• Contracting for Asian destinations started May 2017. Over 200 direct contracts now available
in key Asian cities including Singapore, Hong Kong, Bangkok, Phuket, Seoul, Taipei and Jakarta.
• Taiwan - Partnering China Airlines to develop dynamic package business for the local market
• Introduced Rail passes and tickets in key European destinations to complement our hotels
products and provide upsell and bundle opportunities
• Introduced FIT Rewards, a travel client loyalty program aimed at agency bookers to promote
stickiness
• Launched in-market customer support teams supporting all Asian languages (English,
Bahasa, Korean, Mandarin, Cantonese, Thai, Hindi, Japanese coming 1H18)
FIT Ruums FY17 FY16 Growth
Bookings 51,000 n/a n/a
TTV $19 million n/a n/a
Underlying B2B EBITDA $11.9 million(1) $3.4 million 247.7%
Statutory B2B EBITDA $0.4 million $3.4 million (87.4%)
(1) Adjusting the statutory result to reflect
the Thomas Cook management fee

Page 42
•
SINGAPORE SOUTH KOREA
TAIWAN
HONG KONG
JAPAN
INDONESIA
THAILAND
INDIA
MALAYSIA
CHINA

Page 43
Top 10 Destination Markets
1 Indonesia
2 China
3 Thailand
4 Japan
5 Singapore
6 USA
7 Malaysia
8 South Korea
9 United Kingdom
10 Australia

Page 44
•
•
USA
Thailand
Singapore
United Kingdom
Indonesia
Malaysia
Australia
Japan
China
South Korea

Page 45

Page 46
Jul 2014:
Purchased
Sunhotels to
service the
European
markets,
creating a
unique
position in
beach
destinations
with
significant
room to grow
in Europe
Nov 2015:
LOH expands
to the
Americas
Aug 2016:
Sunhotels
signs
agreement
with Thomas
Cook
Aug 2017:
Acquired
JacTravel,
making
WebBeds the
#2 global
B2B player
and #2 in
European
market
Nov 2016:
Launched FIT
Ruums as an
organic start
up to serve
the Asia
markets
Feb 2013:
Started with
LOH in Dubai
as an organic
start up,
initially
serving the
Middle East
and Africa
markets

Page 47

Page 48
Page 49
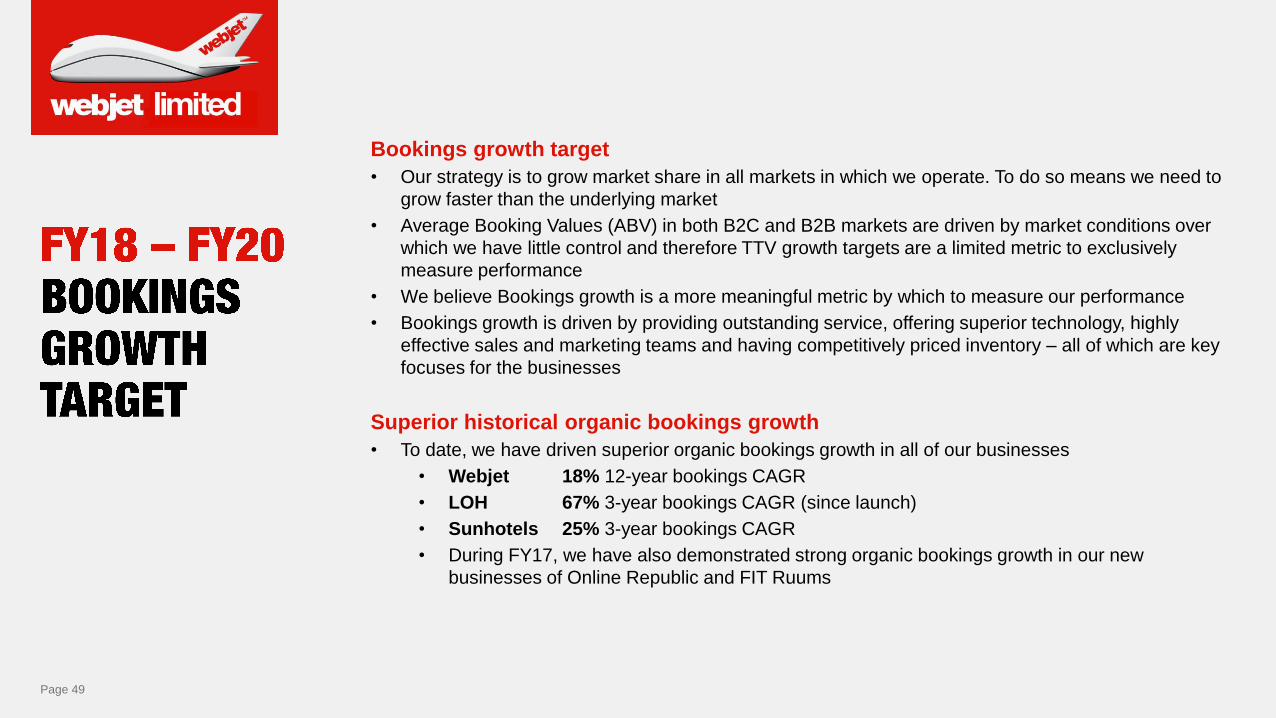
Bookings growth target
• Our strategy is to grow market share in all markets in which we operate. To do so means we need to
grow faster than the underlying market
• Average Booking Values (ABV) in both B2C and B2B markets are driven by market conditions over
which we have little control and therefore TTV growth targets are a limited metric to exclusively
measure performance
• We believe Bookings growth is a more meaningful metric by which to measure our performance
• Bookings growth is driven by providing outstanding service, offering superior technology, highly
effective sales and marketing teams and having competitively priced inventory – all of which are key
focuses for the businesses
Superior historical organic bookings growth
• To date, we have driven superior organic bookings growth in all of our businesses
• Webjet 18% 12-year bookings CAGR
• LOH 67% 3-year bookings CAGR (since launch)
• Sunhotels 25% 3-year bookings CAGR
• During FY17, we have also demonstrated strong organic bookings growth in our new
businesses of Online Republic and FIT Ruums
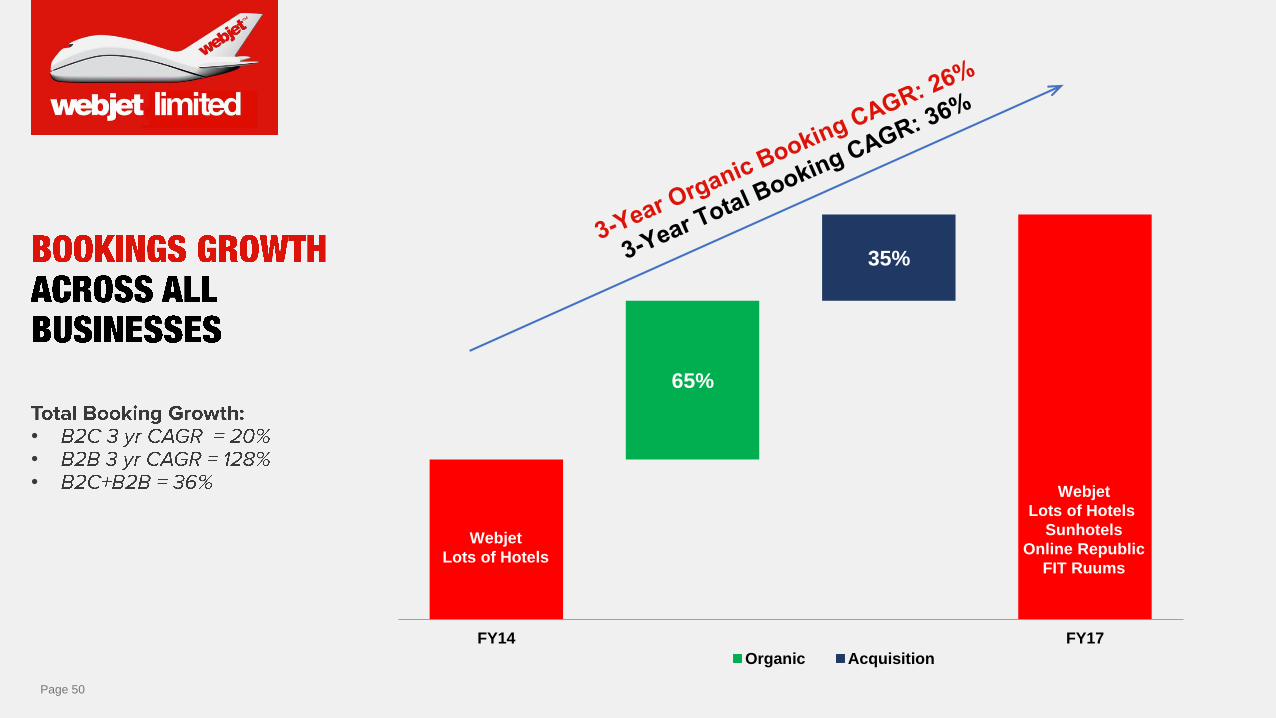
Page 50
•••
65%
35%
FY14 FY17
Organic Acquisition
Webjet
Lots of Hotels
Webjet
Lots of Hotels
Sunhotels
Online Republic
FIT Ruums

Page 51
• As bookings are a key driver of growth, our aim is to continue to gain market share and grow more than the
underlying market in each of our businesses:
• 3 year B2C growth target – Bookings growth of more than 3 times the underlying market growth rate
• 3 year B2B growth target – Bookings growth of more than 5 times the underlying market growth rate
in each market
• Total B2C bookings YTD to 28 August 17 – up 25% on pcp, ahead of expectations
• Webjet up 20% on pcp, ahead of expectations
• Online Republic up 39% on pcp, in line with expectations
• B2B (excluding JacTravel) bookings YTD to 28 August 17 – up 78% on pcp, ahead of expectations (1)
• Sunhotels up 25% on pcp, in line with expectations
• LOH up 70% on pcp, ahead of expectations
• Thomas Cook up 185% on pcp, in line with expectations
• FIT Ruums annualised TTV run rate $90 million
• Announced 2 August 2017; closing 31 August 2017
• 98% take up for Institutional offer; 81% take-up for Retail offer
• Will be provided at our AGM on 22 November 2017(1) B2B TTV up 57% reflecting lower average
booking values in high growth markets of Asia
and North America

Page 52
by JOHN GUSCIC, Managing Director
August 31, 2017


