42
Housing’s Lost Decade: Where we go from here By Kent Colton, PhD, Gopal Ahluwalia and Jay Shackford January 11, 2013 Copyright 2013 The Colton Housing Group
| Date post: | 27-Dec-2015 |
| Category: |
Documents |
| Upload: | buck-tyrone-george |
| View: | 213 times |
| Download: | 0 times |

Housing’s Lost Decade: Where we go from here
By Kent Colton, PhD, Gopal Ahluwalia and Jay Shackford
January 11, 2013
Copyright 2013 The Colton Housing Group

2
19901991
19921993
19941995
19961997
19981999
20002001
20022003
20042005
20062007
20082009
20102011
2012*0
500
1,000
1,500
2,000
2,500
Annual Housing Starts/1990-2012
Single-family Multifamily
Starts in thousands of units
Housing peaks in 2005 before collapsingRecovery slow but in sight
Source: U.S. Census Bureau *Forecast by Colton, Ahluwalia and Shackford
Chart 1
Copyright 2013 The Colton Housing Group

3
Worst housing crash in post-World War II period
Source: U.S. Census Bureau*Forecast by Colton, Ahluwalia and Shackford
Chart 2
Copyright 2013 The Colton Housing Group
1960
1963
1966
1969
1972
1975
1978
1981
1984
1987
1990
1993
1996
1999
2002
2005
2008
2011
0
500
1,000
1,500
2,000
2,500
Annual Housing Starts/1960-2012
Total Single Family Multifamily
4
1990
1992
1994
1996
1998
2000
2002
2004
2006
2008
2010
2012
*200
400
600
800
1,000
1,200
1,400
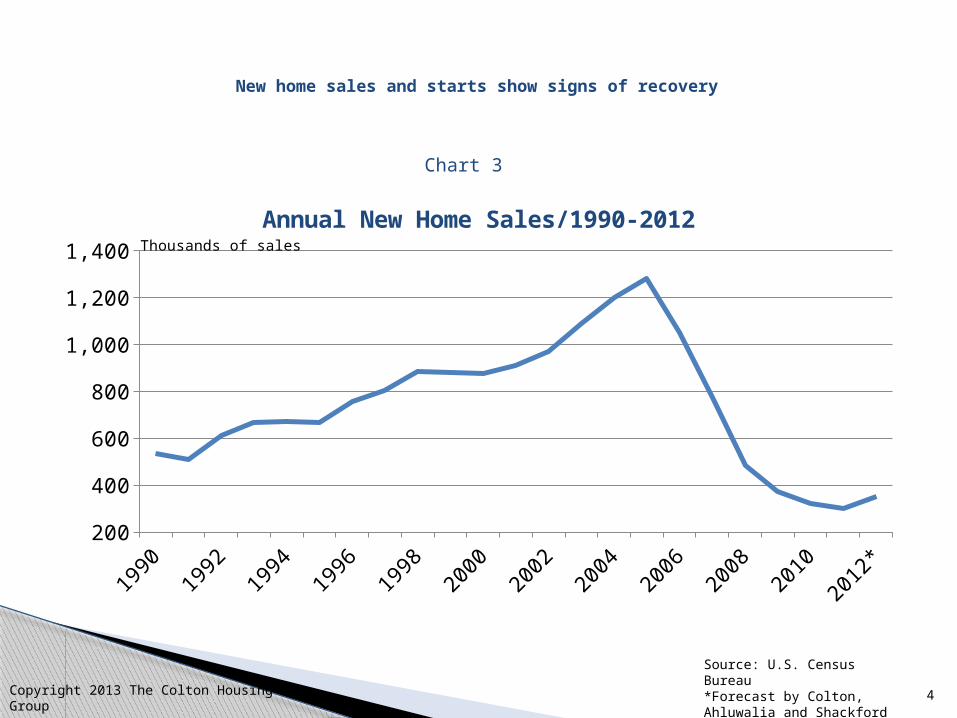
Annual New Home Sales/1990-2012Thousands of sales
New home sales and starts show signs of recovery
Source: U.S. Census Bureau *Forecast by Colton, Ahluwalia and Shackford
Chart 3
Copyright 2013 The Colton Housing Group

5
1990
1991
1992
1993
1994
1995
1996
1997
1998
1999
2000
2001
2002
2003
2004
2005
2006
2007
2008
2009
2010
2011
2012
*2,000
3,000
4,000
5,000
6,000
7,000
8,000
Annual Sales of Existing Homes/1990-2012Thousands of sales
Existing home sales fall but not as dramatically as new homes
Source: National Association of Realtors*Forecast by Colton, Ahluwalia and Shackford
Chart 4
Copyright 2013 The Colton Housing Group
6
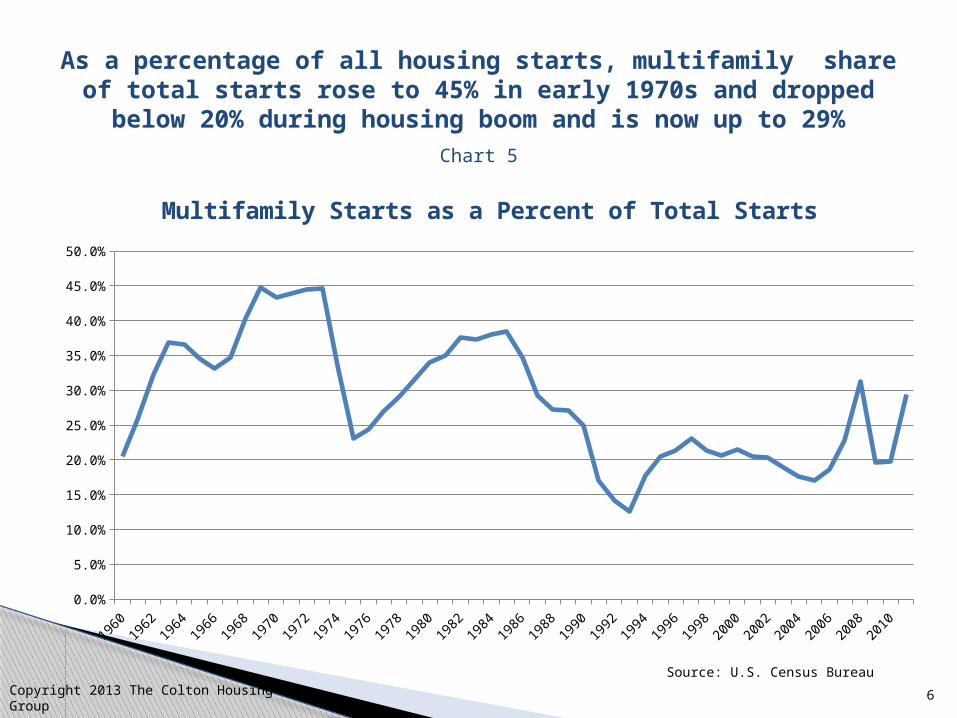
As a percentage of all housing starts, multifamily share of total starts rose to 45% in early 1970s and dropped below
20% during housing boom and is now up to 29%
Source: U.S. Census Bureau
Chart 5
Copyright 2013 The Colton Housing Group
1960
1962
1964
1966
1968
1970
1972
1974
1976
1978
1980
1982
1984
1986
1988
1990
1992
1994
1996
1998
2000
2002
2004
2006
2008
2010
0.0%
5.0%
10.0%
15.0%
20.0%
25.0%
30.0%
35.0%
40.0%
45.0%
50.0%
Multifamily Starts as a Percent of Total Starts
7
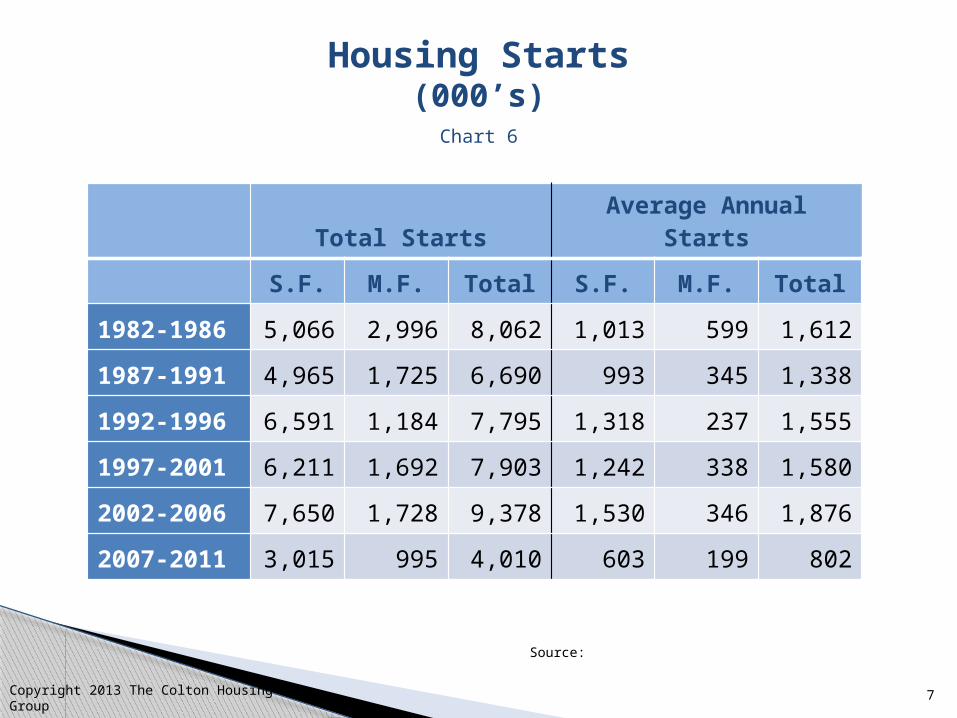
Housing Starts(000’s)
Source:
Chart 6
Copyright 2013 The Colton Housing Group
Total StartsAverage Annual
Starts
S.F. M.F. Total S.F. M.F. Total
1982-1986 5,066 2,996 8,062 1,013 599 1,612
1987-1991 4,965 1,725 6,690 993 345 1,338
1992-1996 6,591 1,184 7,795 1,318 237 1,555
1997-2001 6,211 1,692 7,903 1,242 338 1,580
2002-2006 7,650 1,728 9,378 1,530 346 1,876
2007-2011 3,015 995 4,010 603 199 802
8
1990 1995 2000 2005 20100
50,000
100,000
150,000
200,000
250,000
300,000
350,000
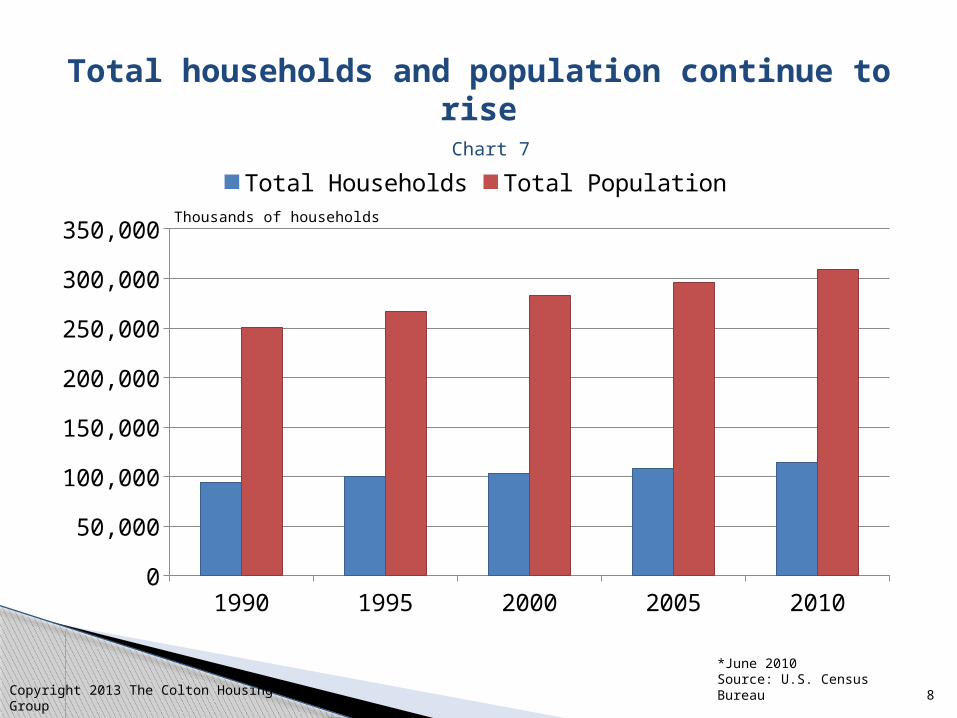
Total Households Total PopulationThousands of households
Total households and population continue to rise
*June 2010Source: U.S. Census Bureau
Chart 7
Copyright 2013 The Colton Housing Group

9
Net increase in households decline (major factors are Immigration and
Households Doubling Up)
* June 2010Source: U.S. Census Bureau
Chart 8
Copyright 2013 The Colton Housing Group
1992
1993
1994
1995
1996
1997
1998
1999
2000
2001
2002
2003
2004
2005
2006
2007
2008
2009
2010
2011
-
200
400
600
800
1,000
1,200
1,400
1,600
1,800
2,000
Average1992-1996
1,063
Average 1997-2001 1,288
Average 2002-20061,349
Average 2007-2011568
Change in total number of householdsAverage
thousands
10
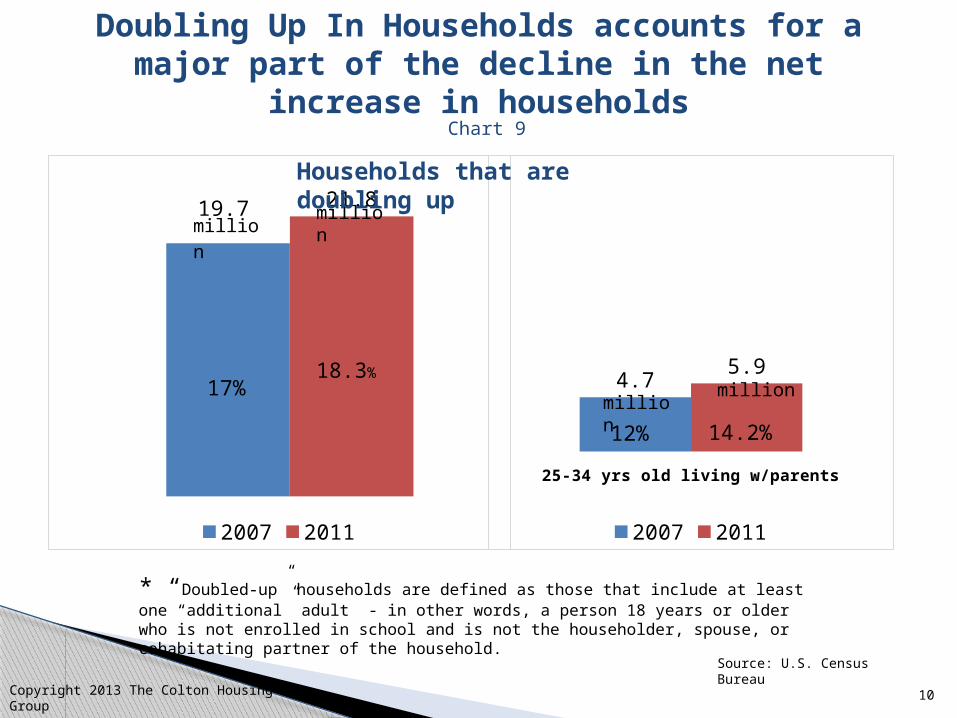
Doubling Up In Households accounts for a major part of the decline in the net increase
in householdsChart 9
Copyright 2013 The Colton Housing Group
19.7 21.8
2007 2011
million
17% 4.75.9
2007 2011
25-34 yrs old living w/parents
million
18.3%
12% 14.2%million
million
* “Doubled-up” households are defined as those that include at least one “additional” adult - in other words, a person 18 years or older who is not enrolled in school and is not the householder, spouse, or cohabitating partner of the household.
Source: U.S. Census Bureau
Households that are doubling up
11
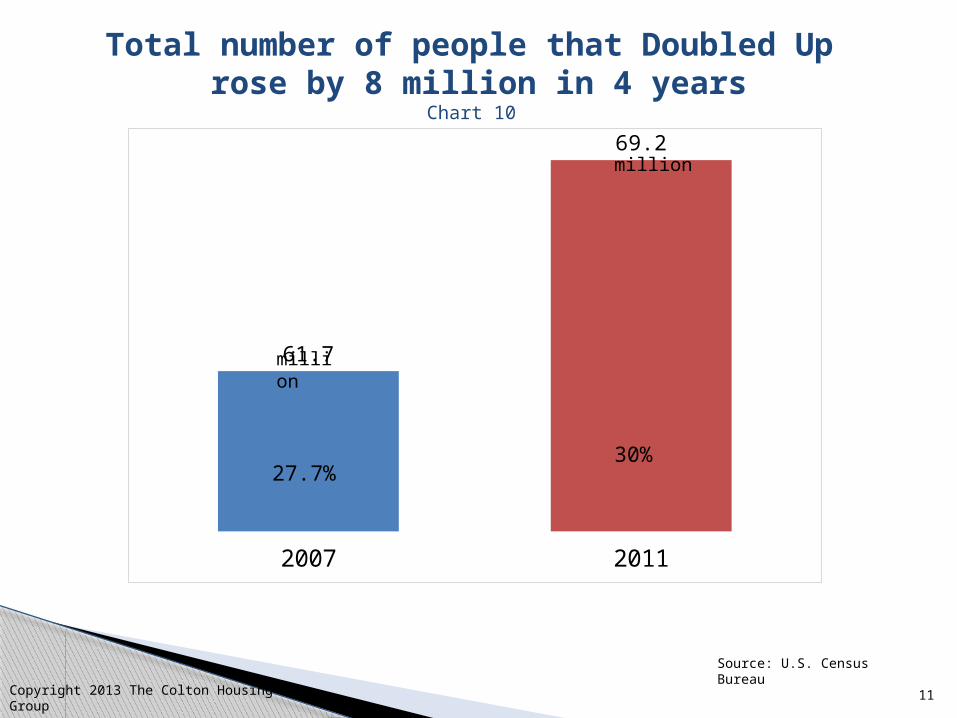
Total number of people that Doubled Up rose by 8 million in 4 years
Copyright 2013 The Colton Housing Group
2007 2011
61.7
69.2
million
million
27.7%30%
Chart 10
Source: U.S. Census Bureau
12
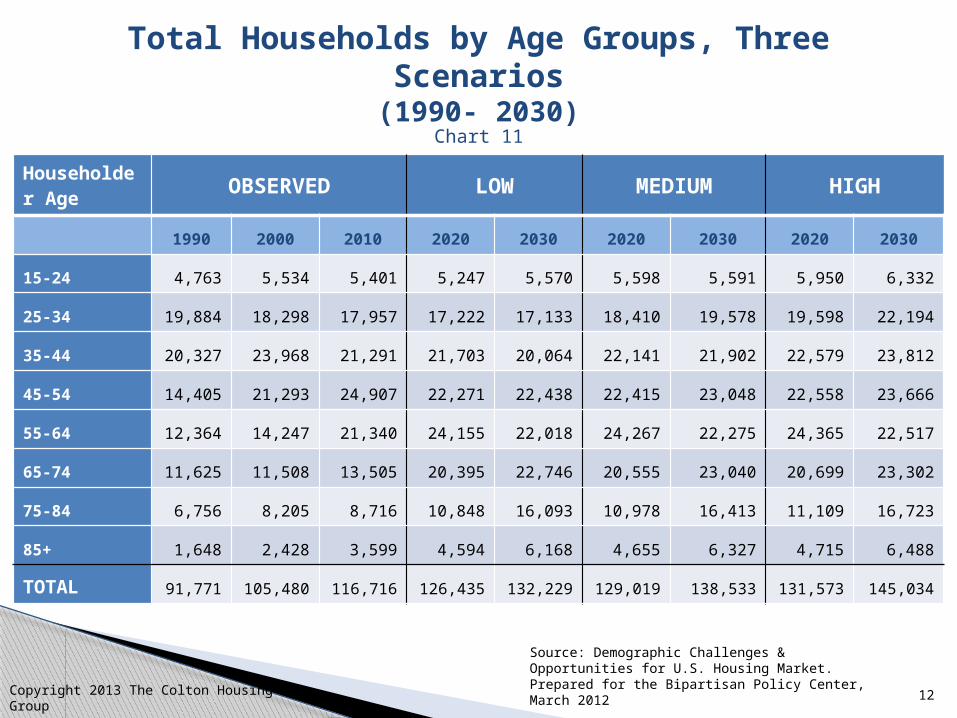
Total Households by Age Groups, Three Scenarios
(1990- 2030)
Source: Demographic Challenges & Opportunities for U.S. Housing Market. Prepared for the Bipartisan Policy Center, March 2012
Chart 11
Copyright 2013 The Colton Housing Group
Householder Age OBSERVED LOW MEDIUM HIGH
1990 2000 2010 2020 2030 2020 2030 2020 2030
15-24 4,763 5,534 5,401 5,247 5,570 5,598 5,591 5,950 6,332
25-34 19,884 18,298 17,957 17,222 17,133 18,410 19,578 19,598 22,194
35-44 20,327 23,968 21,291 21,703 20,064 22,141 21,902 22,579 23,812
45-54 14,405 21,293 24,907 22,271 22,438 22,415 23,048 22,558 23,666
55-64 12,364 14,247 21,340 24,155 22,018 24,267 22,275 24,365 22,517
65-74 11,625 11,508 13,505 20,395 22,746 20,555 23,040 20,699 23,302
75-84 6,756 8,205 8,716 10,848 16,093 10,978 16,413 11,109 16,723
85+ 1,648 2,428 3,599 4,594 6,168 4,655 6,327 4,715 6,488
TOTAL 91,771 105,480 116,716 126,435 132,229 129,019 138,533 131,573 145,034
13
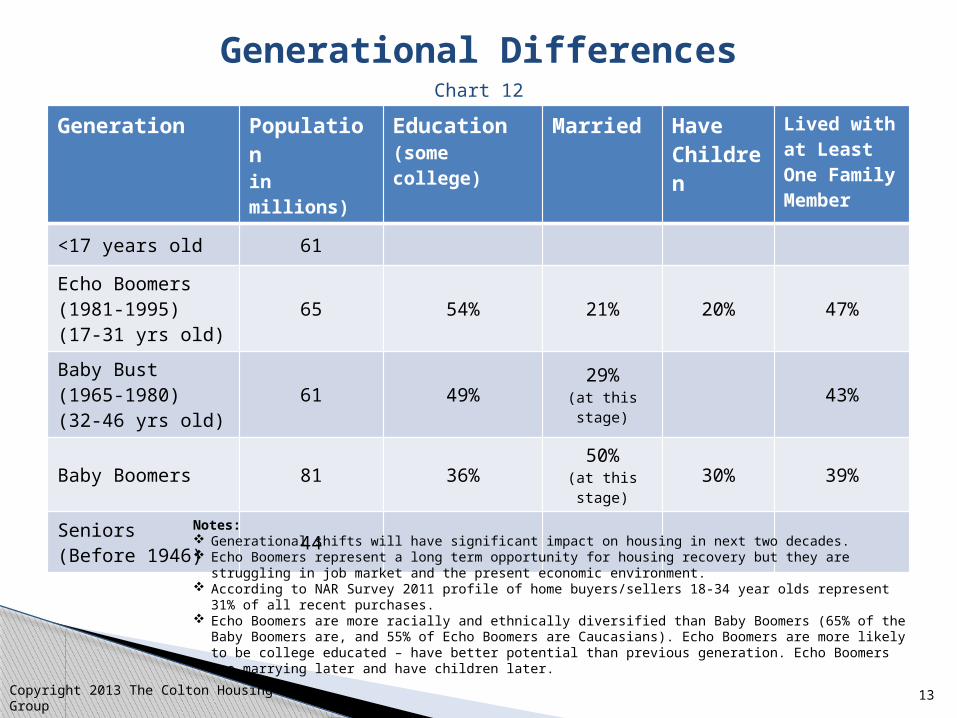
Generation Population in millions)
Education(some college)
Married Have Children
Lived with at Least One Family Member
<17 years old 61
Echo Boomers(1981-1995)(17-31 yrs old)
65 54% 21% 20% 47%
Baby Bust(1965-1980)(32-46 yrs old)
61 49%29%
(at this stage)
43%
Baby Boomers 81 36%50%
(at this stage)
30% 39%
Seniors (Before 1946)
44
Generational DifferencesChart 12
Notes: Generational shifts will have significant impact on housing in next two decades. Echo Boomers represent a long term opportunity for housing recovery but they are struggling in job
market and the present economic environment. According to NAR Survey 2011 profile of home buyers/sellers 18-34 year olds represent 31% of all recent
purchases. Echo Boomers are more racially and ethnically diversified than Baby Boomers (65% of the Baby Boomers
are, and 55% of Echo Boomers are Caucasians). Echo Boomers are more likely to be college educated – have better potential than previous generation. Echo Boomers are marrying later and have children later.
Copyright 2013 The Colton Housing Group
14
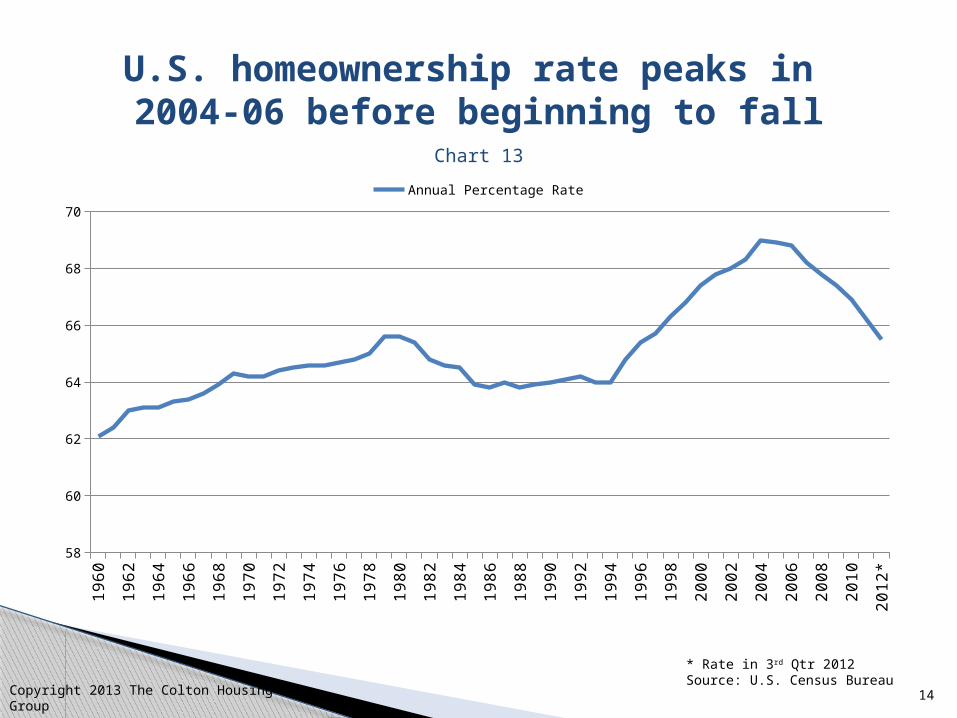
U.S. homeownership rate peaks in 2004-06 before beginning to fall
* Rate in 3rd Qtr 2012Source: U.S. Census Bureau
Chart 13
Copyright 2013 The Colton Housing Group
1960
1962
1964
1966
1968
1970
1972
1974
1976
1978
1980
1982
1984
1986
1988
1990
1992
1994
1996
1998
2000
2002
2004
2006
2008
2010
2012*
58
60
62
64
66
68
70
Annual Percentage Rate
15
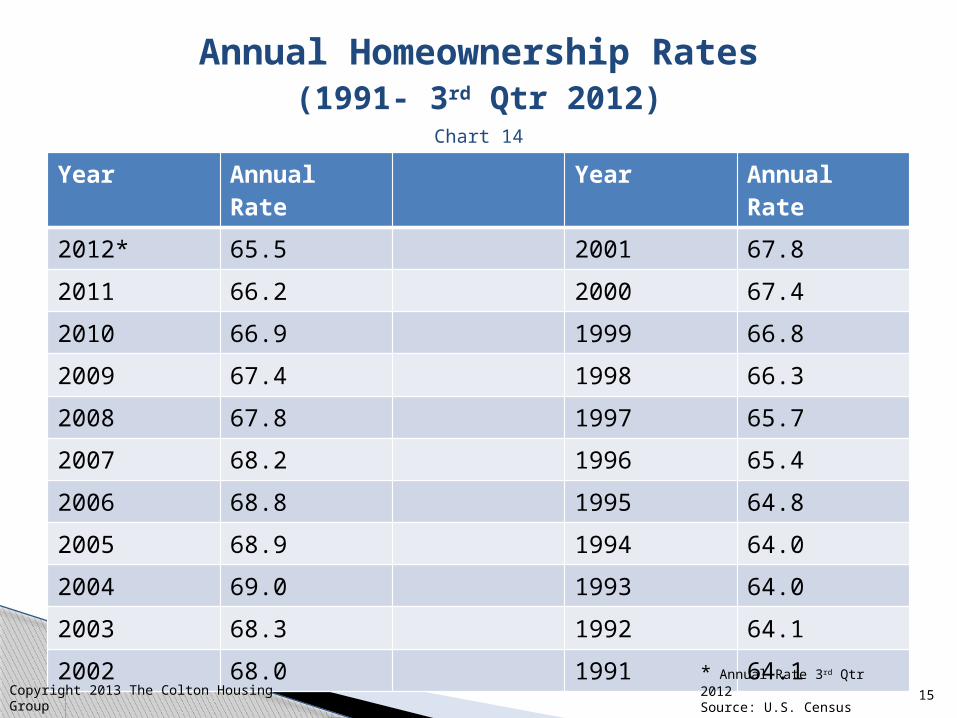
Year Annual Rate
Year Annual Rate
2012* 65.5 2001 67.8
2011 66.2 2000 67.4
2010 66.9 1999 66.8
2009 67.4 1998 66.3
2008 67.8 1997 65.7
2007 68.2 1996 65.4
2006 68.8 1995 64.8
2005 68.9 1994 64.0
2004 69.0 1993 64.0
2003 68.3 1992 64.1
2002 68.0 1991 64.1
Annual Homeownership Rates(1991- 3rd Qtr 2012)
* Annual Rate 3rd Qtr 2012Source: U.S. Census Bureau
Chart 14
Copyright 2013 The Colton Housing Group

16
Homeownership Rates Vary by Age group
Source: U.S. Housing Market Conditions/HUD
Chart 15
Copyright 2013 The Colton Housing Group
1985 1990 1995 2000 2005 2010 2011 2012*
Change in homeownership
2005-3rd Qtr 2012
Less than 35 yrs 39.9% 38.5% 38.6% 40.8% 43.0% 39.1% 37.8% 36.3% -6.7%
35-44 yrs 68.1% 66.3% 65.2% 67.9% 69.3% 65.0% 63.5% 61.8% -7.5%
45-54 yrs 75.9% 75.2% 75.2% 76.5% 76.6% 73.5% 72.7% 72.0% -4.6%
55-64 yrs 79.5% 79.3% 79.5% 80.3% 81.2% 79.0% 78.5% 76.9% -4.3%
65 yrs and over 74.8% 76.3% 78.1% 80.4% 80.6% 80.5% 80.9% 81.4% +0.8%
U.S. 63.9% 63.9% 64.7% 67.4% 68.9% 66.9% 66.4% 65.5% -3.4%
Note: Homeownership rate declined from peak of 68.9% in 2005 to 65.5% (decline of 3.4%) in 3rd Qtr 2012. The decline in homeownership varies significantly among different population segments. Among less than 35 years old, homeownership declined from43.0% in 2005 to 36.3% in 3rd Qtr 2012 (decline of 6.7%) and among 35-44 years old, homeownership declined from 69.3% in 2005 to 61.8% in 3rd Qtr 2012 (decline of 7.5%).

17
What is a $200,000 home purchased in 2000 worth today?
Significant drop in equity since 2005 but equity in 2012 is still up compared to 2000 in almost all markets. And some markets have experienced price increases or more
modest declines since 2006.
Source: Federal Housing Finance Agency
Chart 16
Copyright 2013 The Colton Housing Group
Los Angeles Sacramento Las VegasRiverside/San
Bernardino Phoenix MiamiFt.
Lauderdale Wash DC
2000 200,000 200,000 200,000 200,000 200,000 200,000 200,000 200,000
2005 465,487 444,958 394,375 471,000 355,000 444,000 436,000 443,000
2012 332,000 258,000 178,000 262,000 218,000 302,000 294,000 396,000
Los
Angeles Sacramento Las VegasRiverside/San
Bernardino Phoenix MiamiFt.
Lauderdale Wash DC
2000-2005 132.7% 122.5% 97.2% 135.5% 77.5% 122.0% 118.0% 121.5%
2005-2012 -28.7% -42.0% -54.9% -44.4% -38.6% -32.0% -32.6% -10.6%
2000-2012 66.0% 29.0% -11.0% 31.0% 9.0% 51.0% 47.0% 98.0%
Percentage Change

18
Source: Federal Housing Finance Agency
Chart 17
Copyright 2013 The Colton Housing Group
Atlanta Seattle Chicago Boston Raleigh Denver Dallas Houston
2000 200,000 200,000 200,000 200,000 200,000 200,000 200,000 200,000
2005 247,000 297,000 301,000 347,000 234,000 254,000 238,000 247,000
2012 180,000 269,000 225,000 311,000 254,000 257,000 256,000 298,000
Atlanta Seattle Chicago Boston Raleigh Denver Dallas Houston
2000-2005 23.5% 48.5% 50.5% 73.5% 17.0% 27.0% 19.0% 23.5%
2005-2012 -27.1% -9.4% -25.2% -10.4% 8.5% 1.2% 7.6% 20.6%
2000-2012 -10.0% 34.5% 12.5% 55.5% 27.0% 28.5% 28.0% 49.0%
Percentage Change
What is a $200,000 home purchased in 2000 worth today?
Significant drop in equity since 2005 but equity in 2012 is still up compared to 2000. And some markets have experienced price increases or more modest declines since
2005.
19
Jan-00Jul-00Jan-01Jul-01Jan-02Jul-02Jan-03Jul-03Jan-04Jul-04Jan-05Jul-05Jan-06Jul-06Jan-07Jul-07Jan-08Jul-08Jan-09Jul-09Jan-10Jul-10Jan-11Jul-11Jan-12Jul-12
100.0
120.0
140.0
160.0
180.0
200.0
220.0
240.0
100.0
120.0
140.0
160.0
180.0
200.0
220.0
240.0
10-city composite 20-city composite National Aggregate index
Top 1
0 a
nd 2
0 H
om
e P
rice
Indexes
Month
ly
Natio
nal A
ggre
gate
Index Q
uarte
rly
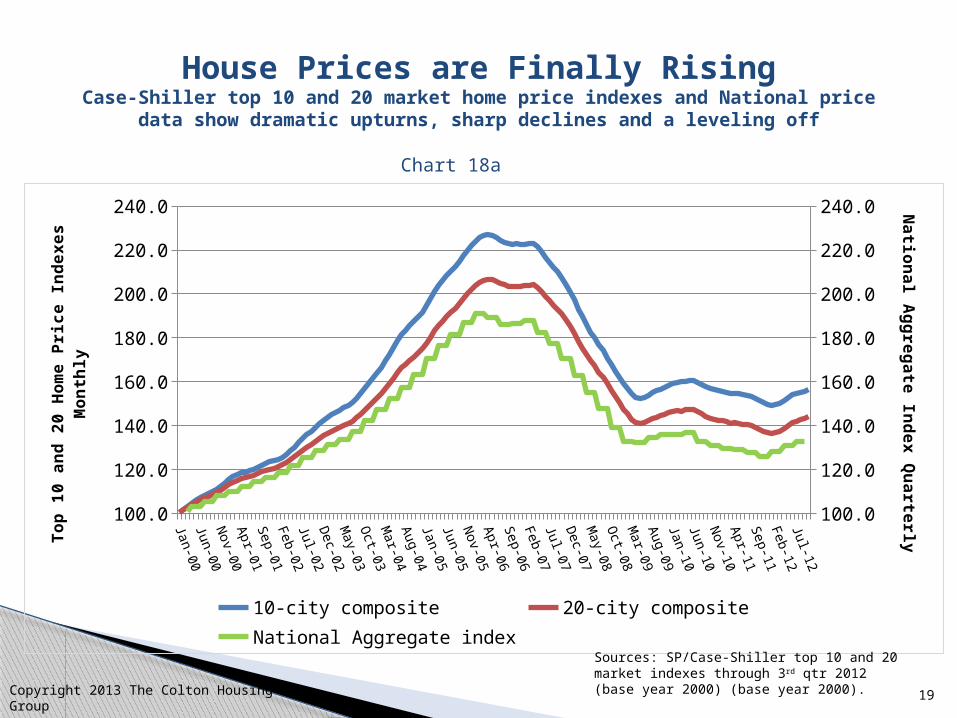
House Prices are Finally RisingCase-Shiller top 10 and 20 market home price indexes and National price data
show dramatic upturns, sharp declines and a leveling off
Chart 18a
Sources: SP/Case-Shiller top 10 and 20 market indexes through 3rd qtr 2012 (base year 2000) (base year 2000).
Copyright 2013 The Colton Housing Group
20
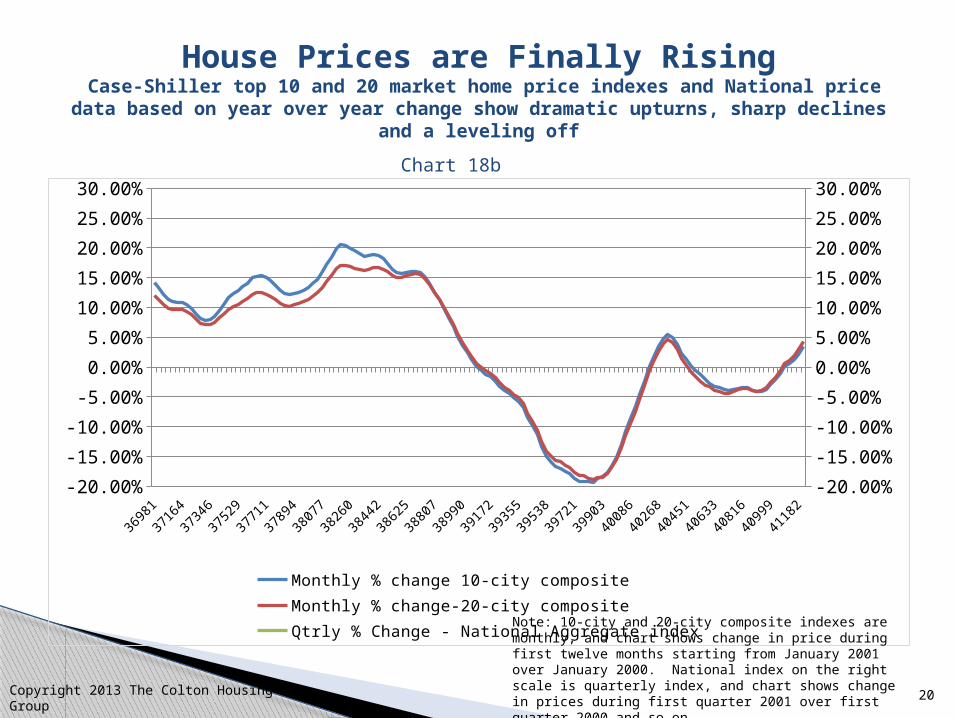
House Prices are Finally Rising Case-Shiller top 10 and 20 market home price indexes and National price data based on year over year change show dramatic upturns, sharp declines and a
leveling off
3698
1
3716
4
3734
6
3752
9
3771
1
3789
4
3807
7
3826
0
3844
2
3862
5
3880
7
3899
0
3917
2
3935
5
3953
8
3972
1
3990
3
4008
6
4026
8
4045
1
4063
3
4081
6
4099
9
4118
2-20.00%
-15.00%
-10.00%
-5.00%
0.00%
5.00%
10.00%
15.00%
20.00%
25.00%
30.00%
-20.00%
-15.00%
-10.00%
-5.00%
0.00%
5.00%
10.00%
15.00%
20.00%
25.00%
30.00%
Monthly % change 10-city composite Monthly % change-20-city compositeQtrly % Change - National Aggregate index
Chart 18b
Note: 10-city and 20-city composite indexes are monthly, and chart shows change in price during first twelve months starting from January 2001 over January 2000. National index on the right scale is quarterly index, and chart shows change in prices during first quarter 2001 over first quarter 2000 and so on.Copyright 2013 The Colton Housing Group
21
1992
1994
1996
1998
2000
2002
2004
2006
2008
2010
2012
*40
45
50
55
60
65
70
75
80
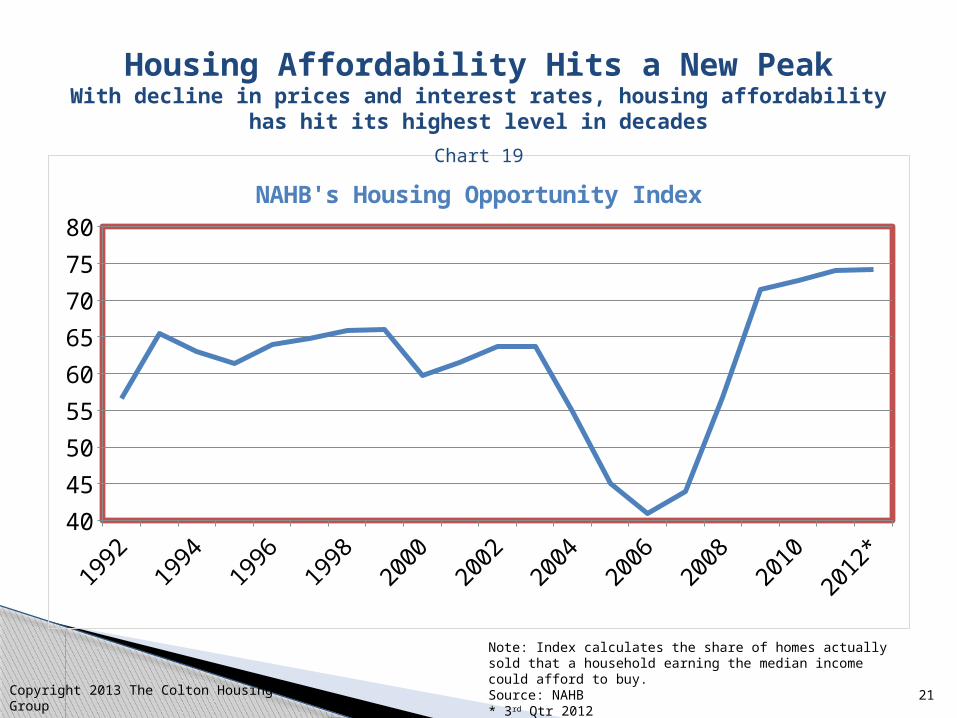
NAHB's Housing Opportunity Index
Housing Affordability Hits a New PeakWith decline in prices and interest rates, housing affordability has hit
its highest level in decades
Note: Index calculates the share of homes actually sold that a household earning the median income could afford to buy.Source: NAHB * 3rd Qtr 2012
Chart 19
Copyright 2013 The Colton Housing Group

22
Jan-
85
Jan-
87
Jan-
89
Jan-
91
Jan-
93
Jan-
95
Jan-
97
Jan-
99
Jan-
01
Jan-
03
Jan-
05
Jan-
07
Jan-
09
Jan-
110
10
20
30
40
50
60
70
80
90
100
0
200
400
600
800
1,000
1,200
1,400
1,600
1,800
2,000
NAHB/Wells Fargo Housing Market Index (HMI) and New Single-Family Starts
Housing Market Index Single-Family Starts
Ho
usin
g M
ark
et
Ind
ex
New
Sin
gle
-Fam
ily S
tarts
(in th
ousands o
f units
)
Chart 20
Builder Confidence Rises
Copyright 2013 The Colton Housing Group
23
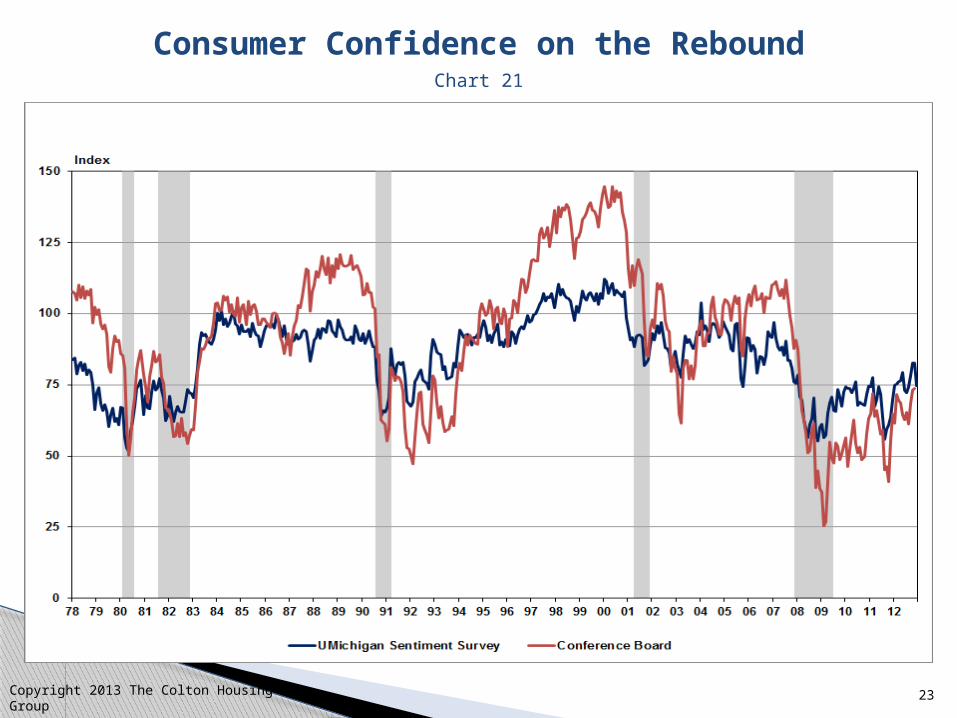
Chart 21
Consumer Confidence on the Rebound
Copyright 2013 The Colton Housing Group
24
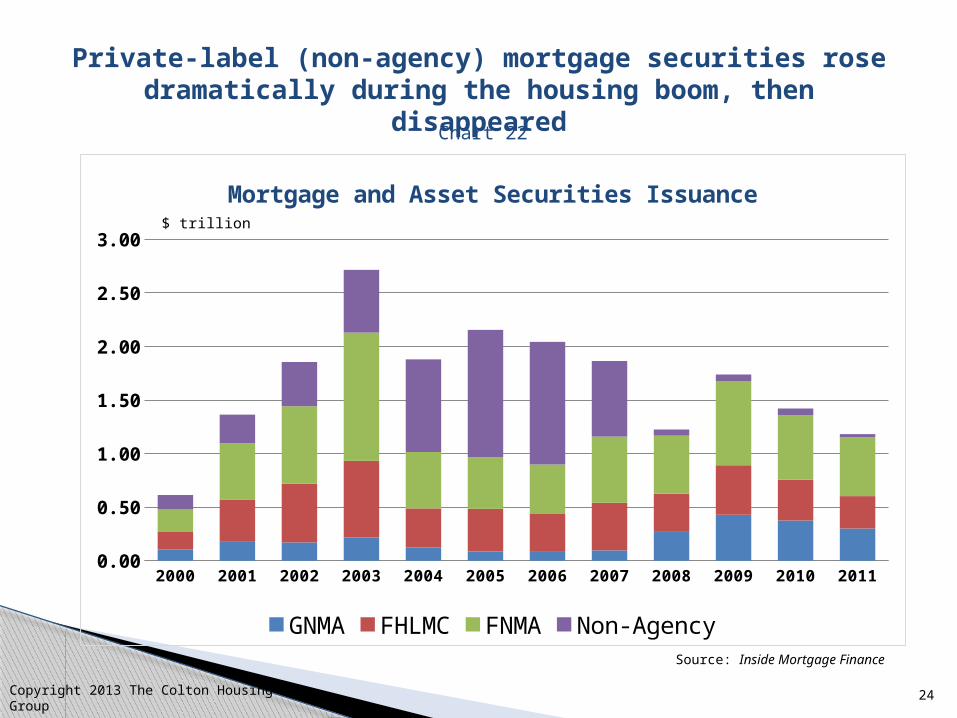
Private-label (non-agency) mortgage securities rose dramatically during the housing boom, then
disappeared
Source: Inside Mortgage Finance
Chart 22
Copyright 2013 The Colton Housing Group
2000 2001 2002 2003 2004 2005 2006 2007 2008 2009 2010 20110.00
0.50
1.00
1.50
2.00
2.50
3.00
Mortgage and Asset Securities Issuance
GNMA FHLMC FNMA Non-Agency
$ trillion
25
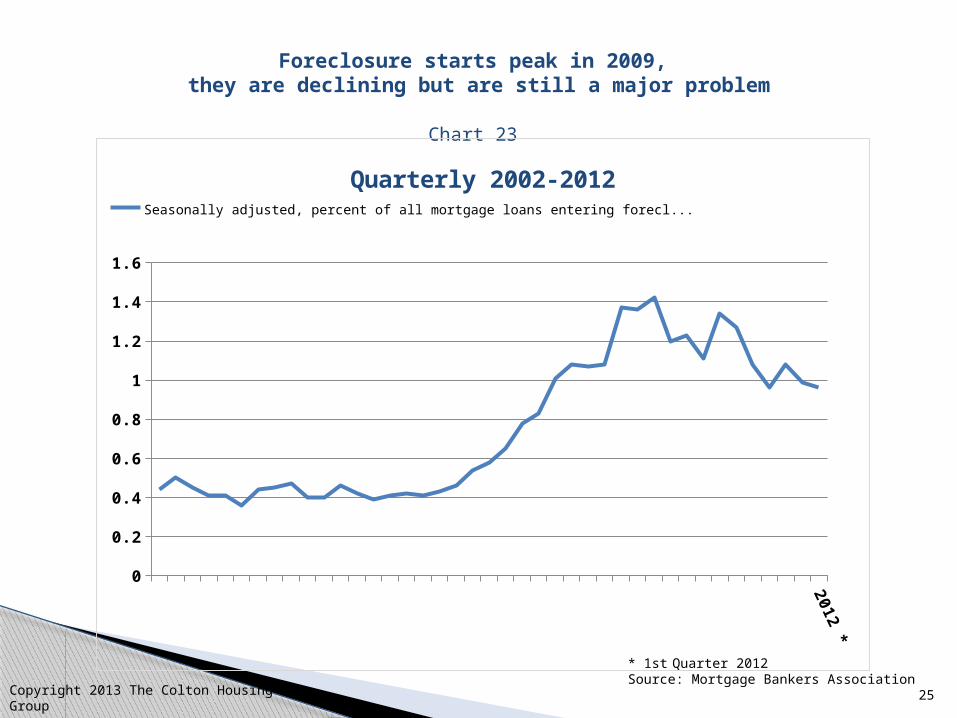
Foreclosure starts peak in 2009, they are declining but are still a major problem
* 1st Quarter 2012Source: Mortgage Bankers Association
Chart 23
Copyright 2013 The Colton Housing Group
2012 *
0
0.2
0.4
0.6
0.8
1
1.2
1.4
1.6
Quarterly 2002-2012Seasonally adjusted, percent of all mortgage loans entering foreclosure
26
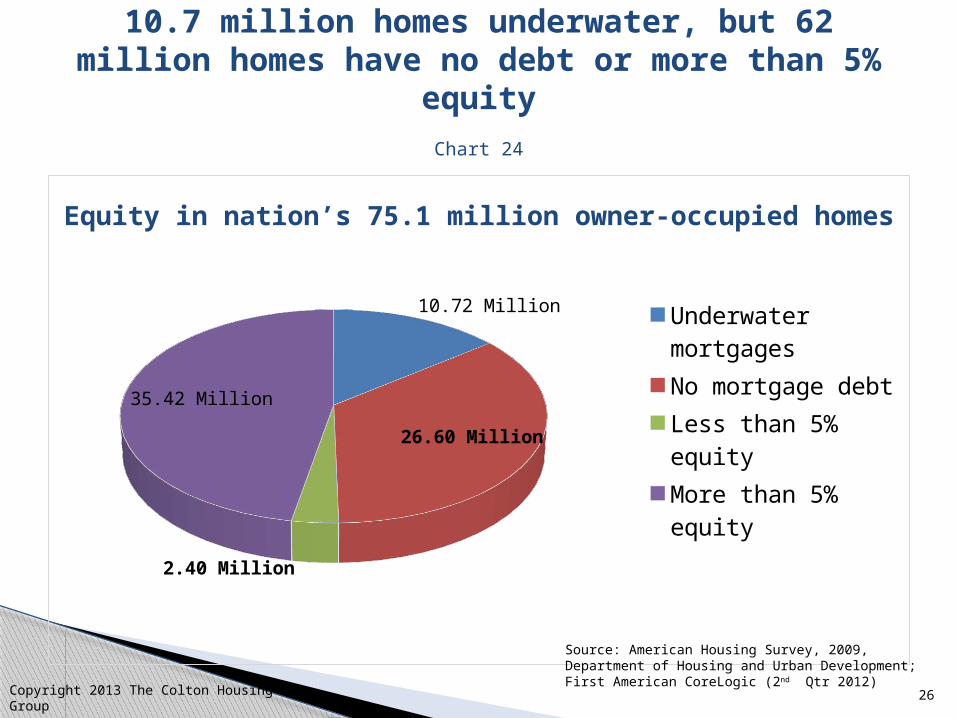
10.72 Million
26.60 Million
2.40 Million
35.42 Million
Underwater mortgagesNo mortgage debtLess than 5% equityMore than 5% equity
10.7 million homes underwater, but 62 million homes have no debt or more than 5% equity
Equity in nation’s 75.1 million owner-occupied homes
Source: American Housing Survey, 2009,Department of Housing and Urban Development;First American CoreLogic (2nd Qtr 2012)
Chart 24
Copyright 2013 The Colton Housing Group
27
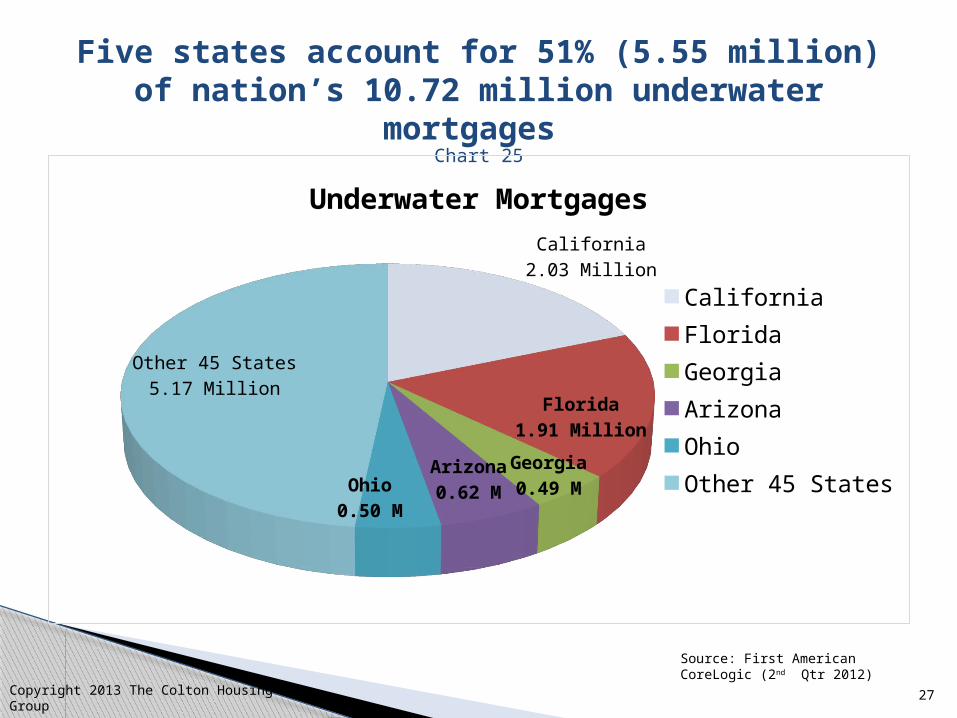
Five states account for 51% (5.55 million) of nation’s 10.72 million underwater mortgages
Chart 25
Source: First American CoreLogic (2nd Qtr 2012)
Copyright 2013 The Colton Housing Group
California2.03 Million
Florida1.91 Million
Georgia0.49 M
Arizona0.62 MOhio
0.50 M
Other 45 States5.17 Million
Underwater Mortgages
CaliforniaFloridaGeorgiaArizonaOhioOther 45 States

28
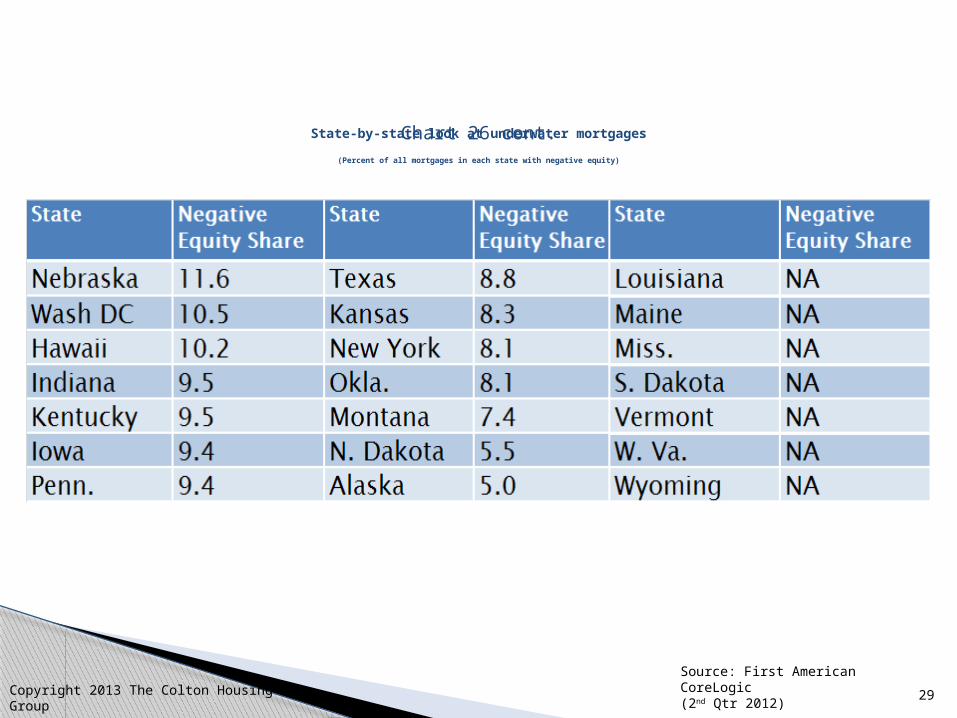
State-by-state look at underwater mortgages(as of 2nd Qtr 2012)
(Percent of all mortgages in each state with negative equity) Chart 26
Source: First American CoreLogic(2nd Qtr 2012)Copyright 2013 The Colton Housing Group
29
State-by-state look at underwater mortgages
(Percent of all mortgages in each state with negative equity)
Chart 26 cont.
Source: First American CoreLogic(2nd Qtr 2012)Copyright 2013 The Colton Housing Group
30
1989
1991
1993
1995
1997
1999
2001
2003
2005
2007
2009
2011
0
5
10
15
20
25
30
Closings as share of single-family completionsClosings as share of single-family sales
Percent
Share of single-family homes built by top 10 builders rises dramatically over past 20 years (1989-2011)
Source: BUILDER magazine
Chart 27
Copyright 2013 The Colton Housing Group
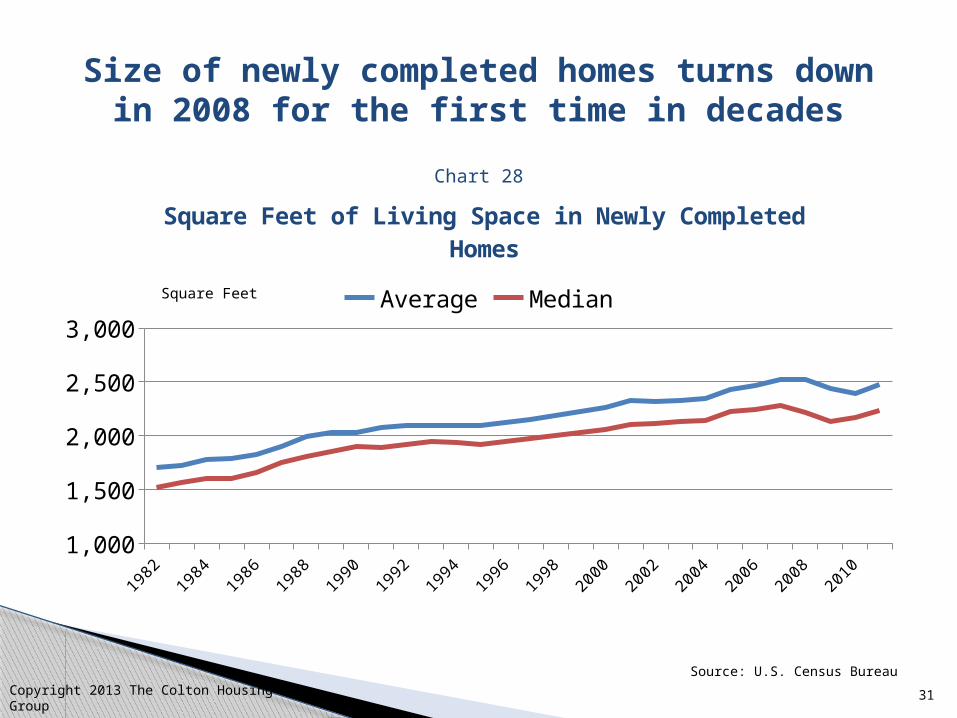
31
1982
1984
1986
1988
1990
1992
1994
1996
1998
2000
2002
2004
2006
2008
2010
1,000
1,500
2,000
2,500
3,000
Square Feet of Living Space in Newly Completed Homes
Average Median
Size of newly completed homes turns down in 2008 for the first time in decades
Source: U.S. Census Bureau
Chart 28
Square Feet
Copyright 2013 The Colton Housing Group
32
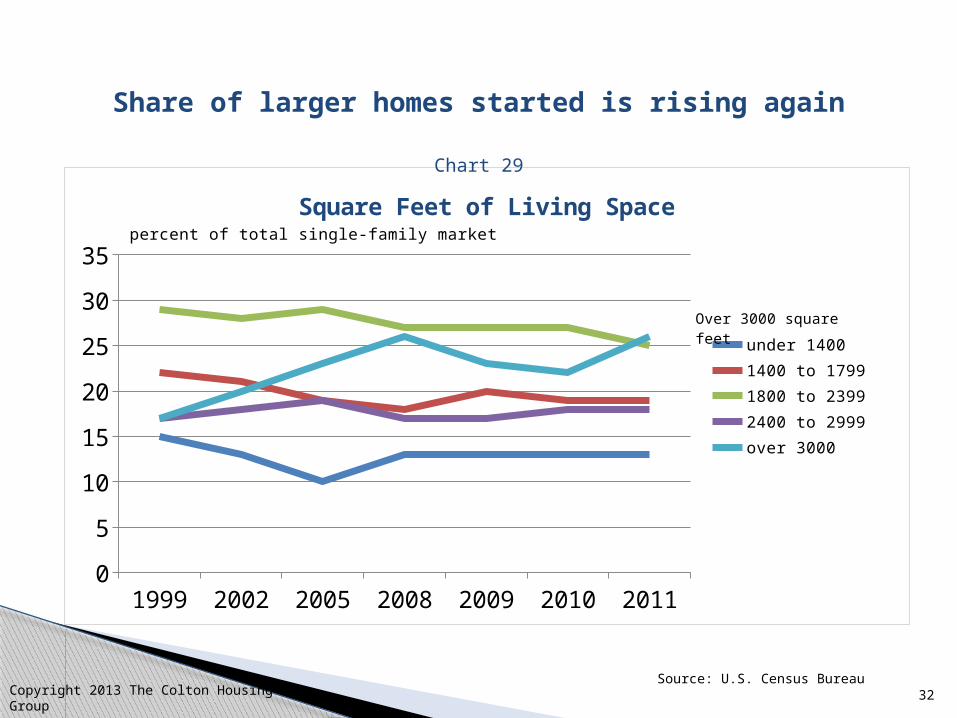
1999 2002 2005 2008 2009 2010 20110
5
10
15
20
25
30
35
Square Feet of Living Space
under 14001400 to 1799 1800 to 23992400 to 2999over 3000
percent of total single-family market
Over 3000 square feet
Share of larger homes started is rising again
Source: U.S. Census Bureau
Chart 29
Copyright 2013 The Colton Housing Group
33
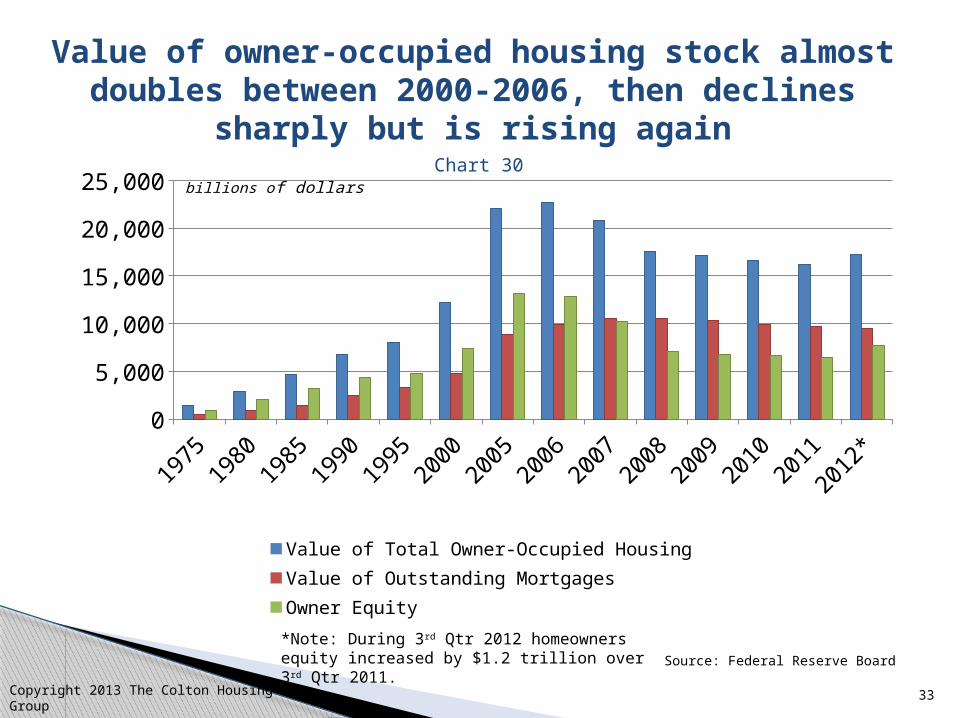
1975
1980
1985
1990
1995
2000
2005
2006
2007
2008
2009
2010
2011
2012
*0
5,000
10,000
15,000
20,000
25,000
Value of Total Owner-Occupied Housing Value of Outstanding Mortgages Owner Equity
billions of dollars
Value of owner-occupied housing stock almost doubles between 2000-2006, then declines
sharply but is rising again
Source: Federal Reserve Board
Chart 30
Copyright 2013 The Colton Housing Group
*Note: During 3rd Qtr 2012 homeowners equity increased by $1.2 trillion over 3rd Qtr 2011.
34
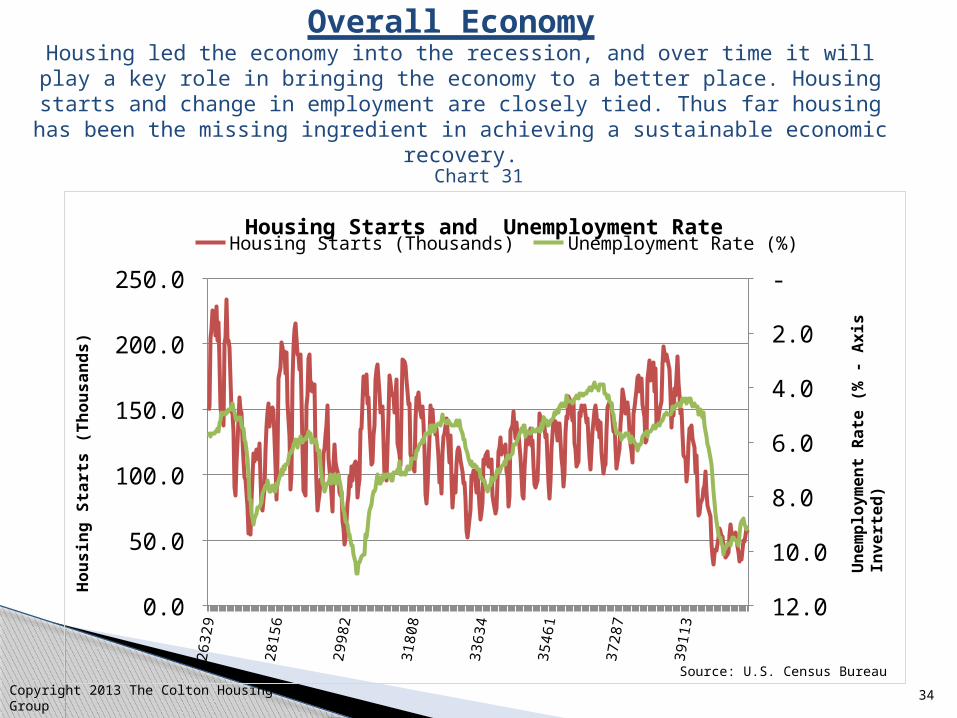
Overall Economy Housing led the economy into the recession, and over time it will play a key role
in bringing the economy to a better place. Housing starts and change in employment are closely tied. Thus far housing has been the missing ingredient in
achieving a sustainable economic recovery.
Source: U.S. Census Bureau
Chart 31
Copyright 2013 The Colton Housing Group
26
32
9
28
15
6
29
98
2
31
80
8
33
63
4
35
46
1
37
28
7
39
11
3
0.0
50.0
100.0
150.0
200.0
250.0 -
2.0
4.0
6.0
8.0
10.0
12.0
Housing Starts and Unemployment RateHousing Starts (Thousands) Unemployment Rate (%)
Housin
g S
tart
s (
Thousands)
Un
em
plo
ym
en
t R
ate
(%
- A
xis
In
vert
ed
)
35
2000
2002
2004
2006
2008
2010
2012*
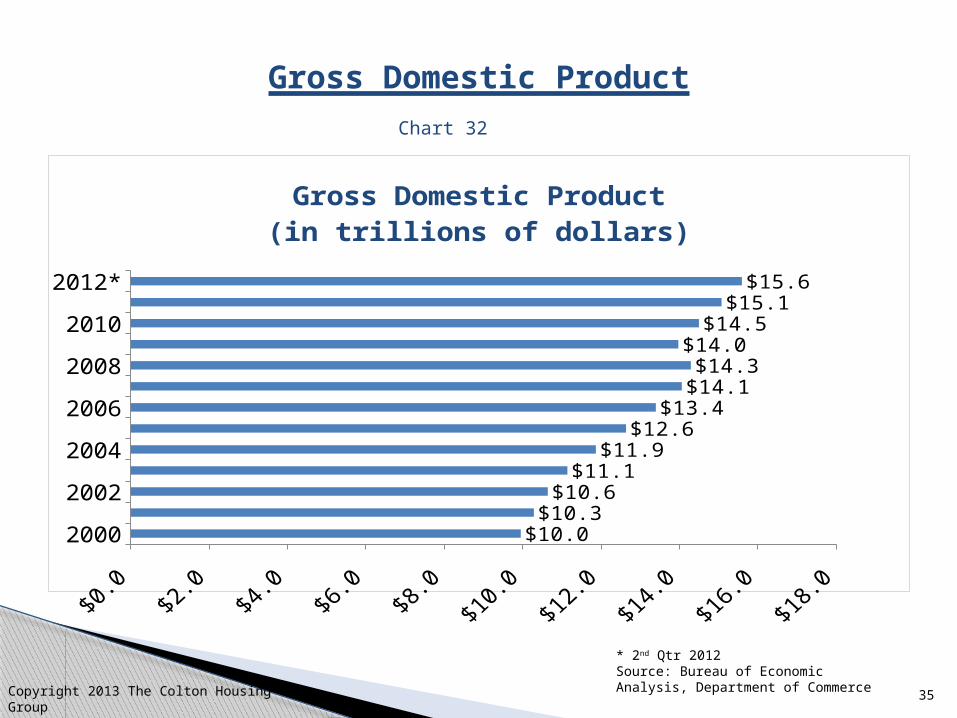
$0.0 $2.0 $4.0 $6.0 $8.0 $10.0 $12.0 $14.0 $16.0 $18.0
$10.0 $10.3
$10.6 $11.1
$11.9 $12.6
$13.4 $14.1 $14.3
$14.0 $14.5
$15.1 $15.6
Gross Domestic Product(in trillions of dollars)
Copyright 2013 The Colton Housing Group
Gross Domestic Product
* 2nd Qtr 2012Source: Bureau of Economic Analysis, Department of Commerce
Chart 32
36
1991
1994
1997
2000
2003
2006
2009
2012*
0.0 1.0 2.0 3.0 4.0 5.0 6.0 7.03.4
3.74.0
4.34.1
4.34.2
4.44.6
4.54.6
4.85.2
5.76.1
5.74.5
3.32.5
2.32.2
2.4
Residential Fixed Investment as Percent of GDP
Copyright 2013 The Colton Housing Group
Residential Fixed Investment Percent of Gross Domestic Product
* 2nd Qtr 2012Source: Bureau of Economic Analysis, Department of Commerce
Chart 33
37
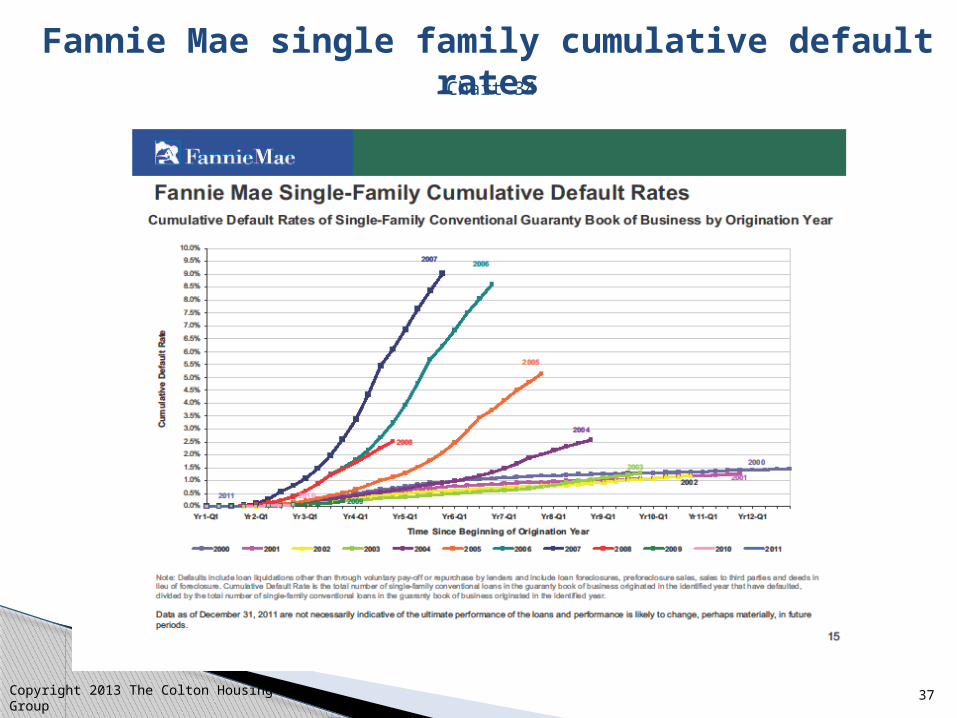
Fannie Mae single family cumulative default ratesChart 34
Copyright 2013 The Colton Housing Group
38
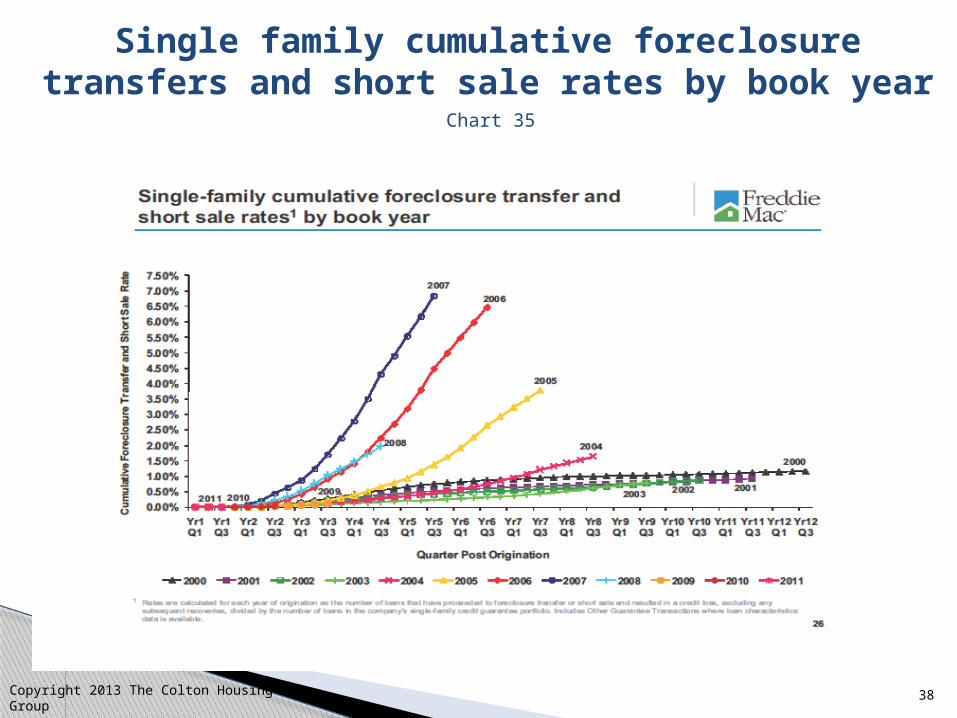
Single family cumulative foreclosure transfers and short sale rates by book year
Chart 35
Copyright 2013 The Colton Housing Group
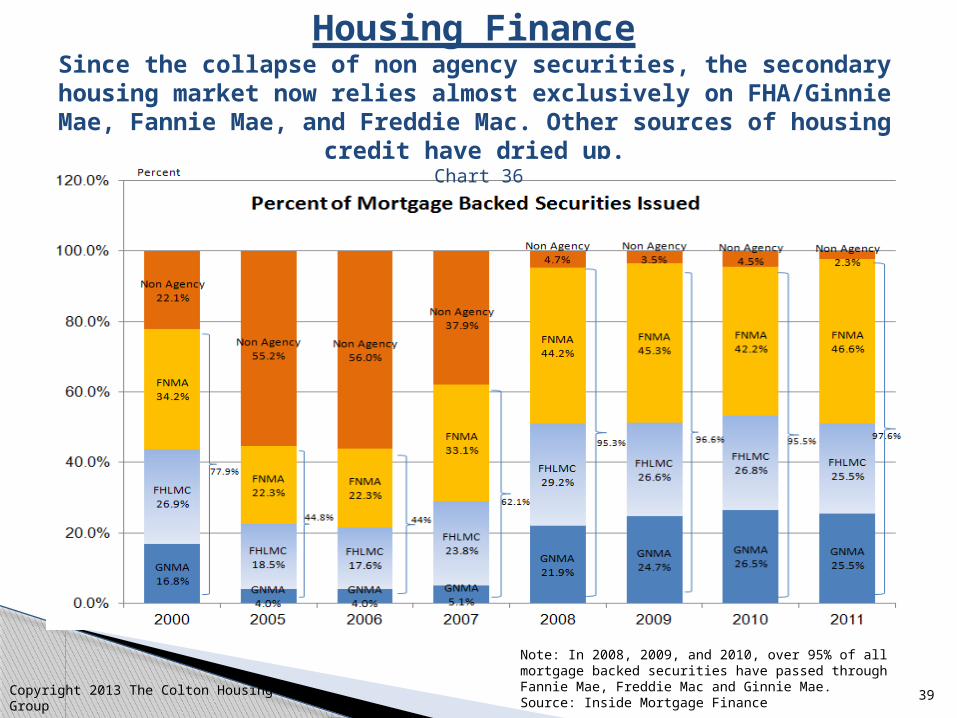
39
Since the collapse of non agency securities, the secondary housing market now relies almost exclusively on FHA/Ginnie Mae, Fannie Mae, and Freddie Mac. Other sources of housing
credit have dried up.
Note: In 2008, 2009, and 2010, over 95% of all mortgage backed securities have passed through Fannie Mae, Freddie Mac and Ginnie Mae.Source: Inside Mortgage Finance
Housing Finance
Copyright 2013 The Colton Housing Group
Chart 36

40
Foreclosure problem is generally concentrated in a select number of states.
Source: The State of the Nation’s Housing, 2010. Joint Center for Housing Studies of Harvard University, Table A-6, Page 39.
Chart 37
Foreclosure
Rate
Share of US Loans in
Foreclosure
Share of US Households with
Mortgages Foreclosure
Rate
Share of US Loans in
Foreclosure
Share of US Households
with MortgagesUnited States 4.6 100.0 100.0 Missouri 2.1 0.9 2.1Florida 14.0 23.6 6.2 Louisiana 3.4 0.8 1.2California 5.2 14.8 10.2 Utah 3.4 0.7 0.9Illinois 5.8 5.0 4.5 Kentucky 3.3 0.7 1.4New York 4.3 4.3 5.0 Oklahoma 3.0 0.6 1.1New Jersey 6.2 3.9 2.9 Alabama 2.2 0.6 1.5Ohio 4.9 3.5 4.2 Idaho 3.7 0.5 0.5Arizona 5.9 3.4 2.1 Iowa 2.8 0.5 1.1Georgia 3.9 3.2 3.3 Hawaii 4.8 0.4 0.3Texas 2.1 3.2 6.8 Mississippi 3.1 0.4 0.8Michigan 4.4 3.0 3.7 New Mexico 3.1 0.4 0.6Nevada 10.4 2.8 0.9 Kansas 2.3 0.4 1.0Pennsylvania 2.9 2.3 4.3 Maine 4.6 0.3 0.5Maryland 4.0 2.1 2.2 Delaware 3.7 0.3 0.3Indiana 4.5 1.9 2.4 Arkansas 2.1 0.3 0.9North Carolina 2.3 1.6 3.2 Rhode Island 3.6 0.2 0.3Minnesota 3.3 1.5 2.2 New Hampshire 2.6 0.2 0.5Virginia 2.1 1.5 2.9 Nebraska 1.9 0.2 0.6Massachusetts 3.4 1.4 2.2 District of Columbia 3.0 0.1 0.2Colorado 2.8 1.4 1.9 Vermont 2.7 0.1 0.2Washington 2.3 1.3 2.4 West Virginia 2.2 0.1 0.6Wisconsin 3.5 1.2 2.1 Montana 1.9 0.1 0.3South Carolina 3.4 1.1 1.5 South Dakota 1.8 0.1 0.3Connecticut 3.9 1.0 1.3 Wyoming 1.7 0.1 0.2Oregon 3.3 1.0 1.3 Alaska 1.3 0.1 0.2Tennessee 2.4 1.0 2.1 North Dakota 1.2 0.0 0.2
Copyright 2013 The Colton Housing Group
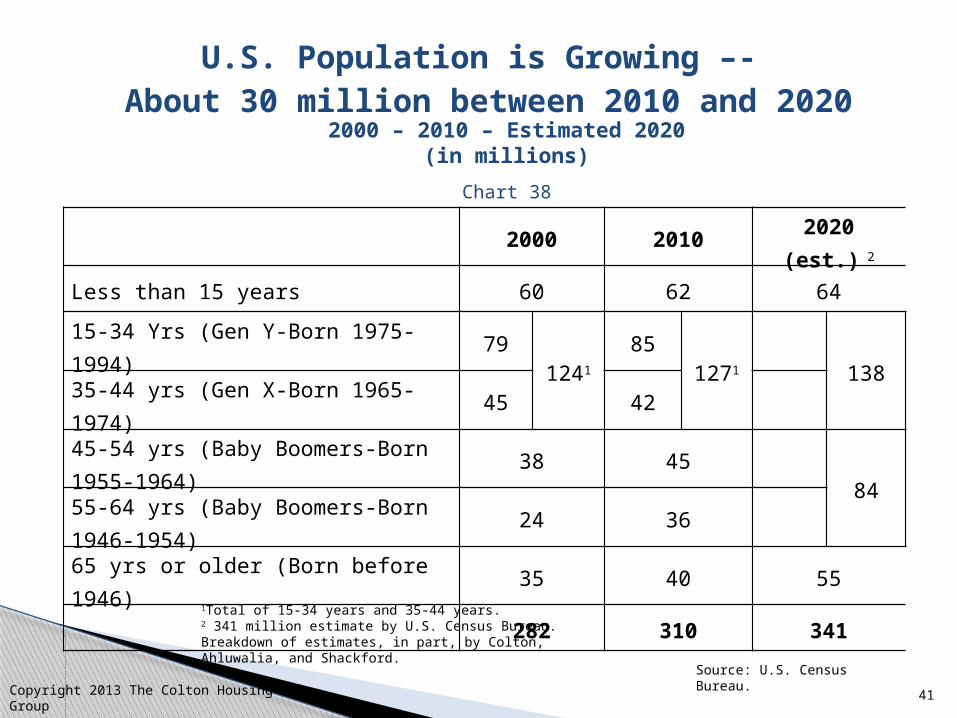
41
U.S. Population is Growing –- About 30 million between 2010 and 2020
Source: U.S. Census Bureau.
Chart 38
2000 2010 2020 (est.) 2
Less than 15 years 60 62 64
15-34 Yrs (Gen Y-Born 1975-1994) 791241
851271 138
35-44 yrs (Gen X-Born 1965-1974) 45 42
45-54 yrs (Baby Boomers-Born 1955-1964) 38 4584
55-64 yrs (Baby Boomers-Born 1946-1954) 24 36
65 yrs or older (Born before 1946) 35 40 55
282 310 341
1Total of 15-34 years and 35-44 years.2 341 million estimate by U.S. Census Bureau. Breakdown of estimates, in part, by Colton, Ahluwalia, and Shackford.
2000 – 2010 – Estimated 2020(in millions)
Copyright 2013 The Colton Housing Group
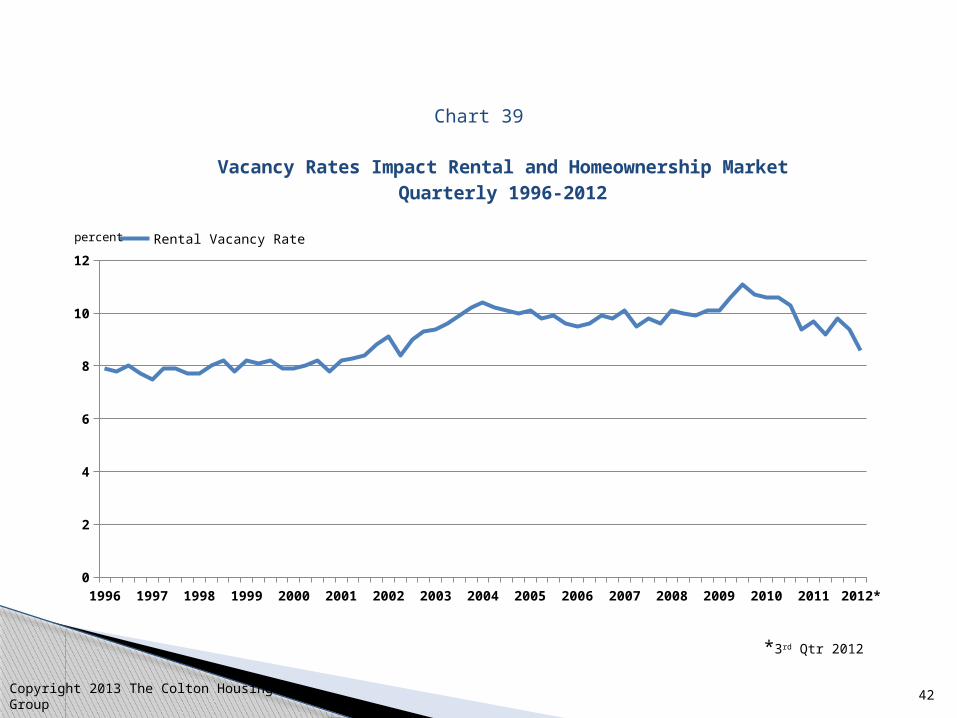
42
Chart 39
Copyright 2013 The Colton Housing Group
1996 1997 1998 1999 2000 2001 2002 2003 2004 2005 2006 2007 2008 2009 2010 2011 2012*0
2
4
6
8
10
12
Vacancy Rates Impact Rental and Homeownership MarketQuarterly 1996-2012
Rental Vacancy Ratepercent
*3rd Qtr 2012


