HYDROGEOLOGY OF A ZONE OF SECONDARY PERMEABILITY IN THE SURFICIAL AQUIFER OF EASTERN PALM BEACH COUNTY, FLORIDA By Leo J. Swayze and Wesley L. Miller U.S. GEOLOGICAL SURVEY Water-Resources Investigations Report 83-4249 Prepared in cooperation with PALM BEACH COUNTY Tallahassee, Florida 1984
Transcript
HYDROGEOLOGY OF A ZONE OF SECONDARY PERMEABILITY IN THE SURFICIAL
AQUIFER OF EASTERN PALM BEACH COUNTY, FLORIDA
By Leo J. Swayze and Wesley L. Miller
U.S. GEOLOGICAL SURVEY
Water-Resources Investigations Report 83-4249
Prepared in cooperation with
PALM BEACH COUNTY
Tallahassee, Florida
1984
CONTENTS
Page
Abs t r ac t 1
1.0 Introduction 2
1.1 Objective and existing publications 2
1.2 Approach 4
1.2.1 Geologic, water-quality, and water-level
data collection 4
1.3 Land use- 6
1.3.1 Existing and planned land use 6
2.0 Geology 8
2.1 Delineation of a zone of secondary permeability 8
2.1.1 Lithology 10
3.0 Hydrology 18
3.1 Water levels 18
3.2 Specific capacity 20
4.0 Water quality 22
4.1 Ground-water quality sampling sites 22
4.2 Chemical quality 24
4.2.1 Major inorganic constituents 24
4.2.2 Dissolved solids 26
4.2.3 Calcium carbonate hardness 28
4.2.4 Chloride 30
4.2.5 Total organic carbon 32
4.2.6 Nutrient s 34
4.2.7 Trace elements 36
5.0 Water-data sources 38
5.1 WATSTORE 38
III
HYDROGEOLOGY OF A ZONE OF SECONDARY PERMEABILITY IN THE SURFICIAL
AQUIFER OF EASTERN PALM BEACH COUNTY, FLORIDA
By Leo J. Swayze and Wesley L. Miller
ABSTRACT
The surficial aquifer is the primary source of freshwater for the heavily developed coastal area in eastern Palm Beach County. Well fields are generally located in a discontinuous zone of high second ary permeability in the surficial aquifer that extends from the Juno Beach area south to Broward County and varies in width from about 4 to 15 miles. This zone is the north ernmost extension of the Biscayne aquifer. The zone, formed by vary ing dissolution of aquifer lime stone materials during Pleistocene changes in sea level, ranges in depth from about sea level to 220 feet below sea level. Because of proximity to the Atlantic Ocean and saltwater estuaries on the east and diluted residual seawater to the west, the aquifer is susceptible to saltwater intrusion.
The ground water is predomi nantly a calcium bicarbonate type.
Dissolved solids, calcium carbonate hardness, and chloride are greatest along the saltwater-intruded coast line and in the western part of the study area where diluted resid ual seawater exists. Total organic carbon increases inland because of infiltration of rainwater through thicker layers of organic soils.
Ground-water levels in the surficial aquifer in eastern Palm Beach County are strongly influ enced by controlled levels in ca nals of the South Florida Water Management and the Lake Worth Drainage Districts. In March 1981 after 12 months of below-aver age rainfall, ground-water levels ranged from about 2 feet above sea level along the coast to nearly 21 feet above sea level, 15 miles inland in the northwest section of the study area.
SELECTED BIBLIOGRAPHY
Angel, J., 1979, Well-field explo ration program - in the Turn pike aquifer: Barker, Osha, and Anderson, Consulting En gineers, North Palm Beach, Florida, 73 p.
Durfor, C. N., and Becker, E., 1964, Public water supplies of the 100 largest cities in the United States: U.S. Geo logical Survey Water-Supply Paper 1812, 364 p.
Fischer, J. N. , 1980, Evaluation of a cavity-riddled zone of the shallow aquifer near Riviera Beach, Palm Beach County, Florida: U.S. Geological Sur vey Water-Resources Investiga tions 80-60, 39 p.
Florida Coastal Coordinating Coun cil, 1970, Florida coastal zone land use and ownership: Florida Department of Natural Resources, 80 p.
Freeze, A. R., and Cherry, J. A., 1979, Groundwater: Prentice- Hall, Inc., Englewood Cliffs, New Jersey, 604 p.
Hem, J. D. , 1970, Study and in terpretation of the chemical characteristics of natural water (2d ed.)- U.S. Geologi cal Survey Water-Supply Paper 1473, 363,p.
Land, L. F., 1975, Effects of low ering interior canal stages on saltwater intrusion into the shallow aquifer in southeast Palm Beach County, Florida: U.S. Geological Survey Open- File Report 75-74, 59 p.
1977, Ground-water resources of the Riviera Beach area, Palm Beach County, Florida: U.S. Geological Survey Water- Resources Investigations 77- 47, 38 p.
Land, L. F. , Rodis, H. G., and Schneider, J. J., 1973", Ap praisal of the water resources, of eastern Palm Beach County, Florida: Florida Bureau of Geology Report of Investiga tions 67, 11^7 p.
McCoy, H. G., and Hardee, Jack, 1970, Ground-water resources of the lower Hillsboro Canal area, southeastern Florida: Florida Bureau of Geology Report of Investigations 55, 44 p.
Miller, W. L. , and Lietz, A. C., 1976, Quality-of-water data, Palm Beach County, Florida, 1970-75: U.S. Geological Sur vey Open-File Report 76-784, 100 p.
National Oceanic and Atmospheric Administration, 1950-81, Cli- matological Data, Florida.
Palm Beach County, Department of Planning, Building, and Zoning, 1980: Comprehensive. Plan, 83 p.
Parker, G. G. , Ferguson, G. E., and Love, S. K. , 1955, Wa ter resources of southeast ern Florida: U.S. Geologi cal Survey Water-Supply Pa per 1255, 965 p.
Pitt, W. A. J. , and Meyer, F. W., 1976, Ground-water quality of the site of a proposed deep- well injection system for treated wastewater, West Palm Beach, Florida: U.S. Geolog ical Survey Open-File Report 76-91, 43 p.
Rodis, H. G., 1976, Encroach ing saltwater in northeast Palm Beach County, Florida: Florida Bureau of Geology Map Series no. 59.
Rodis, H. G. , and Land, L. F., 1976, The shallow aquifer a prime freshwater resource in Palm Beach County, Florida: U.S. Geological Survey Water- Resources Investigations 76- 21, 12 p.
Schmoker, J. W., Halley, R. B., Meyer, F. W., and Robbins, S. L. , 1979, Preliminary po rosity estimates of south Florida Cenozoic carbonate rocks based on borehole grav ity measurements: U.S. Geo logical Survey Open-File Re port 1652, 17 p.
Schneider, J. J. , 1976, Geologic data from test drilling in Palm Beach County, Florida, since 1970: U.S. Geological Survey Open-File Report 76- 713, 99 p.
Schroeder, M. C. , Milliken, D. L. , and Love, S. K. , 1954, Wa ter resources of Palm Beach County, Florida: Florida Geo logical Survey Report of In vestigations no. 13, 63 p.
Scott, W. B., 1977, Hydraulic con ductivity and water quality of the shallow aquifer, Palm Beach County, Florida: U.S. Geological Survey Water-Re sources Investigations 76-119, 22 p.
Scott, W. B., Rodis, H. G. , and Land, L. F., 1977, Saltwater intrusion in the shallow aqui fer in Palm Beach and Martin Counties, Florida: U.S. Geo logical Survey Water-Resources Investigations 76-135, 1 p.
Sherwood, C. B. , McCoy, H. J., and Galliher, C. F., 1973, Water resources of Broward County, Florida: Florida Bureau of Geology Report of Investiga tions no. 65, 141 p.
Stiff, H. A., Jr., 1951, The inter pretation of chemical water analysis by means of patterns: Journal of Petroleum Technol ogy, v. 3, no. 10, p. 15-17.
Swayze, L. J., McGovern, M. C., and Fischer, J. N., 1981, Litho- logic logs and geophysical logs from test drilling in Palm Beach County, Florida, since 1974: U.S. Geological Survey Open-File Report 81-68, 93 p.
Tarver, G. R., 1964, Hydrology of the Biscayne aquifer in the Pompano Beach area, Broward County, Florida: Florida Geo logical Survey Report of In vestigations no. 36, 47 p.
U.S. Bureau of Reclamation, 1977, Ground-water manual: Depart ment of the Interior, 480 p.
U.S. Environmental Protection Agen cy, 1977, Quality criteria for water, 1976: U.S. Government Printing Office, 256 p.
1980a, National secondary drinking water regulations: Federal Register, v. 42, no. 62, Thursday, March 31, 1977, Part I, p. 17143-17147.
1980b, National interim primary drinking water reg ulations: Federal Register, Wednesday, August 27, 1980, Part IV, Subparts A-E.
1.0 INTRODUCTION1.1 Objective and Existing
Publications
1.0 INTRODUCTION Continued 1.2 Approach
1.2.1 Geologic, Water-Quality, and Water-Level Data Collection
HYDROLOGIC AND GEOLOGIC DATA COLLECTED AT 95 WELLS IN EASTERN PALM BEACH COUNTY
Geologic, water-quality, and water-level data were used to describe the zone of secondary permeability.
Data were collected at 95 wells penetrating the surficial aquifer in eastern Palm Beach County during this investigation to delineate the zone of secondary permeability. Of this total, 56 were existing wells, and 39 were new wells drilled specifically to collect hydrologic and geologic data. The wells range in depth from 11 to 520 feet below land sur face. The types of data collected at selected wells included geology, water quality, and water-levels.
Geologic data collected at 68 wells included lithologic logs, driller's logs, and geophysical logs (spontaneous potential, resis tivity, neutron, and gamma-ray) (Swayze and- others, 1981). These data were interpreted and corre lated to determine the aquifer geology and to estimate the areal and vertical extent of the zone of secondary permeability in the sur ficial aquifer.
Point ground-water samples were collected from 39 wells pene trating the aquifer to depths rang ing from 40 to 252 feet below land surface. These samples were ana lyzed for selected parameters and used to evaluate the vertical and spatial distribution of water-qual ity types in the surficial aquifer.
Water levels were measured in 30 wells which range in depth from 11 to 279 feet below land surface. Continuous water-level recorders were installed in 13 wells.
Figure 1.2.1-1 shows the study area, locations of all wells used for data collection, and the local well numbers. A complete tabula tion of water-quality, water-level, and well-construction data at these wells is available from the Na tional Water Data Storage and Re trieval System (WATSTORE). For information about WATSTORE, see section 5.0 of this report.
8O°I5 80° OO
26° 45
26°30 -
EXPLANATION
WELL LOCATION AND TYPE OF DATA COLLECTED:
PB-698 WELL NUMBER GEOLOGIC DATAA WATER-QUALITY DATA
WATER-LEVEL DATAm GEOLOGIC, WATER QUALITY ANDW WATER-LEVEL DATA GEOLOGIC AND WATER-LEVEL
DATAT GEOLOGIC AND WATER-
QUALITY DATAWATER-LEVEL AND WATER- QUALITY DATA
SMILES
5 KILOMETERS
STUDY AREA
Figure 1.2.1-1. Locations of wells and types of data collected in eastern Palm Beach County.
5
1.0 INTRODUCTION Continued 1.2 Approach
1.2.1 Geologic, Water-Quality, and Water-Level Data Collection
1.0 INTRODUCTION Continued 1.3 Land Use
1.3.1 Existing and Planned Land Use
LAND USE INFLUENCES FRESHWATER NEEDS IN PALM BEACH COUNTY, FLORIDA
Continued growth in Palm Beach County will result in the needfor further development of freshwater resources. The surficialaquifer is the only fresh ground-water source being developed.
Land use and development in eastern Palm Beach County will greatly influence location and de velopment of additional freshwater sources. The densely populated and developed section of Palm Beach County, originally limited to a narrow urbanized coastal band, is steadily expanding west into for merly undeveloped and agricultural areas. Development of the county's main freshwater source, the surfi cial aquifer, is also expanding to the west from the coastal area. Increasing numbers of municipal well fields, industries, and pri vate wells are drawing water from the aquifer.
Figure 1.3.1-1 shows existing incorporated municipal areas, major well fields, and the generalized land-use areas designated for east ern Palm Beach County. Present land-use guidelines are part of the 1980 Comprehensive Plan for Palm Beach County.
Figure 1.3.1-2 shows general ized land use for the same area in 1970. A comparison of the two fig ures reveals the appreciable growth rate and the increase in municipal well-field pumpage required to sup ply this increased growth.
80° 15 80° 00
26° 45
26° 30
PALM BEACH COUNTY
EXPLANATION
INCORPORATED MUNICIPAL AREA
^H HIGH TO LOW DENSITY - RESIDENTIAL AREA (12 DWELLING UNITS PER ACRE TO I DWELLING UNIT PER 2.5 ACRES)
I I VERY LOW DENSITY- RESIDENTIAL AREA
(I DWELLING UNIT PER5 ACRES)
HP INDUSTRIAL AREA
CONSERVATION AREA
PRESERVATION AREA (UNIQUE FARMLAND OR MARGINAL WETLAND)
3.2 MUNICIPAL WELL FIELD ' ' AND I960 DAILY PUMPAGE,
IN MILLION GALLONS PER DAY
O 5 MILES I ___________ 1
15 KILOMETERS
STUDY AREA
Figure 1.3.1-1. Generalized land-use areas, municipal areas, and major well fields in eastern Palm Beach County, 1980.
7
80*15 80° 00'
26° 45
26° 30
EXPLANATION
RESIDENTIAL OR INDUSTRIAL AREA
AGRICULTURAL DEVELOPMENT
CONSERVATION AREA
| | UNDEVELOPED AREA
36 MUNICIPAL WELL FIELD * AND 1970 DAILY PUMPAGE,
IN MILLION GALLONS PER DAY
0 5 MILES I___________I
5 KILOMETERS
STUDY AREA
Figure 1.3.1-2. Generalized land-use areas, municipal areas, and major well fields in eastern Palm Beach County, 1970.
1.0 INTRODUCTION Cont inued 1.3 Land Use
1.3.1 Existing andPlanned Land Use
7/1
2.0 GEOLOGY2.1 Delineation of a Zone of Secondary Permeability
PRESENCE OF SOLUTION CAVITIES DELIMITS ZONE OF SECONDARY PERMEABILITY
A zone of secondary permeability in the surficial aquifer was produced by dissolution of cementing materials.
A discontinuous zone of sec ondary permeability, which is the northernmost extension of the Bis- cayne aquifer, exists in much of the surficial aquifer in eastern Palm Beach County. A geohydrologic de scription of the Biscayne aquifer can be found in Parker and others (1955). The increased permeability in this zone of the aquifer is due to post-depositional dissolution of calcareous materials in the Anasta- sia Formation of Pleistocene age (Parker and others, 1955, p. 100). The materials removed appear to have been calcitic cementing agents that bound together the calcareous quartz sandstones, coquinas, and sandy limestones (Fischer, 1980, p. 17). Dissolution of cementing materials produces the characteristic "cavity- riddled" lithology and secondary permeability. Many of the litho- logic units extend beyond the areal extent of the zone, differing only in the absence of cavities (or lower secondary permeability). The amount of secondary permeability develop ment in the zone varies greatly both vertically and horizontally.
The zone of secondary perme ability was identified in 49 of 68 geologic test wells in eastern Palm Beach County. The presence of solu tion cavities was indicated during drilling by frequent loss of circu lating fluid or 3- to 5-inch drops of the rotating drill bit. Drilling cuttings from the zone commonly con tained subrounded particles, cal- cite crystals, and large amounts of loose, fine-grained, quartz sand that are further indications of par tially filled cavities.
Figure 2.1-1 delineates the ap proximate areal extent of the zone of secondary permeability. Also shown are the locations and well numbers of the 68 selected geo logic test wells (49 in the zone) and lithologic section lines used to delineate the zone.
The zone of secondary perme ability lies below sea level, and the thickness is variable as indi cated by the following top anil bot tom altitudes.
*Well did not completely pene trate the zone of secondary perme ability.
The degree of permeability is also variable within the zone. So lution cavities are most likely to be found 50 to 70 feet below sea level and are common between 45 and 110 feet below sea level (fig. 2.1-2).
80° 15 80° 00
26° 45
26° 30 -
Riviera Beach
PB-632B-eooWest Palm
Beach
EXPLANATION
ZONE OF SECONDARY PERME- 1 ' ABILITY, BOUNDARY DASHED
WHERE INFERRED.
0A' LOCATION OF LITHOLOGIC SECTION.
PB-675 WELL LOCATION AND NUMBER, WHERE CAVITIES WERE
Figure 2.1-1. Locations of geologic test lithologic section lines, and estimated extent of the zone of higher secondary permeability.
wells, areal
G w I«
qft
) K
j
CD
P.
O
0O
(D
rj
pj N
O
rr
Ovj
HI
f NJ I NJ I ft> 1-1 o
ft)
H
CO
CO
O
H-
O
t3
O
rt
coS3
* <J
.
p.
ft
K-
(D
CO O o o CD <: K-
rt V
DE
PT
H
OF
CA
VIT
Y
OC
CU
RR
EN
CE
, IN
F
EE
T
BE
LOW
S
EA
LE
VE
L
CD m
ro
roro
C
3 00
£^)
^^
-e»
ro
o
<=>
oo
cr>
-e»
C3
C3
O
m r- r-
er>
oo
o
*=>I O
|-
^>
^o
m
w o
o
o
c m
g
o
\i
2.0 GEOLOGY Continued2.1 Delineation of a Zone of Secondary Permeability-
2.1.1 Lithology-Continued
LITHOLOGIC SECTIONS THROUGH THE ZONE OF SECONDARY PERMEABILITY
The zone of secondary permeability in the surficial aquifer was formed as a result of sea-level variations during the Pleistocene Epoch.
The materials that form the surficial aquifer in eastern Palm Beach County were deposited in a variety of environments ranging from beach and lagoonal to shallow marine. The axes of the lithologic units generally trend north-south, paralleling the present shoreline. The stratigraphy and lithology rep resent depositional and erosional cycles due to sea-level changes during Pleistocene time.
Lithologic sections A-A 1 to G-G f , shown in figures 2.1.1-1 to 2.1.1-7 (see figure 2.1-1 for section locations), indicate the extreme variability of the depth and thickness of the zone of sec ondary permeability. Changes in sea level and corresponding changes in ground-water levels, combined with variable susceptibility to dissolution of the aquifer materi als, created the cavity-riddled characteristics which resulted in the secondary permeability.
10
200
EXPLANATION
frXj SANDSTONE
'.gH SAND
^~T) LIMESTONE- !-
:>>-] CLAY
>C!l SHELL (COQUINA)
ZONE OF SECONDARY ^H PERMEABILITY
3 MILES
1234 KILOMETERS
VERTICAL SCALE GREATLY EXAGGERATED
Figure 2.1.1-1. Lithologic section A-A1 .
2.0 GEOLOGY Cont inued2.1 Delineation of a Zone of
Secondary Permeability Continued 2.1.1 Lithology '
SEA LEVEL
200 200
EXPLANATION
fr'Xj SANDSTONE
ifU SAND
t~T| LIMESTONE
^ CLAY
lFv!l SHELL (COQUINA)
ZONE OF SECONDARY^H PERMEABILITY
3 MILES
I 2 3 4 KILOMETERS
VERTICAL SCALE GREATLY EXAGGERATED
Figure 2.1.1-2. Lithologic section B-B f .
SEA LEVEL SEA LEVEL
180
2OO
EXPLANATION
SANDSTONE
SAND
LIMESTONE
CLAY
SHELL (COQUINA)
ZONE OF SECONDARY PERMEABILITY
3 MILES
1234 KILOMETERS
VERTICAL SCALE GREATLY EXAGGERATED
Figure 2.1.1-3. Lithologic section C-C 1 .
2.0 GEOLOGY Cont inued2.1 Delineation of a Zone of
Secondary Permeability Continued 2.1.1 Lithology'
13
FEET
SEA LEVEL
i 20
SEA LEVEL
200
EXPLANATION
SANDSTONE
SAND
LIMESTONE
CLAY
SHELL (COQUINA)
ZONE OF SECONDARY PERMEABILITY
3 MILES
1234 KILOMETERS
VERTICAL SCALE GREATLY EXAGGERATED
Figure 2.1.1-4. Lithologic section D-D f .
200
EXPLANATION
>X>j SANDSTONE
iH SAND
t~d LIMESTONE
I!!! CLAY
J%3 SHELL (COQUINA)
era ZONE OF SECONDARY Ml PERMEABILITY
3 MILES
0123 4 KILOMETERS
VERTICAL SCALE GREATLY EXAGGERATED
Figure 2.1.1-5. Lithologic section E-E 1 .
2.0 GEOLOGY Continued2.1 Delineation of a Zone of
Secondary Permeability Continued 2.1.1 Lithology '
/JT
EXPLANATION
SANDSTONE
SAND
LIMESTONE
CLAY
SHELL (COOUINA)
ZONE OF SECONDARY PERMEABILITY
3 MILES
1234 KILOMETERS
VERTICAL SCALE GREATLY EXAGGERATED
Figure 2.1.1-6. Lithologic section F-F 1 .
G'
Ol Q OQ. o "° »rZ
FEET «? 7 R S* 7 i ® I?/ 7*2. ?
20 ," " \
SEA LEVEL
2O
4O
6O
80
IOO
120
140
I6O
I8O
?nn
flliSVV?^^;V.V.«X^
Wi^^l ^** I *"*
~~ "-. ^v n
liiiil
^
M - -
_,r
,r - - -
,,r -
5?
*.
y
--fl:£^^;:::^'^* **Vi
¥=|
ir
H*«a
L^-^T*
-~ ~* r-
i -^ ~ i i -» i -^ i .
i J*
i ~ » i -~ i - i ~ i. j -T1^?5"
-. i ~ * *r ]
i -"^JL'T'
T ', '
Mr-r^
tr4=n
» i -» i -«..
~ i
«^cv:h»^ ~ i --" JL^ -i -j^ - » > i .rf.Jt-r-i
" ' i ~rr I,, - i . i
L.T-i
::¥:>:>:|:::|:^=A-J^-j:=Hr
FEET
j 2O
i SEA LEVEL
20
4O
6O
c- 80,
- IOO
~r I2O
,
' 160
r: I8O
-
;>on
EXPLANATION
iXQJ SANDSTONE
gijj SAND
^~T| LIMESTONE
^ CLAY
~-C| SHELL (COQUINA)
B ZONE OF SECONDARY PERMEABILITY
3 MILES
T 1 T I 1234 KILOMETERS
VERTICAL SCALE GREATLY EXAGGERATED
Figure 2.1.1-7. Lithologic section G-G f .
2.0 GEOLOGY Continued2.1 Delineation of a Zone of
Secondary Permeability Continued 2.1.1 Lithology
/7 )
3.0 HYDROLOGY3.1 Water Levels
GROUND-WATER LEVELS IN EASTERN PALM BEACH COUNTY ARE CONTROLLED BY MAN
Ground-water levels in the surficial aquifer are influenced by controlled levels in canals of the South Florida Water Management
and Lake Worth Drainage Districts. Recharge of the aquifer occurs by infiltration from these canals and from rainfall.
Recharge of the surficial aquifer in eastern Palm Beach Coun ty occurs by infiltration from ca nals and rainfall. Surface water is pumped east from the L-40 Canal and north from the Hillsboro Canal through a network of lateral and equalizing canals. Surface water is also conveyed east in Canals L-8 and M to augment water in the West Palm Beach water-catchment area which replenishes municipal sur face-water supplies for West Palm Beach (fig. 3.1-1).
Yearly rainfall measured at the West Palm Beach Airport weather station (NOAA) averaged 60.07 in ches between 1950 and 1980 and ranged from 37.31 to 79.75 inches (fig. 3.1-2). Comparison of daily rainfall at the West Palm Beach Airport and water levels in wells PB-99, PB-809, and PB-445 during water year 1980 (fig. 3.1-3) illu strates the different responses of ground-water level to rainfall. Well PB-99 is a shallow well (18 feet below land surface) in an area of water levels partly controlled by canals. Responses to rainfall are rapid, and the hydrograph shows seasonal water-level trends. Well PB-809, a deep well (145 feet below land surface) near well PB-99, ex hibits extreme variations in water levels. These variations are due to pumpage from a nearby well field. Responses to rainfall are slower due to the time required for leakage of water through dis continuous semiconfining layers of sandy clays at shallower depths. The hydrograph also shows seasonal water-level trends. Well PB-445 is a shallow well (11.4 feet below land surface) in an area highly controlled by canals. Responses to rainfall are dampened, and very slight seasonal trends are noted.
Dry-season water levels for eastern Palm Beach County, measured on March 18-23, 1981, ranged from about 2 to almost 21 feet above sea level (fig. 3.1-1). During the previous 12 months, rainfall was about 18 percent (10.8 inches) be low the long-term average. The water level in Conservation Area no. 1 was about 13.6 feet, nearly 2 feet below normal.
Ground water flows from areas of high-water levels towards areas of low-water levels in a direction perpendicular to water-level con tours. A ground-water divide is a ridge in the water level from which ground water moves away in both directions. In the southern half of eastern Palm Beach County, a ground-water divide runs approx imately parallel to the Florida Turnpike. Ground water flows both east and west from this line. Eastward flow is eventually dis charged -to the ocean or may be intercepted by canals with lower water levels. Westward flow is eventually discharged to canals bordering Conservation Area no. 1. The ground-water divide is transi tory; its position can be changed by manipulating water levels in canals of the Lake Worth Drainage District.
Construction of major canals, such as the West Palm Beach and Hillsboro Canals, have altered re gional ground-water flow directions considerably. Flow directions have generally changed from west to east to north and south directions in areas neighboring these canals (fig. 3.1-1). Major points of ground-water discharge are the Lox- ahatchee River estuary, Intracoast- al Waterway, Atlantic Ocean, West Palm Beach Canal, and Hillsboro Ca nal.
18
80° 15 80° 00
\Pgi565 \\-\\ VA1 Tequesta
26°45
26°30
WEST PALM BEACHWATER CATCHMENT
AREA
Loxahatchee RiverEstuary
v Jupiter Inlet
Jupiter
Juno Beach
Lake Park
Riviera Beach
West Palm Beach
Palm Beach
PB-99 7.34
Lake Worth -^PB-88
I 3.04
f Boynton Beach
Delray Beach
PB-896 897 TI
<fc3.37 2.02 > 1006 1.98
PB-895 947 2.58 ' 2.88
Boca Raton PB-732
4.22*^ <
BROWARD
EXPLANATION
LAKE WORTH DRAINAGE DISTRICT.
5 WATER-LEVEL CONTOUR SHOWS ALTITUDE OF WATER LEVEL.CONTOUR INTERVAL 5 FEET. DATUM IS SEA LEVEL.
@ PB-732 RECORDER WELL. UPPER 4.22 NUMBER IS WELL NUMBER,
LOWER NUMBER IS WATER LEVEL, IN FEET ABOVE SEA LEVEL.
m PB-1085 WATER-LEVEL WELL.UPPER 1601 NUMBER IS WELL NUMBER,
LOWER NUMBER IS WATER LEVEL.IN FEET ABOVE SEA LEVEL.
CONTROL STRUCTURE.
-* GENERALIZED DIRECTION OF GROUND-WATER FLOW.
5 MILES
5 KILOMETERS
STUDY AREA
Figure 3.1-1. Water-level contours and generalized direction of ground-water flow (surficial aquifer), eastern Palm Beach County (March 18-23, 1981).
WET SEASON (MAY-OCT.) H DRY SEASON (NOV.-APR.) t 1
Figure 3.1-2. Total annual rainfall, November through October 1949-82, West Palm Beach Airport (NOAA).
I I I ! I I I I I
Oz
- 2
LiOCT I NOV I DEC | JAN | FEB MAR | APR I MAY JUNE JULY AUG | SEP
Figure 3.1-3. Daily high water levels in wells PB-99, PB-809, and PB-445 for water year 1980 (surfical aquifer), eastern Palm Beach County, and total daily rainfall, West Palm Beach Airport.
3.0 HYDROLOGY3.1 Water Levels
3.0 HYDROLOGY Continued3.2 Specific Capacity
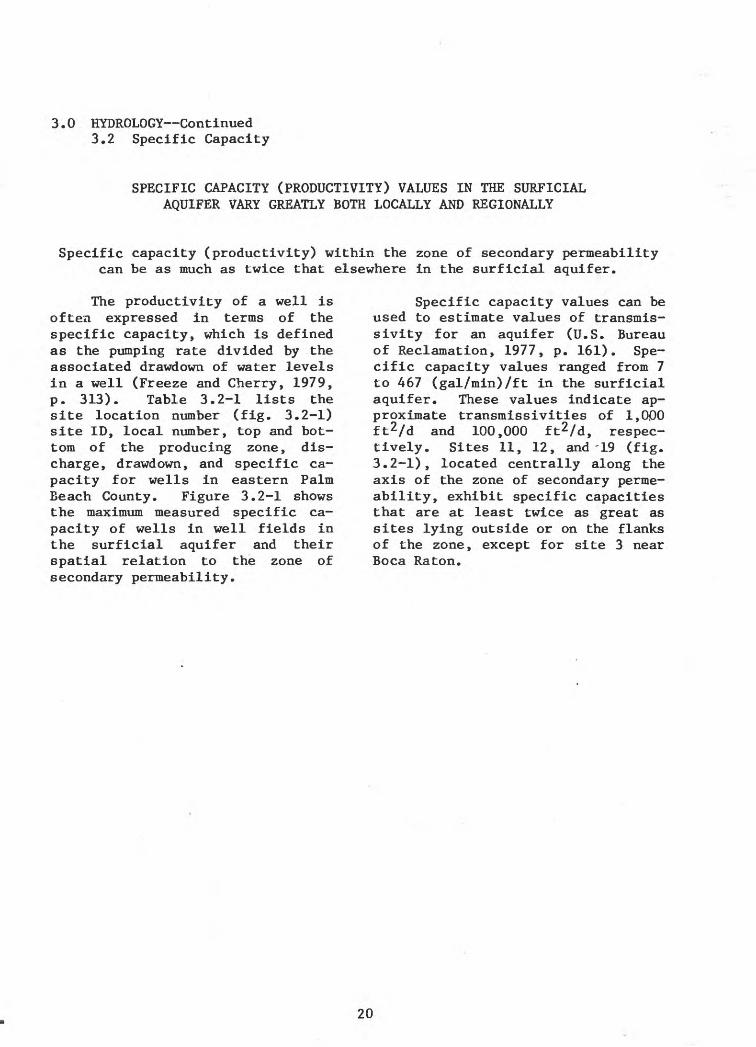
SPECIFIC CAPACITY (PRODUCTIVITY) VALUES IN THE SURFICIAL AQUIFER VARY GREATLY BOTH LOCALLY AND REGIONALLY
Specific capacity (productivity) within the zone of secondary permeability can be as much as twice that elsewhere in the surficial aquifer.
The productivity of a well is often expressed in terms of the specific capacity, which is defined as the pumping rate divided by the associated drawdown of water levels in a well (Freeze and Cherry, 1979, p. 313). Table 3.2-1 lists the site location number (fig. 3.2-1) site ID, local number, top and bot tom of the producing zone, dis charge, drawdown, and specific ca pacity for wells in eastern Palm Beach County. Figure 3.2-1 shows the maximum measured specific ca pacity of wells in well fields in the surficial aquifer and their spatial relation to the zone of secondary permeability.
Specific capacity values can be used to estimate values of transmis- sivity for an aquifer (U.S. Bureau of Reclamation, 1977, p. 161). Spe cific capacity values ranged from 7 to 467 (gal/min)/ft in the surficial aquifer. These values indicate ap proximate transmissivities of 1,000 ft2/d and 100,000 ft2 /d, respec tively. Sites 11, 12, and-19 (fig. 3.2-1), located centrally along the axis of the zone of secondary perme ability, exhibit specific capacities that are at least twice as great as sites lying outside or on the flanks of the zone, except for site 3 near Boca Raton.
20
80° 15 80° 00
26°45
26° 30 - B Z03
EXPLANATION
ZONE OF SECONDARY PERMEABILITY, BOUNDARY DASHED WHERE INFERRED
UPPER NUMBER IS SPECIFIC CAPACITY DATA SITE NUMBER, LOWER NUMBER IS SPECIFIC CAPACITY MAXIMUM
5 MILES ___________I
5 KILOMETERS
STUDY AREA
Figure 3.2-1. Maximum measured specific capacity of wells in well fields and spatial relationships to the zone of higher secondary permeability.
producing zone, discharge, drawdown, and specific capacity for wells ineastern Palm Beach County
4.0 WATER QUALITY4.1 Ground-Water Quality Sampling Sites
SAMPLING SITE LOCATIONS
Ground-water samples were collected and analyzed for 39 wells in eastern Palm Beach County.
Ground-water samples were col lected from 39 wells penetrating the surficial aquifer In eastern Palm Beach County. Sampling depths ranged from 40 to 252 feet below land surface. Concentrations of selected constituents in the water were determined to evaluate water quality In the aquifer and areal water-quality trends, particularly
in the zone of secondary permeabil ity.
Figure 4.1-1 shows the loca tion of wells selected for water- quality sampling. Complete water- quality data for these sites are available through WATSTORE. For information about WATSTORE, see section 5.0 of this report.
22
80° 15' 80C 00
26C 45'
26° 30 -
PALM BEACH COUNTV
BROWARD I COUNT V
EXPLANATION
9 SAMPLING WELL PB-692 AND NUMBER
5 MILES
5 KILOMETERS
Figure 4.1-1. Location of ground-water qualitysampling sites.
4.0 WATER QUALITY4.1 Ground-Water Quality Sampling Sites
4.0 WATER QUALITY Continued 4.2 Chemical Quality
4.2.1 Major Inorganic Constituents
CALCIUM BICARBONATE TYPE WATER TYPIFIES SURFICIAL AQUIFER
Calcium bicarbonate type water is dominant throughout thesurficial aquifer in eastern Palm Beach County, including
the zone of secondary permeability.
The composition of water can be conveniently illustrated by a polygonal diagram (Stiff, 1951), using three parallel axes extending on each side of a vertical zero axis. Concentrations of major ca tions and anions, in milliequiva- lents per liter, are plotted on their respective axis. The result ing points are connected to form an irregular polygonal shape which is a visual description of the water composition. Differences or simi larities in waters can be recog nized by comparing the polygonal shapes (Stiff diagrams). Stiff di agrams for water from several wells in the surficial aquifer are shown in figure 4.2.1-1.
The similarity of water sam ples collected along a north-south line, away from the influence of seawater intrusion, to the east and diluted residual seawater to the west is evident. Changes in con centrations expand or contract the polygons, but the basic shape has little change where the water type remains constant. As the cations and anions increase or decrease, the polygon shape changes as illus trated by the NaCl (salt) dominated sample from well PB-889.
Water is classified by its dominant cation (sodium and potas sium, calcium, and magnesium) and anion (chloride, bicarbonate, and
sulfate) groups. Water in the zone of secondary permeability (wells PB-1086, PB-1091, and PB-1103) is of the calcium bicarbonate type. In areas of diluted residual sea- water (well PB-1094), codominance of calcium bicarbonate and sodium chloride occurs in the aquifer wa ter, and in areas of saltwater in trusion (well PB-889), sodium chlo ride water dominates.
Generally, better water qual ity exists in the zone of secondary permeability because of higher per meabilities and higher ground-water gradients, allowing freshwater from rainfall to dilute and replace re sidual seawater. Because of lower permeabilities to the west, less replacement and dilution of resid ual seawater have occurred, yield ing water of poorer quality. Lower permeabilities in western areas could be due to the presence of Limestones more resistant to solu tion, which result in slower flush ing rates or Pleistocene ground- water gradients structured to cre ate a large area of insufficient ground-water flow necessary for the formation of secondary permeabil ity.
Water-quality analyses of sam ples collected from 25 wells in eastern Palm Beach County in July 1980 are given in table 4-.2.1-1.
24
Tabl
e 4.
2.1-
1". '
Fie
ld m
easurements
and
majo
r ca
tion
s an
d an
ion
8 in gr
ound
wa
ter
of ea
ster
n Palm B
each C
ounty
(July
28-31, 19
80)
[Con
cent
rati
ons
in
Parameter
Sampling depth
(ft)
Spec
ific
conductance
(umhos)
pH (u
nits
)Al
kali
nity
fi
eld
(as
CaCOi)
Bicarbonate
fet-
fld
(as
110)
3)Ha
rdne
ss (a
s Ca
CC^)
Hard
ness
, noncarbonate
(as
CaCC
h).
Calcium, di
ssol
ved
Magn
esium, di
ssol
ved
Sodi
um,
diss
olve
dPotassium, di
ssol
ved
Chlo
ride
, dissolved
Sulfate, di
ssol
ved
Fluo
ride
, di
ssol
ved
Silica,
diss
olve
dDissolved
solids,
sum
Samp
ling
de
pth
(ft)
Spec
ific
conductance
(umhos)
pH (u
nits
)Al
kali
nity
fi
eld
(as CaCOO
Bicarbonate
fet-fld
(as
HC^j)
Hardness (a
s Ca
CC^)
Hard
ness
, noncarbonate
(as CaCOO.
Calc
ium,
dissolved
Magnesium, dissolved
Sodium,
diss
olve
dPotassium, di
ssol
ved
Chlo
ride
, dissolved
Sulfate, di
ssol
ved
Fluo
ride
, di
ssol
ved
Silica,
dissolved
Diss
olve
d so
lids
, sum
1*5-79"
112
785 7.
1240
388
320 79 120 4.
439
.9691.
1 .117
401
tB-1
099
9044
007.0
520
744
900
380
240 72.0
610 23.0
1000 31
.0 .223
2590
PB-l
^Zfr
76820 7.
0220
536
410
190
150 6.
9201.1
272.0 .3
2536
7
PB-1
10G
90 860 7.
113
056
8370
240
140 5.
244 2.
081
.1 .320 375
PB-lCfiZ
77 190
392
320
130
120 3.
927
.645
.3 .314 327
P3-1101
95 460 7.
220
027
2210 5 79 1.
917 1.
135' 4.7 .2
13 273
FB-1
085
87 660 7.
3210
384
260 53 95 6.
1371.
563 2.
1 .220 352
PB-11GZ
140
575 7.
125
032
8250 1
943.
6211.1
36.4 .3
1332
2
FB-l
?8fj
90 775 7.
119
042
035
0
160
130 4.
9431.1
75 3.7 .4
1739
1
FB-1133
120
610 7.
1285
348
250 0 95 3.
322 1.
237
.3 .316
348
Milligrams per
liter]
F3-1LWH
90 950 7.
218
0420
290
110
100 9.
590 3.
814
0 9.8 .3
18481
PB-1104
105
600 7.
318
033
226
0 80 100 2.
319
.834
.8 .212 279
PB-1
CR9
130
855 7.
116
0420
300
140
110 6.
352 1.
890 4.
7 .218
381
PB-11C5
60 710 7.
024
042
4340
100
130 4.
023 1.
136 2,
8 .421 365
FB-1090
100
590
< 7.1
170
436
250 77 923.
928
.647
.216 291
PB-1
107
105
10907.0
238
290
320 31 120 4.
910
0 2.6
160 11.0 .3
17592
PH-I^9I
95 690 7.
114
0440
300
160
110 4.
6281.3
42 1.5 .3
1528
9
PB-1
10P,
9011807.1
230
460
280 46 85 15.0
110 3.
718
0 16.0 .4
21572
PB-1J9Z
70 875 7.
130
048
036
0 56 130 7.
134 2.
263 3.
9 .2 .642
4
PR-1
109
4041
207.0
480
752
630
150
150 62.0
570 26.0
890 37.0 .3
1222
40
PB-1
094
100
13507.
1350
620
410 62 130 21.0
140 9.
3210 23.0 .2
1776
2 -
FB-1337
6115007.
136
1440
410 49 140 15.0
140 5.
5230 50.0 .2
1881
7
FB-1
,'J6
90 510 7.
219
0304
260 68 100 1.
915 1.
123
.8 .319 276
Mini
mum
40 460 7.
013
027
2210 0 791.9
15.6
23.1 .1 .6
273
FB-1D97
90 980 7.
2190
512
390
200
140 9.
766 4.
496 14
.0 .318
465
Maximum
140
44007.
352
0752
900
380
240 72.0
610 26.0
1000 50
.0 .425
2590
FB-1UV«
80 740 7.
216
039
029
0
130
100 8.
6341.
66i 2.
0 .219 325
Mean 91
11117.1
240
444
349
107
120 11.5
93 3.9
150 9.
2 .216
572
60 C
H AJ CJ
H 0, 0)
"O
§ o o
CJcd o
PQ
J]cfl
0) iH4J COCO Ocd exa) 3
od o
CO AJ H -H H r-4<u cd
cr o i0> M
4_» Q) CJ 4JCD cd
rH ^ 0> CO
COGcdM60cd
CO I
CM
60 -H1*4
4.0 WATER QUALITY Continued A.2 Chemical Quality
4.2.1 Major Inorganic Constituents
4.0 WATER QUALITY Continued4.2 Chemical Quality Continued
4.2.2 Dissolved Solids
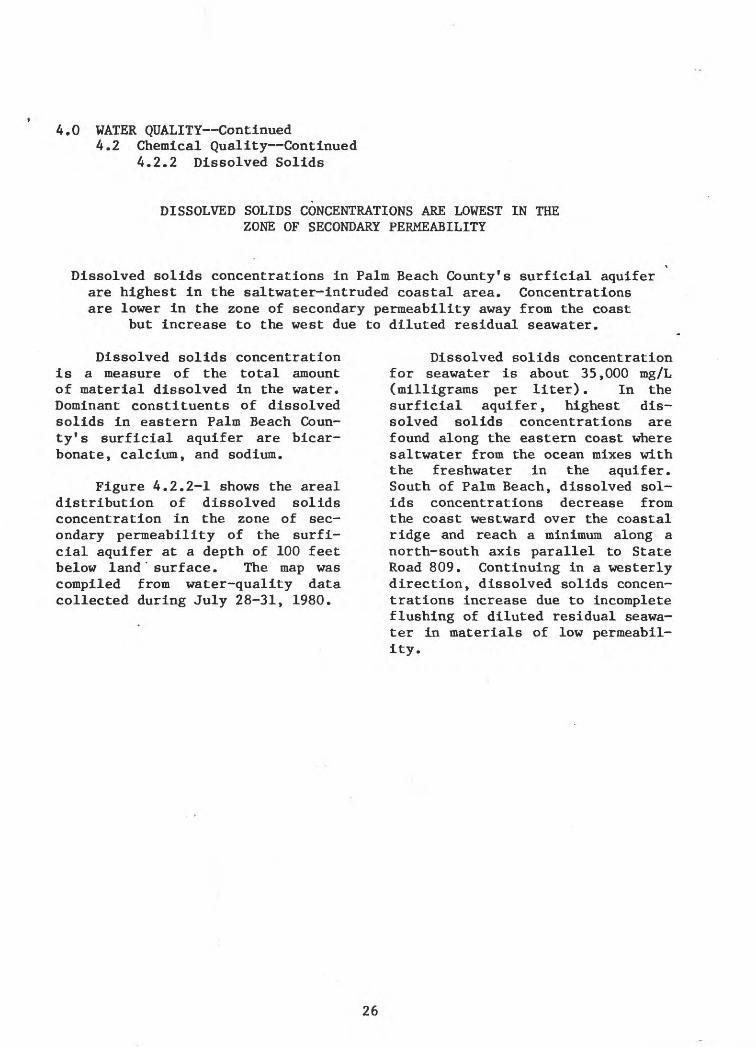
DISSOLVED SOLIDS CONCENTRATIONS ARE LOWEST IN THE ZONE OF SECONDARY PERMEABILITY
Dissolved solids concentrations in Palm Beach County's surficial aquiferare highest in the saltwater-intruded coastal area. Concentrationsare lower in the zone of secondary permeability away from the coast
but increase to the west due to diluted residual seawater.
Dissolved solids concentration is a measure of the total amount of material dissolved in the water. Dominant constituents of dissolved solids in eastern Palm Beach Coun ty's surficial aquifer are bicar bonate, calcium, and sodium.
Figure 4.2.2-1 shows the areal distribution of dissolved solids concentration in the zone of sec ondary permeability of the surfi cial aquifer at a depth of 100 feet below land ' surface. The map was compiled from water-quality data collected during July 28-31, 1980.
Dissolved solids concentration for seawater is about 35,000 mg/L (milligrams per liter). In the surficial aquifer, highest dis solved solids concentrations are found along the eastern coast where saltwater from the ocean mixes with the freshwater in the aquifer. South of Palm Beach, dissolved sol ids concentrations decrease from the coast westward over the coastal ridge and reach a minimum along a north-south axis parallel to State Road 809. Continuing in a westerly direction, dissolved solids concen trations increase due to incomplete flushing of diluted residual seawa ter in materials of low permeabil ity.
26
80° 15 80° 00*
26° 45
26°30 -
EXPLANATION
DISSOLVED SOLIDS RANGE, IN MILLIGRAMS PER LITER'
[^ ~] LESS THAN 3OO
300 TO 600
GREATER THAN 600
| | NO DATA
INFERRED LIMIT
WELL LOCATION. UPPER322 NUMBER IS DISSOLVED SOLIDS140 IN MILLIGRAMS PER LITER,
LOWER NUMBER IS SAMPLINGDEPTH IN FEET
NOTE: VERY NEAR THE COAST, SALT-WATER INTRUSION CAN CAUSE LARGE INCREASES IN DISSOLVED SOLIDS CONCENTRATIONS
SMILESI
5 KILOMETERS
STUDY AREA
Figure A.2.2-1. Areal distribution of dissolved solids concentrations in the surficial aquifer at approximately 100 feet below land surface (July 28-31, 1980).
4.0 WATER QUALITY Continued4.2 Chemical Quality Continued
4.2.2 Dissolved Solids
4.0 WATER QUALITY Continued4.2 Chemical Quality Continued
4.2.3 Calcium Carbonate Hardness
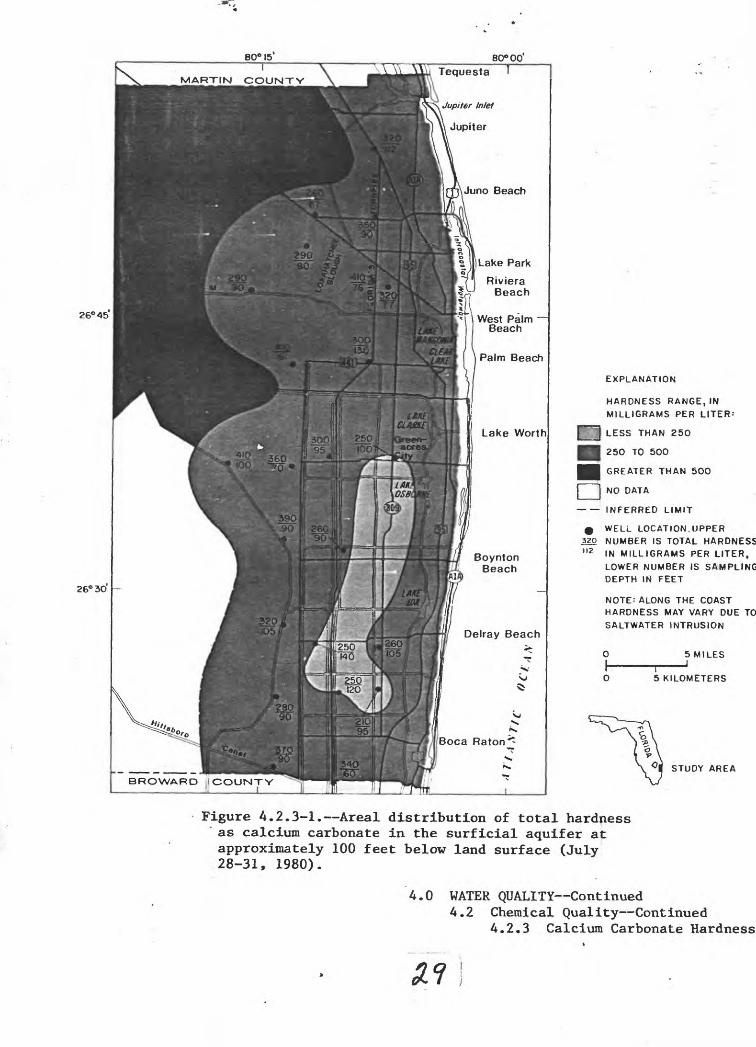
TOTAL HARDNESS OF WATER AS CALCIUM CARBONATE IS VERY HIGH IN THE ZONE OF SECONDARY PERMEABILITY
Total hardness of water as calcium carbonate is classified as very hard throughout the surficial aquifer in eastern Palm Beach County.
Hardness increases to the west of the zone of secondary permeability.
Hardness of water is caused by calcium and " magnesium ions and is expressed as an equivalent amount of calcium carbonate. In the sur ficial aquifer of eastern Palm Beach County, the lithology is com posed primarily of calcium carbon ate, and calcium is the dominant cation, except in areas of salt water intrusion where sodium dom inates in ground water. Based on mean total hardness from 25 wells, magnesium accounts for 10 percent of the total hardness.
Ground water sampled in the zone of secondary permeability is "very hard" when classified on a relative scale (Durfor and Becker, 1964). This classification scale is:
Hardness range, in mg/L as Hardness
description
0-60 60 - 120
120 - 180 More than 180
SoftModerately hardHardVery hard____
Figure 4.2.3-1 shows the areal distribution of hardness- in the surficial aquifer at the end of July 1980. Hardness generally in creases westward from the zone of secondary permeability. Analyses of water from the zone show that hardness is greatest in the vicin ity of the Loxahatchee Slough and lowest west of Boynton Beach within the Lake Worth Drainage District in the southeast part of the county.
28
80° 15' 80° 00
26° 45
26°30 -
BROWARD (COUNTY
EXPLANATION
HARDNESS RANGE, IN
MILLIGRAMS PER LITER'
[ j LESS THAN 250
| 250 TO 500
GREATER THAN 500
| | NO DATA
INFERRED LIMIT
0 WELL LOCATION.UPPER320 NUMBER IS TOTAL HARDNESS112 IN MILLIGRAMS PER LITER.
LOWER NUMBER IS SAMPLINGDEPTH IN FEET
NOTE:ALONG THE COAST HARDNESS MAY VARY DUE TO SALTWATER INTRUSION
0 SMILES
I5 KILOMETERS
STUDY AREA
Figure 4.2.3-1. Areal distribution of total hardness ' as calcium carbonate in the surficial aquifer at approximately 100 feet below land surface (July 28-31, 1980).
4.0 WATER QUALITY Continued4.2 Chemical Quality Continued
4.2.3 Calcium Carbonate Hardness
4.0 WATER QUALITY Continued4.2 Chemical Quality Continued
4.2.4 Chloride
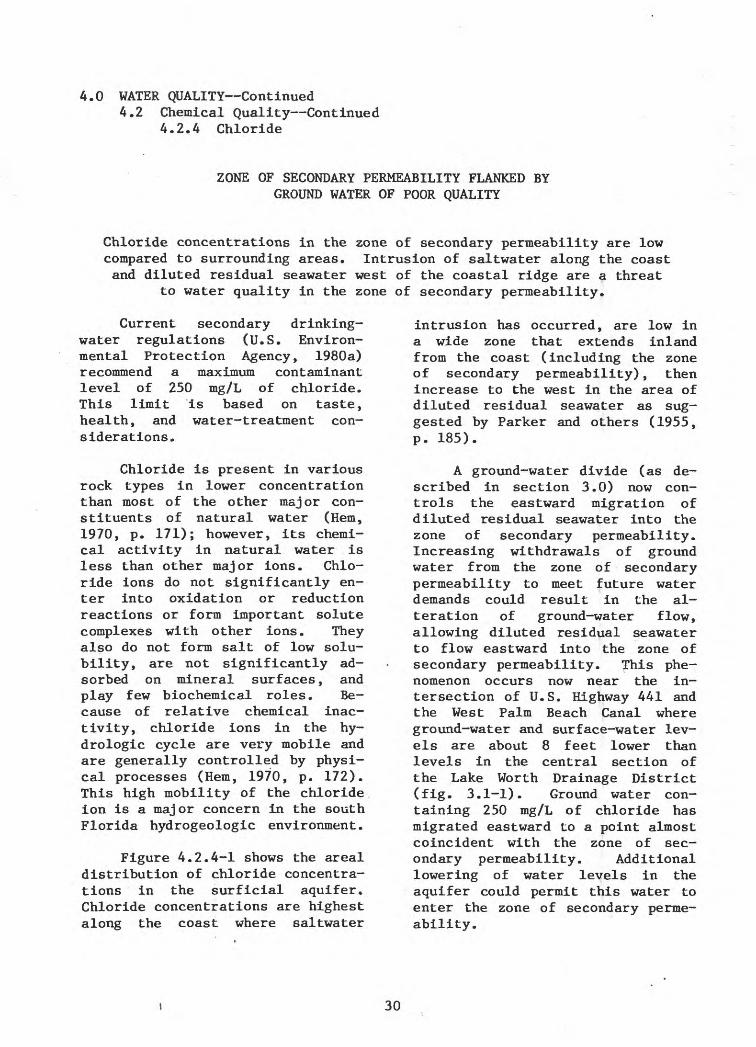
ZONE OF SECONDARY PERMEABILITY FLANKED BY GROUND WATER OF POOR QUALITY
Chloride concentrations in the zone of secondary permeability are low compared to surrounding areas. Intrusion of saltwater along the coast and diluted residual seawater west of the coastal ridge are a threat
to water quality in the zone of secondary permeability.
Current secondary drinking- water regulations (U.S. Environ mental Protection Agency, 1980a) recommend a maximum contaminant level of 250 mg/L of chloride. This limit is based on taste, health, and water-treatment con siderations.
Chloride is present in various rock types in lower concentration than most of the other major con stituents of natural water (Hem, 1970, p. 171); however, its chemi cal activity in natural water is less than other major ions. Chlo ride ions do not significantly en ter into oxidation or reduction reactions or form important solute complexes with other ions. They also do not form salt of low solu bility, are not significantly ad sorbed on mineral surfaces, and play few biochemical roles. Be cause of relative chemical inac tivity, chloride ions in the hy- drologic cycle are very mobile and are generally controlled by physi cal processes (Hem, 1970, p. 172). This high mobility of the chloride ion is a major concern in the south Florida hydrogeologic environment.
Figure 4.2.4-1 shows the areal distribution of chloride concentra tions in the surficial aquifer. Chloride concentrations are highest along the coast where saltwater
intrusion has occurred, are low in a wide zone that extends inland from the coast (including the zone of secondary permeability), then increase to the west in the area of diluted residual seawater as sug gested by Parker and others (1955, p. 185).
A ground-water divide (as de scribed in section 3.0) now con trols the eastward migration of diluted residual seawater into the zone of secondary permeability. Increasing withdrawals of ground water from the zone of secondary permeability to meet future water demands could result in the al teration of ground-water flow, allowing diluted residual seawater to flow eastward into the zone of secondary permeability. This phe nomenon occurs now near the in tersection of U.S. Highway 441 and the West Palm Beach Canal where ground-water and surface-water lev els are about 8 feet lower than levels in the central section of the Lake Worth Drainage District (fig. 3.1-1). Ground water con taining 250 mg/L of chloride has migrated eastward to a point almost coincident with the zone of sec ondary permeability. Additional lowering of water levels in the aquifer could permit this water to enter the zone of secondary perme ability.
30
80* 15 80° 00
26°45
26°30 -
Riviera Beach
2500252
West Palm I Beach
EXPLANATION
CHLORIDE CONCENTRATION RANGE, IN MILLIGRAMS PER
LITER:
[gg£| LESS THAN 25
|rv^ 25 TO 100
HHJ 100 TO 250
m 250 TO 1000
m GREATER THAN 1000
[ | NO DATA
INFERRED LIMIT
WELL LOCATION.UPPER 2500 NUMBER IS CHLORIDE 252 CONCENTRATION IN
MILLIGRAMS PER LITER, LOWER NUMBER IS SAMPLING DEPTH IN FEET
NOTE=VERY NEAR THE COAST
SALTWATER INTRUSION CAN CAUSE LARGE INCREASES IN
CHLORIDE CONCENTRATION
0 5 MILES I___________I
5 KILOMETERS
STUDY AREA
Figure 4.2.4-1. Areal distribution of chloride concentrations in the surficial aquifer at approximately 100 feet below land surface (July 28-31, 1980).
4.0 WATER QUALITY Continued4.2 Chemical Quality Continued
4.2.4 Chloride,
4.0 WATER QUALITY Continued4.2 Chemical Quality Continued
4.2.5 Total Organic Carbon
ZONE OF SECONDARY PERMEABILITY LEAST AFFECTED BY ORGANIC CARBON
Increases in organic carbon concentrations to the west in the surficial aquifer are attributed primarily to
the organic deposits in the Everglades.
Total organic carbon in ground water generally indicates that the water has infiltrated through natu rally occurring organic materials or manmade contaminants. In the surficial aquifer in eastern Palm Beach County, the most likely source of organic carbon is organic deposits in the Everglades west of Florida's Turnpike.
Total organic carbon concen trations are generally lower in the zone of secondary permeability in the aquifer and increase to the west. This pattern is consistent
with the occurrence of organic de posits in the area to the west. High organic carbon concentrations in the zone adjacent to the Loxa- hatchee Slough probably are the re sult of eastward migration of water that infiltrated from the Slough to the zone of secondary permeability.
Figure 4.2.5-1 shows the areal distribution of total organic car bon concentrations in the surficial aquifer and concentrations at 24 selected wells at the end of July 1980.
32
80° 00
26° 45*
26° 30 -
MARTIN COUNTY PALM B
BROWARD COUNTY
EXPLANATION
TOTAL ORGANIC CARBON
RANGE, IN MILLIGRAMS
PER LITER:
LESS THAN 10
10 TO 20
20 TO 40
GREATER THAN 40
| NO DATA
INFERRED LIMITS
I
LAKE WORTH DRAINAGE
DISTRICT
9 WELL LOCATION. UPPER
13 NUMBER IS TOTAL ORGANIC
130 CARBON IN MILLIGRAMS
PER LITER.LOWER NUMBER
IS SAMPLING DEPTH IN FEET
0 5MILES
5 KILOMETERS
STUDY AREA
Figure 4.2.5-1. Areal distribution of total organic carbon concentrations in the surficial aquifer at approximately 100 feet below land surface (July 28-31, 1980).
4.0 WATER QUALITY Continued4.2 Chemical Quality Continued
4.2.5 Total Organic Carbon
4.0 WATER QUALITY Continued4.2 Chemical Quality Continued
4.2.6 Nutrients
NUTRIENT CONCENTRATIONS HIGHLY VARIABLE IN SURFICIAL AQUIFER
No significant areal trends are observed in the distribution 1of nitrogen and phosphorus concentrations in the surficial
aquifer or its zone of secondary permeability.
Sources of nutrients in the surficial aquifer in eastern Palm Beach County are organic plant ma terials, animal wastes or sewage, and agricultural fertilizers.
Analyses of ground water from selected wells indicate that nitro gen in the aquifer exists primarily as organic nitrogen or its reduced species - ammonia. Total nitrogen ranges from 0.76 to 3.41 mg/L. To tal ammonia nitrogen concentrations range from 0.42 to 1.50 mg/L.
In the 23 wells for which ni trate nitrogen analyses are availa ble, concentrations range from 0.00 to 0.01 mg/L. These concentrations
are much less than the U.S. Environ mental Protection Agency (1980b) limit of 10 mg/L for drinking water.
Phosphorus concentrations were consistently low in wells sam pled. Total phosphorus concentra tions range from 0.04 to 0.58 mg/L with orthophosphate concentrations ranging from 0.03 to 0.36 mg/L.
Nutrient data for wells sampled are given in table 4.2.6-1. These data indicate no specific trends in distribution of nitrogen and phos phorus nutrient concentrations in the surficial aquifer or its zone of secondary permeability.
34
Tabl
e 4.
2.6-
1. N
utri
ent
concentrations in
ground wa
ter
of ea
ster
n Palm Bea
ch Cou
nty
(Jul
y 28
-31,
1980)
[Con
cent
rati
ons
in milligrams
per
liter]
ro
P-
O
fo n
> a
0 >
ON
H- f
O
H
0)
(-32
!C
rt
c o
A)
Q
3
H*
rt rt
GO
^<I I O rt
H-
C
d.
Parameter
Carb
on,
orga
nic
tota
lNi
trog
en,
ammo
nia
+ or
gani
cto
tal.
Nitr
ogen
, am
moni
a to
tal
Nitrogen,
nitr
ate
total
Nitr
ogen
, ni
trit
e total
Nitrogen,
N02 +
N03
tota
lNi
trog
en,
orga
nic
total
Nitr
ogen
, to
tal
Phos
phor
us,
orth
opho
spha
te,
tota
l.Ph
osphorus ,
tota
l
Carbon,
orga
nic
tota
lNi
trog
en,
ammo
nia
+ or
gani
cto
tal.
Nitrogen,
ammo
nia
tota
lNi
trog
en,
nitr
ate
tota
lNi
trog
en,
nitr
ite
total
Nitr
ogen
, ^0
2 + Wj to
tal
Nitr
ogen
, or
gani
c to
tal
Nitr
ogen
, total
Phos
phor
us,
orth
opho
spha
teto
tal.
Phos
phor
us,
tota
l
PB-790
17 2.46 .960
.00
.010
.01
1.50
2.47 .080
.170
PB-1
099
28 2.40
1.10 .01
.010
.02
1.30
2.42 .100
.200
PB-1
026
16 1.48 .900
.01
.000
.01
.58
1.49 .080
.100
PB-1
100
9.5
1.24 .560
.68
PB-1062
21 1.32 .730
.00
.000
.00
.59
1.32 .040
.040
PB-1
101
13 1.18 .760
.00
.010
.01
.42
1.19 .360
.580
PB-1085
_
PB-1102
12 1.06 .620
.00
.000
.00
.44
1.06 .050
.140
PB-1086
21 1.52 .660
.00
.010
.01
.86
1.53
..04
0.060
PB-1103
12 1.20 .690
.00
.000
.00
.51
1.20 .050
.110
PB-1088
11 1.60
1.40 .00
.010
.01
.20
1.61 .090
.180
PB-1
104
15 1.12 .510
.01
.010
.02
.61
1.14 .090
.340
PB-1
089
13 1.56 .950
.01
.000
.01
.61
1.57 .040
.060
PB-1105
12
.76
.420
.00
.000
.00
.34
.76
.050
.080
PB-1
090
12 1.40 .700
.00
.000
.00
.70
1.40 .080
.230
PB-1
107
24 2.90
1.50 .00
.010
.01
1.40
2.91 .050
.430
PB-1
091
20 1.24 .640
.01
.010
.02
.60
1.26 .080
.220
PB-1
108
42 3.40
1.50 .00
.010
.01
1.90
3.41 .060
.270
PB-1
092
13 1.30 .640
.01
.000
.01
.66
1.31 .030
.080
PB-1
109
24 2.20
1.20 .01
.010
.02
1.00
2.22 .060
.500
PB-1
094
32 3.10
1.50 .00
.010
.01
1.60
3.11 .060
.100
PB-1
337
19 1.34 .930
.00
.000
.00
.41
1.34 .050
.070
PB-1
096
9.2 .98
.610
.00
.010
.01
.37
.99
.070
.160
Mini
mum
9.2 .76
.420
.00
.000
.00
.20
.76
.030
.040
PB-1
097
18 1.36 .740
.00
.010
.01
.62
1.37 .090
.180
Maxi
mum
42 3.40
1.50 .01
.010
.02
1.90
3.41 .360
.580
PB-1
098
11 1.40 .700
.01
.000
.01
.70
1.41 .040
.040
Mean
17 1.64 .871
.77
1.67 .075
.188
4.0 WATER QUALITY Continued4.2 Chemical Quality Continued
4.2.7 Trace Elements
TRACE-ELEMENT CONCENTRATIONS IN THE SURFICIAL AQUIFER
Trace-element concentrations in the zone of secondary permeability generally fall within water-quality regulation limits.
Ground-water samples from 25 wells in the surficial aquifer in eastern Palm Beach County were ana lyzed to determine concentrations of trace elements. Analyses were made for metals (aluminum, barium, copper, iron, lead, manganese, mer cury, strontium, and zinc) and non- metals (arsenic and boron).
All trace-element concentra tions are within U.S. Environmental Protection Agency (1980a, 1980b) regulation and recommended limits, except for mercury in well PB-1100 and for iron in wells PB-790, PB- 1085, PB-1100, PB-1102, and PB- 1104. Iron often exceeds these limits in south Florida. Of these wells, only PB-790 is not in the zone of secondary permeability of the surficial aquifer.
Trace elements for which regu lation maximum contamination lim its have been determined for drink ing water by the U.S. Environmental Protection Agency (1980a, 1980b) are:
Trace Regulation limit elements (micrograms per liter)
Trace-element data for wells in the surficial aquifer are listed in ta ble 4.2.7-1.
36
^o00
tH
iHCO
100CM
^iH9
H"J
S« X
!*,4J
9O
QJ
£o<u
PQ
fla)
0£4
4)4JcoCO
IHO
^4)±J
0)
oc9O£4bo
0 H
20O H
CO^4JJ04)O0 OO
c4)
§iH4)
iocO14
E~*iitH
CM
0)tH 8H
i ^
4)±J HiH
140)a
2bOO
o HSr* H
S0 HU
^44J
eoao
^^
00^^c
1
£ON0iH
pcIX
sO
C H
ft.
^.ON0iH
1
ft.CMONOiH
PQIX
iHOs0iH
PQIX
OON
sPQIX
ON00
sPQS
0000
S
^D00oiH
PQIX
in000iH
PQIX
CM
0iH
PQIX
sOCM
S1
PQIX
03N
|
PQIX
^to4J4)
IX
CM.
O tH O O tH O O 1 OOO ON CM 1 00 tHtH iH 00
tH.
oooooooo oo-^ ON iH O tHtH tH
CM
sO.
OOOoOoOo OO O f» O tH -^iH iH f»
^.
oooooooo ooO CO iH sO iH 00 tHiH CM ON
rH
OOOOtHQOO OOO iH CO tH O f» iH iH ON
rH
CO.
OtHOOtHoOO OO O 00 ON iH O tHiH iH CO
rH
00.
OOOOtHoOO OO O Of* «* tH O COtH tH iH
iH
iH.
OiHOOtHQtHO OO 0 tH in rH O tH iH iH ON
H
rH.
OtHOO-HOOO OO O O m iH ON iHtH rH \0
CM.
OiHOOtHQOO OO O O CM iH O ONiH iH CM CO
iH
iH.
oooooooo oosO O CM 00 tH
m so
CM.
oooooooorH sO iH O OtH CM O iH
CMiH
iH.
OiHOOOOtHO OO O f» CM iH O tHrH CM 00
iH
tH.
OOOOOOCOO OOON iH O -* CM iH
ON ONCO
a 41 a>0) T3 ^ *^ ^> 4) tJ T3 rH 4) rH
rH > 4) T3 0> O > O
T3 -H CO CO CO O O -H O O-HW-HCOCO --a -co- -o IH -o co co a» g co
fi M *O iH tH CO ^ 3 "rl9 CJ ^ * T3 T3 Q) ^» "H T3C iH g - M C M U
^SSSsHSISSN
f3cflQ]s
§3 gcfl
953330 H
S
^COCOiH
1PQIX
Q\
0iHtH
PQIX
00
siH
1PQIX
0iHiH
1PQIX
lOoiHtH
PQIX^.OiHtH
PQIX
COoiHiH
1PQIX
CMOiHrH
1PQIX
iHOiHtH
PQS
O
SiH|
PQIX
ONONOiH|
PQIX
CO ^
.CMOOO«*CM«* CO sOsOf* CO m *H sO rH
^ CO CO
S tHOOOOCOOCMOO O CM CM O «* O ON
iH iH in ON COCO CO
iH
OOOOOOOO OO sO CO tH CO
iH.
S OOOtHOCOO OO sO NO iH O tH
iH rH CMiH
CO.
OtHOOOOOO OOO CM CO CM O iHiH in iH sO
iH
m.O-HOOOOOO oo
CM ON iH O tHCM 00
iH
CM.
§ 0000000 oo -* sO tH O tH
iH tH iH .*iH
CO.
OtHOOOOOO OO O O O CM O CMiH tH tH O
CM
CO.
S OOOtHOOOrHOO SO O tH sO tH
rH f» ON
m.
oooooooo ooO CM so tH r». iHiH iH ON
CO
OOOOOOOOtHOO O O sO 00 CM O iHiH iH sO rH
iH
^^.
S OOOtHOtHO OO 00 sO tH CO iH
iH tH iH
f^.
S tHOOtHOOOCMOO f» r-» CM O iH
rH VO COCO
iH.
oooooooo ooCO tH CM O tH-* tH CM
CM
O TJ T3 0) 0)fl) t3 ^ T3 ^> 0) « « iH « iH
rH > 0) -O 0) O > O
COOrH>rH4)4)COOC04)
H CO CO O CO rH rH -O CO T3 rHTJ-HCOCOCOOO -H O
T3 iH CO t-l CO CO -tJ -CO
§ co H
go - - o-ow^THtjC -H S - ^ G 14 >-> H C 3 d o» > > at 9 C "
^IrSSclrHllitSS
4.0 WATER QUALITY Continued4.2 Chemical Quality Continued
4.2.7 Trace Elements
5.0 WATER-DATA SOURCES 5.1 WATSTORE
WATSTORE AUTOMATED DATA SYSTEM
The National Water Data Storage and Retrieval System (WATSTORE) of the U.S. Geological Survey provides computerized procedures
and techniques for processing water data and provides effective management of data-releasing activities.
WATSTORE was established in November 1971 to computerize the U.S. Geological Survey's existing water-data system and to provide for more effective and efficient management of its data-releasing activities. The system is operated and maintained on the central com puter facilities of the Survey at its National Center in Reston, Va. Data may be obtained from WATSTORE through the Water Resources Divi sion's 46 district offices. Gen eral inquiries about WATSTORE may be directed to:
Chief HydrologistU.S. Geological Survey
437 National CenterReston, VA 22092
or
U.S. Geological Survey P.O. Box 026052 Miami, FL 33102
Table 5.1-1 shows a cross ref erence of local well numbers used in this report and corresponding station identification numbers used by the WATSTORE system.
38
Table 5.1-1. Cross reference of local well numbers and