15
BAHAMAS NATIONAL REPORT By Lester Gittens & Michael Braynen Dept. of Marine Resources, Govt. of The Bahamas
| Date post: | 24-Dec-2015 |
| Category: |
Documents |
| Upload: | jesse-melton |
| View: | 216 times |
| Download: | 1 times |

BAHAMAS NATIONAL REPORT
By Lester Gittens & Michael BraynenDept. of Marine Resources,Govt. of The Bahamas

DESCRIPTION OF THE FISHERY
LITTLE BAHAMA BANK
GREAT BAHAMA BANK
NASSAU
Over 100,000 km2 of shallow water

DESCRIPTION OF THE CONCH FISHERY
•Conch fishery is 2nd-3rd most important fishery
•Employs over 9,000 fishers
•Utilizes over 4,000 small vessels
•Conch caught by free diving and with compressors
•>60% of landings during April-July

POLICY AND LEGISLATION
•Fishery Resources (Jurisdiction and Conservation) Act 1977
•Fisheries Resources (Jurisdiction and Conservation) Regulations 1986
•Wildlife Conservation and Trade Act 2004
•5yr (2010-2014) Strategic Plan
•Commercial fisheries reserved for Bahamian citizens

POLICY AND LEGISLATION•Dept of Marine Resources has primary responsibility for management
•Multiple agencies conduct enforcement-Defence Force Officers -Customs Officers-Police Officers -Agriculture Officers
DEVELOPMENT ACTIVITIES
•Aquaculture sector targeted for development
•Multiple aquaculture ventures have received approvals and duty free concessions
•No successful long-term ventures
•Past failures currently under review

FISHERIES MANAGEMENT & CONSERVATION ACTIVITIES
•Use of SCUBA for commercial fishing prohibited
•Limitations on the use of compressed air
•Expanding network of marine protected areas – conch surveyed in two
•Conch export quota system-limits landings
•Dept. of Marine Resources- CITES Scientific Authority
•Dept. of Agriculture – CITES Management Authority
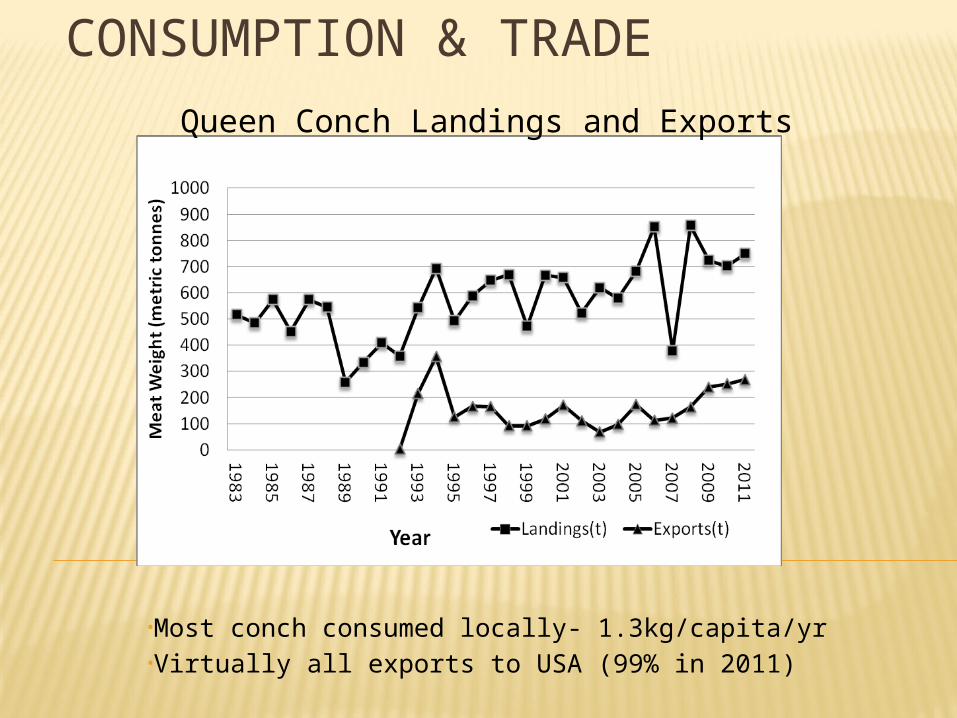
CONSUMPTION & TRADE
•Most conch consumed locally- 1.3kg/capita/yr•Virtually all exports to USA (99% in 2011)
Queen Conch Landings and Exports

CONSUMPTION & TRADE
•Increase in value to >$3million
Value of Exports
0
500000
1000000
1500000
2000000
2500000
3000000
3500000
1998
1999
2000
2001
2002
2003
2004
2005
2006
2007
2008
2009
2010
2011
Year
Val
ue
($U
S)
*2009 data unavailable

ANNUAL CATCH STATISTICS•Collected by trip interviews •Supplemented by purchase reports submitted by processing plants that are located on most islands with major fishing communities•Data collected: total weight of conch landed, the local value of landings, landings by major-island and fishing effort • Commercial export amounts and value are also recorded

RESEARCH & STOCK ASSESSMENTS
•5 density surveys conducted since 2009
•Represents small portion of conch occurrence and fishing grounds
•1Berry Islands:-• decline in juvenile densities compared to a 1987 study•Conch present in a new MPA- inadequate for reproduction
1Stoner et al 2009

SURVEY SITES
SW Abaco
Andros
Exuma Cays LSP
Lee S. Island
Berry Islands

RESEARCH & STOCK ASSESSMENTS
•2Andros –low reproduction taking place• adult densities of 118/ha in small area•dominated by “samba” conch in higher density areas
• 3Exuma Cays Land and Sea Park- 10% of adults were reproducing
•Densities 6% lower in a shelf area•69% lower in a bank area between 2011 and 1994
2Stoner and Davis 2010 3 Stoner et al 2011

RESEARCH & STOCK ASSESSMENTS
•3At Lee Stocking Island- very low densities• 91% decline since 1991
•SW Abaco soon to be released
•Other research- the relationship between lip thickness, maturity and the presence of a flared lip
•4Juveniles not adequately protected in most Caribbean countries
•Multiple contributors: Community Conch, Bahamas Government, BNT,TNC
3 Stoner et al 2011 4Stoner et al 2012

FINAL CONSIDERATIONS
•Recent progress made
•Recent surveys and research have provided a basis for improved management
![The Bahamas Nationality Regulations - Bahamas Immigration€¦ · THE BAHAMAS NATIONALITY [CH.190 – 7[Original Service 2001] STATUTE LAW OF THE BAHAMAS 16. An application for a](https://static.documents.pub/doc/80x56/5ec52238bbef09285e547b38/the-bahamas-nationality-regulations-bahamas-immigration-the-bahamas-nationality.jpg)


