+ All Categories
Home > Documents > by the Accreditation Council for Continuing Medical ...

by the Accreditation Council for Continuing Medical ...

Date post: 18-Dec-2021
Category:
Upload: others
View: 2 times
Download: 0 times
Share this document with a friend
26
© 2020 by the Accreditation Council for Continuing Medical Education (ACCME ® ) All Rights Reserved 401 N. Michigan Ave., Suite 1850 | Chicago, IL 60611 | Phone: 312-527-9200 | www.accme.org
Transcript

© 2020 by the Accreditation Council for Continuing Medical Education (ACCME®) All Rights Reserved 401 N. Michigan Ave., Suite 1850 | Chicago, IL 60611 | Phone: 312-527-9200 | www.accme.org

ACCME Data Report: Steady Growth in Accredited Continuing Medical Education – 2019 © 2020 by the Accreditation Council for Continuing Medical Education (ACCME®). All Rights Reserved.

Suggested Citation: Accreditation Council for Continuing Medical Education. 2020. ACCME Data Report: Steady Growth in Accredited Continuing Medical Education – 2019. www.accme.org/2019datareport.

For copies of previous years’ reports, visit www.accme.org/datareport.

Message from the ACCME President and CEO………………………………………………………………………………………………… 1

Executive Summary………………………………………………………………………………………………………………………………... 2

Table 1. Size of the CME Enterprise……………………………………………………………………………………………………………... 5

Table 2. Activities by Organization and Activity Type………………………………………………………………………………………….. 6

Table 3. Hours of Instruction by Organization and Activity Type……………………………………………………………………………… 7

Table 4. Physician Interactions by Organization and Activity Type……………………........................................................................... 8

Table 5. Other Learner Interactions by Organization and Activity Type……………………………………………………………………… 9

Table 6. Income…………………………………………………………………………………………………………………………………….. 10

Table 7. Income by Organization Type…………………………………………………………………………………………………………... 11

Table 8. CME Activities and Interactions with and without Commercial Support…….……………………………………………………... 12

Figure 1. Activities, Hours, and Interactions…………………………………………………………………………………………………….. 13

Figure 2. Income…………………………………………………………………………………..................................................................... 14

Figure 3. Accredited Providers by Provider Type………………………………………………………………………………………………. 15

Figure 4. Percentages Designed/Analyzed for Change in Competence, Performance, or Patient Outcomes………………………………………………………………………………………………………………………………………….... 16

Figure 5. Learner Interactions by Activity Type……………………………………………………………………………………………….. 17

Figure 6. Activity Counts by Activity Type…………………………………………………………………………………………………….... 18

Figure 7. Hours of Instruction by Activity Type……………………………………………………………………………………..........….… 20

Table 16. Registration Fee by Organization Type……………………………………………..................................................................... 22

Table 17. Commercial Support by Organization Type…………………………………………………………………………………………. 22

Table 18. Advertising and Exhibit Income by Organization Type……………………………………………………………………………... 22

Table 19. Private Donation Income by Organization Type…………………………………………………………………………………….. 23

Table 20. Government Grant Income by Organization Type………………………………………………………………………………….. 23

Table 21. Total Reported Income by Organization Type………………………………………………………………………………………. 23

Table of Contents

Table 12. Activity Organization Type……………………………………………........................................................................................ 21

Table 13. Hours of Instruction by Organization Type………………………………………………………………………………………... 21

Table 14. Physician Learner Interaction by Organization Type……………………………………………………………………………... 21

Table 15. Other Learner Interaction by Organization Type………………………………………………………………………………...... 21

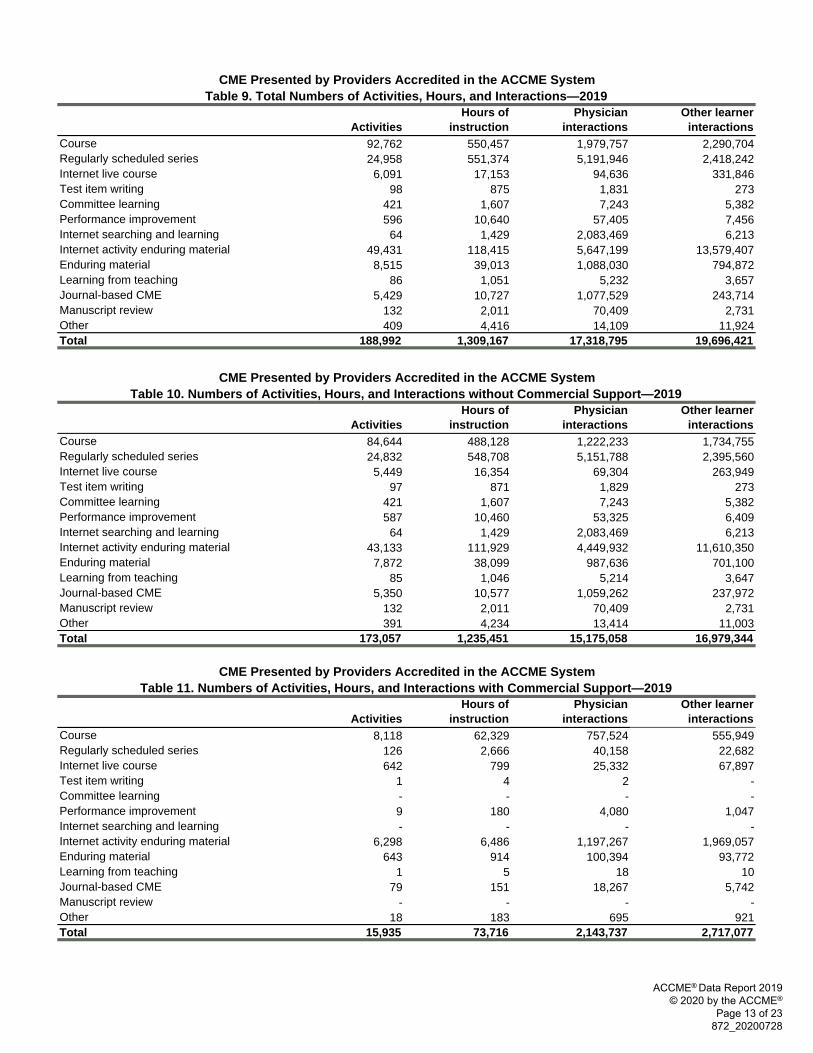
Table 10. Number of Activities, Hours, and Interactions without Commercial Support……………………………………………….…... 13

Table 11. Number of Activities, Hours, and Interactions with Commercial Support…………………………………………………….... 13

Table 9. Number of Activities, Hours, and Interactions ................................................…………………………………………………... 13

Message from the ACCME President and CEO A Committed, Nimble, and Responsive Community of Educators

The essential nature of accredited continuing medical education (CME) has been clearly demonstrated as we respond to the coronavirus pandemic. Healthcare professionals rely on CME—now more than ever—for new information and for new skills.

Transparency and integrity in the public interest are core values of the CME system that the ACCME oversees. Compilations of our CME data are a manifestation of our commitment to these values. I appreciate the efforts our accredited providers made to submit this data amid an unprecedented public health crisis, while also responding dynamically to the changing needs of learners, transitioning to online learning formats, and building new content in short order.

• More than 1 million hours of instruction• Nearly 190,000 activities• Approximately 37 million learner interactions with a diversity of healthcare

professionals and teams

Graham McMahon, MD, MMSc President and Chief Executive Officer Accreditation Council for Continuing Medical Education (ACCME®) (312) 527-9200; [email protected]

ACCME® Data Report 2019 © 2020 by the ACCME®

Page 1 of 23 872_20200728

The data in the ACCME 2019 Data Report illustrates that the CME community is strong, stable, growing, and capable of adapting to a changing environment. The number of educational events, hours of instruction, and learner interactions increased in 2019, continuing a 10-year upward trajectory. In 2019, our community of more than 1,700 accredited organizations delivered:

Investment in CME also grew, demonstrating the value that accredited education brings to clinicians, teams, healthcare leaders, and institutions.

Despite the challenges we are all facing, we, as a community, will continue to meet the needs of the patients and families we serve. The mantra “learn well, save lives” is more germane than ever before. I encourage you and your entire leadership team to take the opportunity to pause, reflect, and appreciate the important contributions you and your educational programs are making to the well-being of our communities.

Clinicians seek to deliver safe, effective, and compassionate care, based on best practice and evidence. Your work—delivering accredited CME—helps make that happen. Thank you.

Key Takeaways–A Strong, Active Community

• More than 1,700 accredited CME providers offered nearly 190,000 educationalactivities in 2019.

• The number of activities, hours of instruction, and interactions with learners haveincreased, despite some consolidation among CME providers, continuing a 10-yeartrajectory of growth.

• This education comprised approximately 1.3 million hours of instruction andapproximately 37 million interactions with healthcare professionals.

• Since 2018, the number of educational events has increased by 5%, hours ofinstruction have increased by 6%, and the number of learner interactions increased by2%.

• This is the second year that other learner interactions have surpassed physicianinteractions. (Other learners are nonphysician healthcare professionals such as nursesand pharmacists).

New This Year: More Comprehensive Data about Interprofessional Continuing Education

In support of our strategic goal to advance data systems, the Joint Accreditation Program and Activity Reporting System (JA-PARS) has been modified to enable jointly accredited providers to report learner data by more professions. In addition to the data about physicians, nurses, pharmacists, and pharmacy technicians, this data report includes, for the first time, the numbers of learner interactions with optometrists, physician assistants (PAs), psychologists, and social workers.

ACCME Data Report Steady Growth in Accredited Continuing Medical Education–2019

Executive Summary

Each year, accredited providers within the Accreditation Council for Continuing Medical Education (ACCME®) System submit data describing their continuing medical education (CME) activities and overall CME programs. The ACCME aggregates this information to give a view of the year as well as long-range trends. The 2019 Data Report marks the 22nd year we have published this report as a service to our CME community and other healthcare stakeholders.

ACCME® Data Report 2019 © 2020 by the ACCME®

Page 2 of 23 872_20200728

• ACCME-accredited providers: Organizations that offer CME primarily to national or international audiences.

• State-accredited providers: Organizations that offer CME primarily to learners from their state or contiguous states. These providers are accredited by ACCME Recognized Accreditors (state and territory medical societies).

• Jointly accredited providers: Organizations that focus on continuing education by and for healthcare teams. These providers are accredited by Joint Accreditation for Interprofessional Continuing Education™.

Accredited providers represent a range of organizations from large international institutions to small rural hospitals. Some specialize in local, community-based health issues, others focus on national and international health priorities, and others advance interprofessional continuing education (IPCE) and team-based care. The ACCME began accrediting organizations outside the US several years ago, and this report includes their data as well. The geographic distribution and diversity of CME providers means that clinicians and teams have access to high-quality accredited education where they live and work that addresses local, national, and international healthcare priorities.

Supplemental Data: This report features data aggregated from all the accredited providers in the ACCME System. We have also published a supplement which includes separate data sets about the CME and continuing education (CE) offered by ACCME-accredited providers, state-accredited providers, and jointly accredited providers. Download the supplement at accme.org/2019datareport-supplement.

CME Design and Evaluation

Accredited providers offer a diverse range of online and face-to-face activities to meet learners’ educational needs and preferences. Accreditation requirements ensure that the education is based on practice-relevant, valid content that is independent of commercial interests.

“Other” activity type: Beginning with the 2017 data report, “other” is included in the list of activity types. This new data point is a result of the alignment between the American Medical Association (AMA) and ACCME, designed to give accredited providers the freedom and flexibility to employ innovative approaches to education. When submitting data, providers choose “other” for blended, new, or other approaches that do not fall into one of the established format categories. While the number of activities reported as “other” is small (409), this represents an increase from the 357 “other” activities reported in 2018.

About the CME Provider Community

The ACCME Data Report 2019 features information on 1,724 accredited CME providers in the ACCME System. This includes:

ACCME® Data Report 2019 © 2020 by the ACCME®

Page 3 of 23 872_20200728

Promoting Change: The Accreditation Criteria require providers to produce educational activities that are designed to create change and to analyze the changes that were achieved as a result of the activities. The report shows that 98% of CME activities are designed for changes in competence (teaching healthcare professionals skills and strategies for translating new knowledge into action); 56% are designed to change performance (improving what healthcare professionals actually do in practice); and 29% are designed to change patient outcomes.

Investment in CME

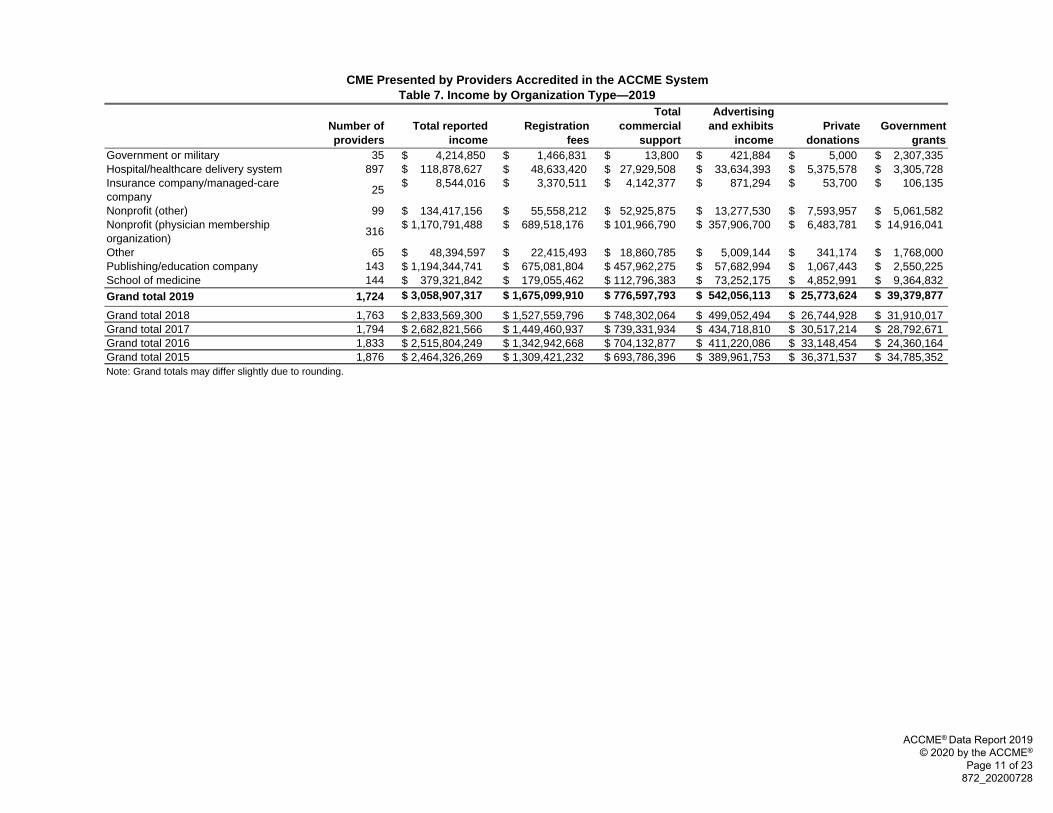
Accredited providers reported approximately $3 billion in investment in education from a variety of sources in 2019, an increase of almost 8% from 2018. The majority of income (55%) came from participant registration fees. Commercial support accounted for 25%, advertising and exhibits for 18%, and private donations and government grants for 1% each. Although the percentage of income received from government grants remains low, there was a 23% increase from 2018. The vast majority of CME activities (92%) did not receive commercial support, accounting for 87% of learner interactions.

About the ACCME Data Report

Data Report Preparation: The aggregated information published in this annual report is based upon self-reporting by accredited providers and is available for audit by ACCME per requirements. The ACCME does not provide full verification of the accuracy of all reported information but does follow up on outliers or major changes from previous years. We also investigate if it appears that providers have reported activity data that does not conform to the ACCME’s definitions and reporting instructions. Data from five providers was missing due to the pandemic, and their data was carried forward from 2018, representing 0.04% of activities reported in the system.

Glossary: For more information about the terms used in the data report, please see the ACCME/AMA Glossary of Terms and Definitions.

ACCME® Data Report 2019 © 2020 by the ACCME®

Page 4 of 23 872_20200728

Total providers = 1,724

ActivitiesHours of

instruction

Physician

interactions1

Other learner

interactions1

92,762 550,457 1,979,757 2,290,704 24,958 551,374 5,191,946 2,418,242 6,091 17,153 94,636 331,846

98 875 1,831 273 421 1,607 7,243 5,382 596 10,640 57,405 7,456 64 1,429 2,083,469 6,213

49,431 118,415 5,647,199 13,579,407 8,515 39,013 1,088,030 794,872

86 1,051 5,232 3,657 5,429 10,727 1,077,529 243,714

132 2,011 70,409 2,731 Other 409 4,416 14,109 11,924

Number of providers

Grand total 20193 1,724 188,992 1,309,167 17,318,795 19,696,421

Grand total 20184 1,763 179,158 1,231,670 15,457,998 20,708,037Grand total 2017 1,794 162,965 1,178,562 15,601,498 12,886,339Grand total 2016 1,833 158,707 1,129,833 15,164,072 12,122,110Grand total 2015 1,876 148,227 1,039,479 14,231,863 11,640,255Grand total 2014 1,908 147,024 1,033,615 13,599,687 11,587,518Grand total 2013 1,950 138,196 1,010,301 13,764,896 10,929,217Grand total 2012 2,000 133,620 988,208 14,319,688 10,207,237Grand total 2011 2,079 132,768 952,736 13,741,621 9,558,789Grand total 2010 2,144 127,880 954,204 13,814,368 9,464,895Grand total 2009 2,225 143,274 989,613 13,263,920 8,352,042Grand total 2008 2,329 150,370 1,091,851 13,230,102 8,172,942Grand total 2007 2,399 162,869 1,085,567 11,378,052 6,804,578Grand total 2006 2,413 149,884 1,061,859 11,391,627 6,259,498Grand total 2005 2,322 134,721 1,036,930 10,354,460 5,321,448

Journal CMEManuscript review

Learning from teaching

1Accredited providers report the number of participants at each activity. In this report, the participant numbers are referred to as interactions. The data represents aggregate numbers of interactions and not the number of unique participants. Participants attending multiple activities are counted multiple times.2In 2019, a high-volume provider updated its calculation of physician interactions in Internet searching and learning activities to align more closely with ACCME's expectations. This change resulted in a substanstial increase in the number of physician interactions for Internet searching and learning activities.3Five accredited organizations were unable to complete their 2019 report. Data from 2018 was carried forward for these organizations. The data carried forward accounts for 0.04% of activity data. 4In 2018, the launch of the Joint Accreditation Program and Activity Reporting System (JA-PARS) enabled jointly accredited providers to report program and activity data, including uni-professional and interprofessional continuing education (IPCE) activities, into a single, unified repository. Before 2018, jointly accredited providers reported data into multiple accreditors’ data systems. This change accounts for the increase in other learner interactions.

CME Presented by Providers Accredited in the ACCME SystemTable 1. Size of the CME Enterprise—2019

CoursesRegularly scheduled seriesInternet (live)

Enduring materials (other)

Test-item writingCommittee learningPerformance improvementInternet searching and learning2

Internet enduring materials

ACCME® Data Report 2019 © 2020 by the ACCME®

Page 5 of 23 872_20200728

Organization typeGovernment or

military

Hospital/ healthcare

delivery system

Insurance company/managed-

care company Nonprofit (other)

Nonprofit (physician membership

organization) OtherPublishing/

education companySchool of medicine Grand total

Number of providers 35 897 25 99 316 65 143 144 1,724

Courses 16,924 28,550 1,314 3,199 17,328 1,785 9,573 14,089 92,762

Regularly scheduled series 594 13,620 1 358 299 177 113 9,796 24,958

Internet (live) 1,608 655 67 614 1,014 194 937 1,002 6,091

Test-item writing - - - - 73 13 - 12 98

Committee learning 38 206 140 1 11 12 - 13 421

Performance improvement 9 368 9 2 139 2 15 52 596

Internet searching and learning - 12 1 - 3 2 37 9 64

Internet enduring materials 1,819 4,227 1,516 1,446 9,905 1,405 22,679 6,434 49,431

Enduring materials (other) 72 1,469 40 349 1,290 46 4,635 614 8,515

Learning from teaching - 56 - 7 2 2 1 18 86

Journal CME 48 457 - 44 3,433 234 1,041 172 5,429

Manuscript review 1 4 - 1 85 2 34 5 132

Other 17 191 3 5 152 11 10 20 409

Grand total 21,130 49,815 3,091 6,026 33,734 3,885 39,075 32,236 188,992

CME Presented by Providers Accredited in the ACCME SystemTable 2. Activities by Organization and Activity Type—2019

ACCME® Data Report 2019 © 2020 by the ACCME®

Page 6 of 23 872_20200728

Organization typeGovernment or

military

Hospital/ healthcare

delivery system

Insurance company/

managed-care company

Nonprofit (other)

Nonprofit (physician

membership organization) Other

Publishing/ education company

School of medicine Grand total

Number of providers 35 897 25 99 316 65 143 144 1,724 Courses 83,818 130,927 3,527 21,072 116,204 9,274 74,996 110,639 550,457 Regularly scheduled series 11,994 267,571 4 6,279 4,932 4,080 1,616 254,898 551,374 Internet (live) 4,126 1,299 130 1,080 2,590 793 4,093 3,043 17,153 Test-item writing - - - - 739 16 - 120 875 Committee learning 137 779 290 1 84 26 - 291 1,607 Performance improvement 9 5,284 180 30 3,496 2 300 1,339 10,640 Internet searching and learning - 186 1 - 2 9 1,207 25 1,429 Internet enduring materials 2,667 5,368 1,469 3,716 39,114 4,188 46,659 15,235 118,415 Enduring materials (other) 261 3,441 75 897 10,064 321 19,532 4,423 39,013 Learning from teaching - 594 - 26 28 2 1 401 1,051 Journal CME 48 964 - 44 6,205 234 2,960 272 10,727 Manuscript review 15 10 - 10 1,841 6 102 27 2,011 Other 78 1,708 25 11 1,852 25 207 513 4,416

Grand total 103,150 418,130 5,700 33,164 187,150 18,974 151,672 391,226 1,309,167

CME Presented by Providers Accredited in the ACCME SystemTable 3. Hours of Instruction by Organization and Activity Type—2019

ACCME® Data Report 2019 © 2020 by the ACCME®

Page 7 of 23 872_20200728

Organization typeGovernment or

military

Hospital/ healthcare

delivery system

Insurance company/

managed-care company Nonprofit (other)

Nonprofit (physician

membership organization) Other

Publishing/ education company

School of medicine Grand total

Number of providers 35 897 25 99 316 65 143 144 1,724 Courses 45,565 450,977 27,737 78,027 790,443 23,076 225,509 338,423 1,979,757 Regularly scheduled series 73,727 2,354,309 15 54,628 47,841 29,414 14,050 2,617,962 5,191,946 Internet (live) 10,233 11,888 3,021 6,961 34,569 3,503 14,279 10,182 94,636 Test-item writing - - - - 1,303 24 - 504 1,831 Committee learning 433 4,358 1,465 3 139 96 - 749 7,243 Performance improvement 46 3,832 26 216 52,448 4 15 818 57,405 Internet searching and learning - 559 105 - 5,207 7 1,988,826 88,765 2,083,469 Internet enduring materials 92,278 143,124 322,286 291,669 1,611,544 124,477 2,747,820 314,001 5,647,199 Enduring materials (other) 2,867 80,124 11,365 11,748 483,567 608 472,841 24,910 1,088,030 Learning from teaching - 966 - 582 248 11 2,383 1,042 5,232 Journal CME 624 54,083 - 839 905,470 341 111,103 5,069 1,077,529 Manuscript review 21 659 - - 35,744 67 33,423 495 70,409 Other 386 3,084 257 26 7,324 2,273 460 299 14,109

Grand total 226,180 3,107,963 366,277 444,699 3,975,847 183,901 5,610,709 3,403,219 17,318,795

CME Presented by Providers Accredited in the ACCME SystemTable 4. Physician Interactions by Organization and Activity Type—2019

ACCME® Data Report 2019 © 2020 by the ACCME®

Page 8 of 23 872_20200728

Organization typeGovernment or

military

Hospital/ healthcare

delivery system

Insurance company/

managed-care company Nonprofit (other)

Nonprofit (physician

membership organization) Other

Publishing/ education company

School of medicine Grand total

Number of providers 35 897 25 99 316 65 143 144 1,724 Courses 295,510 570,556 14,780 136,791 449,778 45,874 355,781 421,634 2,290,704 Regularly scheduled series 58,035 1,291,952 15 30,850 31,874 8,180 7,930 989,406 2,418,242 Internet (live) 61,104 14,368 1,353 40,191 44,646 13,678 133,388 23,118 331,846 Test-item writing - - - - 35 177 - 61 273 Committee learning 220 4,378 55 4 97 353 - 275 5,382 Performance improvement - 1,855 126 57 4,827 29 - 562 7,456 Internet searching and learning - 274 624 - - 2 5,255 58 6,213 Internet enduring materials 951,127 228,394 92,093 1,298,874 1,566,175 218,272 8,948,878 275,594 13,579,407 Enduring materials (other) 25,754 55,036 214 51,715 62,222 905 558,837 40,189 794,872 Learning from teaching - 1,125 - 95 9 15 2,383 30 3,657 Journal CME 3,889 17,799 - 3,440 95,146 446 122,204 790 243,714 Manuscript review 1 133 - 1 1,471 - 1,123 2 2,731 Other 2,619 3,347 10 126 2,727 2,135 526 434 11,924 Grand total 1,398,259 2,189,217 109,270 1,562,144 2,259,007 290,066 10,136,305 1,752,153 19,696,421

CME Presented by Providers Accredited in the ACCME SystemTable 5. Other Learner Interactions by Organization and Activity Type—2019

ACCME® Data Report 2019 © 2020 by the ACCME®

Page 9 of 23 872_20200728

Total reported income Registration fees

Total commercial support

Advertising and exhibits income Private donations Government grants

Average 1,774,308$ 971,636$ 450,463$ 314,418$ 14,950$ 22,842$

First quartile1 -$ -$ -$ -$ -$ -$

Second quartile (median)1 42,960$ 3,888$ -$ -$ -$ -$

Third quartile1 575,962$ 202,636$ 25,575$ 70,943$ -$ -$

Total 3,058,907,317$ 1,675,099,910$ 776,597,793$ 542,056,113$ 25,773,624$ 39,379,877$

Providers reporting data > $0 1,145 932 610 777 348 176

CME Presented by Providers Accredited in the ACCME SystemTable 6. Income—2019Total Providers =1,724

1The percentage of providers reporting data for some of the financial categories is less than needed to report some of the quartile values.

ACCME® Data Report 2019 © 2020 by the ACCME®

Page 10 of 23 872_20200728

Number of providers

Total reported income

Registration fees

Total commercial

support

Advertising and exhibits

income Private

donations Government

grants Government or military 35 $ 4,214,850 $ 1,466,831 $ 13,800 $ 421,884 $ 5,000 $ 2,307,335 Hospital/healthcare delivery system 897 $ 118,878,627 $ 48,633,420 $ 27,929,508 $ 33,634,393 $ 5,375,578 $ 3,305,728 Insurance company/managed-care company 25 $ 8,544,016 $ 3,370,511 $ 4,142,377 $ 871,294 $ 53,700 $ 106,135

Nonprofit (other) 99 $ 134,417,156 $ 55,558,212 $ 52,925,875 $ 13,277,530 $ 7,593,957 $ 5,061,582 Nonprofit (physician membership organization) 316 $ 1,170,791,488 $ 689,518,176 $ 101,966,790 $ 357,906,700 $ 6,483,781 $ 14,916,041

Other 65 $ 48,394,597 $ 22,415,493 $ 18,860,785 $ 5,009,144 $ 341,174 $ 1,768,000 Publishing/education company 143 $ 1,194,344,741 $ 675,081,804 $ 457,962,275 $ 57,682,994 $ 1,067,443 $ 2,550,225 School of medicine 144 $ 379,321,842 $ 179,055,462 $ 112,796,383 $ 73,252,175 $ 4,852,991 $ 9,364,832 Grand total 2019 1,724 $ 3,058,907,317 $ 1,675,099,910 $ 776,597,793 $ 542,056,113 $ 25,773,624 $ 39,379,877

Grand total 2018 1,763 $ 2,833,569,300 $ 1,527,559,796 $ 748,302,064 $ 499,052,494 $ 26,744,928 $ 31,910,017 Grand total 2017 1,794 $ 2,682,821,566 $ 1,449,460,937 $ 739,331,934 $ 434,718,810 $ 30,517,214 $ 28,792,671 Grand total 2016 1,833 $ 2,515,804,249 $ 1,342,942,668 $ 704,132,877 $ 411,220,086 $ 33,148,454 $ 24,360,164 Grand total 2015 1,876 $ 2,464,326,269 $ 1,309,421,232 $ 693,786,396 $ 389,961,753 $ 36,371,537 $ 34,785,352 Note: Grand totals may differ slightly due to rounding.

CME Presented by Providers Accredited in the ACCME SystemTable 7. Income by Organization Type—2019

ACCME® Data Report 2019 © 2020 by the ACCME®

Page 11 of 23 872_20200728

Count % Count % Count %No commercial support 173,057 92% 15,175,058 88% 16,979,344 86%

ACCME-accredited providers 85,780 10,308,458 5,891,650Jointly accredited providers 50,582 2,865,517 9,620,862State-accredited providers 36,695 2,001,083 1,466,832

Commercial support 15,935 8% 2,143,737 12% 2,717,077 14%ACCME-accredited providers 10,883 1,293,104 1,199,088Jointly accredited providers 4,654 820,671 1,489,446State-accredited providers 398 29,962 28,543

Total 188,992 100% 17,318,795 100% 19,696,421 100%

In 2019, the majority of CME activities (92%) did not receive commercial support, accounting for 88% of physician interactions, and 86% of other learner interactions. Eight percent of CME activities did receive commercial support, accounting for 12% of physician interactions and 14% of other learner interactions.

CME Presented by Providers Accredited in the ACCME System

Table 8. CME Activities and Interactions with and without Commercial Support—2019Activities Physician interactions Other learner interactions

ACCME® Data Report 2019 © 2020 by the ACCME®

Page 12 of 23 872_20200728

ActivitiesHours of

instructionPhysician

interactionsOther learner

interactions

Course 92,762 550,457 1,979,757 2,290,704 Regularly scheduled series 24,958 551,374 5,191,946 2,418,242 Internet live course 6,091 17,153 94,636 331,846 Test item writing 98 875 1,831 273 Committee learning 421 1,607 7,243 5,382 Performance improvement 596 10,640 57,405 7,456 Internet searching and learning 64 1,429 2,083,469 6,213 Internet activity enduring material 49,431 118,415 5,647,199 13,579,407 Enduring material 8,515 39,013 1,088,030 794,872 Learning from teaching 86 1,051 5,232 3,657 Journal-based CME 5,429 10,727 1,077,529 243,714 Manuscript review 132 2,011 70,409 2,731 Other 409 4,416 14,109 11,924 Total 188,992 1,309,167 17,318,795 19,696,421

ActivitiesHours of

instructionPhysician

interactionsOther learner

interactions

Course 84,644 488,128 1,222,233 1,734,755 Regularly scheduled series 24,832 548,708 5,151,788 2,395,560 Internet live course 5,449 16,354 69,304 263,949 Test item writing 97 871 1,829 273 Committee learning 421 1,607 7,243 5,382 Performance improvement 587 10,460 53,325 6,409 Internet searching and learning 64 1,429 2,083,469 6,213 Internet activity enduring material 43,133 111,929 4,449,932 11,610,350 Enduring material 7,872 38,099 987,636 701,100 Learning from teaching 85 1,046 5,214 3,647 Journal-based CME 5,350 10,577 1,059,262 237,972 Manuscript review 132 2,011 70,409 2,731 Other 391 4,234 13,414 11,003 Total 173,057 1,235,451 15,175,058 16,979,344

ActivitiesHours of

instructionPhysician

interactionsOther learner

interactions

Course 8,118 62,329 757,524 555,949 Regularly scheduled series 126 2,666 40,158 22,682 Internet live course 642 799 25,332 67,897 Test item writing 1 4 2 - Committee learning - - - - Performance improvement 9 180 4,080 1,047 Internet searching and learning - - - - Internet activity enduring material 6,298 6,486 1,197,267 1,969,057 Enduring material 643 914 100,394 93,772 Learning from teaching 1 5 18 10 Journal-based CME 79 151 18,267 5,742 Manuscript review - - - - Other 18 183 695 921 Total 15,935 73,716 2,143,737 2,717,077

Table 11. Numbers of Activities, Hours, and Interactions with Commercial Support—2019

CME Presented by Providers Accredited in the ACCME SystemTable 9. Total Numbers of Activities, Hours, and Interactions—2019

CME Presented by Providers Accredited in the ACCME SystemTable 10. Numbers of Activities, Hours, and Interactions without Commercial Support—2019

CME Presented by Providers Accredited in the ACCME System

ACCME® Data Report 2019 © 2020 by the ACCME®

Page 13 of 23 872_20200728

CME Presented by Providers Accredited in the ACCME SystemFigure 1. Activities, Hours, and Interactions—2005–2019

The breaks in the line for other learner interactions in 2018 indicate a change in data collection. In 2018, the launch of the Joint Accreditation Program and Activity Reporting System (JA-PARS) enabled jointly accredited providers to report program and activity data, including uni-professional and interprofessional continuing education (IPCE) activities, into a single, unified repository. Before 2018, jointly accredited providers reported data into multiple accreditors’ data systems. This change accounts for the increase in other learner interactions.

17,318,795

19,696,421

188,992

1,309,167

-

200,000

400,000

600,000

800,000

1,000,000

1,200,000

1,400,000

-

5,000,000

10,000,000

15,000,000

20,000,000

25,000,000

2005 2006 2007 2008 2009 2010 2011 2012 2013 2014 2015 2016 2017 2018 2019

Hou

rs/A

ctiv

ities

Inte

ract

ions

Physician interactions Other learner interactions Activities Hours of instruction

ACCME® Data Report 2019 © 2020 by the ACCME®

Page 14 of 23 872_20200728

Figure 2. Income—2019Total income is $3,058,907,317

In 2019, registration fees made up 55% of reported income. Commercial support accounted for 25%, advertising and exhibits income for 18%, and private donations and government grants for about 1% each.

CME Presented by Providers Accredited in the ACCME System

Registration fees $1,675,099,910

55%

Private donations $25,773,624

1%

Commercial support $776,597,793

25%

Advertising & exhibits income

$542,056,113 18%

Government grants $39,379,877

1%

ACCME® Data Report 2019 © 2020 by the ACCME®

Page 15 of 23 872_20200728

Providers Accredited in the ACCME SystemFigure 3. Accredited Providers by Provider Type—2019

There were 1,724 total CME providers in 2019. Of these, 1,010 providers were state-accredited, 627 providers were ACCME-accredited, and 87 providers were accredited by Joint Accreditation for Interprofessional Continuing Education. State and territory medical societies are recognized as accreditors by the ACCME; they accredit organizations that offer CME primarily to learners from their state or contiguous states. More than 80% of state-accredited providers are hospital/healthcare delivery systems serving regional areas. The ACCME accredits organizations that offer CME primarily to national or international audiences. Most publishing/education companies have a national reach and are thus accredited by the ACCME. Schools of medicine that are accredited by the Liaison Committee on Medical Education (LCME) are eligible to be accredited by the ACCME or Joint Accreditation. Joint Accreditation accredits organizations that focus on continuing education by and for healthcare teams.

9

77

13 34

229

24

118 123

21

804

12

59

77

29

5 3

5

16

6

10

12

20 18

0

100

200

300

400

500

600

700

800

900

1000

Government or military Hospital/healthcaredelivery system

Insurance/managed-care company

Non-profit (other) Non-profit (physicianmembershiporganization)

Other Publishing/educationcompany

School of medicine

ACCME‐accredited providers State‐accredited providers Jointly accredited providers

ACCME® Data Report 2019 © 2020 by the ACCME®

Page 16 of 23 872_20200728

The Accreditation Criteria require providers to produce educational activities that are designed to change learners' competence, performance, or patient outcomes. Providers are then required to analyze the changes that were achieved as a result of the activities.

Figure 4 illustrates the percentage of CME provided in 2019 that was designed and/or analyzed for changes in competence, performance, and/or patient outcomes.

CME Presented by Providers Accredited in the ACCME SystemFigure 4. Percentage of CME Designed/Analyzed for Change in

Competence, Performance, or Patient Outcomes—2019

Designed to change Analyzed for change

98%

56%

29%

91%

41%

10%0%

10%20%30%40%50%60%70%80%90%

100%

Competence Performance Patientoutcomes

Activities

97%

65%

40%

90%

46%

15%0%

10%20%30%40%50%60%70%80%90%

100%

Competence Performance Patientoutcomes

Hours of Instruction

98%

60%

29%

93%

46%

11%0%

10%20%30%40%50%60%70%80%90%

100%

Competence Performance Patientoutcomes

Physician Interactions

97%

55%

32%

89%

43%

11%0%

10%20%30%40%50%60%70%80%90%

100%

Competence Performance Patientoutcomes

Other Learner Interactions

ACCME® Data Report 2019 © 2020 by the ACCME®

Page 17 of 23 872_20200728

CME Presented by Providers Accredited in the ACCME SystemFigure 5. Learner Interactions by Activity Type—2019

Figure 5 shows physician and other learner interactions by activity type. The activity types with few total interactions have been grouped together under "additional activity types." A complete list of activity types can be found in Table 1. In 2019, regularly scheduled series and Internet enduring materials each represented about a third of physician interactions, while more than two-thirds of other learners engaged in Internet enduring materials.

11%Courses

12%Courses

30%Regularly scheduled series

12%Regularly scheduled series

33%Internet enduring materials

69%Internet enduring materials

12%Internet searching

and learning

<1%Internet searching

and learning

6%Enduring material (other)

4%Enduring material (other)

6%Journal CME

1%Journal CME

1%Additional activity types

2%Additional activity types

0

5

10

15

20

Physician interactions Other learner interactions

Millions

ACCME® Data Report 2019 © 2020 by the ACCME®

Page 18 of 23 872_20200728

CME Presented by Providers Accredited in the ACCME SystemFigure 6. Activity Counts by Activity Type—2010-2019

Figure 6 shows the trend in total activity counts by activity type. Those activity types with a small overall count are combined under "additional activity types." A complete list of activity types can be found in Table 1. While the number of regularly scheduled series and enduring materials has remained constant, Internet enduring materials and courses have increased over the past five years.

92,762

49,431

24,958

13,326

8,5150

10,000

20,000

30,000

40,000

50,000

60,000

70,000

80,000

90,000

100,000

2010 2011 2012 2013 2014 2015 2016 2017 2018 2019

Courses Internet enduring materials Regularly scheduled series Additional activity types Enduring materials (other)

ACCME® Data Report 2019 © 2020 by the ACCME®

Page 19 of 23 872_20200728

CME Presented by Providers Accredited in the ACCME SystemFigure 7. Hours of Instruction—2010-2019

Figure 7 shows hours of instruction by activity type over time. Those activity types with few hours of instruction overall are combined under "additional activity types." A complete list of activity types can be found in Table 1.

0

200,000

400,000

600,000

800,000

1,000,000

1,200,000

1,400,000

2010 2011 2012 2013 2014 2015 2016 2017 2018 2019

Hou

rs o

f Ins

truct

ion

Additional activity types

Journal CME

Enduring materials (other)

Internet (enduring materials)

Internet (live)

Regularly scheduled series

Courses

ACCME® Data Report 2019 © 2020 by the ACCME®

Page 20 of 23 872_20200728

Organization typeGovernment or

military

Hospital/ healthcare

delivery system

Insurance company/

managed-care company Nonprofit (other)

Nonprofit (physician

membership organization) Other

Publishing/ education company

School of medicine All providers

Number of providers 35 897 25 99 316 65 143 144 1724

Average 604 56 124 61 107 60 273 224 110

First quartile 8 10 7 7 4 3 13 55 9

Second quartile (median) 21 22 23 23 23 29 58 136 27

Third quartile 95 50 60 60 78 74 227 301 84

Grand total 21,130 49,815 3,091 6,026 33,734 3,885 39,075 32,236 188,992

Organization typeGovernment or

military

Hospital/ healthcare

delivery system

Insurance company/

managed-care company Nonprofit (other)

Nonprofit (physician

membership organization) Other

Publishing/ education company

School of medicine All providers

Number of providers 35 897 25 99 316 65 143 144 1,724

Average 2,947 466 228 335 592 292 1,061 2,717 759

First quartile 25 56 53 54 45 16 66 625 56

Second quartile (median) 57 152 74 144 124 65 274 2,123 166

Third quartile 478 422 267 427 491 249 930 3,742 583

Grand total 103,150 418,130 5,700 33,164 187,150 18,974 151,672 391,226 1,309,167

Organization typeGovernment or

military

Hospital/ healthcare

delivery system

Insurance company/

managed-care company Nonprofit (other)

Nonprofit (physician

membership organization) Other

Publishing/ education company

School of medicine All providers

Number of providers 35 897 25 99 316 65 143 144 1,724

Average 6,462 3,465 14,651 4,492 12,582 2,829 39,236 23,633 10,046

First quartile 92 442 376 82 429 56 468 4,366 398

Second quartile (median) 454 1,265 2,497 433 1,491 335 2,636 16,619 1,401

Third quartile 2,451 3,148 9,672 2,196 4,628 1,499 14,905 33,156 4,834

Grand total 226,180 3,107,963 366,277 444,699 3,975,847 183,901 5,610,709 3,403,219 17,318,795

Organization typeGovernment or

military

Hospital/ healthcare

delivery system

Insurance company/

managed-care company Nonprofit (other)

Nonprofit (physician

membership organization) Other

Publishing/ education company

School of medicine All providers

Number of providers 35 897 25 99 316 65 143 144 1,724

Average 39,950 2,441 4,371 15,779 7,149 4,463 70,883 12,168 11,425

First quartile 247 268 169 203 85 30 292 3,064 242

Second quartile (median) 891 778 605 1,031 635 459 2,476 7,894 920

Third quartile 6,510 2,126 2,155 3,086 2,615 2,215 18,328 15,622 3,395

Grand total 1,398,259 2,189,217 109,270 1,562,144 2,259,007 290,066 10,136,305 1,752,153 19,696,421

CME Presented by Providers Accredited in the ACCME SystemTable 12. Activity by Organization Type—2019

CME Presented by Providers Accredited in the ACCME SystemTable 13. Hours of Instruction by Organization Type—2019

CME Presented by Providers Accredited in the ACCME SystemTable 14. Physician Learner Interaction by Organization Type—2019

CME Presented by Providers Accredited in the ACCME SystemTable 15. Other Learner Interaction by Organization Type—2019

ACCME® Data Report 2019 © 2020 by the ACCME®

Page 21 of 23 872_20200728

Organization typeGovernment or

military

Hospital/ healthcare

delivery system

Insurance company/managed-

care companyNonprofit

(other)

Nonprofit (physician membership

organization) OtherPublishing/

education companySchool of medicine All providers

Number of providers 35 897 25 99 316 65 143 144 1,724

Average 41,909$ 54,218$ 134,820$ 561,194$ 2,182,020$ 344,854$ 4,720,852$ 1,243,441$ 971,636$

First quartile1 -$ -$ -$ -$ 63,600$ -$ -$ 41,339$ -$

Second quartile (median)1 -$ -$ -$ 14,186$ 517,498$ -$ 171,874$ 266,901$ 3,888$

Third quartile1 -$ 11,224$ 1,950$ 207,935$ 1,905,890$ 18,714$ 1,157,007$ 1,037,072$ 202,636$

Grand total 1,466,831$ 48,633,420$ 3,370,511$ 55,558,212$ 689,518,176$ 22,415,493$ 675,081,804$ 179,055,462$ 1,675,099,910$

Organization typeGovernment or

military

Hospital/ healthcare

delivery system

Insurance company/managed-

care companyNonprofit

(other)

Nonprofit (physician membership

organization) OtherPublishing/

education companySchool of medicine All providers

Number of providers 35 897 25 99 316 65 143 144 1,724

Average 394$ 31,137$ 165,695$ 534,605$ 322,680$ 290,166$ 3,202,533$ 783,308$ 450,463$

First quartile1 -$ -$ -$ -$ -$ -$ -$ 4,276$ -$

Second quartile (median)1 -$ -$ -$ -$ 30,500$ -$ 45,890$ 69,975$ -$

Third quartile1 -$ -$ -$ 15,000$ 269,750$ -$ 1,788,475$ 604,588$ 25,575$

Grand total 13,800$ 27,929,508$ 4,142,377$ 52,925,875$ 101,966,790$ 18,860,785$ 457,962,275$ 112,796,383$ 776,597,793$

Organization typeGovernment or

military

Hospital/ healthcare

delivery system

Insurance company/managed-

care companyNonprofit

(other)

Nonprofit (physician membership

organization) OtherPublishing/

education companySchool of medicine All providers

Number of providers 35 897 25 99 316 65 143 144 1,724

Average 12,054$ 37,497$ 34,852$ 134,116$ 1,132,616$ 77,064$ 403,378$ 508,696$ 314,418$

First quartile1 -$ -$ -$ -$ 15,209$ -$ -$ 7,628$ -$

Second quartile (median)1 -$ -$ -$ -$ 135,638$ -$ -$ 126,450$ -$

Third quartile1 -$ 9,390$ -$ 57,500$ 874,621$ -$ 27,700$ 445,718$ 70,943$

Grand total 421,884$ 33,634,393$ 871,294$ 13,277,530$ 357,906,700$ 5,009,144$ 57,682,994$ 73,252,175$ 542,056,113$

1The percentage of providers reporting data for some of the financial categories is less than needed to report some of the quartile values.

CME Presented by Providers Accredited in the ACCME SystemTable 16. Registration Fee by Organization Type—2019

CME Presented by Providers Accredited in the ACCME SystemTable 17. Commerical Support by Organization Type—2019

CME Presented by Providers Accredited in the ACCME SystemTable 18. Advertising and Exhibit Income by Organization Type—2019

ACCME® Data Report 2019 © 2020 by the ACCME®

Page 22 of 23 872_20200728

Organization typeGovernment or

military

Hospital/ healthcare

delivery system

Insurance company/managed-

care companyNonprofit

(other)

Nonprofit (physician membership

organization) OtherPublishing/

education companySchool of medicine All providers

Number of providers 35 897 25 99 316 65 143 144 1,724

Average 143$ 5,993$ 2,148$ 76,707$ 20,518$ 5,249$ 7,465$ 33,701$ 14,950$

First quartile1 -$ -$ -$ -$ -$ -$ -$ -$ -$

Second quartile (median)1 -$ -$ -$ -$ -$ -$ -$ -$ -$

Third quartile1 -$ -$ -$ -$ 4,894$ -$ -$ 29,229$ -$

Grand total 5,000$ 5,375,578$ 53,700$ 7,593,957$ 6,483,781$ 341,174$ 1,067,443$ 4,852,991$ 25,773,624$

Organization typeGovernment or

military

Hospital/ healthcare

delivery system

Insurance company/managed-

care companyNonprofit

(other)

Nonprofit (physician membership

organization) OtherPublishing/

education companySchool of medicine All providers

Number of providers 35 897 25 99 316 65 143 144 1,724

Average 65,924$ 3,685$ 4,245$ 51,127$ 47,203$ 27,200$ 17,834$ 65,034$ 22,842$

First quartile1 -$ -$ -$ -$ -$ -$ -$ -$ -$

Second quartile (median)1 -$ -$ -$ -$ -$ -$ -$ -$ -$

Third quartile1 -$ -$ -$ -$ -$ -$ -$ 13,750$ -$

Grand total 2,307,335$ 3,305,728$ 106,135$ 5,061,582$ 14,916,041$ 1,768,000$ 2,550,225$ 9,364,832$ 39,379,877$

Organization typeGovernment or

military

Hospital/ healthcare

delivery system

Insurance company/managed-

care companyNonprofit

(other)

Nonprofit (physician membership

organization) OtherPublishing/

education companySchool of medicine All providers

Number of providers 35 897 25 99 316 65 143 144 1,724

Average 120,424$ 132,529$ 341,761$ 1,357,749$ 3,705,036$ 744,532$ 8,352,061$ 2,634,179$ 1,774,308$

First quartile1 -$ -$ -$ 7,154$ 189,442$ -$ 311,000$ 148,970$ -$

Second quartile (median)1 -$ -$ -$ 86,352$ 875,222$ 7,945$ 1,080,423$ 973,327$ 42,960$

Third quartile1 17,582$ 46,748$ 172,309$ 527,383$ 3,719,653$ 267,633$ 4,693,282$ 2,502,626$ 575,962$

Grand total 4,214,850$ 118,878,627$ 8,544,016$ 134,417,156$ 1,170,791,488$ 48,394,597$ 1,194,344,741$ 379,321,842$ 3,058,907,317$

1The percentage of providers reporting data for some of the financial categories is less than needed to report some of the quartile values.

CME Presented by Providers Accredited in the ACCME SystemTable 19. Private Donation Income by Organization Type—2019

CME Presented by Providers Accredited in the ACCME SystemTable 20. Government Grant Income by Organization Type—2019

CME Presented by Providers Accredited in the ACCME SystemTable 21. Total Reported Income by Organization Type—2019

ACCME® Data Report 2019 © 2020 by the ACCME®

Page 23 of 23 872_20200728


Recommended