Foundations and Trends R in Finance Vol. 4, No. 4 (2009) 247–325 c 2010 V. V. Acharya, T. Cooley, M. Richardson and I. Walter DOI: 10.1561/0500000025 Manufacturing Tail Risk: A Perspective on the Financial Crisis of 2007–2009 By Viral V. Acharya, Thomas Cooley, Matthew Richardson and Ingo Walter Contents 1 Introduction 249 2 How Did We Get There? 253 2.1 The Panic of 1907 and Its Aftermath 253 2.2 Bank Competition, Financial Innovation and Risk-Taking in the Last Decades of the 20th Century 258 2.3 Risk-Taking Incentives of Financial Institutions 264 3 The New Banking Model of Manufacturing Tail Risk 273 4 Alternative Explanations of the Financial Crisis 292 5 Conclusion 311 A Appendix: Tail Risk in the Rest of the World 314 References 320
Manufacturing Tail Risk: A Perspective onthe Financial Crisis of 2007–2009
Viral V. Acharya1, Thomas Cooley2, MatthewRichardson3 and Ingo Walter4
1 Stern School of Business, New York University, New York, NY 10012,USA, [email protected]
2 Stern School of Business, New York University, New York, NY 10012,USA
3 Stern School of Business, New York University, New York, NY 10012,USA
4 Stern School of Business, New York University, New York, NY 10012,USA
Abstract
We argue that the fundamental cause of the financial crisis of 2007–2009was that large, complex financial institutions (“LCFIs”) took excessiveleverage in the form of manufacturing tail risks that were systemicin nature and inadequately capitalized. We employ a set of headlinefacts about the build-up of such risk exposures to explain how and whyLCFIs adopted this new banking model during 2003–2Q 2007, relativeto earlier models. We compare the crisis with other episodes in theUnited States, in particular, the panic of 1907, the failure of Continen-tal Illinois and the Savings and Loan crisis. We conclude that severalprincipal imperfections, in particular, distortions induced by regulationand government guarantees, developed in decades preceding the current
one, allowing LCFIs to take on excessive systemic risk. We also exam-ine alternative explanations for the financial crisis. We conclude thatwhile moral hazard problems in the originate-and-distribute model ofbanking, excess liquidity due to global imbalances and mispricing ofrisk due to behavioral biases have some merit as candidates, they failto explain the complete spectrum of evidence on the crisis.
1Introduction
There is virtually universal agreement that the fundamental cause ofthe global economic and financial crisis of 2007–2009 was the combi-nation of a credit boom and a housing bubble. In the five-year periodcovering 2002–2007, the ratio of debt to national income in the UnitedStates increased from 3.75:1 to 4.75:1. It had taken the whole preced-ing decade to produce an increase in aggregate debt of this magnitude.Moreover, from 2002 to 2007, house prices grew at an unprecedentedrate of 11% per year. Why? With the benefit of hindsight, an extraor-dinary flood of liquidity and accommodative monetary policy thatignored asset prices produced extraordinarily low expected real interestrates. This appeared to have left investors scrambling for “alpha” — theso-called “search for yield” — that encouraged all kinds of borrowersto use maximum leverage. Households, corporations, financial firms,investors, and even countries borrowed heavily. When the “bubble”burst, a severe economic crisis was bound to come. At the householdlevel, families whose homes were highly leveraged and whose equityrepresented 35% of their wealth would not be able to consume as theydid through 2007. The real economy was bound to feel the brunt of theinevitable correction
249
250 Introduction
It is much less clear, however, why this combination of events ledto such a severe financial crisis — why we had such widespread andsometimes catastrophic failures of financial institutions along withthe freezing-up of capital markets. The systemic crisis that ensuedreduced the supply of capital to creditworthy institutions and individ-uals, resulted in a sudden sharp decline in global trade and production,and amplified the effects on the real economy worldwide
We argue that what made this economic shock unique, and led tosuch a severe financial crisis was the behavior of many of the large, com-plex financial institutions (LCFIs) — the universal banks and financialconglomerates, investment banks, insurance companies, and (in rarecases) even hedge funds — that today dominate the financial indus-try. These LCFIs ignored their own business model of securitizationand chose not to transfer credit risk to other investors. Instead, theyemployed securitization to manufacture and retain tail risk that wassystemic in nature and inadequately capitalized. Institutions matter,and in this case the robustness of the financial architecture built overtwo decades or so showed severe weaknesses
The legitimate and valuable purpose of securitization is to spreadrisk. It does so by removing large concentrations of risk from the bal-ance sheets of financial institutions, and placing small concentrationsinto the hands of a large number of investors who get paid an accept-able price for bearing that risk. But especially from 2003 to 2007, themain purpose of securitization appeared not to have been to share riskswith investors, but to make an end-run around capital-adequacy regu-lations applied to financial intermediaries. The net result was to keepthe risk concentrated in the financial institutions themselves — and,indeed, to keep that risk at a greatly magnified level because of theoverleveraging that it allowed. When the risk actually materialized —the housing bubble burst — these institutions experienced wholesalefailures, resulting in the greatest systemic crisis we have seen since theGreat Depression.
Our assessment can be restated in a different way. It is now wellrecognized that given limited liability, levered firms have incentivesto shift the profile of their assets toward higher risk (the so-called“risk-shifting” argument of Jensen and Meckling, 1976). Left to market
251
devices, agency costs arising due to these incentives should be pricedby creditors. In turn, the firms should have incentives to limit agencycosts ex ante. In this view, all outcomes are assumed to be second bestin equilibrium. However, this view needs to be refined for financialfirms, since they have an important set of creditors — the governmentand the taxpayer — as a consequence of implicit and explicit subsidies.Government guarantees are often not priced fully (or at all). Thisdistorts financial firms’ cost of capital and their capital budgeting,inducing a preference for higher risk and higher leverage. Recognizingthis moral hazard problem, regulation such as capital requirementsare put in place.
As a result, the objective function of financial firms can be viewedas maximizing shareholder value given the mispricing of agency costs ingovernment guarantees and subject to capital-adequacy requirements.While these firms can maximize their objective functions by enhanc-ing overall value, that is, taking positive net present value investments,they can also circumvent capital requirements if regulation is lax andthe resulting “regulatory arbitrage” is opaque and complex enough thatmarkets cannot fully price the resulting agency costs. Viewed in thisperspective, LCFI behavior during 2003–2007 clearly shows profit max-imization by extensively exploiting gaps in the regulatory constraintrather than by undertaking positive net present value investments. Theend result was the classic excessive leverage build-up in the financialsector. But since the manner in which such gaps were exploited wascomplex and opaque, the crisis that resulted was not well-anticipatedby markets and led to severe spillovers to both financial and real sectorsof the economy.
Section 2 of this monograph begins with a brief history of howthe U.S. financial system evolved into its current form. We pay spe-cial attention to the risk-taking incentives of financial institutions andthe breakdown of the regulatory system-wide protections that hademanated from the experience of the Great Depression.
Section 3 proposes a set of headline facts about the precise mannerin which banks built tail (systemic) risk exposures during 2003–2Q 2007in large measure to get around capital requirements, in contrast to their
252 Introduction
earlier business models. We explain how lax regulation contributed tothese outcomes, especially during the 2003–2005 period.
In light of these headline facts, Section 4 examines alternativeexplanations for the financial crisis: (1) Failure of the originate-and-distribute model, and the role played by rating agencie; (2) Panics inresponse to efficient securitization undertaken by the financial sector;(3) Global imbalances; (4) “Animal spirits” and mispricing of risks;(5) Loose monetary policy, especially in the United States; and, (6)Illiquidity-induced crisis (rather than an insolvency-induced one). Byand large, we conclude that global imbalances and loose monetary pol-icy were relevant proximate contributors to the crisis by producing anasset-price bubble in the United States that ultimately led to the largenegative economic shock; concomitantly, the contemporaneous businessmodel of LCFIs to concentrate tail risks on their balance sheets ratherthan distribute them translated the economic shock into a full-blowncrisis in the financial sector which was soon transferred to the real sec-tor. We explain why none of the other alternative explanations doesmuch to help explain the complete spectrum of available evidence onrisks undertaken by banks.
Section 5 provides concluding remarks and a brief discussion of pos-sible remedies to charge banks for manufacturing tail risks and to con-tain such propensity in the first place. Though we focus on the UnitedStates for most of our discussion, we also discuss risk-taking and real-ized losses by LCFIs in other parts of the world. This latter discussion iscontained in Section 4, where we consider the role of global imbalances,and in a separate Appendix.
2How Did We Get There?
Financial crises have many common features. Preceding any crisis, thereis almost invariably some sort of asset price bubble, a correspondingcredit boom, and large capital inflows into the economy (see, for exam-ple, Reinhart and Rogoff (2008)). This is not too surprising. A finan-cial crisis by definition involves a precipitous drop in nominal wealthand an increase in volatility, which widen credit spreads. That said,it remains likely that, while these characteristics are necessary, theyare not sufficient to define a true financial crisis. Its severity funda-mentally depends on the underlying financial sector’s exposure to suchconditions together with the overall market’s uncertainty about thefinancial sector’s exposure to the developments at hand.
This section maps out how the U.S. financial system got to the pointat which the crisis of 2007–2009 emerged. We begin a century earlier,with the panic of 1907.
2.1 The Panic of 1907 and Its Aftermath
The panic of 1907 was triggered in the curbside “shadow” stock marketthat was organized outside the New York Stock Exchange (NYSE).1
1 The best recent account of the Panic of 1907 is Bruner and Carr (2007).
253
254 How Did We Get There?
Many companies were traded literally on the street curb in a vibrantmarket that eventually became the American Stock Exchange. Why?Because the market was more efficient and more accessible than theNYSE at the time. In October of 1907, two brothers, Augustus andOtto Heinze, tried to corner the market in United Copper Companystock by executing a short squeeze. Their scheme failed, and the priceof United Copper plummeted. The Heinze brothers who had hatchedthe scheme turned out to have been heavily involved with a numberof banks and brokerages. When their curb market scheme collapsed,it quickly raised concerns about the safety of the banks that had lentthe money to back their scheme. Within days a state bank in Montanaowned by Augustus Heinze failed. Augustus was also President of theMercantile National Bank of New York at the time, and was forced toresign because of his association with the corner and the failed MontanaBank. News of his resignation immediately created a panic that causeda run on the Mercantile Bank.
The panic spread and led to pressure on other banks’ stocks anddeposits in those banks — a classic case of contagion. Noteworthy wasthe Knickerbocker Trust Co., the third largest trust bank in New York,whose President Charles Barney was suspected of having helped tofinance the Heinze scheme. The run on the Knickerbocker Trust Co.forced it to close its doors and suspend operations. Charles Barneycommitted suicide not long after. The panic continued to spread toother trust companies and, within days, a large number of banks hadfailed.
The problem that faced banks — and financial markets morebroadly at the time — was the contradiction inherent in fractionalreserve banking. All such institutions were engaged in intermediationof one form or another with less than 100% reserves. When depositorsbecame concerned and demanded their money back, even solvent finan-cial institutions could find their cash and gold reserves insufficient tomeet demands for cash and were forced to shut their doors. The insti-tutions that had evolved (see Gorton, 1985) to address the problemof temporary liquidity shortages were bank clearing house associationsthat pooled resources to provide liquidity to individual members intimes of stress and perform many of the functions of a central bank. But
2.1 The Panic of 1907 and Its Aftermath 255
two problems emerged in this arrangement during the Panic of 1907.The first was that a private clearing house association can itself face therisk of default. The second was that trust companies in New York wereexcluded from membership in the banks’ Clearing House Association.
Some calm was restored during the 1907 panic by the interventionof J. P. Morgan, who assumed a central role in trying to prevent it fromspreading. Morgan had examined the books of the Knickerbocker Trustand concluded it was insolvent and had to be closed. When the panicspread to the Trust Company of America it too turned to Morgan forhelp. He and his associates concluded that the bank was indeed solvent,but would need a great deal of liquidity to survive. Morgan met withother bankers, the Secretary of the Treasury and John D. Rockefeller,and convinced them to work together to stop the panic.
The joint effort turned out to be successful in the short run. Morganhad temporarily saved the day, but that was not the end of his inter-vention. Short-term loans were unavailable. Call money rates soaredto 60% and more, and no loans took place. The troubles of the banksspread to the stock exchange, which lost 48% of its value in a matter ofweeks. Many prominent brokerages were threatened with collapse. NewYork City was on the verge of bankruptcy. And, within a short time theTrust Companies themselves were again on the verge of collapse. J.P.Morgan invited the most prominent banking and trust company leadersto a meeting at his home and, famously, locked them in the library untilthey agreed to a plan to help the weakest of their members throughthe crisis.
There were many lessons to be learned from the Panic of 1907,most notably concerning liquidity and capital, which would play outover the next quarter century and remained trenchant a hundred yearslater. On the liquidity front, it became accepted that there needed tobe a credible lender of last resort who can restore trust in the systemand its institutions. And on the capital front, it was realized that sinceinformation regarding solvency of financial institutions is difficult togather and incredibly valuable, if there is no institution to provide it,the risk of bank runs is high.
Essentially starting with the Panic of 1907 and carrying throughthe banking crisis of August 1914, the stock market crash of 1929, and
256 How Did We Get There?
the banking panics of 1930, 1931, and early 1933, what emerged wasa complete overhaul of the U.S. financial system. While the FederalReserve — and its role as the lender of last resort — was created in1913, the majority of the changes were enacted in 1933 and 1934.2
These regulatory initiatives were enacted precisely because policymak-ers recognized that the severity of the banking crisis and the ensuingperiod, commonly referred to as the Great Depression, were inexorablyinter-related.
Specifically, the 1929 stock market crash, the collapse of produc-tion and wealth that followed, and the continued volatility of financialmarkets in the 1930s, led consumers and businesses to dramaticallyreduce spending, caused extraordinarily high bankruptcy rates amongbusinesses, and brought about the disappearance by failure or acquisi-tion of nearly half of all American financial institutions, often involvingclassis bank runs triggered by suspected insolvency. These came in theform of three separate waves of banking panics during 1930–1933. Theeconomic forces that created and perpetuated the Great Depressionhave been much discussed and debated, and we will simply note herea general consensus that the contractionary monetary policies that theFederal Reserve Board pursued at the time were a contributory fac-tor in the banking crises and their real-sector consequences (Friedmanand Schwartz, 1971). Prices of goods and services fell approximately25% between 1929 and 1933. This in turn led to debt deflation, a phe-nomenon by which the collateral underlying loans shrinks in value,causing the real burden of debt to rise, leading the economy to spiralfurther downward (Bernanke, 2000).
Policymakers at the time recognized that, even with the liquiditybackstop by the government, the problem with the U.S. financial sys-tem was that uncertainty about insolvency (i.e., bank capital) couldcause a run on the system. The Banking Act of the 1933 solved theuncertainty problem that led to bank runs by providing deposit insur-ance through the creation of the Federal Deposit Insurance Corporation(FDIC). Depositors no longer had to run on the bank because the gov-ernment guaranteed deposits, the bulk of bank liabilities. Along with
2 Friedman and Schwartz (1971) and Meltzer (2004).
2.1 The Panic of 1907 and Its Aftermath 257
this government backstop came the fact that deposit insurance createsmoral hazard — the incentive for banks to undertake greater risk thanthey would otherwise have taken without deposit insurance. Regula-tors and policymakers understood that deposit insurance could lead toexcessive risk-taking, so they set up a number of counteracting barriers.
In particular, banks would have to pay fees to be part of the depositinsurance system. So, at least, on an ex ante basis, regulators took intoaccount the cost of the insurance. Deposit insurance was limited in mag-nitude per account, thus restricting the size of the banks. Most impor-tant, there were the so-called Glass-Steagall restrictions: the risk-takingactivities of banks were ring-fenced to the extent there was a separationof commercial banking (taking deposits and making commercial loans)from arguably more risky investment banking activities (underwritingand dealing in corporate debt, equity securities, and municipal revenuebonds). In addition, there would be enhanced supervision of individ-ual banks, generally in the form of minimum capital requirements, aswell as winding-down provisions in the case of failure. Capital require-ments represent protection against the risk-shifting incentive arisingfrom deposit insurance, because the incentive only exists when lever-age and/or asset volatility are high.
While there are many reasons for the relative calm of the U.S. finan-cial system for the fifty years after the Great Depression, many analystspoint to the financial regulation that was enacted in 1933, comple-mented by securities and investment legislation enacted in 1933, 1934,and 1940.
But starting in the early 1980s, the U.S. banking system began toshow some cracks. Ignoring international shocks such as the emergingmarket crisis of 1981, the real estate crises in Japan and the Nordiccountries in 1991, the Mexican “tequila” crisis of 1994, and the Asiancontagion of 1997, it may be surprising to recall that the United Statessuffered a number of events during this time that could have led tofinancial crises that might have been far more serious than they turnedout to be — the failure of Continental Illinois in 1984, the S&L crisisof the 1980s, the stock market crash of 1987, the LTCM crisis in thefall of 1998, and the burst of the dotcom bubble in 2000. So whathappened during this period that ultimately made the serenity of the
258 How Did We Get There?
U.S. financial system fade away and ultimately evaporate in the mostrecent crisis?
2.2 Bank Competition, Financial Innovation andRisk-Taking in the Last Decades of the 20th Century
There is considerable debate about why the banking system changedso much in the 1980s, but the general consensus is that technologychanged the nature of banking and therefore competition in thebanking sector (Kroszner, 2000; Kroszner and Strahan, 2007). Someof these technological changes included (i) the development of theautomated teller machine (ATM) that reduced geographical tiesbetween banks and depositors, (ii) the proliferation of money marketfunds and cash management accounts outside the banking system, and(iii) the increase in the types of communication channels, reducingagain the ties between local bankers and depositors. In other words,traditional lines of business of banks no longer enjoyed their privilegedstatus as financial intermediaries.
In an important paper, Keeley (1990) uses the increase in bankcompetition as an explanation for the Savings and Loan (S&L) crisisof the 1980s. Prior to the aforementioned changes in financial tech-nology, banks and thrifts enjoyed monopolistic advantages and theircharters had significant franchise value. But once this franchise valuewas diminished, the benefits associated with risk-shifting and exploitingthe guarantees of deposit insurance increased. In general, there is con-vincing evidence of risk-shifting related to deregulation and increasedbanking competition that was a prime explanation for the S&L crisis(Saunders et al., 1990; Cordell et al., 1993; Kroszner and Strahan, 1996;Hovakimian and Kane, 2000).
Around the same time, the institutional side of banking also changeddramatically. For example, there was tremendous growth in the so-called “shadow” banking system, i.e., financial institutions outside thetraditional banking system that provide very similar services (Adrianand Shin, 2009; Acharya et al., 2009a; Gorton, 2009). The shadow bank-ing system includes derivatives — futures, options, swaps — as well asrepos and money market funds, securitization of loans in the mortgage,
Financial Innovation and Risk-Taking in the Last Decades of the 20th Century 259
corporate, and household sectors, and an increasing importance of pub-lic equity and bond markets. As an illustration, the amount of assetsof the financial sector held by depository institutions dropped from60% in 1950 to less than 30% in 2006 (Kroszner and Melick, 2009).In Section 3 we provide a detailed analysis of this banking model thattook hold in the 1980s and appeared to flourish thereafter.
Partly because of these dramatic changes in the nature of financialintermediation, there was general recognition that certain provisions ofthe Banking Act of 1933 — those most commonly referred to as theGlass-Steagall provisions — had become obsolete. This process of ero-sion of the allowable scope of commercial bank activities started in themid 1980s with the reinterpretation of Section 20 subsidiaries of banks(which were permitted to carry out Glass-Steagall prohibited activitieswithin certain limits), later with the Riegel-Neal Interstate Bankingand Branching Efficiency Act of 1994, and then finally with the for-mal repeal of Glass-Steagall through the Gramm-Leach-Bliley Finan-cial Services Modernization Act of 1999. The deregulatory environmentcontinued thereafter, with the Commodity Futures Modernization Actof 2000, and in August 2004 with the amendment to the “net capitalrule” of the Securities Exchange Act of 1934 allowing investment banksto dramatically increase leverage and put them on equal footing withuniversal banks under Basel II.
The result of these changes was to leave the financial system forthe most part unprotected by the safety infrastructure that had beencreated in the 1930s, and, in many ways, even weaker in a regulatorysense than at any time since the early 1900s. This is not to arguethat the Banking Act of the 1930s should necessarily have remained inplace, only that whatever replaced them should have been mindful ofthe market failures that led to their passage in the first place. One onlyhas to look at two episodes in the 1980s to understand this point.
2.2.1 Continental Illinois3
In 1982, federal regulators decided to close the Oklahoma-based PennSquare Bank, a $436-million asset bank that specialized in oil and
3 This account relies heavily on FDIC (1997).
260 How Did We Get There?
gas sector loans. Penn Square originated large volumes of loans tothe historically risky exploration sector of the U.S. energy industry,which began to suffer as energy prices fell after 1981. The seventhlargest bank in the United States, Continental Illinois, had investedaggressively alongside or through Penn Square and held hundreds ofmillions of dollars of Penn Square’s book of loans. Continental hadmade many other loans to the energy sector and had also expanded itsbusiness risk by lending large amounts to developing countries to helpthem finance external debt incurred in the energy crises of the 1970s.In 1982, Mexico was forced to begin renegotiating its syndicated bankdebt, triggering the emerging market debt crisis that was not fullyresolved for almost a decade.
While many other U.S. commercial banks followed the same strat-egy of lending to credit hungry markets in the late 1970s, Continen-tal’s credit exposures were compounded by a funding strategy that wasunusual at the time. Traditionally, banks fund growth in their lendingactivities by attracting larger volumes of savings from retail deposi-tors. Continental, however, had a limited retail presence, due in partto federal and local banking regulations. The bank depended heavilyon funding from the wholesale money markets. Indeed, by 1981, Conti-nental gained most of its funding through federal funds and by sellingshort-term certificates of deposit on the wholesale money markets. Only20% of its funding came from traditional retail deposits.
Continental had pursued an aggressive growth strategy andassumed concentrated risk financed mostly with short-term wholesaledebt. When the energy sector turned sour and the developing countriesrenegotiated their debt, Continental was unusually vulnerable tothe views of the wholesale funding markets. In 1984, investors andcreditors lost confidence and in a precursor to the crisis of 2007–2008,Continental was quickly shut out of its usual sources of funding inthe domestic and Eurodollar interbank markets. In May of 1984,Continental experienced what the FDIC described as a high-speedelectronic bank run. To stem the panic, regulatory agencies and thebanking industry arranged massive emergency funding for the bank.The fear was that a failure of Continental would undermine the entirebanking system. As a matter of fact, more than 2,300 banks hadcorrespondent accounts with Continental.
Financial Innovation and Risk-Taking in the Last Decades of the 20th Century 261
In an extremely controversial decision, the Federal Deposit Insur-ance Corporation tried to stop the bank run by extending a guaranteeto uninsured depositors and creditors at the bank. This was arguablythe beginning of the notion that some banks should be considered “toobig to fail”. The emergency help was followed by a package of perma-nent measures, making Continental the largest bank in the history ofU.S. banking ever to be rescued by government agencies. Unable tofind a takeover partner, the FDIC ended up owning more than 80% ofContinental. Management was fired, the board replaced and the bankwas returned to the private sector in an IPO, later to be sold at asignificant premium to Bank of America. The FDIC’s share of the billto rescue the bank was later calculated to be $1.1 billion. Althoughmany considered the rescue of Continental under the leadership of FedChairman Paul A. Volcker a crisis management tour de force, it never-theless signaled to unsecured creditors that they were likely to be fullyprotected against losses by the government under systemic risk circum-stances. Market discipline was not eroded in the case of shareholders,who were wiped out, but it was eroded in the case of creditors, therebycreating moral hazard for the future.
The Continental story provides a classic example of how a sharpdrop in confidence can lead counterparties in the wholesale marketsto suddenly withdraw funding from a damaged bank, spinning theinstitution into a funding liquidity crisis as potentially fatal as anynineteenth-century run on a bank by retail depositors. It should havebeen a warning call that systemic risk can build up quickly in acredit expansion cycle — outside of the traditional banking technol-ogy (deposits) — and needs to be priced and regulated accordingly.Continental Illinois should have been the canary in the coal mine. Itshowed that the regulatory system crafted in the 1930s needed seri-ous updating. Instead, the problem was soon forgotten and eventuallyresurfaced with a vengeance.
2.2.2 The Savings and Loan Crisis
The most serious post-war crisis in the United States banking sectorwas the Savings and Loan (S&L) Crisis of the late 1980s. It is often
262 How Did We Get There?
blamed (with at least some justification) on the more permissive reg-ulatory environment that evolved during the Reagan Administration(White, 1991), and was repeated during the Clinton Administration adecade later. That is not the entire story, however, and it is an episodethat contains valuable lessons for the crisis of 2007–2009.
U.S. Savings and Loan institutions, as distinct from commercialbanks, were also a product of the Great Depression. They were cre-ated to serve the public policy goal of encouraging home ownership.The Federal Home Loan Bank Act of 1932 created the Federal HomeLoan Bank System to provide liquidity and low-cost financing for S&Ls.There were twelve regional Home Loan Banks that were owned by theirmembers and were under the supervision of the Federal Home LoanBank Board (FHLBB). The National Housing Act of 1934 created theFederal Savings and Loan Insurance Corporation (FSLIC) to providedeposit insurance for S&Ls similar to what the FDIC provided for com-mercial banks. In contrast to the FDIC, which was established as anindependent agency, the FSLIC was placed under the authority of theFHLBB.
For decades, the FHLBB’s examination, supervision, and regulationcapabilities were relatively poorly developed, in part because S&Ls hada narrowly defined role in the intermediation sector and not much scopefor expanding it. S&Ls took in household savings, on which they paidrelatively low interest rates, and lent at attractive interest rates onthirty year fixed rate mortgages. This model began to change withthe high inflation of the 1970s when interest rates soared in responseto accelerating inflation during the Carter Administration. Depositsbegan to flee the S&Ls in pursuit of higher returns and, even whenCongress lifted caps on deposit interest rates, the S&Ls were still beingsqueezed on the other end by their portfolios of 30-year fixed rate mort-gages. They needed to find other sources of income. As described ear-lier, many economists view this as the period when S&Ls moved moretoward a risk-shifting model, exploiting their federal deposit insurancebackstop. To accomplish this, the S&Ls needed to circumnavigate orerode existing regulations.
This began with the FHLBB itself loosening regulations coveringS&Ls. It allowed the thrifts to begin issuing adjustable-rate mortgages.
Financial Innovation and Risk-Taking in the Last Decades of the 20th Century 263
Congress also encouraged S&L diversification, and explicitly autho-rized consumer lending and investment in commercial real estate. Bothfederal and state thrift regulators began relaxing restrictions on theirasset allocation, relaxing safety and soundness regulation, lowering cap-ital requirements, and changing accounting rules to make it easier forS&Ls to meet their net worth requirements. All of these changes helpedthe thrift industry to grow rapidly. Between 1980 and 1986, 492 newthrifts were chartered in the United States.
Things began to change when inflation was brought under controlin the early 1980s by the Volcker experiment, accompanied by a seriousrecession. Oil prices fell to a level that made many investments in thatsector unprofitable. Tax benefits for real estate investments were elimi-nated, and that made many projects unprofitable. Much of the financialintermediation growth between 1983 and 1985 was in commercial realestate lending. By 1985, it became clear that the thrift industry facedserious trouble. Enough S&Ls had folded or were in danger of foldingthat the FSLIC itself was insolvent. Efforts to recapitalize the FSLICin 1986 and 1987 were bitterly fought by the industry, which lobbiedaggressively with members of Congress. Thrift failures increased during1987 and into 1988, but the insolvency of the FSLIC meant that res-cuing troubled thrifts would cost more than the FSLIC had availablein its insurance fund. As a result, the regulators could not intervenein S&Ls that had more liabilities than assets. This meant that severalinsolvent thrifts remained in business. These “zombies” had incentivesto take even more risks in the hope that they could eventually improvetheir outcomes.
The crisis in the S&L industry was finally acknowledged andresolved after the inauguration of George H.W. Bush in 1989. Congresspassed the Financial Institutions Reform Recovery and EnforcementAct (FIRREA) in 1989. FIRREA abolished the FHLBB and shiftedregulation of S&Ls to the Office of Thrift Supervision (OTS), trans-ferred the thrifts’ deposit insurance function from the FSLIC to theFDIC, and reinstituted many of the regulatory provisions that hadbeen weakened during the previous decade. In addition, FIRREA cre-ated the Resolution Trust Corporation (RTC) to liquidate or restruc-ture the insolvent S&Ls.
264 How Did We Get There?
There are several lessons from the S&L mess. The first is that whenregulatory institutions have outlived their usefulness or been renderedobsolete it is not enough to just eliminate the regulatory boundarieswithout consideration of the risks that are being created. This wasthe case with the thrift industry, which had been created and devel-oped with specific goals in mind but then morphed into something elseentirely. Another lesson is that regulators can easily be captured bythe industry they regulate. This was clearly the case with the FHLBB.The S&L Crisis makes it clear as well that moral hazard is an impor-tant issue. It demonstrated how critical it is to promptly close insolvent,insured financial institutions in order to minimize potential losses to thedeposit insurance fund and to ensure a more efficient financial market-place. Finally, resolution of failing financial institutions requires thatany deposit insurance fund be strongly capitalized with real reservesbased on meaningful risk assessments.
2.3 Risk-Taking Incentives of Financial Institutions
Given their inherently high leverage and the ease with which the riskprofile of financial assets can be altered, banks, and financial institu-tions have incentives to take on excessive risks. Ordinarily, one wouldexpect market mechanisms to price risks correctly and thereby ensurethat risk-taking in the economy is at efficient levels. However, there areseveral factors — some novel and some traditional — that have ruledout such efficient outcomes.
2.3.1 The Novel Front
Financial institutions have become large and increasingly complex andopaque in their activities. This has weakened external governance thatoperates through capital markets (accurate prices), the market for cor-porate control (takeovers), and the role and functioning of boardsof directors. Coincidentally there is the fact that financial risks atthese institutions are now increasingly concentrated in the hands ofa few “high performance” profit/risk centers. Employees (bankers,traders) engaged in these centers have skills in creating, packaging-and-repackaging, marking to market and hedging financial securities.
2.3 Risk-Taking Incentives of Financial Institutions 265
Since such skills are largely fungible across institutions, such employ-ees have exerted tremendous bargaining power in their institutions andhave succeeded in getting themselves rewarded through highly attrac-tive, short-term compensation packages that provide them lucrativecash bonuses for short-run performance and what has shown itself tobe effectively “fake-alpha”.4
In the period leading up to the recent crisis, bankers were increas-ingly paid through short-term cash bonuses based on volume and onmarked-to-market profits, rather than on the long-term profitability oftheir “bets”.5 So they had no incentive to discount for liquidity risk,for example, that of asset-backed securities, if their bets went wrongand nobody wanted to buy these securities. Nor was there an incentiveto discount for the “maturity mismatch” inherent in special invest-ment vehicles off the banks’ balance sheets — which funded long-termassets via short-term debt (asset-backed commercial paper) that had tobe rolled over frequently, generally overnight. Nor, apparently, did theirmanagers assess the true skills of those who were generating these large“profits.” In effect, regulatory arbitrage — taking on risks and financingstructures that were not subject to significant capital requirements —became a primary business of the financial sector because of the short-term profits it was generating.
A case in point.6 In the summer of 2005, UBS, the Swiss-basedLCFI, became a major player in subprime mortgage collateralizeddebt organizations (CDOs). It purchased pools of subprime mort-gages from mortgage originators and sliced and diced them so thatthe “super senior” tranches would receive the highest designation from
4 Of course, whether the high level of compensation paid to bankers or traders was a symp-tom of weak governance or a result of the equilibrium outcome of a competitive labormarket remains an open question. Gabaix and Landier (2008), for example, show how thelatter mechanism can explain pay scales of such magnitude.
5 See Rajan (2008) for an early hint of this problem with bankers’ pay. Acharya et al.(2009b) and Acharya and Volpin (2010) provide models explaining why pay may haverisen in the banking industry, and coincidentally risk management (governance) qualitydeteriorated, due to greater mobility of risk-takers across financial institutions. Acharyaand Richardson (2009a, 2009b) provide a detailed account of such governance failures (see,especially, Sections 7 and 8).
6 The following account is taken from UBS’s “Shareholder Report on UBS’s Write Downs,”2008, prepared for the Swiss Federal Banking Commission.
266 How Did We Get There?
the rating agencies. The resulting AAA securities would then be soldoff to investors. UBS was paid handsomely for structuring these deals.This business usually worked as intended — the credit risk that wouldnormally be held by UBS or other banks or mortgage lenders wastransferred to the better-capitalized investment community.
Starting in 2006, however, the CDO group at UBS noticed that theirrisk-management systems treated the AAA securities as essentially risk-less, even though they yielded a premium (the proverbial free lunch).So they decided to hold onto them rather than sell them. After hold-ing less than $5 billion of these securities in February 2006, the CDOdesk was warehousing a staggering $50 billion of them by September2007. Incredibly, this happened even though the housing market hadturned south in June 2006; subprime lenders had begun to go belly-upin December 2006; and UBS itself shut down its in-house hedge fund,Dillon Read Capital Management, in May 2007 due to subprime invest-ment losses. None of this mattered to the UBS CDO group. For every$1 of super senior securities held, it booked the premium as immediateprofit. And for every dollar of current “profit” booked, the members ofthe CDO group received correspondingly high bonuses. The membersof the group had every incentive to increase the quantity of CDOs onthe balance sheet as much as possible, since their own bonuses were tiedto instant profits with no recognition of any risk. In a similar fashion,by the late summer of 2007 Citigroup had accumulated over $55 billionof AAA-rated CDOs.
Many analysts have taken stories like UBS, and the fact that manyof the shareholders of the failed (or near failed) institutions — BearStearns, Fannie Mae, Freddie Mac, Lehman Brothers, A.I.G., MerrillLynch, Washington Mutual, Wachovia, and Citigroup — lost most oftheir investment in bank stocks in the crisis, as prima facie evidence ofmassive failure of corporate governance, i.e., between shareholders andmanagers. While clearly this view cannot be completely discounted, webelieve it is actually secondary in importance compared to the failureof corporate governance at the debt and regulatory level. Put anotherway, it appears to us that shareholders of LCFIs themselves benefitedfrom the risk-taking option inherent in such CDO bets at the expenseof creditors and taxpayers.
2.3 Risk-Taking Incentives of Financial Institutions 267
2.3.2 The Traditional Front
To understand risk-taking incentives in large and complex financialintermediaries, we need to examine how the claim structure of theLCFIs is different from that of a regular non-financial firm. On the lia-bility side, LCFIs are highly leveraged entities. At least 90% of the claimholders of an LCFI are debt holders (including depositors). Of course,other claimants comprise taxpayers through the numerous governmentguarantees in the system, most notably (i) deposit insurance, (ii) theimplicit guarantee of too big to fail institutions, and (iii) the “subsi-dies” provided to government-sponsored enterprises like Fannie Maeand Freddie Mac. That is, the vast majority of liabilities in the U.S.financial system were the beneficiaries of some form of safety net (see,for example Marcus and Shaked, 1984; Pennacchi, 1987).
Given this structure of claims, corporate governance mechanismsthat align managers with shareholders may deviate significantly fromthose that maximize firm value. Put differently, corporate governancemechanisms in LCFIs have to be designed so as to align the managerwith the interests of the debt holders and the FDIC guarantor, as wellas the shareholders. Monitoring by debt holders and the regulator arecritically important components of corporate governance in LCFIs (seeJohn and John, 1993, for details) compared to nonfinancial corpora-tions. What kind of monitoring can one expect from debt holders? Ifthe debt holders are depositors, deposit insurance reduces the incen-tives to monitor virtually to zero.
Of course, the fact that banks are covered by deposit insurancedoes not in itself necessarily lead to excessive risk-taking on their part.If the franchise value of their enterprise exceeds the benefits due torisk-shifting, then there might be very little effect on risk-taking as aresult of deposit insurance. But two sets of consequences arose fromcompetition that eroded the profits underlying the traditional lines ofbusiness of banks, described earlier. First, banks moved more and moreinto businesses focusing on noninterest income, such as trading and fee-based activities (e.g., Stiroh, 2002). Second, and more importantly, therelative value of risk-shifting increased given that value of bank chartershad decreased. If the guarantees turned out to be mispriced, then the
268 How Did We Get There?
mispricing effectively removed any market discipline component of gov-ernance normally reserved for creditors. And risk-shifting within largefinancial intermediaries was particularly easy to do.
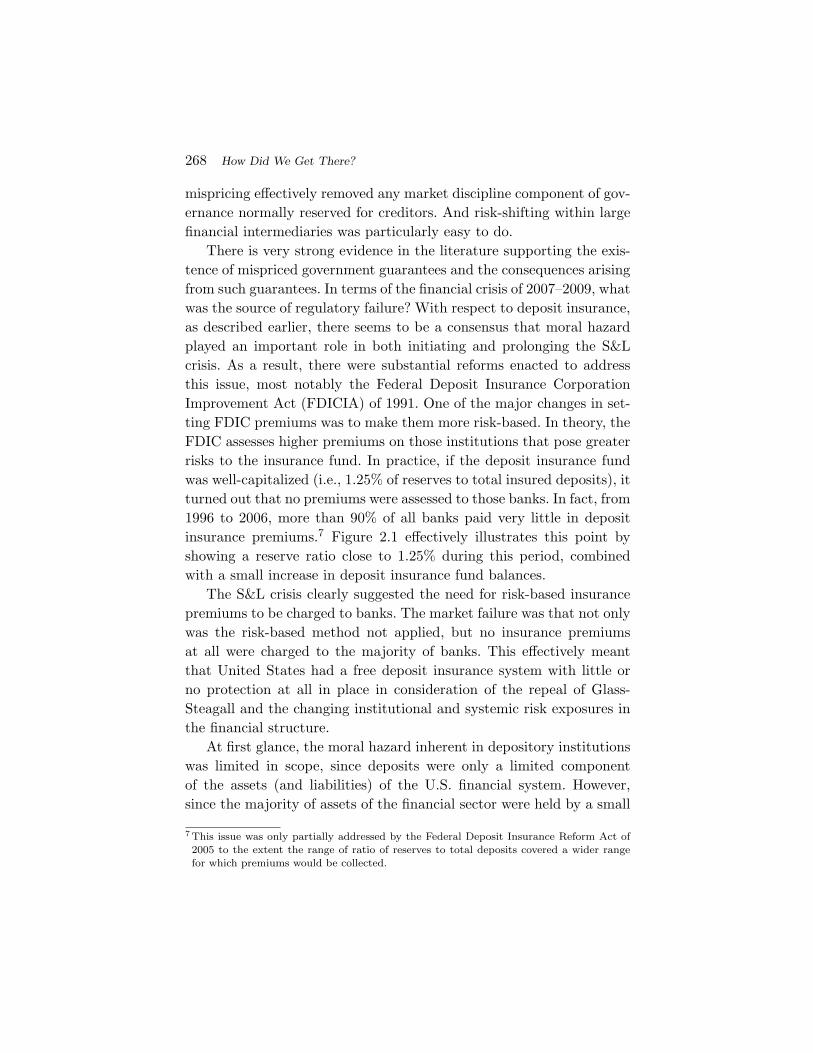
There is very strong evidence in the literature supporting the exis-tence of mispriced government guarantees and the consequences arisingfrom such guarantees. In terms of the financial crisis of 2007–2009, whatwas the source of regulatory failure? With respect to deposit insurance,as described earlier, there seems to be a consensus that moral hazardplayed an important role in both initiating and prolonging the S&Lcrisis. As a result, there were substantial reforms enacted to addressthis issue, most notably the Federal Deposit Insurance CorporationImprovement Act (FDICIA) of 1991. One of the major changes in set-ting FDIC premiums was to make them more risk-based. In theory, theFDIC assesses higher premiums on those institutions that pose greaterrisks to the insurance fund. In practice, if the deposit insurance fundwas well-capitalized (i.e., 1.25% of reserves to total insured deposits), itturned out that no premiums were assessed to those banks. In fact, from1996 to 2006, more than 90% of all banks paid very little in depositinsurance premiums.7 Figure 2.1 effectively illustrates this point byshowing a reserve ratio close to 1.25% during this period, combinedwith a small increase in deposit insurance fund balances.
The S&L crisis clearly suggested the need for risk-based insurancepremiums to be charged to banks. The market failure was that not onlywas the risk-based method not applied, but no insurance premiumsat all were charged to the majority of banks. This effectively meantthat United States had a free deposit insurance system with little orno protection at all in place in consideration of the repeal of Glass-Steagall and the changing institutional and systemic risk exposures inthe financial structure.
At first glance, the moral hazard inherent in depository institutionswas limited in scope, since deposits were only a limited componentof the assets (and liabilities) of the U.S. financial system. However,since the majority of assets of the financial sector were held by a small
7 This issue was only partially addressed by the Federal Deposit Insurance Reform Act of2005 to the extent the range of ratio of reserves to total deposits covered a wider rangefor which premiums would be collected.
2.3 Risk-Taking Incentives of Financial Institutions 269
Fig. 2.1 Balances of deposit insurance fund and the reserve ratio.Source: Federal Deposit Insurance Corporation.
number of LCFIs, the market discipline provided by debt holders wassimilar to that of depositors due to the too big to fail (TBTF) guaran-tee. Since the 1984 bailout of Continental Illinois, the issue of TBTFhad been much discussed in regulatory and academic circles (see, forexample Stern and Feldman, 2004; Ennis and Malek, 2005). Even beforethe financial crisis of 2007–2009 made the TBTF guarantee explicit,there was ample evidence that TBTF was alive and well over the pre-vious two decades, and seriously distorted financial market pricing (see,for example O’Hara and Shaw, 1990; Penas and Unal, 2004; Morganand Stiroh, 2005).
To understand further the importance of moral hazard and therole of government guarantees, consider the case of the government-sponsored enterprises (GSEs), Fannie Mae and Freddie Mac. FannieMae was founded in 1938 in the wake of the depression to provide liq-uidity and aid to the mortgage market. It became a government spon-sored enterprise in 1968, and shortly after, Freddie Mac was formed tocompete with Fannie Mae to create a more efficient secondary market
270 How Did We Get There?
for mortgages. While not explicit, there has always been the presump-tion that both the guarantor function and debt of these GSEs had fullbacking of the U.S. government. Indeed, the GSEs’ debt generally waspriced marginally above the prevailing treasury rate.
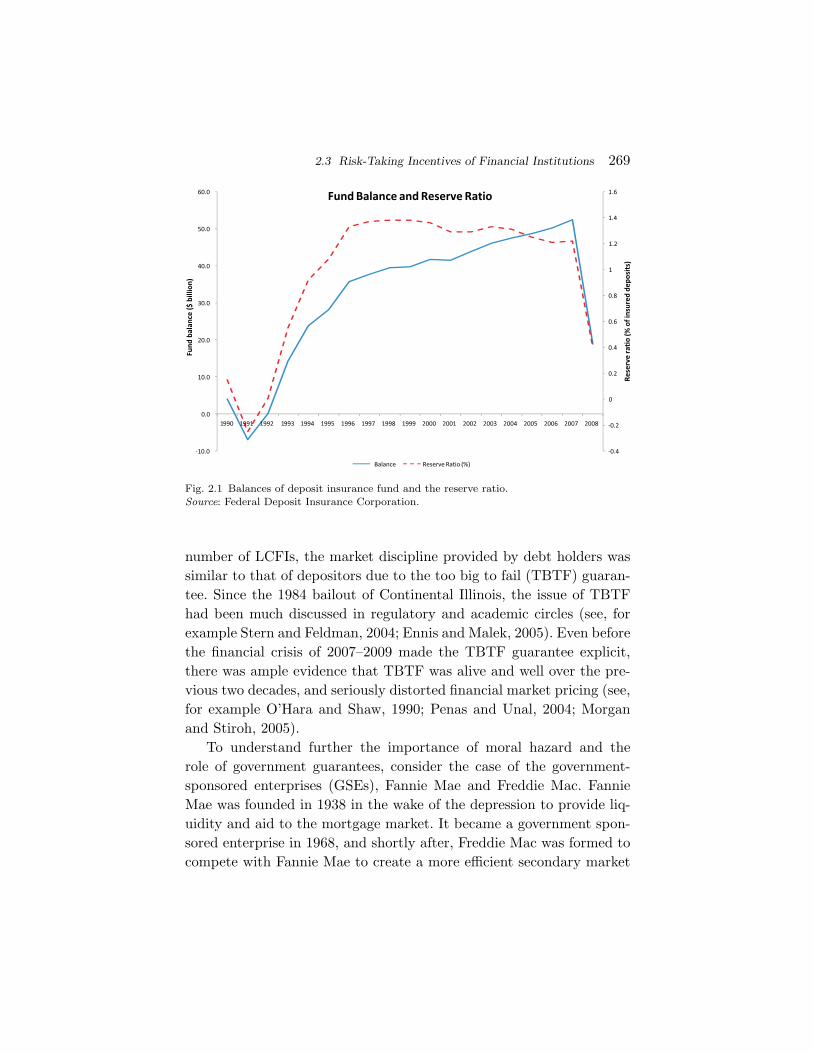
Consider the investment function of the GSEs. For every $1 ofmortgage-backed securities purchased with equity, there was a largeamount of debt issued to purchase additional mortgage-backed secu-rities. Figure 2.2 shows the book and market leverage ratios of theGSEs, measured as assets divided by equity, over the period 1993–2007. The extraordinary point to note is the access to very high lever-age, given that the GSEs were investing in risky, relatively illiquidmortgage-backed securities. This provides an idea of the size of theimplicit government guarantee. In fact, the literature has quantifiedthe transfer from taxpayers to the GSEs to be in the billions of dollarseven before the crisis ignited (see, for example Passmore, 2005; Lucasand McDonald, 2006).
The investment portfolio of the GSEs became markedly riskierthrough time as they began to load up on nonprime mortgages underpressure from Congress and the Clinton Administration. SuccessiveSecretaries of Housing and Urban Development (HUD) mandatedthat the GSEs increase the share of mortgage loans and guarantees
0
5
10
15
20
25
30
35
40
45
50
1993
1995
1997
1999
2001
2003
2005
2007
Fannie (book)
Fannie (Market)
Freddie (book)
Freddie (Market)
Fig. 2.2 The leverage ratio of the GSEs (1993–2007).
2.3 Risk-Taking Incentives of Financial Institutions 271
0
200
400
600
800
1000
1200
1400
1600
1980 1984 1988 1992 1996 2000 2004
Portfolio
Nonprime
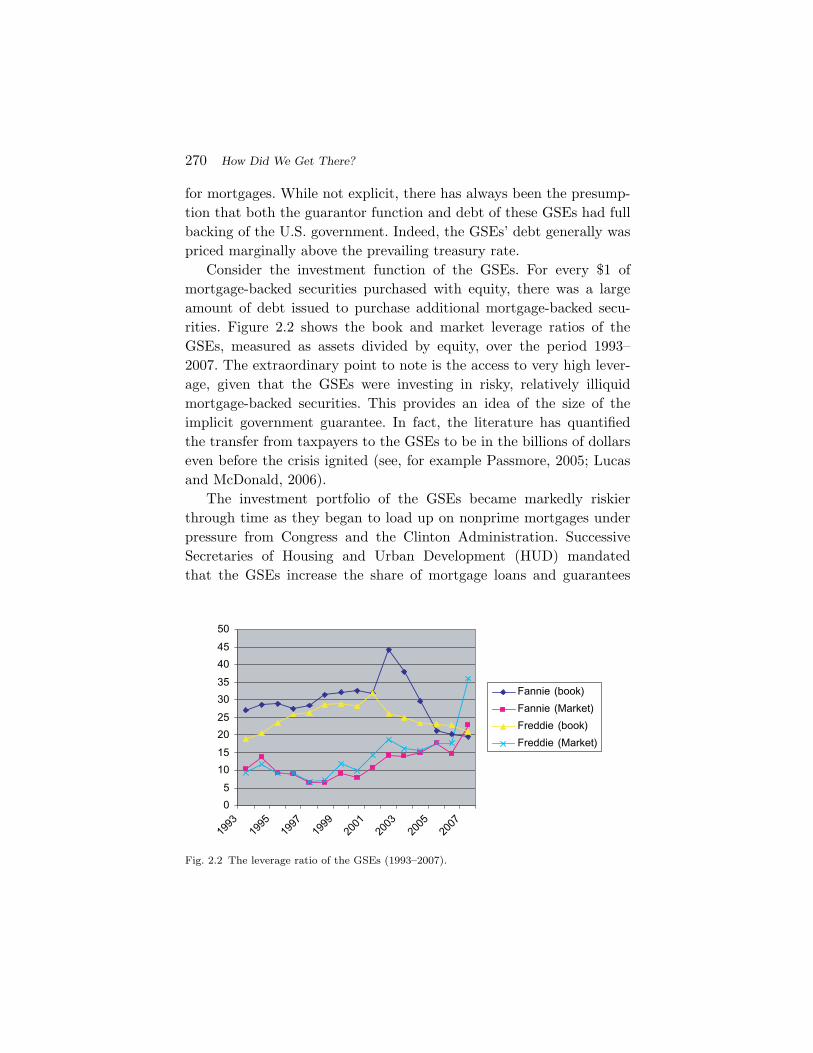
Fig. 2.3 The size of the GSE retained mortgage portfolio (in billions of $).
to low-income households to 50% and then 60% of their portfolios.Although some analysts have argued that the GSEs’ non prime betswere much larger (Pinto, 2008), it is clear that by the mid 2000s atleast 15% of the GSEs’ funds were invested in subprime mortgages.In contrast to prime mortgages, however, these were not hedged usingcorresponding interest rate swaps. Figure 2.3 provides the size of theGSE mortgage portfolios, noting the rise in subprime holdings overthe later years. Of course, with the lack of market discipline due tothe government’s guarantee, one would expect that the GSEs wouldinvest in riskier assets to the extent possible. Quite apart from theirpoliticized character, it is therefore not surprising that, as nonprimemortgages took off, the GSEs substituted risk toward these assets. Thehybrid nature of the GSEs and the implied sovereign guarantee, inshort, underlay a financial disaster waiting to happen.
To summarize, the traditional role of banks together with the lim-its imposed on them by Glass-Steagall led to relative calm in the U.S.financial system for fifty or so years after the 1930s. Once the Glass-Steagall barriers were lifted, the only real protection for the financialsystem was capital requirements and appropriate pricing of govern-ment guarantees covering individual financial institutions. With littleor no pricing of government guarantees, the only remaining obstacle to
272 How Did We Get There?
increased risk-taking and systemic exposure was capital requirements.As we argue in Section 3, the financial crisis of 2007–2009 is centered onhow LCFIs and other Wall Street firms exploited loopholes in regula-tory capital requirements to take on an under-capitalized $2–3 trillionhighly leveraged, one-way asymmetric bet on the economy, particularlytied to residential real estate but also involving commercial real estateand consumer credit.
3The New Banking Model of Manufacturing
Tail Risk1
Given this background, we discuss the shift in the banking model during2003–2Q 2007 compared to the traditional banking and securitizationmodels.
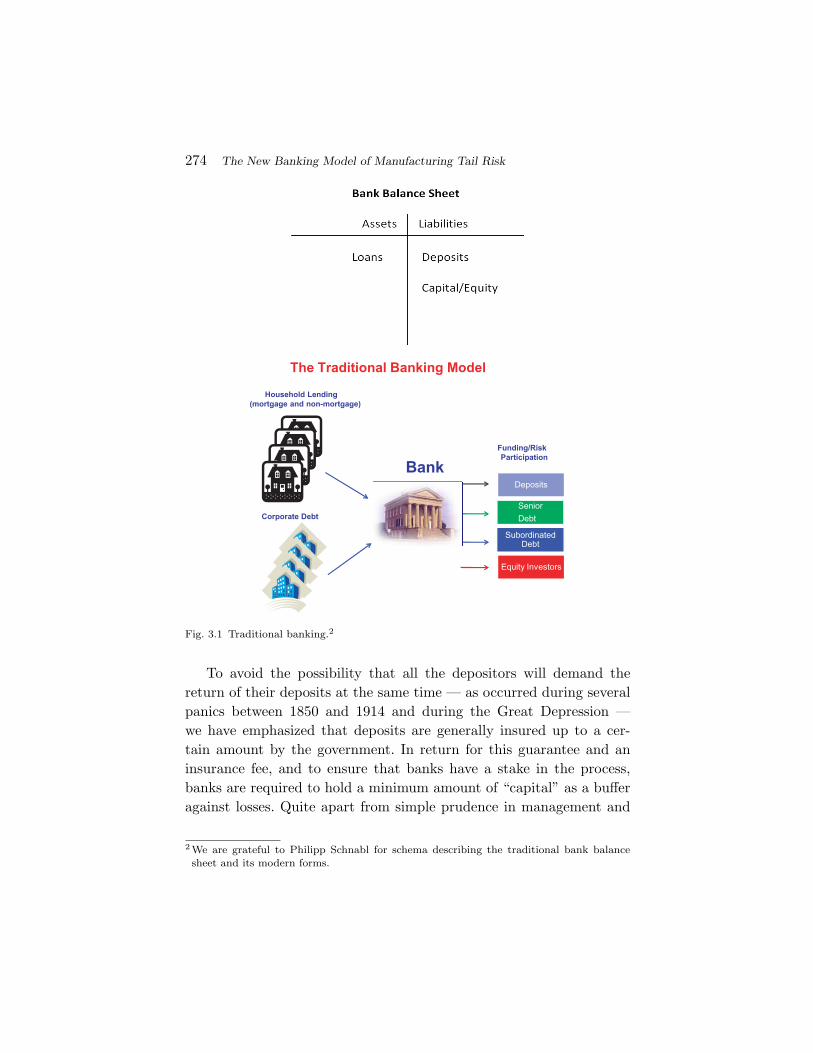
The simple theory of banking is that banks act as financial interme-diaries between depositors and borrowers (Diamond, 1984). Depositorsprovide funds to make loans, and banks provide expertise in assessingthe creditworthiness of borrowers. Historically, then, the asset side ofa bank’s balance sheet (Figure 3.1) would consist of loans funded bydeposits as well as loans funded by equity (and in general non-depositdebt).
A bank’s loans are considered assets because they are owed to thebank by borrowers. Deposits are considered liabilities because, upondemand, they must be returned by the bank to the depositors. In themeantime, however, most deposits have been lent out to borrowers, withthe exception of liquidity reserves, and the interest on these loans is themain source of the commercial bank’s profits. Most deposits, therefore,are unavailable at any given time to be reclaimed by the depositors.
1 This section draws heavily on the discussion in Acharya and Richardson (2009a).
273
274 The New Banking Model of Manufacturing Tail Risk
The Traditional Banking Model
Subordinated Debt
Senior
Debt
Equity Investors
Household Lending(mortgage and non-mortgage)
Corporate Debt
Bank
Funding/RiskParticipation
Deposits
Fig. 3.1 Traditional banking.2
To avoid the possibility that all the depositors will demand thereturn of their deposits at the same time — as occurred during severalpanics between 1850 and 1914 and during the Great Depression —we have emphasized that deposits are generally insured up to a cer-tain amount by the government. In return for this guarantee and aninsurance fee, and to ensure that banks have a stake in the process,banks are required to hold a minimum amount of “capital” as a bufferagainst losses. Quite apart from simple prudence in management and
2 We are grateful to Philipp Schnabl for schema describing the traditional bank balancesheet and its modern forms.
275
governance, even in the days of the Medicis in Florence or the Fuggerin Frankfurt, banks that wanted to survive kept a sharp eye on capitaladequacy. And while there are other complementary explanations ofbank-capital regulation, this simple one suffices for exposition of ourmain point. For these purposes, what constitutes “capital” is defined byregulators. The regulations in place in the run-up to the crisis in mostWestern countries defined capital in terms of funds obtained either byraising equity (selling stock or certain forms of “hybrid” debt that hasequity-like features), or by retaining earnings. We will shortly point outthat banks’ efforts to circumvent these capital-adequacy requirementscaused the financial crisis.
In a world without deposit insurance, capital-adequacy regulationsmight in fact be unnecessary, as it often was in banking history. Thecreditors of financial institutions (depositors, uninsured bondholders,and other counterparties) would apply pressure to curb excessive risktaking. Uninsured bondholders and other counterparties could do thisby charging higher interest rates to banks that took what seemed tobe excessive risks. Similarly, depositors could demand higher interestrates on their deposits in exchange for the higher risk involved in usingsuch banks. And if unanticipated risks seemed to arise in a given bank,they would take their money elsewhere, or under stress conditions par-ticipate in bank runs (akin to the run of unsecured creditors on banksduring the ongoing crisis). But the creation of deposit insurance cre-ated a risk of moral hazard for traditional banks, and similarly, implicitgovernment bailout guarantees for institutions that are considered toobig to fail created moral hazard for today’s LCFIs.
The bank-capital regulations of most Western countries follow theterms recommended by the Basel Committee on Banking Supervision(BCBS) of the Bank for International Settlements in Basel, Switzer-land. Under the Basel accords, banks must maintain at least an 8%capital buffer against a risk-adjusted measure of their assets, althoughthere is considerable national discretion in the actual implementationof the Accord. For instance, in the United States the FDIC has inter-preted “at least” 8% to mean 10% if a bank is to be designated “well-capitalized” (a designation that brings certain privileges such as lowerdeposit insurance premiums).
276 The New Banking Model of Manufacturing Tail Risk
The two main forms of “capital,” according to the Basel rules,are equity and retained earnings. Maintaining large capital buffers iscostly from an economic standpoint since debt, especially if short-termand demandable, has market discipline role that cannot be servedby the relatively passive nature of equity financing (Calomiris andKahn, 1991; Diamond and Rajan, 2001). However, even maintainingsocially efficient levels of capital can seem privately costly to bankmanagement if their attention is focused on short-term accountingmeasures of performance such as return on equity (ROE). For instance,the capital can be lent out at risk-free interest rate whereas putting itaway into illiquid and tail-risky assets can generate a carry over andabove the risk-free rate. While the return on both forms of investmentshould be similar on a risk-adjusted basis, the absence of properaccounting of risks in recording of profits can make reducing capital,that is, increasing leverage, highly attractive from the standpoint ofgenerating greater ROE over the next quarter.
As such, in difficult times, if a bank’s capital must be boostedthrough issuing equity shares, it generally signals to investors theadverse news that retained earnings are unlikely to be sufficient to meetthe bank’s capital needs (Myers and Majluf, 1984), and the new equityinjections will dilute the value of existing shares (Myers, 1977) since theprimary benefit of the injections accrues to creditors. It would seem thatsuch costs of capital issuance might discipline banks and induce themto manage capital in a countercyclical manner. However, once decision-making horizons are shortened due to focus on quarterly accountingmeasures of performance with poor risk-adjustment of recorded prof-its, such dynamic and long-term incentives are lost.
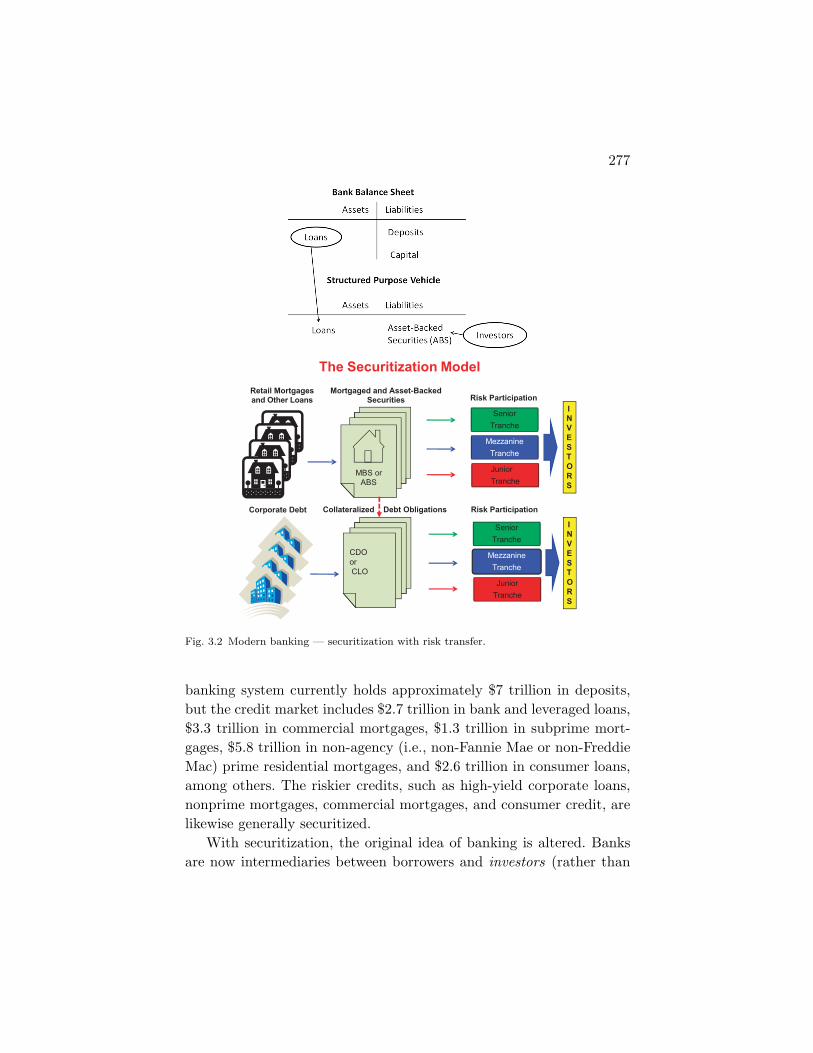
Regardless of the exact nature of this cost, in order to deal withholding costly capital on balance sheet in originating assets, the modelof banking evolved to focus on securitization (Figure 3.2). This allowedbanks to avoid holding costly capital by essentially turning them intounderwriters that continued to originate loans but then sell them offto others. Once loans are removed from a bank’s balance sheet in thisway, the 10% capital reserve need not be held.
Securitization explains the fact that there are far fewer depositsin the modern financial system than there are bank loans. The U.S.
277
The Securitization Model
CDO orCLO
MBS or ABS
Mezzanine
Tranche
Senior
Tranche
Junior
Tranche
Retail Mortgagesand Other Loans
Corporate Debt
Mortgaged and Asset-BackedSecurities Risk Participation
Mezzanine
Tranche
Senior
Tranche
Junior
Tranche
Risk Participation
INVESTORS
INVESTORS
Collateralized Debt Obligations
Fig. 3.2 Modern banking — securitization with risk transfer.
banking system currently holds approximately $7 trillion in deposits,but the credit market includes $2.7 trillion in bank and leveraged loans,$3.3 trillion in commercial mortgages, $1.3 trillion in subprime mort-gages, $5.8 trillion in non-agency (i.e., non-Fannie Mae or non-FreddieMac) prime residential mortgages, and $2.6 trillion in consumer loans,among others. The riskier credits, such as high-yield corporate loans,nonprime mortgages, commercial mortgages, and consumer credit, arelikewise generally securitized.
With securitization, the original idea of banking is altered. Banksare now intermediaries between borrowers and investors (rather than
278 The New Banking Model of Manufacturing Tail Risk
just depositors). To understand how this works, consider the success-ful model of securitizing prime mortgages. This involves pooling primemortgages into mortgage-backed securities (MBSs) that pay their own-ers fractional streams of the interest and principal payments collectivelymade by the mortgage holders. The principal and interest of thesemortgages are guaranteed by Fannie Mae and Freddie Mac. The U.S.residential mortgage market is worth more than $10 trillion. Over 55%of it is securitized, and 64% of these securities are backed by Fannieand Freddie.
Toward the end of 2002, as credit markets began to recover fromthe recession of 2001, banks extended the prime-mortgage securitizationmodel to other, riskier asset classes. This allowed banks to transfer theserisks from their balance sheets to the broader capital market, includingpension funds, hedge funds, mutual funds, insurance companies, andforeign-based institutions.
The new asset-backed securities were “structured,” meaning thatthey divided (for example) mortgage pools into “tranches” accordingto the predicted riskiness of the loans. Holders of shares in the riskiertranches received higher interest payments, but in exchange, they weresubject to losses before the holders of shares in the less-risky tranchessuffered losses. Thus, the holders of the least-risky tranches, as deter-mined by the three rating agencies — Moody’s, Standard and Poor’s,and Fitch — got a lower risk-based interest payment, but they wouldfeel any effect of nonperformance in the structured security only after its“subordinated tranches” had stopped performing (through delinquencyor default). The relatively low risk level of a AAA-rated tranche, how-ever, did not necessarily mean that it was backed by prime loans. Itmight only mean that, of the thousands of nonprime loans in a givenmortgage-backed security, this tranche was designated as the one thatwould continue to throw off income and principal income from perform-ing debts in the entire security until all the other tranches had stoppedperforming.
In order to meet the demand for AAA-rated paper beyond thatavailable from the top tranches of asset-backed securities, the mezza-nine tranches of those structured could be packaged into collateral-ized debt obligations, which in turn could be tranched to create more
Fig. 3.3 Manufacturing CDOs and CDO-squareds.Source: IMF staff estimates.Note: CDO- collateralized debt obligation.
AAA-rated securities, and this could be repeated for the mezzaninetranches of CDOs in the form of CDO-squared issues (Figure 3.3).
The growth in structured securities across Wall Street during 2002–2007 was staggering. While residential mortgage-related securities werecertainly a large component of the total, so too were securities backedby such assets as commercial mortgages, leveraged loans, corporatebonds, and student loans. Figure 3.4 graphs the new issuance of
280 The New Banking Model of Manufacturing Tail Risk
various asset-backed securities during this period. Note that there isan almost threefold increase in new issuance from 2002 to 2007. Inthe aggregate, securitization worldwide went from $767 billion at theend of 2001 to $1.4 trillion in 2004 to $2.7 trillion at the peak of the“bubble”, in December of 2006. By late October 2008, the market hadeffectively collapsed.
It is very clear that the strongest demand for these asset-backedfinancial products came through the creation of “highest quality” —supposed to be essentially riskless — securities, which appealed to ahost of potential investors such as pension funds, insurance funds, andmoney market funds. Interestingly, and crucially for our thesis, how-ever, end investors were not the chief purchasers of these securities,and, in turn, of the underlying risks that were being securitized. Infact, the banks themselves, instead of acting as intermediaries betweenborrowers and investors by transferring the risk from mortgage lendersto the capital market, became primary investors. In addition to nor-mal “pipeline” exposure to assets in the process of origination, secu-ritization and distribution, they took on “warehousing” exposure byholding onto them (see Figure 3.5). Since — unlike a typical pensionfund, fixed income mutual fund, or sovereign wealth fund — banks are
281
Bank Exposure Retention
CDOor ABS
Warehoused Debt
Margin orBack-stop
Unsecuritized debt stays on balance sheet
Senior Tranches
INVESTORS
Fig. 3.5 Warehousing and retention of risks during asset-backed security issuance.
highly leveraged, this investment strategy was exceedingly risky. Thegoal, however, was logical — to create return on equity through thecarry of asset-backed securities and simultaneously avoid minimum-capital regulations.
One of the two principal means for this “regulatory arbitrage” wasthe creation of off-balance-sheet special-purpose vehicles, which heldonto many of the asset-backed securities. These vehicles were generi-cally called “conduits.” Structured investment vehicles (SIVs), whichhave received the most public attention, were one type of conduit.
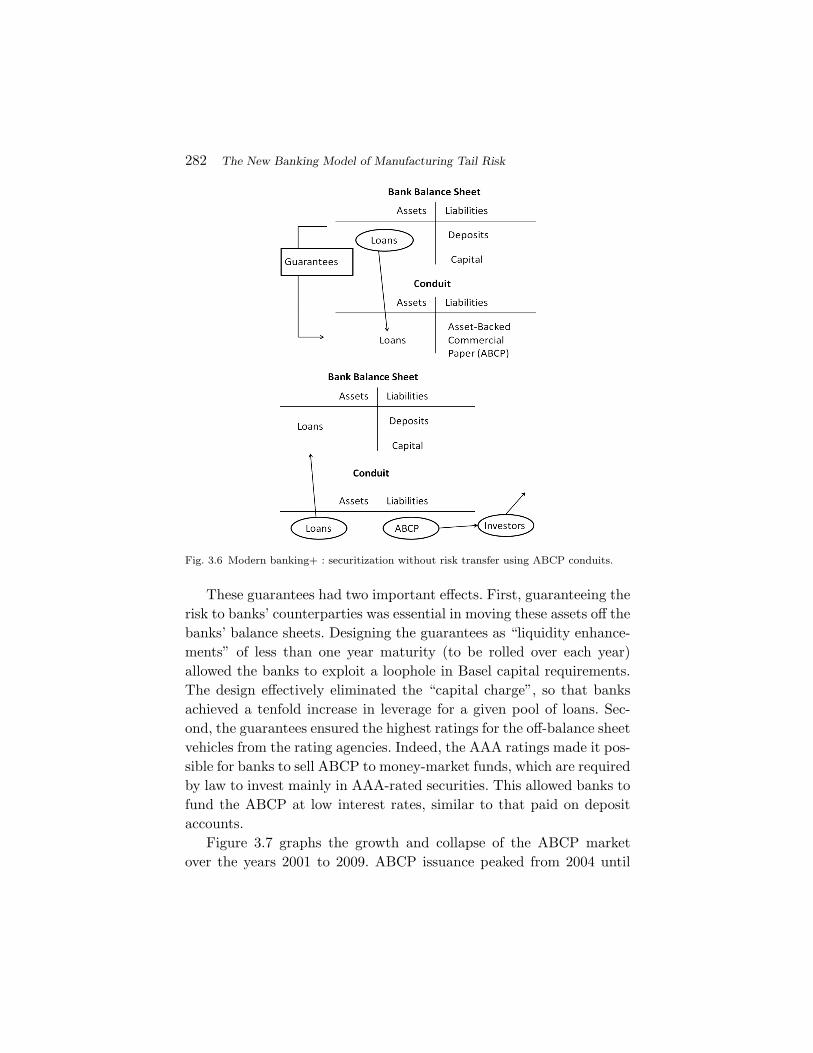
With securitized loans placed in conduits rather than on a bank’sbalance sheet, the bank did not need to maintain capital against them.However, the conduits funded the asset-backed securities by issuingasset-backed commercial paper (ABCP) — short-term debt instru-ments sold in the financial markets, notably to investors in money mar-ket instruments. To be able to sell the ABCP, a bank would have toprovide the buyers, i.e., the banks’ “counterparties,” with guaranteesof the underlying credit — essentially bringing the risk back onto thebanks themselves, even though that risk was not shown on their bal-ance sheets (Acharya and Schnabl, 2009). This “new” banking modelis depicted in Figure 3.6.
282 The New Banking Model of Manufacturing Tail Risk
Fig. 3.6 Modern banking+ : securitization without risk transfer using ABCP conduits.
These guarantees had two important effects. First, guaranteeing therisk to banks’ counterparties was essential in moving these assets off thebanks’ balance sheets. Designing the guarantees as “liquidity enhance-ments” of less than one year maturity (to be rolled over each year)allowed the banks to exploit a loophole in Basel capital requirements.The design effectively eliminated the “capital charge”, so that banksachieved a tenfold increase in leverage for a given pool of loans. Sec-ond, the guarantees ensured the highest ratings for the off-balance sheetvehicles from the rating agencies. Indeed, the AAA ratings made it pos-sible for banks to sell ABCP to money-market funds, which are requiredby law to invest mainly in AAA-rated securities. This allowed banks tofund the ABCP at low interest rates, similar to that paid on depositaccounts.
Figure 3.7 graphs the growth and collapse of the ABCP marketover the years 2001 to 2009. ABCP issuance peaked from 2004 until
283
Fig. 3.7 Asset-backed commercial paper around the financial crisis of 2007–2009.Source: Federal Reserve Board. Data do not include European ABCP.
the second quarter of 2007. When the collapse occurred in the nextquarter, Figure 3.8 shows that the cost of issuing ABCP rose from just15 basis points over the Federal Funds rate to over 100 basis points (atits peak being close to 150 basis points). Consequently the ABCP couldno longer be rolled over, and the banks had to return the loans to theirbalance sheets. Acharya et al. (2009c) show that when the crisis hit, ofthe $1.25 trillion in asset-backed securitized vehicles, only 4.3% of theloss was structured to remain with investors. The remaining loss wipedout significant portions of bank capital and threatened banks’ solvency.
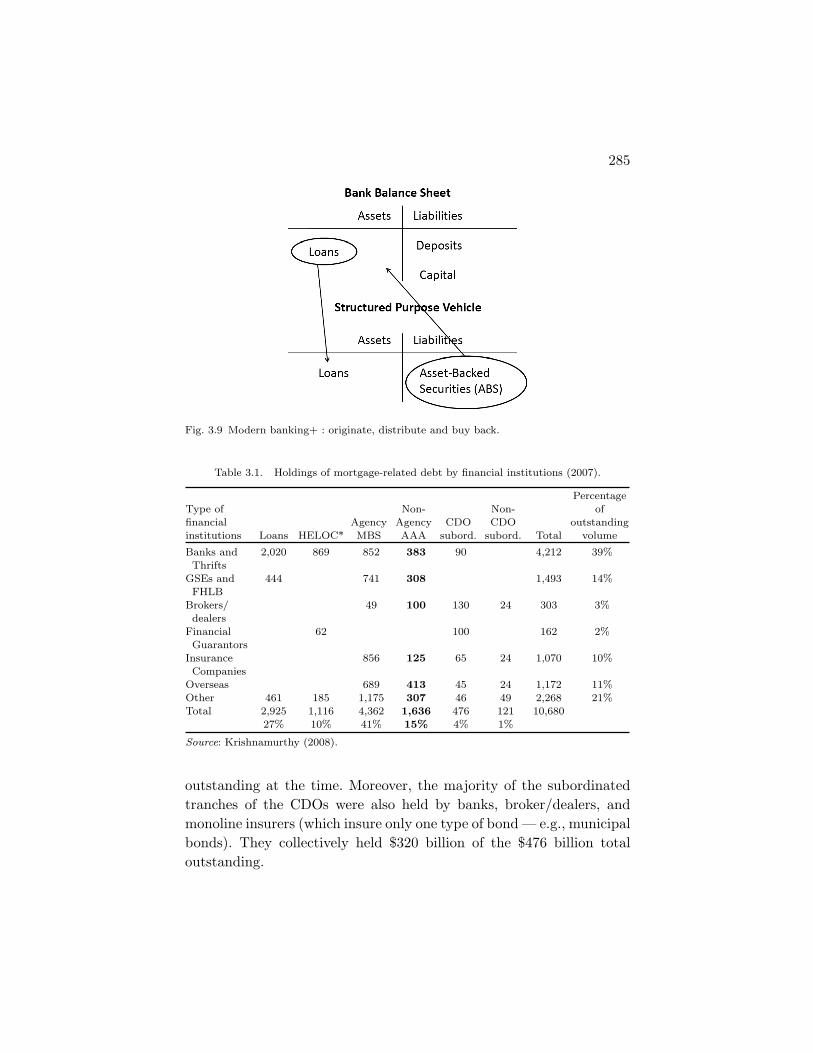
Not all banks followed the conduit model, which financed off-balance-sheet assets through the sales of ABCP. Some chose an alter-native route that had a similar effect. A bank would still make loansand move them from its balance sheet by securitizing them. But asShin (2009) explains, the bank then turned around and reinvested inAAA-rated tranches of the same securitized products they (or otherbanks) had created (Figure 3.9). Because of their AAA ratings, thesesecurities had a significantly lower capital requirement under Basel 2arrangement. For commercial banks, the Basel accord weighted the
284 The New Banking Model of Manufacturing Tail Risk
Fig. 3.8 The behavior of asset-backed commercial paper (ABCP) spread over the Federalfunds rate during 2007.Source: Federal Reserve Board.
risk of AAA-rated securities at half the risk of ordinary commercialor mortgage loans, and thus required an even lower capital reservefor them (20% risk weight compared to 50% for mortgages and 100%for corporate bonds). In 2004, the Securities Exchange Commission(SEC) granted stand-alone American investment banks the ability toemploy internal models to assess credit risk and the corresponding cap-ital charge. This allowed them even higher leverage than commercialbanks, which duly skyrocketed from 22:1 debt to equity ratio to 33:1within just three years.
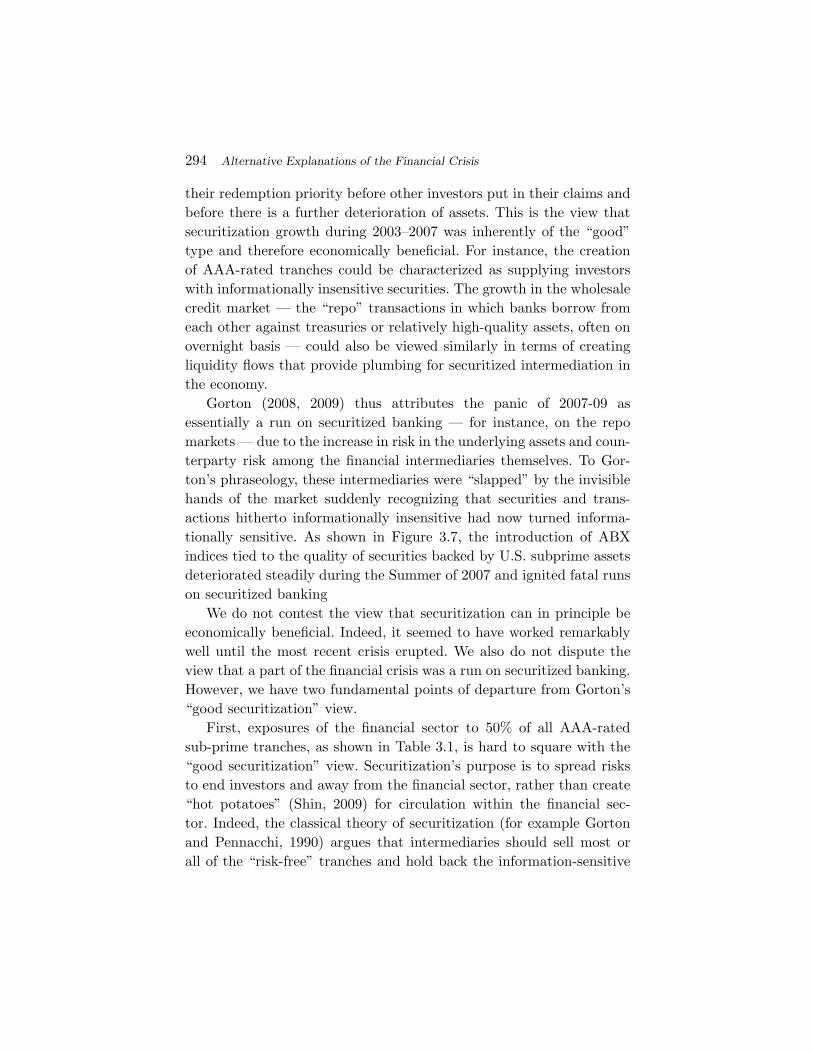
As Table 3.1 shows, banks, GSEs (Fannie and Freddie), and broker/dealers in 2007 held $789 billion of the AAA-rated CDO tranches thatwere backed by nonprime loans, or approximately 50% of the volume
285
Fig. 3.9 Modern banking+ : originate, distribute and buy back.
Table 3.1. Holdings of mortgage-related debt by financial institutions (2007).
outstanding at the time. Moreover, the majority of the subordinatedtranches of the CDOs were also held by banks, broker/dealers, andmonoline insurers (which insure only one type of bond — e.g., municipalbonds). They collectively held $320 billion of the $476 billion totaloutstanding.
286 The New Banking Model of Manufacturing Tail Risk
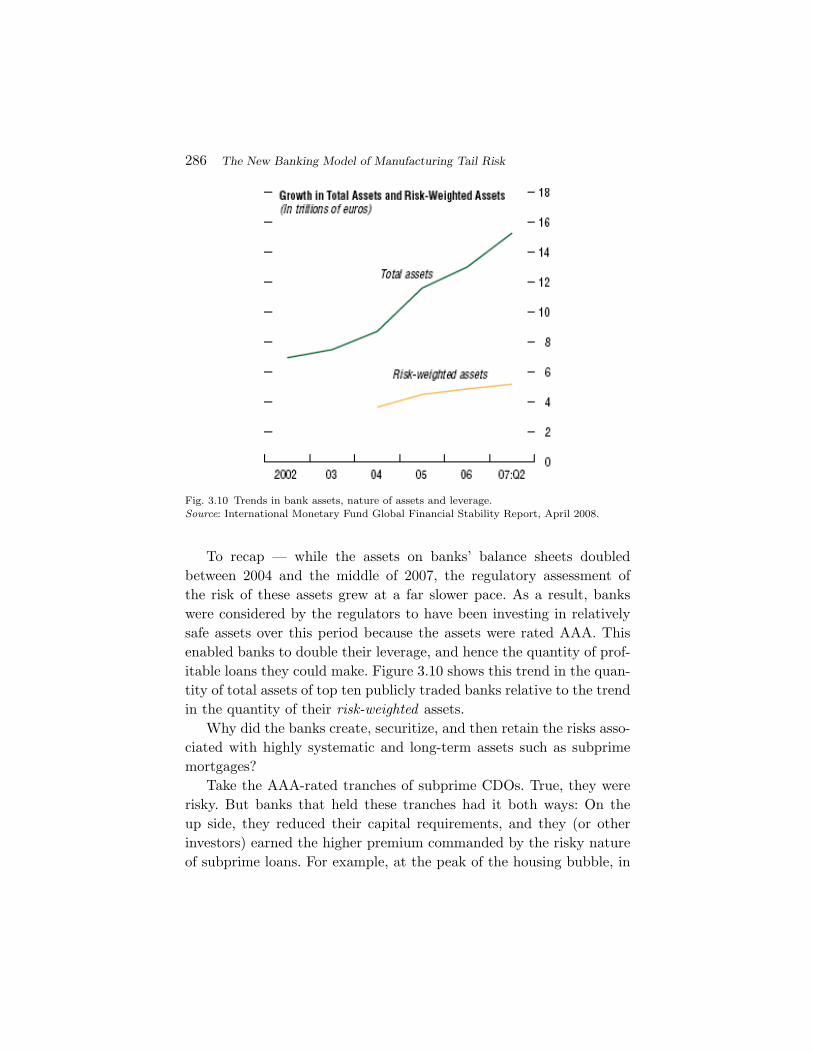
Fig. 3.10 Trends in bank assets, nature of assets and leverage.Source: International Monetary Fund Global Financial Stability Report, April 2008.
To recap — while the assets on banks’ balance sheets doubledbetween 2004 and the middle of 2007, the regulatory assessment ofthe risk of these assets grew at a far slower pace. As a result, bankswere considered by the regulators to have been investing in relativelysafe assets over this period because the assets were rated AAA. Thisenabled banks to double their leverage, and hence the quantity of prof-itable loans they could make. Figure 3.10 shows this trend in the quan-tity of total assets of top ten publicly traded banks relative to the trendin the quantity of their risk-weighted assets.
Why did the banks create, securitize, and then retain the risks asso-ciated with highly systematic and long-term assets such as subprimemortgages?
Take the AAA-rated tranches of subprime CDOs. True, they wererisky. But banks that held these tranches had it both ways: On theup side, they reduced their capital requirements, and they (or otherinvestors) earned the higher premium commanded by the risky natureof subprime loans. For example, at the peak of the housing bubble, in
287
June 2006, even the relatively low-yield AAA-rated tranches of sub-prime CDOs offered twice the premium of the typical AAA creditdefault swap of a corporation. On the down side, losses would onlyoccur if a large number of subprime mortgages got hit at once, inwhich case even the AAA tranche of a CDO got hit. If such a rareevent actually occurred, however, it would almost surely result from aneconomic catastrophe — a systemic shock affecting all markets at thesame time.3 The banks were betting their futures that this would nothappen, or that the decision makers’ time horizons were too short forthem to care if it did happen. Of course, bad things do happen.
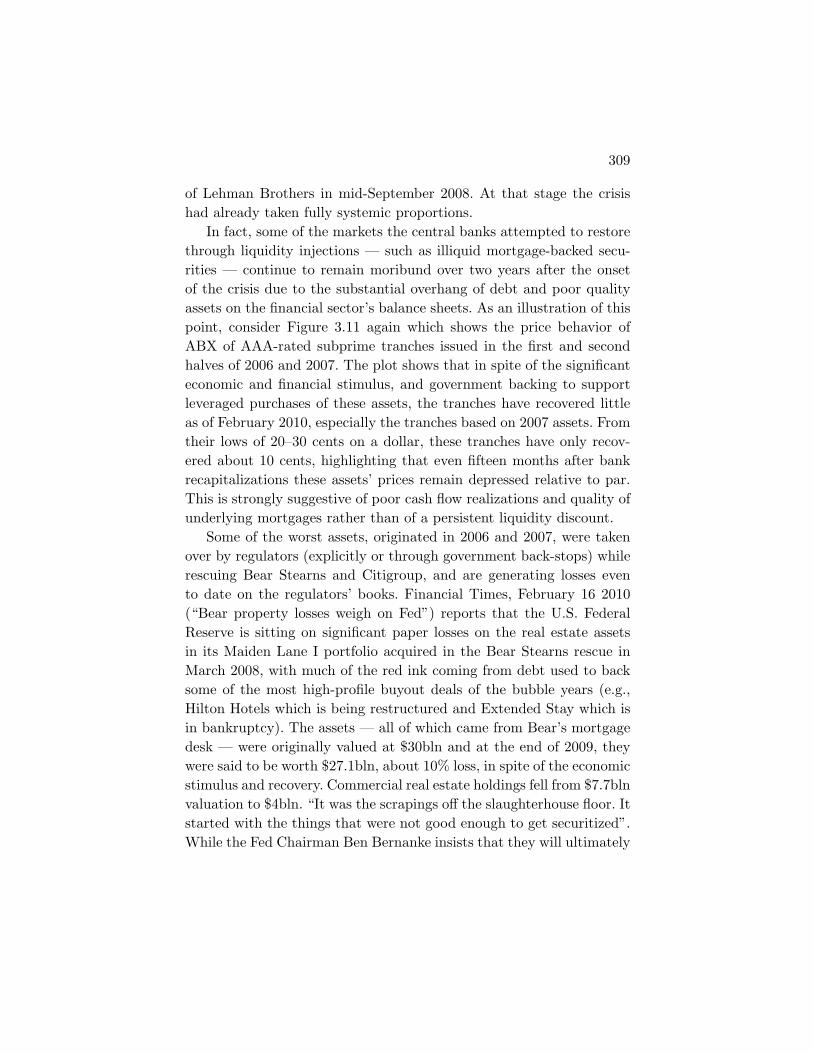
To get some understanding of how hard the systemic shock hit theAAA tranches, of asset-backed securities and their derivatives, Fig-ure 3.11 graphs the various AAA-rated ABX index series from theirinitiation until the end of 2008 — an index of 20 representative CDOsof subprime mortgages. Such indices are initially priced at par, and
Fig. 3.11 Subprime Mortgage AAA-Tranche Pricing (2007–Jan 2010). (Source: Markit).Source: Markit. The Figure tracks the prices, from January 1, 2007 to February 17, 2010 ofthe ABX index of AAA tranches of mortgage-backed securities issued in the first and secondhalves of 2006 and 2007. The ABX index is an index of 20 representative collateralized debtobligations (CDOs) of subprime mortgages. The AAA tranche index represents an initialequally weighted portfolio of the AAA tranches of each CDO.
3 Coval et al. (2008), therefore, call these kinds of tranche products “economic catastrophebonds”.
288 The New Banking Model of Manufacturing Tail Risk
one can see that the 2006 series stayed around that level until late July2007, when the crisis got underway. Depending on the series, the AAAtranches were selling from 20 cents to 80 cents on the dollar as of May2009. Putting aside issues specific to the pricing of the ABX, at the bor-rowing costs shown in Figure 3.8 and given the aforementioned $789billion of exposure, losses to the financial sector at the time rangedfrom $158 to $473 billion on their holdings of the AAA tranches ofmortgage-backed securities alone.
Similarly, the financial firms that used off-balance-sheet conduitshad, through the guarantees they issued on the ABCP, written hugequantities of insurance against a systemic decline in the overall econ-omy, especially in the housing market. In the case of both AAA tranchesand conduits, the guarantees were often provided by third-party insur-ers such as monolines and other insurers. Most prominently AIG, whichalso tried to have it both ways — they collected insurance premia whentimes were good, and would have to honor their promises only whenthere was a systemic decline of markets and the economy.
Effectively, the entire financial sector was riding a massive one-waybet on the economy. Commercial banks, through ABCP guarantees,and investment banks and insurance companies, through AAA-ratedtranches and insurance on the tranches, had set up a way to (1) sell deepout-of-the-money (OTM) options, (2) with sector concentrations pri-marily on housing — a highly systematically risky and long-term asset,and (3) funded with short-term debt finance such as ABCP in case ofconduits set up by commercial banks and unsecured commercial paperin case of investment banks. This intricate structure ensured that bankshad a “carry” — both due to term premium in funding long-term assetswith short-term debt and as a result of the systematic risk imbedded inthe underlying mortgages. This carry can be alternately viewed as theprice obtained by selling OTM options. And in this case, the optionswere structured with the aid of securitization in a way so as to arbi-trage or optimize regulatory capital requirements. In aggregate, bankswere not holding sufficient capital against the contingency that the tailsystemic risk would materialize. The aggregate systemic exposure washair-raising. During the period 2003-2007, banks used an accounting-based notion of profits that did not suitably correct for the long-run risk
289
and return involved in selling OTM options. Consequently, they seemedenormously profitable. Regulatory capital levels seemed remarkablyhealthy. And there was little information on the exact nature of betstaken. Few asked the key question, “why are we so lucky?”
They soon found out with a vengeance when housing prices col-lapsed in 2007, the over-leveraged financial sector experienced a largesolvency shock, and the real economy experienced the most severefinancial crisis since the Great Depression. Specifically, the collapseof the ABCP market in the third quarter of 2007 forced commercialbanks to bring the assets held in their conduits back onto their bal-ance sheets or otherwise support them. This hit banks like Citigroupparticularly hard and consumed Royal Bank of Scotland (which inher-ited the legacy of ABN Amro’s conduits). Investment banks, whichwere not subject to the same capital requirements, held their CDOson their books — but since investment banks, too, were typicallyfunded overnight, they suffered the same maturity mismatch as didthe commercial banks’ off-balance-sheet conduits. By September 2008,investment-banking operations that had loaded up on AAA tranchesof subprime mortgage-backed securities and their derivatives had effec-tively brought down UBS, Bear Stearns, and Lehman Brothers andthreatened Merrill Lynch and Morgan Stanley.
While the post-Lehman phase has been the most difficult periodof the crisis so far, in fact the first signs of the impending crisis canbe traced nearly two years prior, with the bankruptcy of Ownit Solu-tions, a nonbank specialist in subprime and Alt-A (not-quite-prime)mortgages. From that point onward, there was a slow run on othernon-bank nonprime mortgage lenders. Most of their loans were hybrid“2/28” or “3/27” adjustable-rate mortgages. These loans offered a fixed“teaser” rate for the first two or three years, and then adjustable ratesfor the remaining maturity of the mortgage. After the first two or threeyears, the adjustment of rates would be substantial enough to be unaf-fordable for subprime borrowers, so from the beginning the mortgageswere designed to be refinanced. But for the most part, this would bepossible for subprime borrowers only if the collateral on the loan (i.e.,the price of the house) had increased in value. Otherwise, they wouldbe forced into default.
290 The New Banking Model of Manufacturing Tail Risk
Because most of these mortgages were all originated around thesame time, mortgage brokers and lenders had inadvertently created anenvironment that could lead to a systemic wave of defaults if the priceof housing declined two or three years later, when the mortgages werescheduled to reset (Ashcraft and Schuermann, 2008; Gorton, 2008).Once the failure of lenders like Ownit Solutions (and major banks withU.S. sub-prime businesses like HSBC) signaled that this had begun tohappen, the short-term finance available to nonprime lenders dried up,and hundreds of specialists failed. The next wave of the crisis began onAugust 9, 2007, when three investment funds that were part of BNPParibas, the French LCFI, could not determine the mark-to-marketvalues of their securitized investments backed by subprime mortgages.This led to a suspension of redemptions by BNP Paribas, which inturn caused the asset-backed commercial paper market for conduits to“freeze-up.” Purchasers of ABCP suddenly realized that assets backingthe conduits were of such dubious quality that they might have littleor no resale value, especially if they were all hit simultaneously withdelinquencies and defaults (Acharya et al., 2008).
A year later, most of the assets funded by banks through securi-tized markets were hit by the same doubts, which ultimately broughtdown the investment banks that repackaged and warehoused subprimeand other mortgages — as well as corporate, auto, and other loans —into structured securities. The failure of the likes of Bear Stearns andLehman Brothers, which invested heavily in the securities created fromthese mortgages, led to severe counterparty risk concerns that para-lyzed capital markets (and even interbank lending markets) and thuscaused the worldwide recession. Standing behind the mortally woundedwholesale banks was the systemic failure of securitization market, trig-gered by the popping of the overall housing bubble. And this in turnhad been fueled by the ability of these firms, as well as commercialbanks, to finance so much housing stock in the first place. The severityof the resulting recession and its worldwide scope has been magni-fied by the massive decline in lending by commercial banks, includ-ing most of the major names such as BNP Paribas, Citigroup, RoyalBank of Scotland, and UBS, as well as Bank of America, JPMorgan,and others, such as Wachovia, that no longer exist. Contrary to the
291
originate-and-distribute model, it was these same banks that turnedout to be the main credit destinations for the mortgages originated bysubprime lenders.
To summarize the genesis of it all, the root cause of the crisis was thedesire of highly leveraged LCFIs to take even greater risks, generatingeven higher short-term “profits” than those associated with their role asfinancial intermediaries. They managed to do so by financing long-term,systematically risky assets such as mortgages using short-term, oftenovernight, debt. They further enhanced the “carry” by repackaging therisk in such a way as to get around the capital requirements imposed byregulators. This was the “new model” of LCFIs during 2003–2007 — tomanufacture and take on systemic risk or write deep out-of-the-moneyoptions, but do so with little capital on the balance-sheet — whichultimately led to the financial crisis of 2007–2009.
4Alternative Explanations of the Financial Crisis
There is no shortage of proximate causes of the financial crisis. Weconsider each of these in turn, and explain why most of them do notsuffice to explain the spectrum of evidence available on what causedthe financial crisis
1. Moral hazard in the originate-and-distribute model : A commonlymentioned cause of the crisis has been that the originate-and-distributemodel of banking — the securitization model — destroyed incentives ofloan originators, which led to the origination and distribution of poorquality mortgages. The conceptual point goes back at least to the workof Stiglitz (1992). For instance, in the buildup to the most recent crisis,there were mortgages granted to people with little ability to pay themback, and mortgages designed to systemically default or refinance injust a few years, depending on the path of house prices. There wasthe securitization of these mortgages, which allowed credit markets togrow rapidly, but at the cost of some lenders having little “skin inthe game” and in turn contributing to the deterioration in loan qual-ity (Dell’Ariccia et al., 2008; Mian and Sufi, 2008; Berndt and Gupta,2008; Keys et al., 2008). Finally, opaquely structured securitized mort-gages were classified AAA by rating agencies prone to modeling failures
292
293
and possible conflicts of interest between thorough risk assessment andgenerating fee income from security issuers
Perhaps surprisingly, these are not the ultimate reasons for the near-collapse of the financial system. If bad mortgages sold to investors hood-winked by AAA ratings were all there was to it, those investors wouldhave absorbed their losses and the financial system would have movedforward. Although numerous investors would have been burned, thecrash would have been no different, in principle, than the bursting ofthe tech bubble in 2000. In other words, the failure of the originate-and-distribute model might help explain why we saw poor quality mort-gages, but it fails to explain why the mortgage risk ultimately did notleave the financial intermediaries responsible for originating and dis-tributing them.
Since the AAA ratings indicated to investors that these tranches of“asset-backed” investments — collateralized debt obligations (CDOs)and collateralized loan obligations (CLOs) — were as safe as the safestpossible non-sovereign debt instruments, the role of the rating agenciesin this process should not be underestimated (White, 2006). Never-theless, we believe that the rating agencies’ role in marketing asset-backed securities to investors can be overstressed as a factor in the crisisbecause, in fact, investors were not the chief purchasers of these securi-ties — the financial intermediaries or banks themselves were, as shownconvincingly in Table 3.1. To repeat, instead of acting as intermediariesbetween borrowers and investors by transferring the risk from mortgagelenders to the capital market, the banks themselves became primaryinvestors, and so it was not a true originate-and-distribute model thatwas at work but rather the new banking model of “originate-distribute-and-hold”, incurring massive systemic tail risks that ultimately broughtthe financial sector down.
2. Good securitization or bad securitization? Gorton (2008, 2009)provides an explanation of the financial crisis based on the idea thatfinancial intermediation is intrinsically about financial institutions sell-ing risk-free instruments that are essentially informationally insensitiveto investors. However, adverse risks can materialize in the future whichmay make these instruments sensitive to information relating to theunderlying assets, in which case investors “run” in order to enhance
294 Alternative Explanations of the Financial Crisis
their redemption priority before other investors put in their claims andbefore there is a further deterioration of assets. This is the view thatsecuritization growth during 2003–2007 was inherently of the “good”type and therefore economically beneficial. For instance, the creationof AAA-rated tranches could be characterized as supplying investorswith informationally insensitive securities. The growth in the wholesalecredit market — the “repo” transactions in which banks borrow fromeach other against treasuries or relatively high-quality assets, often onovernight basis — could also be viewed similarly in terms of creatingliquidity flows that provide plumbing for securitized intermediation inthe economy.
Gorton (2008, 2009) thus attributes the panic of 2007-09 asessentially a run on securitized banking — for instance, on the repomarkets — due to the increase in risk in the underlying assets and coun-terparty risk among the financial intermediaries themselves. To Gor-ton’s phraseology, these intermediaries were “slapped” by the invisiblehands of the market suddenly recognizing that securities and trans-actions hitherto informationally insensitive had now turned informa-tionally sensitive. As shown in Figure 3.7, the introduction of ABXindices tied to the quality of securities backed by U.S. subprime assetsdeteriorated steadily during the Summer of 2007 and ignited fatal runson securitized banking
We do not contest the view that securitization can in principle beeconomically beneficial. Indeed, it seemed to have worked remarkablywell until the most recent crisis erupted. We also do not dispute theview that a part of the financial crisis was a run on securitized banking.However, we have two fundamental points of departure from Gorton’s“good securitization” view.
First, exposures of the financial sector to 50% of all AAA-ratedsub-prime tranches, as shown in Table 3.1, is hard to square with the“good securitization” view. Securitization’s purpose is to spread risksto end investors and away from the financial sector, rather than create“hot potatoes” (Shin, 2009) for circulation within the financial sec-tor. Indeed, the classical theory of securitization (for example Gortonand Pennacchi, 1990) argues that intermediaries should sell most orall of the “risk-free” tranches and hold back the information-sensitive
295
first-loss tranches, which is what often happened as the securitized sec-tor developed. This is in striking contrast to the securitization modelfinancial intermediaries adopted during 2003–2007, since they them-selves held AAA-rated tranches. In terms used in international trade,they increased their focus on activities where they had a comparativedisadvantage as against the informationally sensitive activities wherethey had a comparative advantage, which makes no sense.
Second, the structure of ABCP conduits can be viewed as poten-tially consistent with the traditional view of securitization. In this view,banks sell guarantees to conduits in order to issue highly rated, short-term ABCP. However, as explained earlier, the guarantees were in fact100% and were un-priced. That is, what happened was “securitiza-tion without risk transfer” (Acharya et al., 2009c) and guarantees werestructured in a way that reduced and effectively eliminated regulatorycapital requirements.
Contrary to this explanation of the crisis, our view is that the growthin securitization during 2003–2007 was primarily of the “bad” type, inthat it was directly contrary to the risk-transfer objective underlyingtraditional forms of securitization, and allowed banks to synthesize sys-temic tail risk without holding much capital against it.
3. Global imbalances: Many analysts of the financial crisis havesingled out huge global imbalances as a primary cause of the crisis.Bernanke (2005) argued in a speech that the “savings glut” in Asia,most notably in China, and several European countries with currentaccount surpluses such as Germany, had created severe and persis-tent global imbalances. These imbalances by and large found their waythrough capital flows into the U.S. economy (Caballero et al., 2008).Importantly, unlike capital flows to emerging markets, a large share ofthese flows was subsequently invested in effectively risk-free assets suchas U.S. treasuries, U.S. agency debt, and money market fund shares.Some observers (for example Caballero and Krishnamurthy, 2009) haveadditionally argued that the appetite of surplus countries for risk-freeassets left the US economy fragile by concentrating the real risks in itsfinancial sector. Portes (2009), for example, recently wrote: “I main-tain that global macroeconomic imbalances are the underlying cause ofthe crisis. . . . The underlying problem in international finance over the
296 Alternative Explanations of the Financial Crisis
past decade has been global imbalances, not greed, poor incentive struc-tures, or weak financial regulation, however egregious and importantthese may be”. Combined, these observations form the global imbalanceexplanation of the financial crisis of 2007–2009.
It is certainly true that much capital has flowed to the United States.The reasons are many: (a) The U.S. dollar’s status as the reserve cur-rency; (b) The depth, liquidity, and relative safety of U.S. financialmarkets; (c) Relative demographic; and (d) Good institutions. TheU.S. current account has been in deficit for 20 years and the size ofthe deficit has averaged more than 4% of GDP for at least ten years.But, it is very difficult to make a causal connection between capitalflows and the financial crisis that is void of reliance on seeking of tailrisks by LCFIs. The financial crisis seems to have arisen primarily dueto this seeking of tail risks with capital flows linked to global imbalanceshaving fueled that fire.
In particular, while global imbalances are clearly central to under-standing the capital flows into the U.S. economy, they fall short inexplaining the financial crisis on two different dimensions. First, theyfail to explain why the risk-free assets — for example, the AAA-ratedsecurities — found their way into the balance sheets of the U.S. finan-cial institutions (as shown in Table 3.1) rather than simply ending upin the asset holdings of surplus countries.
Second, Acharya and Schnabl (2009) explain that the globalimbalances hypothesis does not coincide with the geography of thefinancial crisis — in particular, why the crisis took such a global formright from its inception. Clearly financial institutions in the U.K. andthe U.S., both deficit countries were the hardest hit in the crisis. But,financial institutions in Switzerland (UBS), the Netherlands (ABNAmro), and Germany (WestLB, Deutsch Bank), all surplus countries,were among the hardest hit. UBS was effectively a hedge fund thatlost most of its capital in exposure to AAA-rated tranches of theU.S. subprime assets; ABN AMRO was one of the largest creators ofoff-balance sheet conduits with liquidity guarantee provisions backedby little capital. And indeed, the first banks to collapse in the crisisdue to exposure to ABCP markets were in Germany, a surplus nation.In August 2007, IKB and Sachsen Bank had to be bailed out. These
297
banks had experimented investing in subprime assets in search of anew model following the withdrawal (forced by the European Unioncompetition authorities) of the state guarantees on their liabilities.Thus, simply relying on global imbalances to explain failures in thefinancial sector proves to be grossly inadequate.
Further, many countries with large deficits as a percentage of GDP,such as Australia, Spain, Italy, were unscathed. What was the differ-ence between countries that were hit hard and those that were not?The difference appears to be in the choices the banks and LCFIs madeabout what to take onto their balances sheets and the regulatory sys-tems in place. Acharya and Schnabl (2009) explain for example that inspite of the housing price crash, banks in Spain have been reasonablywell-buffered due to the prudent capital charge applied to off-balancesheet conduits that have recourse to bank balance sheets and reserves-averaging in good times based on past asset growth (that served torestrict asset growth as well as create adequate capital buffers for adownturn affecting the quality of assets).
Figures 4.1 and 4.2 and Table 4.1 help illustrate these points.Table 4.1 in particular shows banks with the top ten exposures toABCP conduits, relative to their equity capitalizations, as of January2007. This can be viewed as the extent of poorly capitalized off-balancesheet assets that banks took on.
Table 4.1 shows that, of the top six banks, three were in surpluscountries (WestLB and Deutsche Bank in Germany, ABN Amro inthe Netherlands) and three were in deficit countries (HBOS in the UK,Societe Generale in France, and Citibank in the United States), with thetop two among these banks being WestLB and HBOS. Figure 4.1 showsthat, indeed, the average measure of ABCP exposure to equity forcountries is unrelated to whether they were surplus or deficit nations,and if anything the relationship is positive. Germany, Belgium, andNetherlands had the highest ABCP to equity exposure for banks inthe period leading up to the crisis. Confirming this, Figure 4.2 showsthat when the ABCP crisis broke out in August 2007, the averageperformance of banks at the country-level was again as bad for surplusnations as for deficit nations.
298 Alternative Explanations of the Financial Crisis
Fig. 4.1 ABCP and global imbalances, weighted by GDP.(Source: Acharya and Schnabl (2009)).This figure shows the correlation between global imbalances, measured as the CurrentAccount Deficit in 2006, and off-balance sheet activity, measured as ABCP as of 1/1/2007relative to country GDP in 2006. The current account deficit data is from the OECD Eco-nomic Outlook. The GDP country data is from the OECD Statistical Database measuredat prices and exchange rates of 2000. The ABCP data is based on Moody’s data and onlyincludes ABCP sponsored by commercial banks.
In short, the financial crisis may have been largely based on dubiousquality of assets in the deficit countries, but there was a great deal ofdirect exposure to ABCP guarantees sold to these assets among banksin surplus countries as well. Any explanation of the financial crisis mustcome to grips with the propensity of the banks in surplus countries tomanufacture tail risk in this manner. Global imbalances help in under-standing the flow of capital across countries, but in a world of integratedfinancial sectors, global banks of surplus countries can themselves beexposed if they are poorly regulated and have incentives to take onassets of poor quality (being financed elsewhere by the imbalances).
299
Fig. 4.2 Stock returns and ABCP from July 2007 to July 2008, by country.(Source: Acharya and Schnabl (2009)).This figure shows the correlation between global imbalances, measured as the CurrentAccount Deficit in 2006, and off-balance sheet activity, measured as the asset-weightedABCP as of 1/1/2007 relative to equity per country. The current account deficit data isfrom the OECD Economic Outlook. The GDP country data is from the OECD Statisti-cal Database measured at prices and exchange rates of 2000. The ABCP data is based onMoody’s data and only includes ABCP sponsored by commercial banks.
Obstfeld and Rogoff (2009) present a more nuanced view that boththe perpetuation of global imbalances and the occurrence of the finan-cial crisis have common roots in loose monetary policies in the UnitedStates (and China’s ability to maintain an underpriced currency), asdiscussed below. Note, however, that this common explanation — theloose monetary policy in the United States — fails in explaining thegeography of the financial crisis, as outlined in Figures 4.1 and 4.2 andTable 4.1.
4. Mis-pricing of risk: The “false” belief in the Great Moderationand the “animal spirits”: Akerlof and Shiller (2009) present perhaps themost authoritative endorsement of the view that there were strong psy-chological forces that led to the current financial crisis. They attribute
300 Alternative Explanations of the Financial Crisis
Table 4.1. Ten largest ABCP sponsors and their off-balance sheet leveragerelative to equity.
the crisis both to the blind faith in ever-rising house prices and corre-spondingly plummeting faith in capital markets once the house pricescrashed. There was certainly a widely shared view among macroe-conomists in the decade prior to the crisis that a so-called “GreatModeration” had become established, a period with a genuine fall inmacroeconomic volatility due to development of global capital marketsand the risk-sharing that it provided (Stock and Watson, 2002). Thiswas reflected in a downward revision of asset price volatility as shownin Figure 4.3 for levels of VIX, a measure of market volatility impliedfrom short-term (30-day) option prices on the S&P 500 stock index.VIX typically ranged above 20% per annum prior to 2003, but almostalways remained between 10% and 20% until the Summer of 2007.Within two years, it had jumped to an unprecedented level of 80%.
Akerlof and Shiller (2009) and other proponents of behavioral expla-nations of the financial crisis attribute the housing and the creditmarket boom to a misplaced faith in a permanent downward shiftin volatility, or to markets in general being excessively euphoric ingood times and failing to impose sufficient discipline on risk-takers.In other words, the behavioral view of the financial crisis is simplythat risks were mispriced and markets ignored early-warning signalsthat the housing market and the economy were overheated, fueling theboom instead through extraordinary valuations attached to both creditand equity instruments.
301
Fig. 4.3 Behavior of VIX, the option-implied measure of volatility during 2000–2009.(Source: Chicago Board Options Exchange).
HY Bond YTM Spread (1978-2008)
0.00
2.00
4.00
6.00
8.00
10.00
12.00
14.00
16.00
18.00
20.00
1978
1979
1980
1981
1982
1983
1984
1985
1986
1987
1988
1989
1990
1991
1992
1993
1994
1995
1996
1997
1998
1999
2000
2001
2002
2003
2004
2005
2006
2007
2008
Year
Sp
read
Fig. 4.4 Historical high yield bond spreads (1978–2008).Source: Salomon Center, Stern School of Business, NYU.
Such a view is not entirely unwarranted. Figure 4.4, for instance,graphs the high-yield bond spread over Treasuries on an annual basisover the period 1978–2008. The lowest point in the graph, from June 1,2006 onwards (not visible due to the annual nature of the data), is 260
302 Alternative Explanations of the Financial Crisis
basis points on June 12th 2007. This is remarkably close to the start ofthe crisis, indeed, just a few of weeks before Bear Stearn’ hedge fundsthat invested in sub-prime securities ran into problems. As the graphshows, the high-yield bond spread was essentially hovering around itshistorical lows for most of 2004–2007, when the risks were in fact risingin the financial sector of the economy. Again, within two years, thisspread jumped to the historic high of 1,800 basis points.
So why does the behavioral explanation fall short in explaining thisparticular episode? Note that housing assets cannot be easily short-sold. That is, a speculator wanting to express a negative view on thehousing market cannot do so easily. Indeed, this became possible onlya year prior to the crisis through development of trading in protectionproducts on (ABX) indices linked to prices of asset-backed securities.Consequently, housing booms and busts are by and large a functionof availability of credit in the economy. When there is a credit boom,housing prices rise substantially; and when there is a credit contraction,housing prices decline. It is imperative for the behavioral explanationto come to terms with reasons for and consequences of the credit boomand bust.
As explained in Section 3, the financial sector had undertaken highlysophisticated structures in order to buy mortgages from originators,securitize them, partly sell them, and hold the rest. If their own accessto credit was very inexpensive or if they simply mispriced the risk ofa housing crash, there would have been no need to increase their ownleverage in funding the tremendous creation of housing finance thatoccurred. The financial sector had to simply expand its asset-base,and capital was readily available to do so (at abnormally low costsunder the null of the behavioral hypothesis). But asset expansion wasnot simply a scaling-up of balance sheets. Instead, the asset expansionwas associated with a rise in the leverage of financial institutions, inparticular through design of clever guarantees sold to ABCP conduitsand slicing and dicing of risks to create AAA-rated tranches, which inturn helped reduce capital requirements. Consequently, the picture thatemerges from the evidence in Section 3 is one of a financial sector eagerto take on excessive leverage even in a world where equity capital waseasily available. Furthermore, there is something internally inconsistent
303
about bankers getting it all wrong as far as price of risk is concernedand yet getting it all right as far as reduction of capital requirementsis concerned.
Finally, the leverage undertaken by the financial sector was essen-tially reflective of a severe short-term bias. Again, as explained inSection 3, the leverage was constructed primarily through issuance ofshort-term asset-backed commercial paper (for commercial banks) orunsecured commercial paper (for investment banks). Since investors insuch paper have the right to “run” on the issuing conduits or investmentbanks, the pricing of such debt is naturally dependent on short-termmeasures of volatility. Banks sponsoring conduits or holding the under-lying long-term assets are, however, subject to short-term volatility. Inparticular, if risk rises, the short-term paper may not be rolled overand the shortfall would have to be met by bank capital. Since the risk-taking model of modern banking during 2004–2007 was built aroundconstructing short-term carry and paying it out as profits, the long-runrisks were ultimately ignored also by bank managers and their boards.
Figure 4.5 shows that the ratio of two-year implied volatility fromS&P 500 option prices was on average 30–40% higher than the short-term one-month volatility over the period 2Q 2005–2Q 2007. Thisupward sloping term-structure of volatility is typical during boom peri-ods, when short-term volatility is low and long-term volatility is high,and inverts itself during stress times (as can be seen in the figure afterthe onset of the crisis). As noted by Engle (2009), long-run volatilityshould incorporate the possibility that the level of risk may change overtime — that is, rise from the current levels in boom times. This wasindeed the case with market-observed long-term volatility. Hence, it ismore likely that the financial sector at large ignored the long-term risksbecause it had incentives to do so, as discussed below.
All of this still begs the question why there were such abrupt shiftsin the market price of risk when the crisis took hold in August 2007.We conjecture that since most risks undertaken by the banking sec-tor were through opaque over-the-counter and off-balance sheet posi-tions, investors did not have the relevant information that disclosedregulatory capital levels of banks did not mean what they implied.When its hedge funds invested in sub-prime assets had to be bailed out
304 Alternative Explanations of the Financial Crisis
-0.6
-0.4
-0.2
0
0.2
0.4
0.6
0.8
5/1
8/2
00
5
9/1
8/2
00
5
1/1
8/2
00
6
5/1
8/2
00
6
9/1
8/2
00
6
1/1
8/2
00
7
5/1
8/2
00
7
9/1
8/2
00
7
1/1
8/2
00
8
5/1
8/2
00
8
9/1
8/2
00
8
1/1
8/2
00
9
5/1
8/2
00
9
9/1
8/2
00
9
Series1
Fig. 4.5 Ratio of two-year at-the-money (ATM) S&P 500 implied volatility to one-monthATM volatility, i.e., σ2yr/σ1mth − 1(Source: Bloomberg).
by Bear Stearns, and BNP Paribas’ hedge funds suspended redemp-tions on August 8 2007, the absence of a market for selling sub-primeasset-backed securities made it clear to investors that the entire finan-cial sector had taken a one-way bet on the economy. Since that day,markets have in fact been right about most failures (of the shadowbanking world, leveraged hedge funds, Bear Stearns, Lehman Broth-ers, Wachovia, Washington Mutual, etc.) with the exception of A.I.G.,whose collapse and rescue in September 2008 was a surprise to mostobservers. We conjecture that market’s failure in picking up AIG’s woeswas most likely due to opacity arising from the completely over-the-counter (and thus, largely unregulated and often undisclosed) natureof its credit default swap positions. Regulatory arbitrage exposes mar-kets to unexpected outcomes, and most likely played a destabilizingrole during 2004–2009. It ultimately compromised market discipline ingood times (2004–2Q 2007) producing low cost of credit, so that thecorrection that took hold on the release of hidden information (3Q2007–2009) had to be larger and more severe.
5. The Greenspan “put”: An important reason why asset-pricingbubbles may arise (even in the absence of “animal spirits”) is due to therisk-shifting problem of leveraged households and financial institutions,coupled with the so-called “Greenspan put” — that when asset prices
305
(such as house prices) decline, interest rates will be lowered by thecentral bank. An expected future reduction of interest rates will tendto raise asset prices, exacerbating the risk-shifting problem associatedwith the limited liability option in leveraged financing of assets. Allenand Gale (2000) explain in a simple model that if borrowing costs areinsensitive to risks (e.g., due to government guarantees or opacity),then asset-pricing bubbles arising due to loose monetary policy can, inthe limit, be explosive in nature. Taylor (2009) argues that the counter-factual interest rates based on the “Taylor rule” during the period 2002–2005 far exceeded the low interest rates adopted by the U.S. FederalReserve after the recession of 2001–2002 (see Figure 4.6). Taylor alsoshows that under this counterfactual, the housing price boom and bustthat developed would probably not have materialized — “no boom, nobust”. Obstfeld and Rogoff (2009) couple the loose monetary policyargument with global imbalances, implying that low interest rates inthe United States allowed it to continue with its foreign borrowing atlow rates to maintain its macroeconomic imbalances and avoid toughpolicy decisions concerning the fiscal deficit.
By and large, the role played by loose monetary policy in fuelingthe housing price bubble is hard to dispute. Indeed, U.S. monetary
Fig. 4.6 Loose monetary policy of the United States (The Economist, 18 October 2007).
306 Alternative Explanations of the Financial Crisis
policy kept borrowing rates low not just for the households but alsofor the financial sector. Importantly, it made it attractive for banksfrom outside of the United States to borrow in U.S. dollars and fundasset purchases in the United States (Acharya and Schnabl, 2009). Thisdoes not necessarily explain why we ended up with a full-blown bankingcrisis, however. As we have stressed earlier, had the banks and LCFIstransferred the assets they created by lending down the quality curve —mainly sub-prime mortgages — on to end investors, even the largenegative shock arising due to popping of the housing bubble would nothave resulted in a significant financial crisis. Consequently, we viewloose monetary policy during 2002–2005 as a primary candidate forsowing seeds of the economic crisis in the United States, whereas the tailrisk-seeking, regulatory arbitrage motives of the LCFIs as the primaryexplanation for the financial crisis.
6. Liquidity crisis or solvency crisis? Finally, we consider the clas-sic debate whether financial crises occur due to liquidity or solvencyproblems, in the context of this crisis. Allen and Gale (2007) build aseries of economic models of financial crises in which depositors runon banks following the arrival of some adverse news about bank assetquality. The inability of banks to liquidate long-term assets at their fairvalues plays a crucial role in precipitating the crisis. Specifically, if themarket among buyers of assets is segmented, or if there is not sufficientarbitrage capital set aside for asset purchases, then liquidation valuesreflect available cash in the market — Allen and Gale call this “cash-in-the-market” pricing — rather than fundamental values. In turn, thelikelihood of such liquidations causes all depositors to run at once, sincethere will not be much long-run value in assets left post-liquidations.In other words, liquidity problems in the market for assets exacerbatethe problem caused by adverse news about those assets.
Figure 4.7 shows that the market indeed had adverse informationabout asset quality. The figure graphs the demeaned value of the ratioof the Office of Federal Housing Enterprise Oversight (OFHEO) repeat-sale house price index to the Bureau of Labor Statistics (BLS) shelterindex (i.e., gross rent plus utilities components of the CPI). Becauseof de-meaning, the average value of this ratio is zero. As is clear that
307
-0.15
-0.1
-0.05
0
0.05
0.1
0.15
0.2
0.25
0.3
0.35
Ma
r-7
5
Ma
r-7
8
Ma
r-8
1
Ma
r-8
4
Ma
r-8
7
Ma
r-9
0
Ma
r-9
3
Ma
r-9
6
Ma
r-9
9
Ma
r-0
2
Ma
r-0
5
Ma
r-0
8
Fig. 4.7 House price to rent ratio (1975–2008).Source: Own calculations, OFHEO, BLS.
$165
$22$7
$20
$107
$28
$93$145?(2)
$62
$0
$50
$100
$150
$200
19 85 2005 Today?
Median Consumer Debt
Median Outstanding Mortgage
Median Home Value
Household Debt/Median Home Value(1) 56 % 68% 89%
($00
0s)
per
Ow
ner
Occ
upie
d H
ome
Fig. 4.8 Household debt/home values (1985, 2005, 2008).Source: U.S. Census Bureau, Federal Reserve Flow of Funds, S&P Case-Shiller Index.
the peak is reached in 2006 at a value of 0.3 but thereafter the ratiodeclines sharply. Thus, prior to outbreak of the crisis in Summer of2007, there was certainly credible adverse evidence about the value ofthe underlying housing assets (see also Figure 3.11 on the time-seriesof ABX indices).
What made the housing price shock primarily a solvency issue wasthe high leverage in both the household sector and the financial sector.Figure 4.8 graphs estimates of household debt over home values of themedian household. The median value of outstanding mortgage principal
308 Alternative Explanations of the Financial Crisis
amount of owner-occupied units and the consumer credit per householdwas derived from the U.S. Census Bureau and Federal Reserve Flow ofFunds, and the 2008 median home value was adjusted from the 2005fourth quarter value using the Case-Shiller National Home Price Index.The ratio of household debt to home values stood at a remarkable 89%in 2008 compared to just 68% in 2005, and 56% twenty years earlier, in1985. Similarly, Table 3.1 showed that the financial sector was likewisesignificantly exposed to housing values.
So right from its inception, the financial crisis of 2007–2009 appearsto have been a crisis of solvency not just for the household sector butalso for the financial sector. It is indeed the case that when a largenumber of economic agents de-lever at once, market prices will reflectliquidity discounts (Allen and Gale, 2007) and short-term creditors will“run” as debt capacity of assets deteriorates due to the market-drivendiscounts (Acharya et al., 2008). Nevertheless, the primary cause ofboth of these problems is the need to de-lever and the fact that theleveraged agents are all on the same side of the trade. We thereforebelieve that the “liquidity problems” witnessed in this crisis, whileclearly a symptom of some market segmentation and mark-to-markettreatment in regulatory capital buffers of banks, they ultimately wereconnected to at least some solvency problems.
The root cause of the crisis as a solvency problem of households andthe financial sector is perhaps one explanation for why the highly inno-vative liquidity injection facilities created by the Federal Reserve (andother Central Banks) in its lender-of-last-resort function did not ulti-mately succeed in stemming the crisis. Between Fall 2007 and December2008, the Federal Reserve effectively created backstop facilities for mostkinds of assets that experienced stress in the crisis; it provided longer-term lending facilities against the highest-quality collateral, extendeddiscount window to securities firms and investment banks, lent againsthigh-quality illiquid asset-backed securities, lent for purchases of ABCPand unsecured CP, provided liquidity to money market funds, and pur-chased assets of the GSE’s. These were liquidity-targeted measures,and were unlikely to save the day if the underlying problem was insol-vency. Indeed, any balance-sheet restructuring or solvency stress testsoccurred only after fourteen months into the crisis, following the failure
309
of Lehman Brothers in mid-September 2008. At that stage the crisishad already taken fully systemic proportions.
In fact, some of the markets the central banks attempted to restorethrough liquidity injections — such as illiquid mortgage-backed secu-rities — continue to remain moribund over two years after the onsetof the crisis due to the substantial overhang of debt and poor qualityassets on the financial sector’s balance sheets. As an illustration of thispoint, consider Figure 3.11 again which shows the price behavior ofABX of AAA-rated subprime tranches issued in the first and secondhalves of 2006 and 2007. The plot shows that in spite of the significanteconomic and financial stimulus, and government backing to supportleveraged purchases of these assets, the tranches have recovered littleas of February 2010, especially the tranches based on 2007 assets. Fromtheir lows of 20–30 cents on a dollar, these tranches have only recov-ered about 10 cents, highlighting that even fifteen months after bankrecapitalizations these assets’ prices remain depressed relative to par.This is strongly suggestive of poor cash flow realizations and quality ofunderlying mortgages rather than of a persistent liquidity discount.
Some of the worst assets, originated in 2006 and 2007, were takenover by regulators (explicitly or through government back-stops) whilerescuing Bear Stearns and Citigroup, and are generating losses evento date on the regulators’ books. Financial Times, February 16 2010(“Bear property losses weigh on Fed”) reports that the U.S. FederalReserve is sitting on significant paper losses on the real estate assetsin its Maiden Lane I portfolio acquired in the Bear Stearns rescue inMarch 2008, with much of the red ink coming from debt used to backsome of the most high-profile buyout deals of the bubble years (e.g.,Hilton Hotels which is being restructured and Extended Stay which isin bankruptcy). The assets — all of which came from Bear’s mortgagedesk — were originally valued at $30bln and at the end of 2009, theywere said to be worth $27.1bln, about 10% loss, in spite of the economicstimulus and recovery. Commercial real estate holdings fell from $7.7blnvaluation to $4bln. “It was the scrapings off the slaughterhouse floor. Itstarted with the things that were not good enough to get securitized”.While the Fed Chairman Ben Bernanke insists that they will ultimately
310 Alternative Explanations of the Financial Crisis
not make losses on these portfolios, the temporary valuations of theseassets have not yet rebounded, suggesting that the worst assets mightbe sitting in regulatory balance sheets, masking the true profitabilityof the banking sector portfolio from pre-Lehman days.
5Conclusion
We have argued in this essay that there was a fundamental shift inthe business model of large, complex financial institutions during theperiod of 2003–2Q 2007. This new business model led to their “manu-facturing” tail risks that were systemic in nature. This involved, interalia, selling deep out-of-the-money guarantees to off-balance sheet vehi-cles and holding little capital against them, or warehousing AAA-ratedtranches of subprime mortgage-backed assets and financing their pur-chase with deposits and short-term commercial paper. They did thiswithout sufficient capital to back the associated market, credit, andliquidity risk exposures. We conclude that the propensity of LCFIs totake on these risk exposures reflected an overriding risk-shifting incen-tive. The specific forms of this involved the use of complex innovationsto arbitrage regulatory capital requirements.
While conclusive empirical evidence explaining the cause of sucha shift in the banking model is worth pursuing, the history of bankregulation and the dynamics of the financial intermediation businessitself suggest that there are several contributing factors. These include(a) increased competition which has eroded the profit margins in thetraditional banking model and thus the “franchise value” of banks,
311
312 Conclusion
(b) explicit or implicit provision of government guarantees withoutappropriate charges or fees for the insurance cover implied and withoutring-fencing of guarantees for the originally intended purposes, and (c)a passive regulatory stance toward the arbitrage of capital requirementson the part of the financial intermediaries themselves. The erosion offranchise values made it attractive for LCFIs to increase leverage. Mis-priced government guarantees and lack of ring-fencing meant that tailrisks could be manufactured without affecting the cost of funding. Thelax enforcement of capital requirements allowed these tail risks to beretained on- or off-their balance sheets. Macroeconomic factors suchas low interest rates in the United States and large capital flows intotrade-deficit countries such as the United States and the United King-dom undoubtedly amplified the inherent propensity for seeking tail-riskin the financial sector.
Our recommendations in Acharya et al. (2010a,b) for reformingfinancial sector regulation directly address some of these underlyingdrivers. Below we provide a brief summary of our proposals:
First, systemic financial intermediaries like LCFIs must be chargedfees (effectively insurance premiums) commensurate with the explicitor implicit government insurance they enjoy on a continuous basis, andnot just when resolution funds have been depleted in crisis situations.These insurance premiums would be explicitly linked to their overallrisk profiles and insured deposit base — as well as to their total leveragegiven the likelihood of ex-post forbearance when large players fail.
Second, there should be an additional fee or premium that is tiedspecifically to the systemic risk of banks and other LCFIs given thereality that systemic failures are associated not just with ex-post for-bearance but also with significant negative externalities bearing on therest of the financial sector and the real economy. While systemic riskis difficult to quantify, a start needs to be made in this direction.
Third, it must be recognized that charging of such fees or insur-ance premiums depends inherently on the regulatory assessment ofrisk. Even with market-based data and good supervisory intelligence,macro-prudential risk assessment might well be imperfect, since thereare always internal issues related to capital and risk allocations whoseconsequences are not fully reflected or visible, even at the level of their
313
own boards and much less to outside stakeholders. To this end, somediscipline that is based on realized outcomes is necessary. This mightbe some type of “contingent capital” that could for example take theform of debt that automatically converts into equity when bad firm-level or systemic states materialize. There are plenty of alternatives ofthis nature that could be helpful.
Finally, it is worth considering — whether by regulatory fiat orthrough appropriate capital charges — if a form of functional separationor carve-outs needs to be enforced, as is being advocated, by PaulVolcker, Mervyn King, and others who are deeply skeptical about theefficacy of finely tuned regulation of financial firms that have time andagain proven their skill at regulatory avoidance and arbitrage. Thisseparation would carve out the traditional banking and intermediationactivities of lending and underwriting from the more risk-prone activityof proprietary trading or effectively running an in-house hedge fund,which are the likely “manufacturing” centers for tail risk and systemicinstability. Enforcing or inducing a separation of this type might wellerode some economies of scope between hedging and trading activitiesat banks and other LCFIs. In return, it could render more tractable theimmense moral hazard problem arising from accordance of governmentguarantees and the inevitable opacity and complexity associated withfinancial innovations aimed at exploiting loopholes and underminingsystemic safety and soundness. Functional separation may well be asmall price to pay for enhanced robustness of the financial system.
AAppendix: Tail Risk in the Rest of the World
Over the years there has been a great deal of debate about the rela-tive properties of alternative financial systems around the world: Howdo they differ from one another, and how do they compare in achiev-ing what financial systems are supposed to achieve in terms of thepublic interest — an optimum combination of efficiency, innovation,and global competitiveness, balanced against stability and robustness?Financial systems do indeed differ widely among national financial sys-tems in terms of the role of universal banks and financial conglomerates,specialized financial intermediaries of various kinds, government-ownedand hybrid financial services providers, financial cooperatives, and thelike. The financial crisis of 2007–2009 provides an unusual opportunityto perform a robustness check into the resilience of financial systemsin terms of their inherent fragility, propagation of financial shocks, andtheir transmission to the real sector of the economies.
The available date on write-downs of impaired assets that are at thecenter of the crisis suggest that non-U.S. financial intermediaries wereas involved as their U.S. competitors in taking losses (Exhibit 1). By theend of 2006 and the onset of the crisis, a small number of non-US bankshad pushed into the upper brackets of the fixed-income origination
314
Appendix: Tail Risk in the Rest of the World 315
Exhibit 1. Exposure Write-Downs and CapitalRaised (in billion dollars) as of October 2009.
Firm Loss Capital
Wachovia Corporation 101.9 11Citigroup Inc. 88.3 109.3Merrill Lynch & Co 55.9 29.9UBS AG 50.6 32.9Washington Mutual Inc. 45.3 12.1Bank of America Corp. 42.7 78.5HSBC Holdings Plc 42.2 23.5JPMorgan Chase & Co 33.3 44.7HBOS Plc 25.7 22.4National City Corp. 25.2 8.9Wells Fargo & Company 23.4 41.8Morgan Stanley 21.5 24.6Royal Bank of Scotland 20.7 48.5Deutsche Bank AG 16.4 5.9Lehman Brothers Holdings 16.2 13.9Bayerische Landesbank 16.1 20Credit Suisse Group AG 15.8 11.9Barclays Plc 14.2 26.8ING Groep N.V. 14 19.4IKB Deutsche Industries 13.9 11.4Societe Generale 8.9 11.1Fortis 8.9 21.7Credit Agricole S.A. 7.7 12Natixis 7.7 7.8BNP Paribas 7.6 3.4Mizuho Financial Group 7.5 8.2Canadian Imperial Bank 7.3 2.5PNC Financial Service 7.2 8.1Goldman Sachs Group 7.1 20.5DZ Bank AG 7 0Dexia SA 6.2 8.6KBC Groep NV 6.2 7.4SunTrust Banks Inc 6.1 4.9UniCredit SpA 6 10.1Bank of China Ltd 5.9 0Other Asian Banks 5.5 16.9Other European Banks 5.5 4.5Hypo Real Estate Holdings 5.4 0Indymac Bancorp 5.2 0
Source: Bloomberg
league tables — notably Deutsche Bank AG, UBS AG, and CreditSuisse. As the volume of fixed-income originations shifted to asset-backed securities (ABS) and mortgage-backed securities (MBS) as wellas collateralized debt obligations (CDOs) and related instruments, one
316 Appendix: Tail Risk in the Rest of the World
would expect these firms to have also taken on “pipeline” exposures tothese instruments comparable to American firms like Merrill Lynch andCitigroup. The incentive for these non-U.S. wholesale intermediaries —all of whom are universal banks or financial conglomerates — to investin these securities and assume warehouse risk exposures would havebeen the same as for the U.S. firms. In fact, in some cases such asUBS the incentive could have been even greater due to the abnormallylow cost of funds attributable to the large private banking divisions.Consequently, as confirmed by Exhibit 1, in the losses taken by the bigwholesale financial intermediaries as of late-2009 the major Europeanplayers featured no less than their American rivals.
Beyond the key originators and intermediaries were the banks thatengaged minimally in the intermediation process but principally tookon the role of investors in what ultimately became damaged assets.Again, Exhibit 1 shows that over half of the top fifty losers were
Exhibit 2Source: IMF staff estimates.1Includes Denmark, Iceland, Norway, Sweden, and Switzerland.2Includes Australia, Hong Kong SAR, Japan, New Zealand, and Singapore.
Appendix: Tail Risk in the Rest of the World 317
Exhibit 3(Source: International Monetary Fund, Global Financial Stability Report, April 2009)Keefe, Bruyette & Woods
non-U.S. banks. A number of these (most notably, ABN AMRO, HBOS,and IKB) had set up off-balance sheet vehicles (conduits and SIVs) toavoid the capital requirements associated with this exposure. NorthernRock that collapsed in September 2008 in the United Kingdom wasalso heavily reliant on wholesale asset-backed paper and had grown itsmortgage book multifold with little growth in retail deposit base. Whenthe crisis hit, these banks took large losses (in some cases arguablylarger than indicated due to less conservative marks as to their value)and could not roll over their leverage as they had arranged little cap-ital buffer to guard against the underlying credit and rollover risks.Exhibit 2 shows the IMF’s estimates of the magnitude of those lossesrealized as of 2009 (Q2) and the expected write-downs through the endof 2010, showing European losses to be far higher than American losses.
318 Appendix: Tail Risk in the Rest of the World
Exhibit 4 Estimates additional capital raising needed to reach specific targets.Source: IMF staff estimates.
Appendix: Tail Risk in the Rest of the World 319
The losses booked so far and the apparent difference in markedasset valuations between the United States and Europe suggests furtherpain for the surviving institutions. Exhibit 3 estimates the additionalcapital that would have to be raised by individual European banks toreach 4% and 5%, respectively, of risk-weighted assets under the Basle2 standards. This assessment is broadened in Exhibit 4 to banks home-based in specific European countries, according to IMF estimates inOctober 2009. It is clear from this last exhibit that if the U.S. marksprove to be more accurate than the continental European marks, thenthe European banks will have a great deal of capital raising to do giventhe significant tail risk of real estate and the global economy at largeto which they built exposures leading up to the crisis.
References
Acharya, V. V., T. Cooley, M. Richardson, and I. Walter (2010a), ‘Mar-ket failures and regulatory failures: Lessons from past and presentcrises’. In: M. Kawai and E. Prasad (eds.): forthcoming FinancialSector Regulation and Reforms in Emerging Markets. Washington,DC: Brookings Institution Press.
Acharya, V. V., T. Cooley, M. Richardson, and I. Walter (2010b), Reg-ulating Wall Street: The New Architecture of Global Finance. forth-coming, New York University Stern School of Business and John Wile& Sons.
Acharya, V. V., D. Gale, and T. Yorulmazer (2008), ‘Rollover risk andmarket freezes’. Working Paper, New York University Stern Schoolof Business.
Acharya, V. V., M. Pagano, and P. Volpin (2009a), ‘Seeking alpha:Excess risk taking and competition for managerial talent’. WorkingPaper, New York University Stern School of Business.
Acharya, V. V. and M. Richardson (2009a), ‘Causes of the financialcrisis’. Critical Review 21(2–3), 195–210.
Acharya, V. V. and M. Richardson (2009b), Restoring Financial Sta-bility: How to Repair a Failed System. New York University SternSchool of Business and John Wiley & Sons.
320
References 321
Acharya, V. V., J. Santos, and T. Yorulmazer (2009b), ‘Systemicrisk and deposit insurance premiums’. forthcoming, Economic PolicyReview, Federal Reserve Bank of New York.
Acharya, V. V. and P. Schnabl (2009), ‘Do global banks spread globalimbalances? The case of asset-backed commercial paper during thefinancial crisis of 2007–2009’. Working Paper, New York UniversityStern School of Business.
Acharya, V. V., P. Schnabl, and G. Suarez (2009c), ‘Securitization with-out risk transfer’. Working Paper, New York University Stern Schoolof Business.
Acharya, V. V. and P. Volpin (2010), ‘Corporate governance external-ities’. Review of Finance 14(1), 1–33.
Adrian, T. and H. S. Shin (2009), ‘The shadow banking system: Impli-cations for financial regulation’. FRB of New York Staff Report No.382.
Akerlof, G. and R. Shiller (2009), Animal Spirits: How Human Psychol-ogy Drives the Economy, and Why It Matters for Global Capitalism.Princeton University Press.
Allen, F. and D. Gale (2000), ‘Bubbles and Crises’. Economic Journal110, 236–255.
Allen, F. and D. Gale (2007), Understanding Financial Crises. Claren-don Lectures in Finance, Oxford University Press.
Ashcraft, A. and T. Schuermann (2008), ‘Understanding the Securiti-zation of Subprime Mortgage Credit’. Federal Reserve Bank of NewYork Working Paper.
Bernanke, B. S. (2000), Essays on the Great Depression. PrincetonUniversity Press.
Bernanke, B. S. (2005), ‘The global saving glut and the U.S. currentaccount deficit’. Speech delivered for the Sandridge Lecture at theVirginia Association of Economists, Richmond, March 10, www.federalreserve.gov/boarddocs/speeches/2005/200503102/default.htm.
Berndt, A. and A. Gupta (2008), ‘Moral hazard and adverse selectionin the originate-to-distribute model of bank credit’. Working Paper,Carnegie Mellon University.
Bruner, R. and S. D. Carr (2007), The Panic of 1907: Lessons Learnedfrom the Market’s Perfect Storm. John Wiley and Sons.
322 References
Caballero, R. J., E. Farhi, and P. O. Gourinchas (2008), ‘An Equilib-rium Model of Global Imbalances and Low Interest Rates’. AmericanEconomic Review 98(1), 358–393.
Caballero, R. J. and A. Krishnamurthy (2009), ‘Global Imbalances andFinancial Fragility’. American Economic Review Papers and Proceed-ings 99(2), 584–588.
Calomiris, C. and C. Kahn (1991), ‘The role of demandable debtin structuring optimal banking arrangements’. American EconomicReview 81(3), 497–513.
Cordell, L. R., G. D. Mac Donald, and M. E. Wohar (1993), ‘Corporateownership and the thrift crisis’. Journal of Law and Economics 36(2),719–756.
Dell’Ariccia, G., D. Igan, and L. Laeven (2008), ‘Credit booms andlending standards: Evidence from the subprime mortgage market’.Working Paper, International Monetary Fund.
Diamond, D. W. (1984), ‘Financial intermediation and delegated mon-itoring’. The Review of Economic Studies 51(3), 393–414.
Diamond, D. W. and R. G. Rajan (2001), ‘Liquidity risk, liquidity cre-ation and financial fragility: A theory of banking’. Journal of PoliticalEconomy 109(2), 287–327.
Engle, R. F. (2009), ‘Long run skewness and systemic risk’. In: Presen-tation at International Association of Financial Engineers (IAFE).Mimeo, New York University Stern School of Business.
Ennis, H. and H. S. Malek (2005), ‘Bank risk of failure and the too-big-to-fail policy’. Federal Reserve Bank of Richmond Economic Quar-terly 91, 21–44.
Federal Deposit Insurance Corporation (1997), ‘History of the eight-ies — Lessons for the future: Volume I: An examination ofthe banking crises of the 1980s and early 1990s’. (online atwww.fdic.gov/bank/historical/history/vol1.html).
Friedman, M. and A. J. Schwartz (1971), A Monetary History of TheUnited States 1867–1960. Princeton University Press.
Gabaix, X. and A. Landier (2008), ‘Why has CEO pay increased somuch?’. Quarterly Journal of Economics 123, 49–100.
Gorton, G. (1985), ‘Clearing houses and the origin of Central Bank-ing in the United States’. Journal of Economic History XLV(2),277–283.
References 323
Gorton, G. (2008), ‘The Panic of 2007’. Yale University working paper.Gorton, G. (2009), ‘Slapped in the face by the invisible hand: Banking
and the panic of 2007’. Working Paper, Yale University.Gorton, G. and G. Pennacchi (1990), ‘Financial intermediaries and liq-
uidity creation’. Journal of Finance 45(1), 49–71.Hovakimian, A. and E. J. Kane (2000), ‘Effectiveness of capital regula-
tion at U.S. commercial banks, 1985 to 1994’. The Journal of Finance55(1), 451–468.
Jensen, M. C. and W. H. Meckling (1976), ‘Theory of the firm: Man-agerial behavior, agency costs and ownership structure’. Journal ofFinancial Economics 3(4), 305–360.
John, K. and T. A. John (1993), ‘Top-management compensation andcapital structure’. Journal of Finance 48, 949–974.
Keeley, M. C. (1990), ‘Deposit insurance, risk, and market power inbanking’. the American Economic Review 80(5), 1183–1200.
Keys, B., T. Mukherjee, A. Seru, and V. Vig (2008), ‘Did securitiza-tion lead to lax screening? Evidence form subprime loans?’. WorkingPaper, London Business School.
Krishnamurthy, A. (2008), ‘The financial meltdown: Data and diag-noses’. Northwestern University working paper.
Kroszner, R. (2000), ‘Lessons from financial crises: The role of clear-inghouses’. Journal of Financial Services Research, Springer 18(2),157–171.
Kroszner, R. and W. Melick (2009), ‘The response of the federal reserveto the banking and financial crisis of 2007/2008’. working paper.
Kroszner, R. S. and P. E. Strahan (1996), ‘Regulatory incentives andthe thrift crisis: Dividends, mutual-to-stock conversions, and finan-cial distress’. the Journal of Finance 51(4), 1285–1319.
Kroszner, R. S. and P. E. Strahan (2007), ‘Regulation and Deregula-tion of the I.S. Banking Industry: Causes, Consequences and Impli-cations for the Future’. In: N. Rose (ed.): Economic Regulation andits Reform: What have we Learned? University of Chicago Press.
Lucas, D. and R. L. McDonald (2006), ‘An options-based approachto evaluating the risk of Fannie Mae and Freddie Mac’. Journal ofMonetary Economics 53(1), 155–176.
324 References
Marcus, A. and I. Shaked (1984), ‘The valuation of FDIC deposit insur-ance using option pricing estimates’. Journal of Money, Credit andBanking 16, 444–460.
Meltzer, A. (2004), ‘Monetarism revisited’. World Economics Journal5(2), 161–164.
Mian, A. and A. Sufi (2008), ‘The consequences of mortgage creditexpansion: Evidence from the 2007 mortgage default crisis’. Quar-terly Journal of Economics, forthcoming.
Morgan, D. and K. Stiroh (2005), ‘Too big to fail after all these years’.Federal Reserve Bank of New York staff report.
Myers, S. C. (1977), ‘Determinants of corporate borrowing’. Journal ofFinancial Economics 5(2), 147–175.
Myers, S. C. and N. S. Majluf (1984), ‘Corporate financing and invest-ment decisions when firms have information that investors do nothave’. Journal of Financial Economics 13(2), 187–221.
Obstfeld, M. and K. Rogoff (2009), ‘Global imbalances and the finan-cial crisis: Products of common causes’. Working Paper, HarvardUniversity.
O’Hara, M. and W. Shaw (1990), ‘Deposit insurance and wealth effects:The value of being too big to fail’. Journal of Finance 45, 1587–1601.
Passmore, W. (2005), ‘The GSE Implicit Subsidy and the value of Gov-ernment Ambiguity’. Real Estate Economics 33(3), 465–486.
Penas, M. and H. Unal (2004), ‘Gains in bank mergers: Evidence fromthe bond markets’. Journal of Financial Economics 74, 149–179.
Pennacchi, G. (1987), ‘A reexamination of the over- (or under-) pricingof deposit insurance’. Journal of Money, Credit and Banking 19,340–360.
Pinto, E. (2008), ‘Statement before the committee on oversight andgovernment reform’. US House of Representatives, December 9.
Portes, R. (2009), ‘Global imbalances’. In: M. Dewatripont, X. Freixas,and R. Portes (eds.): Macroeconomic stability and financial regula-tion. CEPR, pp. 9–26.
Rajan, R. (2008), ‘Bankers’ pay is deeply flawed’. Financial Times,January 9.
Reinhart, C. and K. Rogoff (2008), ‘This time is different: A panoramicview of eight centuries of financial crises’. NBER working paper.
References 325
Saunders, A., E. Strock, and N. G. Travlos (1990), ‘Ownership struc-ture, deregulation, and bank risk taking’. the Journal of Finance45(2), 643–654.
Shin, H. S. (2009), ‘Securitization and financial stability’. Paper pre-sented as the Economic Journal Lecture at the Royal Economic Soci-ety meeting, Warwick, March 2008.
Stern, G. and R. Feldman (2004), Too Big to Fail: The Hazards of BankBailouts. Washington D.C: Brookings Institution Press.
Stiglitz, J. (1992), ‘Banks versus markets as mechanisms for allocatingand coordinating investment’. In: J. Roumasset and S. Barr (eds.):The Economics of Cooperation. Boulder: Westview Press, Inc.
Stiroh, K. (2002), ‘Diversification in banking? Is noninterest incomethe answer?’. Working Paper, Federal Reserve Bank of New York.
Stock, J. H. and M. W. Watson (2002), ‘Has the business cycle changedand why?’. NBER Macroeconomics Annual pp. 159–218.
Taylor, J. (2009), ‘The financial crisis and the policy responses: Anempirical analysis of what went wrong’. Working Paper, StanfordUniversity.
White, L. J. (1991), The S&L Debacle: Public Policy Lessons for Bankand Thrift Regulation. Oxford University Press.
White, L. J. (2006), ‘Good intentions gone awry: A policy analy-sis of the SEC’s regulation of the bond rating industry’. PolicyBrief #2006-PB-05, Networks Financial Institute, Indiana StateUniversity.