25
| Date post: | 21-Dec-2015 |
| Category: |
Documents |
| View: | 215 times |
| Download: | 1 times |


By:Tahereh Ensafi Moghadam
Aridity zoning of dry-land (Climatic Index of desertification)
based on precipitation and temperature in central basin of Iran
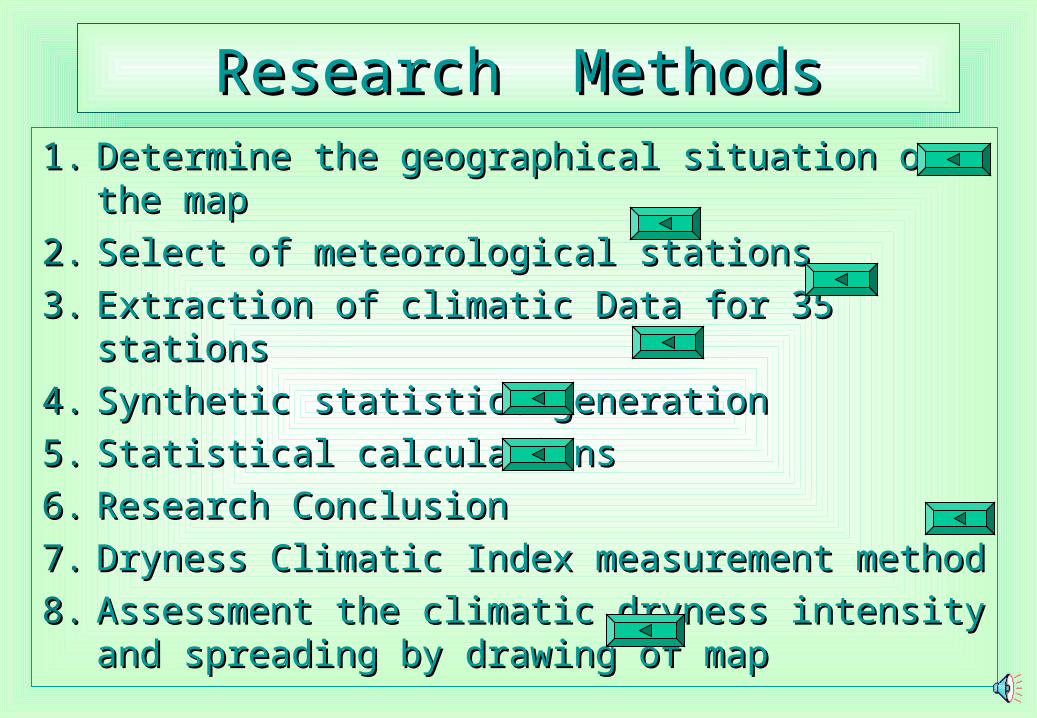
1.1. Determine the geographical situation on the mapDetermine the geographical situation on the map
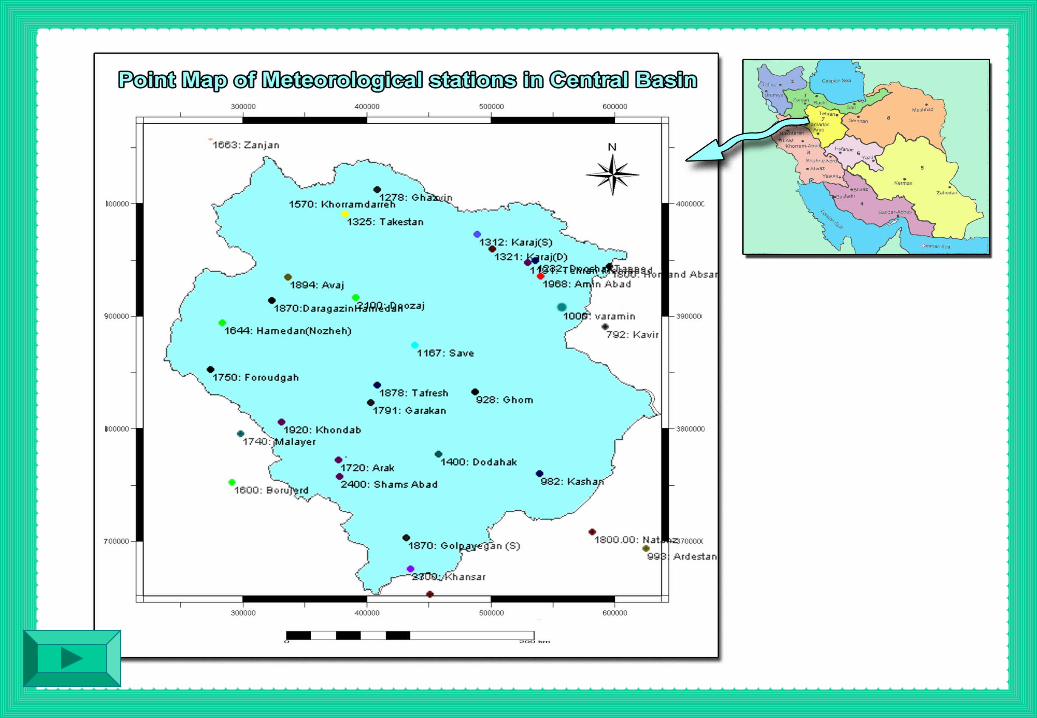
2.2. Select of meteorological stations Select of meteorological stations
3.3. Extraction of climatic Data for 35 stationsExtraction of climatic Data for 35 stations
4.4. Synthetic statistics generation Synthetic statistics generation
5.5. Statistical calculationsStatistical calculations
6.6. Research ConclusionResearch Conclusion
7.7. Dryness Climatic Index measurement methodDryness Climatic Index measurement method
8.8. Assessment the climatic dryness intensity and Assessment the climatic dryness intensity and spreading by drawing of mapspreading by drawing of map
Research MethodsResearch Methods

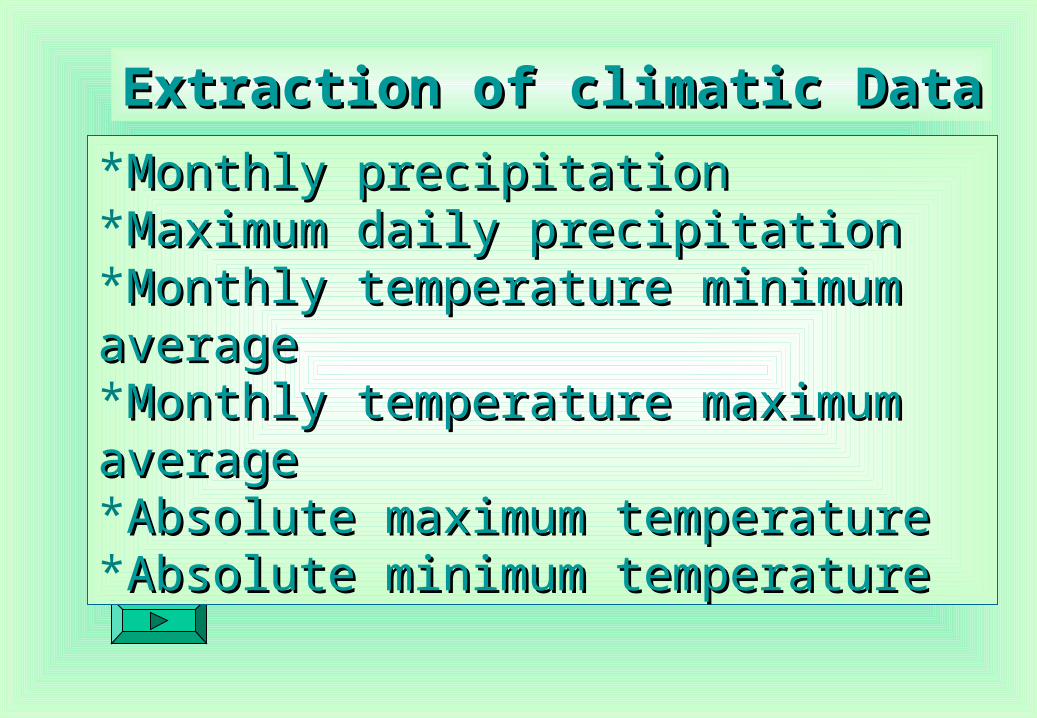
Extraction of climatic DataExtraction of climatic Data
*Monthly precipitationMonthly precipitation*Maximum daily precipitationMaximum daily precipitation*Monthly temperature minimum average Monthly temperature minimum average *Monthly temperature maximum averageMonthly temperature maximum average*Absolute maximum temperatureAbsolute maximum temperature*Absolute minimum temperatureAbsolute minimum temperature

Statistical Calculations on the Climatic Data:Statistical Calculations on the Climatic Data:1) Calculation of Montly and Annual Climatic Data Average, variance and
Standard deviation2) Calculation of Mean Annual temprature about 35 stations in the career3) Calculation of seasonal fluctuation about 35 stations in the career4) Calculation of temprature range fluctuation about 35 stations in the career5) Calculation of Annual and Montly Temprature and rain Coefficient of
variability about 35 stations in the career6) Calculation of Interannual relative Rainfall Variability about 35 stations in
the career7) Calculation of Montly and Annual Average, variance and Standard deviation
about total of obtain results in the career8) Calculation of Montly and Annual Z score about total of obtain results in the
career9) Collection 0f Montly and Annual Z score together and divide to columns
number (Dryness Climatic Index constructing)10)Drawing of ( Dryness Climatic Index ) maps and graphs about 35 stations
in the career
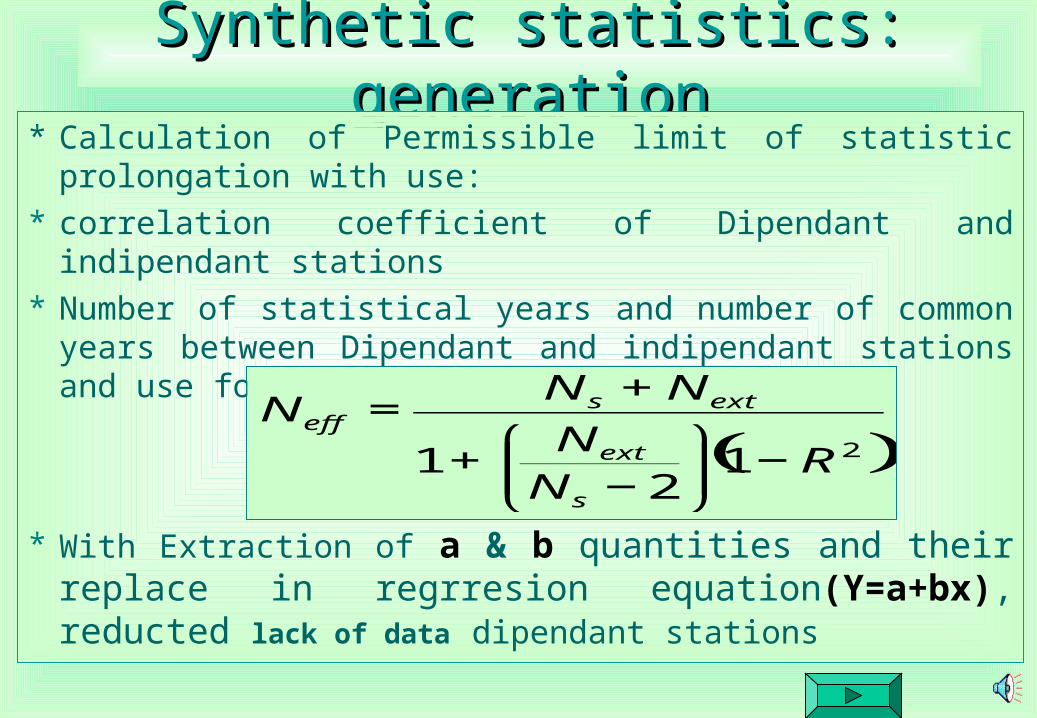
::Synthetic statistics generationSynthetic statistics generation* Calculation of Permissible limit of statistic prolongationwithuse:
* correlation coefficient of Dipendant and indipendant stations* Number of statistical years and number of common years
between Dipendant and indipendant stations and use follow formul:
* With Extraction of a & b quantities and their replace in regrresion equation(Y=a+bx), reducted lack of data dipendant stations
( )212
1 RNN
NNN
s
ext
extseff
−⎟⎟⎠
⎞⎜⎜⎝
⎛−
+
+=
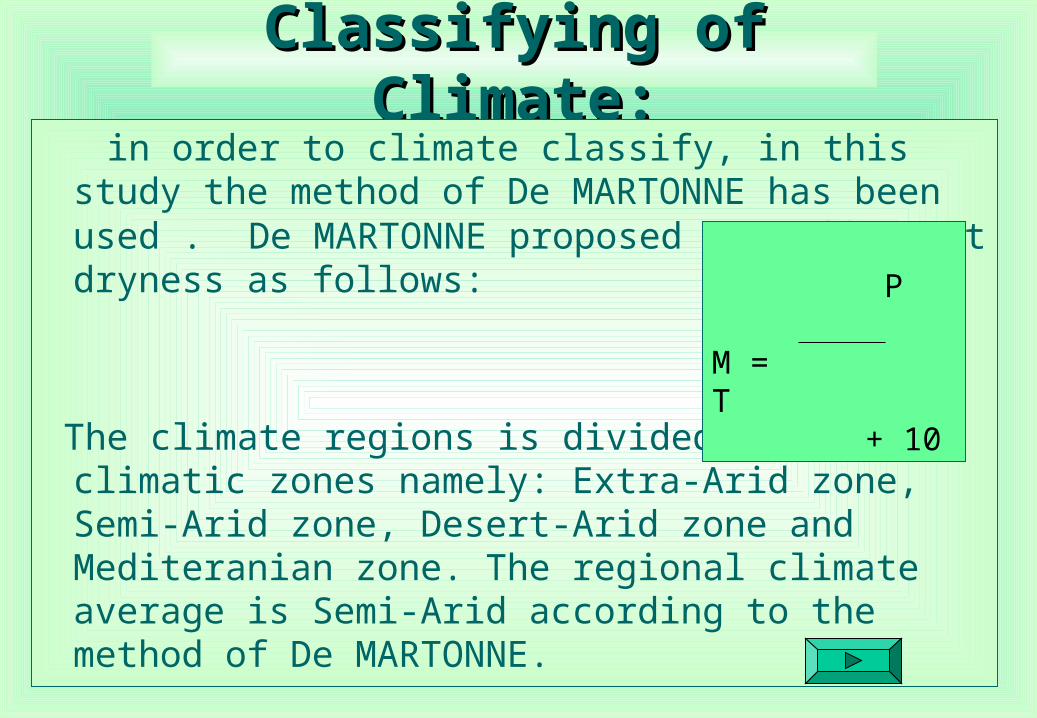
Classifying of Climate:Classifying of Climate: in order to climate classify, in this study the method of
De MARTONNE has been used . De MARTONNE proposed a coefficient dryness as follows:
The climate regions is divided in four climatic zones namely: Extra-Arid zone, Semi-Arid zone, Desert-Arid zone and Mediteranian zone. The regional climate average is Semi-Arid according to the method of De MARTONNE.
P M =
T + 10
Climatic dryness zones map in Central basin according to De MARTONNE Index
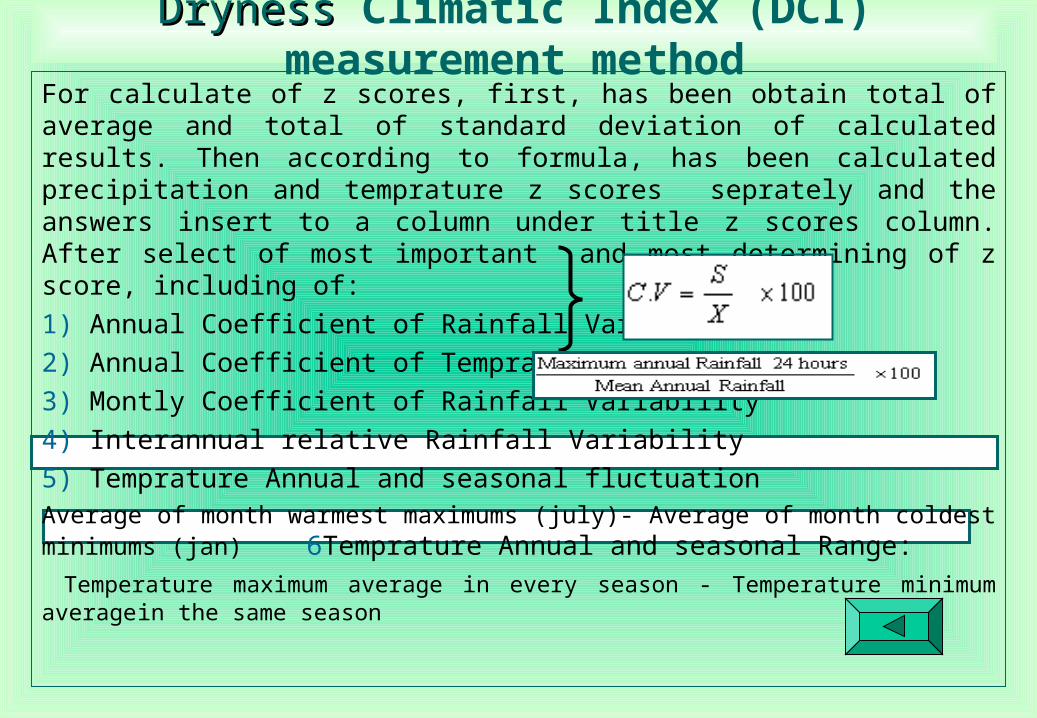
For calculate of z scores, first, has been obtain total of average and total of standard deviation of calculated results. Then according to formula, has been calculated precipitation and temprature z scores seprately and the answers insert to a column under title z scores column. After select of most important and most determining of z score, including of:
1) Annual Coefficient of Rainfall Variability
2) Annual Coefficient of Temprature Variability
3) Montly Coefficient of Rainfall Variability
4) Interannual relative Rainfall Variability
5) Temprature Annual and seasonal fluctuation
Average of month warmest maximums (july)- Average of month coldest minimums (jan) 6Temprature Annual and seasonal Range:
Temperature maximum average in every season - Temperature minimum average in the same season
DrynessDryness Climatic Index (DCI) measurement method

DrynessDryness Climatic Index (DCI) formulaClimatic Index (DCI) formula
S
xxZ i −=
whole of Z scores has been gathered together and has been divided to columns number. Obtained results Which is changed among –2 untill +3, is a criteria under title: “Desertification Climatic Index” for determining the climatic dryness intensity and spreading.
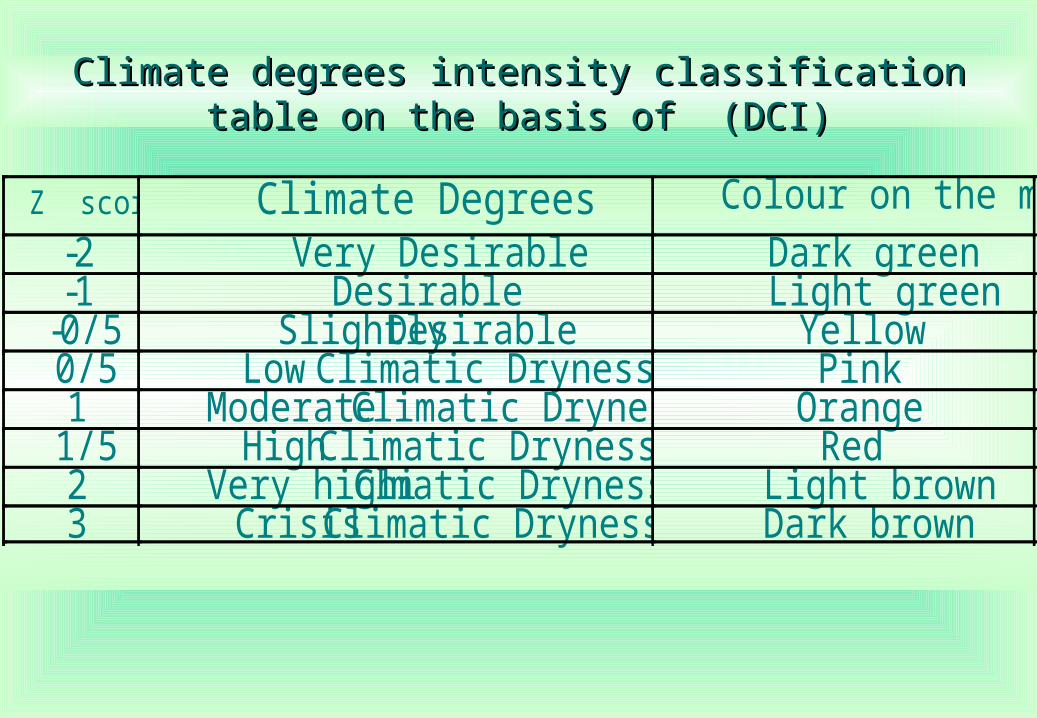
Climate degrees intensity classification table on the basis of (DCI)Climate degrees intensity classification table on the basis of (DCI)
Z score Climate Degrees Colour on the map
-2 Very Desirable Dark green -1 Desirable Light green
-0/5 Slightly Desirable Yellow 0/5 Low Climatic Dryness Pink 1 Moderate Climatic Dryness Orange
1/5 High Climatic Dryness Red 2 Very high Climatic Dryness Light brown 3 Crisis Climatic Dryness Dark brown
Assessment of Dryness Climate degrees Assessment of Dryness Climate degrees intensity on the basis of (DCI)intensity on the basis of (DCI)
For indicate “DCI” variability during 40 years, the linear diagarms has been drawn for every station and In this program the Mean of all stations, merely interprete.
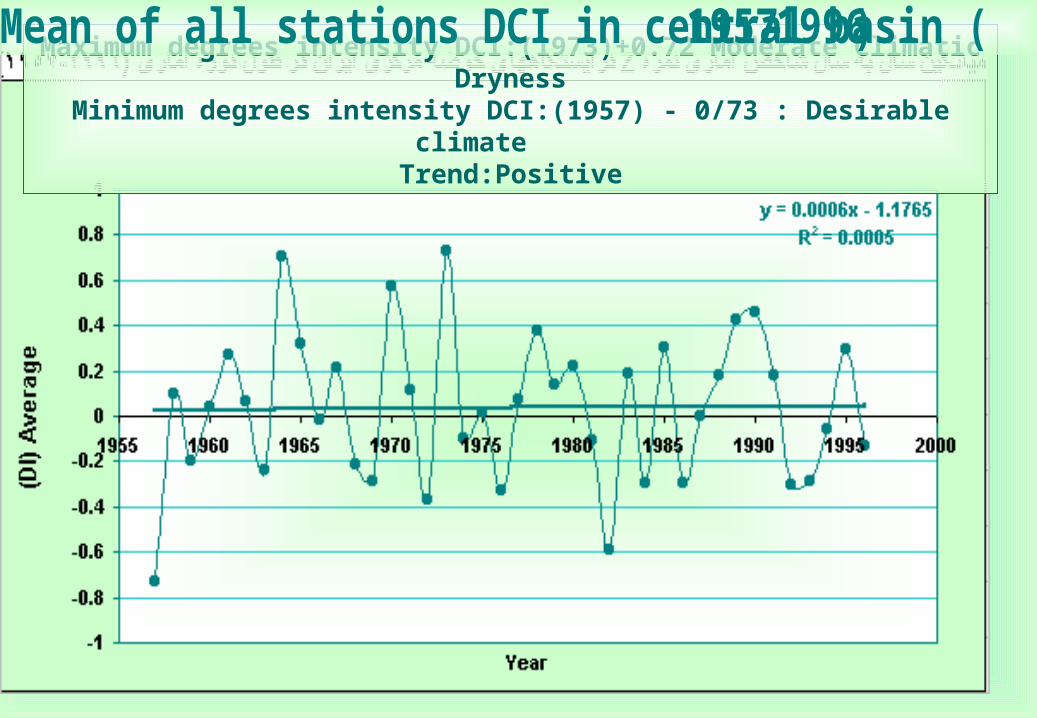
Maximum degrees intensity DCI:(1973)+0.72 Moderate Climatic DrynessMinimum degrees intensity DCI:(1957) - 0/73 : Desirable climate
Trend:Positive
Mean of all stations DCI in central basin (1957-1996)

Climatic Dryness PROCESS IN CENTRAL BASIN OF IRAN (1957)Climatic Dryness PROCESS IN CENTRAL BASIN OF IRAN (1957)
Classes KM2 %
VeryDesirable 42.625 0.04595722
Desirable 87425.625 94.2601352
SlighthlyDesirable 5281.063 5.69391082
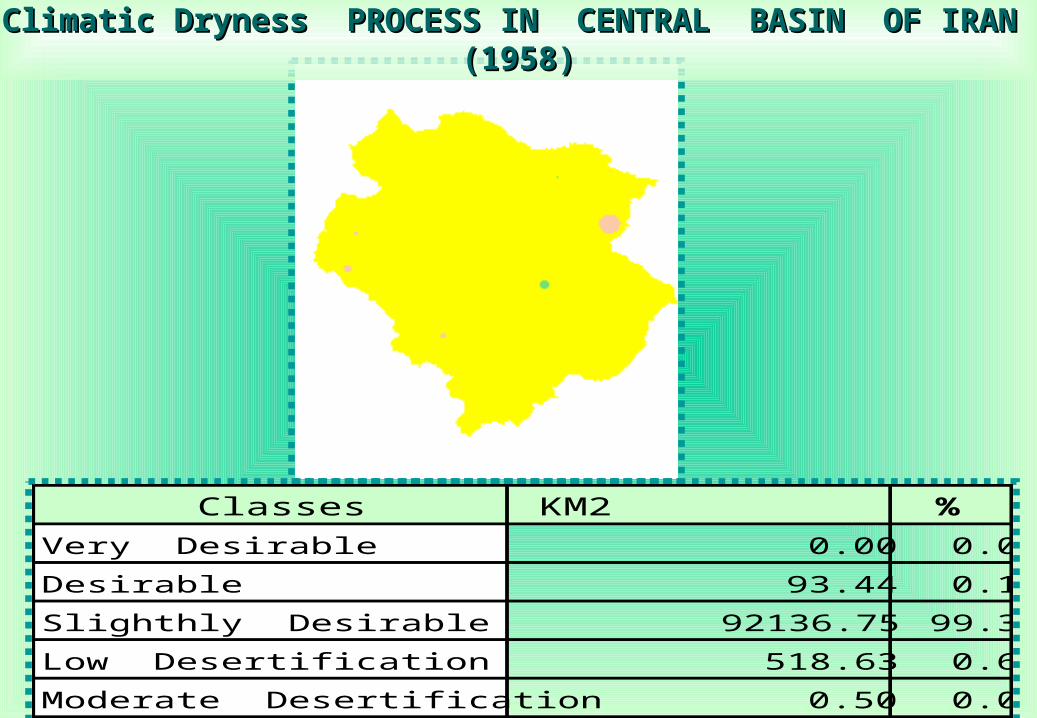
Climatic Dryness PROCESS IN CENTRAL BASIN OF IRAN (1958)Climatic Dryness PROCESS IN CENTRAL BASIN OF IRAN (1958)
Classes KM2 %
VeryDesirable 0.00 0.0
Desirable 93.44 0.1
SlighthlyDesirable 92136.75 99.3
LowDesertification 518.63 0.6
ModerateDesertification 0.50 0.0
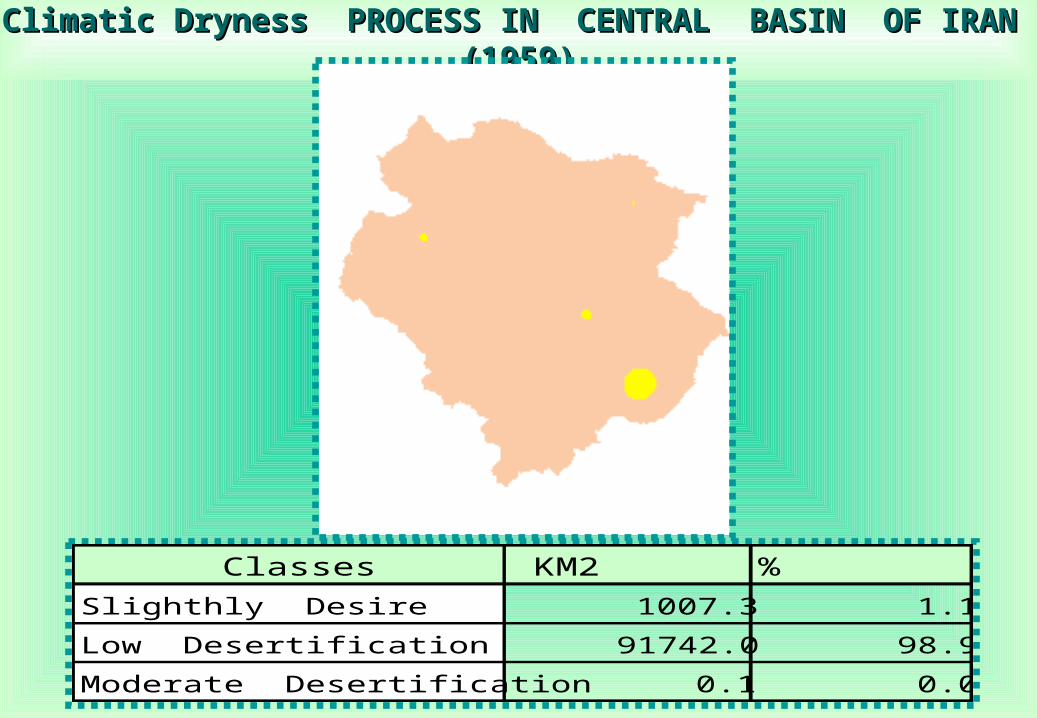
Classes KM2 %
SlighthlyDesire 1007.3 1.1
LowDesertification 91742.0 98.9
ModerateDesertification 0.1 0.0
Climatic Dryness PROCESS IN CENTRAL BASIN OF IRAN (1959)Climatic Dryness PROCESS IN CENTRAL BASIN OF IRAN (1959)
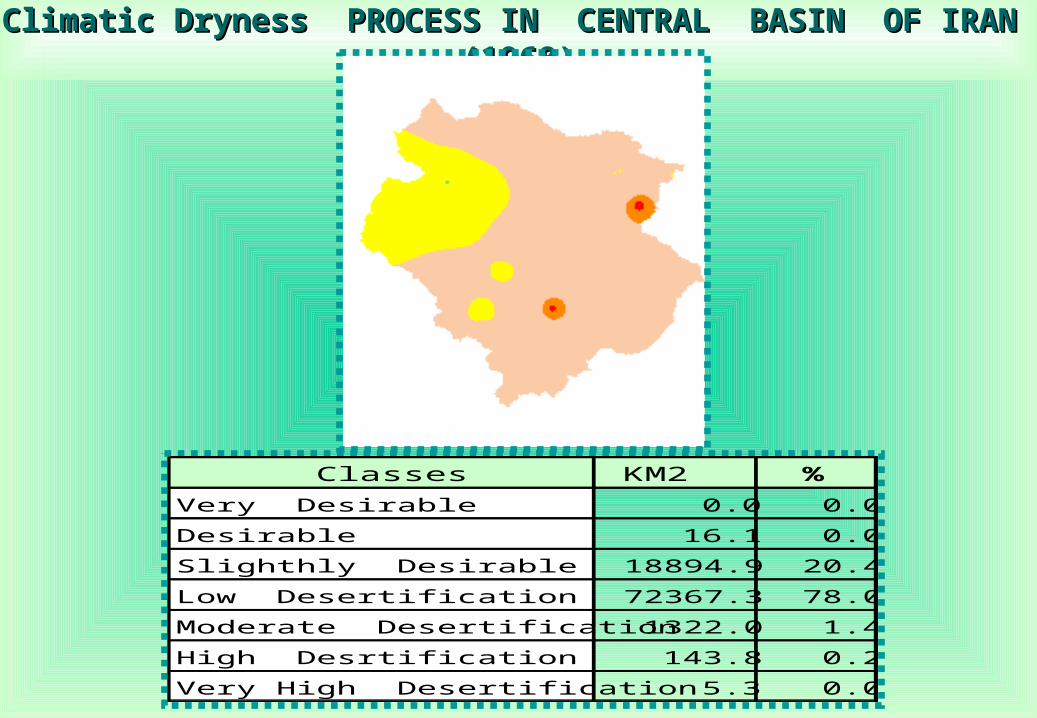
Climatic Dryness PROCESS IN CENTRAL BASIN OF IRAN (1968)Climatic Dryness PROCESS IN CENTRAL BASIN OF IRAN (1968)
Classes KM2 %
VeryDesirable 0.0 0.0
Desirable 16.1 0.0
SlighthlyDesirable 18894.9 20.4
LowDesertification 72367.3 78.0
ModerateDesertification 1322.0 1.4
HighDesrtification 143.8 0.2
VeryHighDesertification 5.3 0.0

Climatic Dryness PROCESS IN CENTRAL BASIN OF IRAN (1969)Climatic Dryness PROCESS IN CENTRAL BASIN OF IRAN (1969)
Classes KM2 %
VeryDesire 0.00 0.0
Desire 16.13 0.0
SlighthlyDesire 18894.88 20.4
LowDesertification 72367.25 78.0
ModerateDesertification 1322.00 1.4
HighDesrtification 143.75 0.2
VeryHighDesertification 5.31 0.0
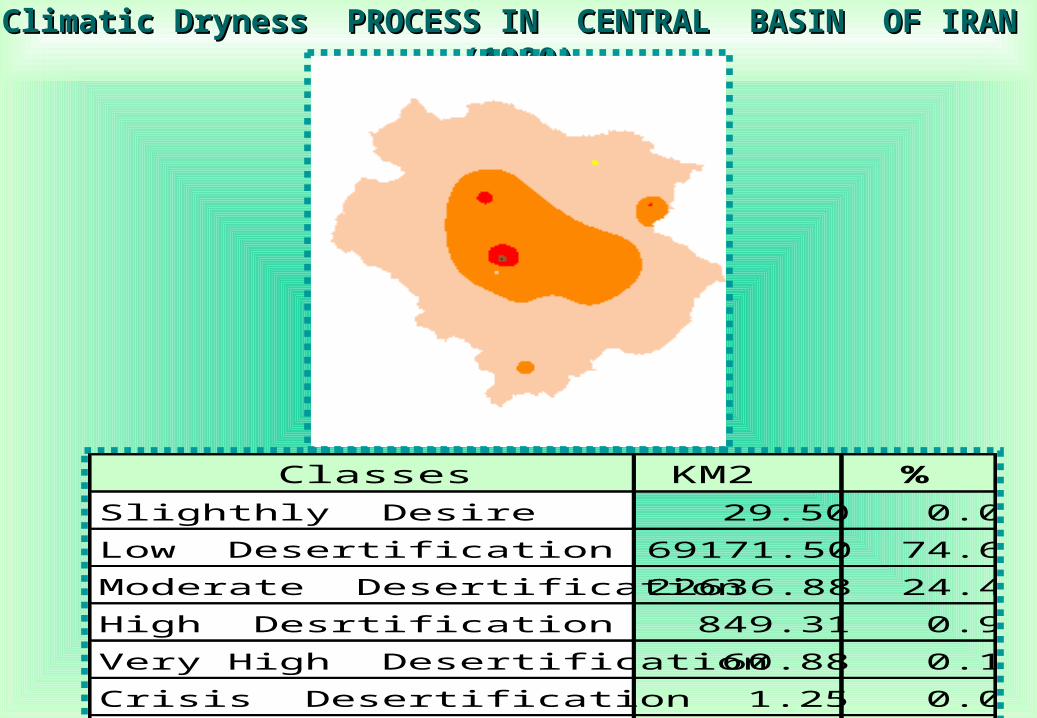
Climatic Dryness PROCESS IN CENTRAL BASIN OF IRAN (1980)Climatic Dryness PROCESS IN CENTRAL BASIN OF IRAN (1980)
Classes KM2 %
SlighthlyDesire 29.50 0.0
LowDesertification 69171.50 74.6
ModerateDesertification 22636.88 24.4
HighDesrtification 849.31 0.9
VeryHighDesertification 60.88 0.1
CrisisDesertification 1.25 0.0
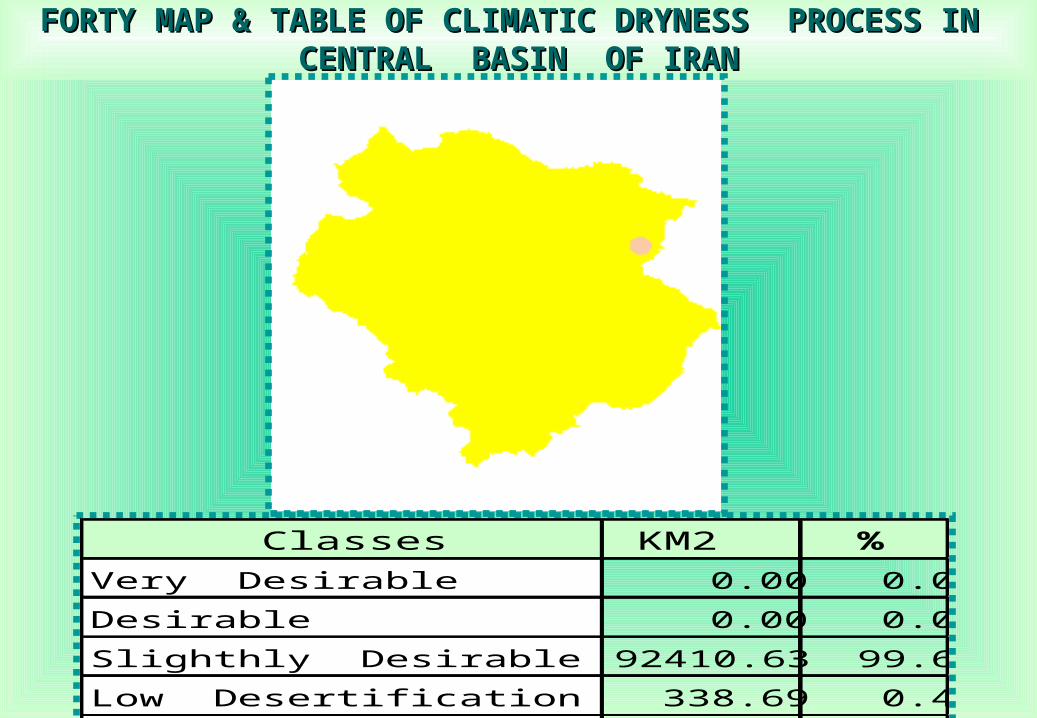
FORTY MAP & TABLE OF CLIMATIC DRYNESS PROCESS IN FORTY MAP & TABLE OF CLIMATIC DRYNESS PROCESS IN CENTRAL BASIN OF IRANCENTRAL BASIN OF IRAN
Classes KM2 %
VeryDesirable 0.00 0.0
Desirable 0.00 0.0
SlighthlyDesirable 92410.63 99.6
LowDesertification 338.69 0.4

10 YEARS MOVING AVERAGE GRAPH OF ARIDITY ZONES 10 YEARS MOVING AVERAGE GRAPH OF ARIDITY ZONES PERCENT IN CENTAL BASIN OF IRAN PERCENT IN CENTAL BASIN OF IRAN
10 Moving Average Climatic Dryness Percent
1966
1967
196819691970
1971
1972
19731974
197519761977
1978197919801981
198219831984198519861987
1988198919901991
199219931994
1995
1996
y = 0.7717x - 1448.9
R2 = 0.2355
0.0
20.0
40.0
60.0
80.0
100.0
120.0
1955 1960 1965 1970 1975 1980 1985 1990 1995 2000
Year
Percent of Area
The positive gradient of trend line in this graph obviously explains, continuation of this movement in future years
10 YEARS MOVING AVERAGE GRAPH OF ARIDITY ZONES 10 YEARS MOVING AVERAGE GRAPH OF ARIDITY ZONES PERCENT IN CENTAL BASIN OF IRAN PERCENT IN CENTAL BASIN OF IRAN

* Conclusion:DCI Index suggest climatic effects on Dryness and it is one of most suitable criteria for determining the climatic dryness intensity and spreading
• As of result of this research, spreading and intensity degrees, during 17 years of the forty years career, has enjoyed of desirable and slightly desirable climatic and too, 23 years of this term, has allocated to low climatic dryness degrees with tendency to moderate climatic dryness.
* Among 35 stations of one long term, Varamin station and interpolation areas of its around with 338.69 sq km, has exposed climatic dryness, more than of other stations
• The Central basin of Iran, however, not so very, but with quiet and continuously movement, has been led toward climatic dryness.