28
c 1 November 13, 2009 Show-Ling Jang Professor of Economics, National Taiwan University
| Date post: | 27-Dec-2015 |
| Category: |
Documents |
| Upload: | geraldine-bridges |
| View: | 227 times |
| Download: | 0 times |

c1
November 13, 2009
Show-Ling JangProfessor of Economics, National Taiwan University

Outline
Introduction2
The trend of patent production in China3
Data source and procedure4
Characteristics of the coinventorship structure5
The determinants of joint invention of countries6
Conclusion 7
2
Abstract1
Abstract
3
This study examines inventor data by country of residence, and by analyzing main collaborating countries with China in global technology production during 1997-2007, we demonstrate the evolving trend of an emerging market in the collaborative patenting network.
In addition to exploring the pattern of cross-border joint inventions, by linking patent data and other macro-economic factors, we model the propensity of China and other countries in engaging co-inventing activities. We find that China currently plays a supporting role in the international coinventorship.
Introduction
4
First Stage Second Stage
We first provide a typology on the collaborative inventing network at country level, taking China as our focal country. Co-invention happens when joint invention between at least one inventor from China and at least one inventor from other country.
Based on the indicators derived from the first exploratory stage of our analysis, we further investigate what determine the likelihood of joint invention between China and foreign co-inventors.
The objective of this study is two-fold. We use patent data granted at the United States Patent and Trademark Office (hereafter USPTO) to examine the pattern of coinventorship in China over the period 1997-2007.

The trend of patent production in China
USPTO patent grants
1986-2007
- The number of patent applications per billion yuan of real R&D expenditure nearly doubled
- The number of patent grants has more than tripled
In terms of sheer quantity, the patent production in China has recently gaining momentum in absolute count and the patenting propensity has similarly increased.
USPTO patent applicationsDomestic patent activities
China’s patent application to USPTO
- Increases ten times within the two recent decades, and is most conspicuous from 1997
China’s patents granted by USPTO
- In year 2002 amount to 289, ranked 21 worldwide
- The number increase to 1225, ranked 12 worldwide in year 2008
5
Comparing to the BRIC countries
1963-2008 the total counts of BRIC’s utility patent grants by USPTO
BRAZIL: 2094
RUSSIA: 2409
INDIA: 4080
CHINA: 5162

The trend of patent production in China (cont’d)
Figure 1 Trend of patent production in China 6

Data source and procedure
7
Data Data sourcesource
In this study, we used the USTPO database to examine the pattern of inventive collaborations between China and other countries.
Utility patents, patents for invention, are chosen. Because utility patents have been considered as indicative of technological output.
Because there are only limited numbers of patent production in the earlier decades, we choose to cover period from 1997, when we begin to witness a patent boom, to 2007.
Database
Patent type
Period
We included in our sample all patents involving Chinese inventors as long as one or more of the inventors were located in China.
Since 1997, Hong Kong has been considered as the special administrated region of China. We distinguished patents with Hong Kong origin from the analysis due to its marked differences in economic development. Since 1997, Hong Kong has been considered as the special administrated region of China. We distinguished patents with Hong Kong origin from the analysis due to its marked differences in economic development.

Data source and procedure (cont’d)We included in our sample all patents involving Chinese inventors as long as one or more of the inventors were located in China.
Total of 5374 China’s utility
patents granted by USPTO during
1997-2007
Procedure
2.Technological field analysis
• We focus on the main collaborating countries that conduct co-inventing activities with China
• We further examine the ownership of these co-inventions.
1.Country pair
approach
3.The
ownership of these co-
inventions
• We also code the technological field of such co-invention based on Hall’s taxonomy (Hall, 2001).
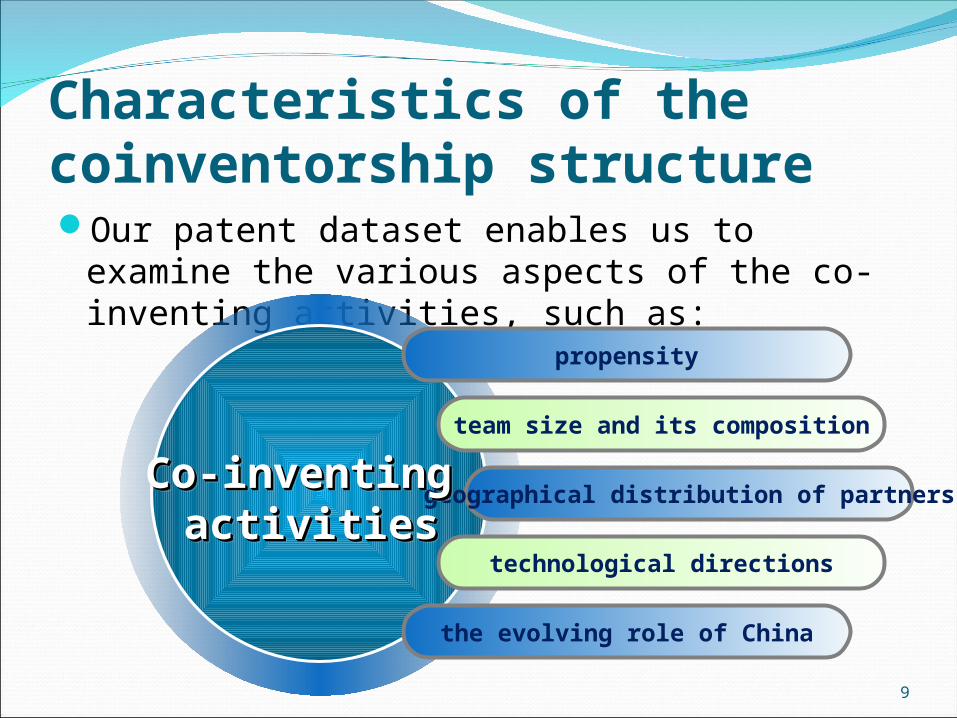
Characteristics of the coinventorship structure Our patent dataset enables us to examine the
various aspects of the co-inventing activities, such as:
propensity
team size and its composition
geographical distribution of partners
technological directions
the evolving role of China
Co-inventing Co-inventing activitiesactivities
Co-inventing Co-inventing activitiesactivities
9

Question 1
Question 2
Question 3
Question 4
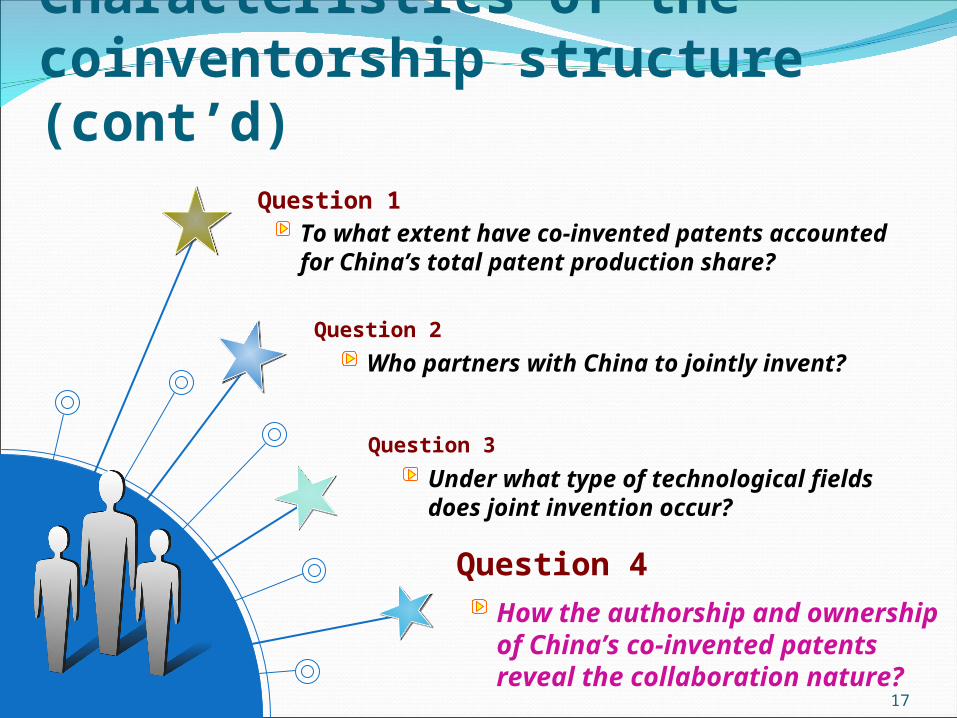
To what extent have co-invented patents accounted for China’s total patent production share?
Who partners with China to jointly invent?
Under what type of technological fields does joint invention occur?
How the authorship and ownership of China’s co-invented patents reveal the collaboration nature?
Characteristics of the coinventorship structure (cont’d)
10

Characteristics of the coinventorship structure (cont’d)
11
Figure 2 China's co-invented patent count and its patent share by year

Question 1
Question 2
Question 3
Question 4
To what extent have co-invented patents accounted for China’s total patent production share?
Who partners with China to jointly invent?
Under what type of technological fields does joint invention occur?
How the authorship and ownership of China’s co-invented patents reveal the collaboration nature?
Characteristics of the coinventorship structure (cont’d)
12

Table 1 China's co-invented patents by country pair (part)
13
Number of co-invented patent by co-inventor's country
Number of co-invented patent by co-inventor's country pair
Top three assignee's country
Co-invented country
Patent count
Pair Patent share Share of
assigneed patent
1 2 3
USA(US)
862(52.24%)
US/CN 44.42% 40.36% US(607) CN(12) TW(11)
US/CN/HK 1.21% 1.09% US(15) HK(2) VG(1)
US/CN/TW 0.61% 0.61% US(5) TW(3) CN/US/TW(2)
US/CN/GB 0.55% 0.55% US(8) GB(1)
US/CN/SG 0.55% 0.48% US(5) SG(3)
US/CN/FR 0.48% 0.48% US(8)
US/CN/JP 0.42% 0.42% US(4) JP(1) CN(1)
US/CN/CA 0.36% 0.30% US(4) BM(1)
US/CN/DE 0.36% 0.30% US(2) DE(2) US/DE(1)
US/CN/DE/JP 0.30% 0.30% DE(5)
US/CN/GB/BE 0.30% 0.30% US(5)
US/CN/KR 0.30% 0.30% US(4) KR(1)
Other pairs 2.36% 2.30%
Taiwan(TW)
524(31.76%)
TW/CN 30.97% 30.91% TW(380) CN/TW(110) CN/VG(11)
TW/CN/US 0.61% 0.61% US(5) TW(3) CN/US/TW(2)
Other pairs 0.18% 0.18%

Characteristics of the coinventorship structure (cont’d)
14Figure 3 Coinventing propensity by foreign collaborators
Singapore has the highest proportional share of co-invented patents with China to its total patent counts, averaging at 1.67%, followed by Taiwan with an average of 0.82%

Question 1
Question 2
Question 3
Question 4
To what extent have co-invented patents accounted for China’s total patent production share?
Who partners with China to jointly invent?
Under what type of technological fields does joint invention occur?
How the authorship and ownership of China’s co-invented patents reveal the collaboration nature?
Characteristics of the coinventorship structure (cont’d)
15
Characteristics of the coinventorship structure (cont’d)
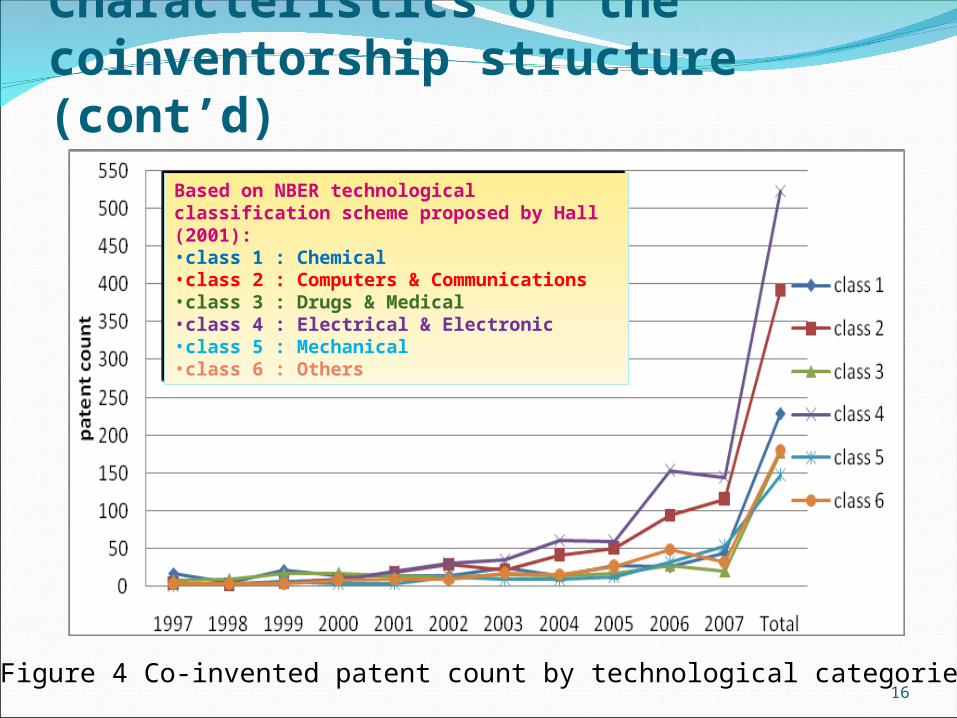
16Figure 4 Co-invented patent count by technological categories
Based on NBER technological classification scheme proposed by Hall (2001): •class 1 : Chemical•class 2 : Computers & Communications•class 3 : Drugs & Medical•class 4 : Electrical & Electronic•class 5 : Mechanical•class 6 : Others
Based on NBER technological classification scheme proposed by Hall (2001): •class 1 : Chemical•class 2 : Computers & Communications•class 3 : Drugs & Medical•class 4 : Electrical & Electronic•class 5 : Mechanical•class 6 : Others
Question 1
Question 2
Question 3
Question 4
To what extent have co-invented patents accounted for China’s total patent production share?
Who partners with China to jointly invent?
Under what type of technological fields does joint invention occur?
How the authorship and ownership of China’s co-invented patents reveal the collaboration nature?
Characteristics of the coinventorship structure (cont’d)
17

Characteristics of the coinventorship structure (cont’d)
1997 1998 1999 2000 2001 2002 2003 2004 2005 2006 2007 Avg
Avg inventor count per CIP3.58 3.89 3.54 3.55 3.36 3.32 3.63 3.46 3.73 3.96 4.62 3.91
Avg CN inventor count per CIP1.28 1.11 1.20 1.42 1.28 1.18 1.29 1.40 1.46 1.49 1.79 1.48
Share of CN inventor per CIP (%, )
35.66
28.57
33.80
39.91
37.99
35.60
35.46
40.48
39.09
37.63
38.83
37.85
Share of CN as first inventor to total CIP (%)
27.78
11.11
11.48
10.00
20.48
24.32
25.60
27.22
21.65
22.40
26.52
23.15
Patent assigned to CN1 0 2 0 3 7 9 4 9 32 114 181
Total CIPs36 27 61 60 83 111 125 158 194 384 411
1,650
Share of CN ownership to total CIP (%)
2.78 0.00 3.28 0.00 3.61 6.31 7.20 2.53 4.64 8.3327.7
410.9
7
Avg assignee count 1 1.04 0.92 0.8 0.99 1.02 1 1.02 1.04 1.04 1.24 1.01
18Table 2 Statistical summary on co-invention: authorship and ownership
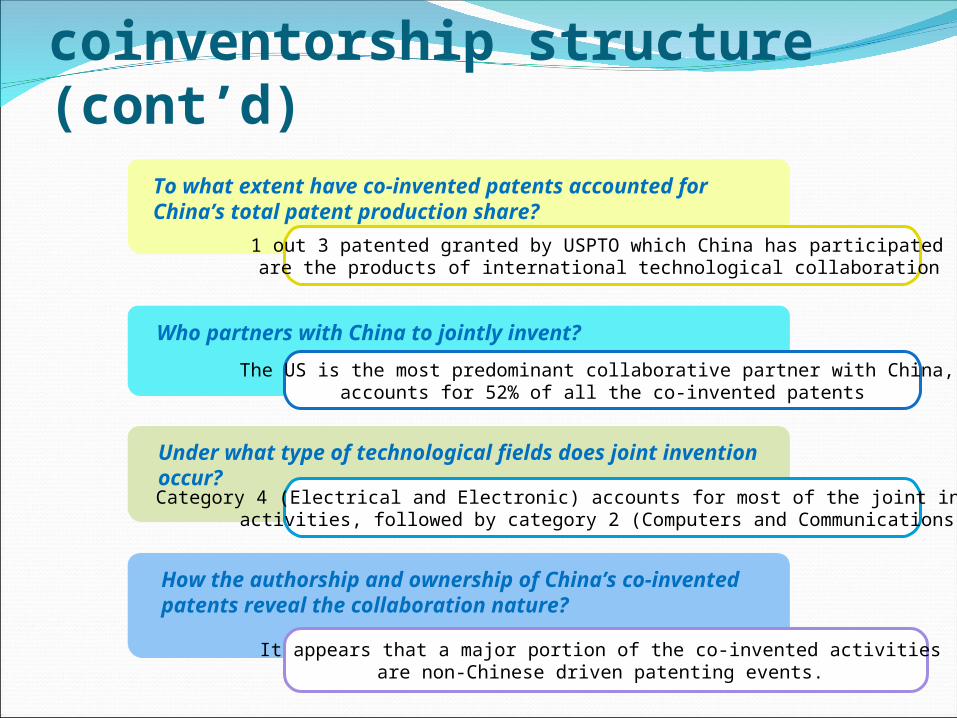
To what extent have co-invented patents accounted for China’s total patent production share?
Who partners with China to jointly invent?
Under what type of technological fields does joint invention occur?
1 out 3 patented granted by USPTO which China has participated are the products of international technological collaboration
The US is the most predominant collaborative partner with China, accounts for 52% of all the co-invented patents
Category 4 (Electrical and Electronic) accounts for most of the joint inventing activities, followed by category 2 (Computers and Communications)
Characteristics of the coinventorship structure (cont’d)
How the authorship and ownership of China’s co-invented patents reveal the collaboration nature?
It appears that a major portion of the co-invented activities are non-Chinese driven patenting events.
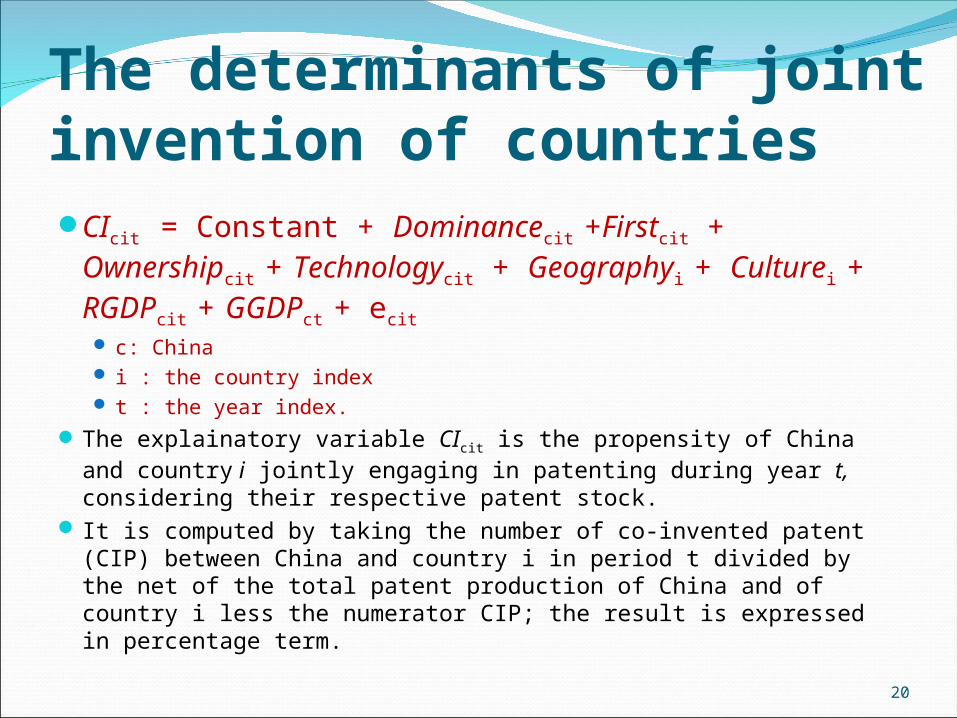
The determinants of joint invention of countriesCIcit = Constant + Dominancecit +Firstcit +
Ownershipcit + Technologycit + Geographyi + Culturei + RGDPcit + GGDPct + ecit c: China i : the country index t : the year index.
The explainatory variable CIcit is the propensity of China and country i jointly engaging in patenting during year t, considering their respective patent stock.
It is computed by taking the number of co-invented patent (CIP) between China and country i in period t divided by the net of the total patent production of China and of country i less the numerator CIP; the result is expressed in percentage term.
20

Table 3 Variable definition and descriptiveVariables Definition Source Mean S.D. Min. Max.
CI
No of co-invented patent (CIP) between China and country i in period t divided by net of the total patent production of China and of country i less the no of the co-invented patents, expressed in percentage term.
USPTO 0.22 0.4 0.01 2.21
First
Proportional share, in percentage term, of Chinese inventor being the first inventor of the CIP to the total count of CIPs between China and country i.
USPTO 22.13 23.37 0 100
Dominance
Proportional share, in percentage term, of China inventor counts to the total inventor counts in the co-invention teams between China and country i.
USPTO 31.89 11.15 11.39 57.83
Ownership
Proportional share, in percentage term, of patent ownership assigned to China entities to the total count of CIPs between China and country i.
USPTO 5.51 12.97 0 71.53
Technology
Proportional share, in percentage term, of patents pertaining to technological IT related classes (class 2 and 4 ) to all CIPs between China and country i.
NBER 38.6 33.64 0 1
GeographyDummy variable, country of APEC members is coded as 1, otherwise 0. APEC 0.7 0.46 0 1
CultureDummy variable, country of ethnic Chinese is coded as 1, otherwise 0. APEC 0.23 0.42 0 1
RGDPRelative GDP per capita of to that of country i, in percentage term. APEC 5.56 2.65 2.29 14.43
GGDPAnnual GDP growth rate of .
APEC 9.66 1.37 7.6 11.921

Table 4 Correlation matrix of variables Variables 1 2 3 4 5 6 7 8 9
1 CI 1
2 First 0.026 1
3 Dominance 0.436 0.142 1
4 Ownership 0.321 0.237 0.237 1
5 Technology 0.514 0.210 0.464 0.195 1
6 Geography 0.229 0.159 0.375 0.142 0.295 1
7 Culture 0.663 -0.049 0.436 0.114 0.691 0.356 1
8 RGDP 0.531 -0.007 0.199 0.201 0.179 0.266 0.371 1
9 GGDP 0.333 0.154 0.052 0.314 0.256 -0.100 -0.004 0.332 1
22
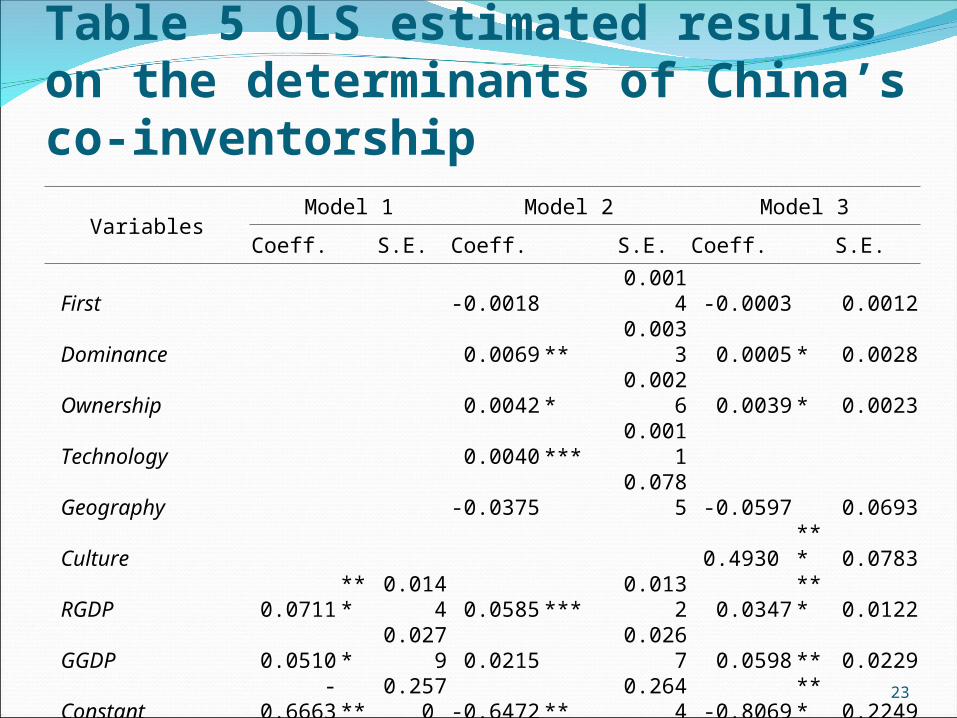
Table 5 OLS estimated results on the determinants of China’s co-inventorship
VariablesModel 1 Model 2 Model 3
Coeff. S.E. Coeff. S.E. Coeff. S.E.
First -0.0018 0.0014 -0.0003 0.0012
Dominance 0.0069 ** 0.0033 0.0005 * 0.0028
Ownership 0.0042 * 0.0026 0.0039 * 0.0023
Technology 0.0040 *** 0.0011
Geography -0.0375 0.0785 -0.0597 0.0693
Culture 0.4930 *** 0.0783
RGDP 0.0711 *** 0.0144 0.0585 *** 0.0132 0.0347 *** 0.0122
GGDP 0.0510 * 0.0279 0.0215 0.0267 0.0598 ** 0.0229
Constant -0.6663 ** 0.2570 -0.6472 ** 0.2644 -0.8069 *** 0.2249
Adj R2 0.29 0.48 0.59
No. of Observations 87 87 8723

Regression Findings
2Being Asia neighboring countries or APEC countries does not enhance the propensity to co-invent with China.
3Being having ethic Chinese affiliation is the determining factor in influencing the likelihood of having joint inventing activities with China.
4In terms of the technological realm of collaboration, our results show the technological fields for coinventorship align with the country’s relative strength.
1The propensity for having coinventorship between China and foreign partners increases with China’s GDP level.

Conclusion
25
Text in here
China has not played a prime role in these co-inventing activities. Instead, China currently plays a supporting role in the international coinventorship.
The relative high co-invented patent share to her total patent production is another indication of the dependency on or the leverage of foreign collaborators in boosting China’s international patent production.
We also observe evidence of improving autonomy as the proportion of assignment endowed to Chinese entities increases, with a positive time trend.
There is an apparent surge in China’s co-invented patents in the past decade.

Conclusion (cont’d)
Limitation and
Future Study
For future studies, researchers could look into patent citation data and address the issue of international co-inventions with a more refined quality and impact analysis.
Kostoff et al.(2007) point out that collaborating with external countries produces a substantial increase in number of Chinese articles published, and the major impact is particularly at the high end.
In this study, we assess various quantitative aspects of co-invented patents, yet we have not dealt with the qualitative aspect.

28


