36
c 2013 Loann Dorian Jean-Ren´ e Pommarel

c© 2013 Loann Dorian Jean-Rene Pommarel
PHOTOEXCITATION OF RARE EARTH AND METAL-HALIDEMOLECULES IN THE ULTRAVIOLET
BY
LOANN DORIAN JEAN-RENE POMMAREL
THESIS
Submitted in partial fulfillment of the requirementsfor the degree of Master of Science in Electrical and Computer Engineering
in the Graduate College of theUniversity of Illinois at Urbana-Champaign, 2013
Urbana, Illinois
Adviser:
Professor James Gary Eden

ABSTRACT
In the search for new sources of light and gain media for lasers, lanthanide
fluoride powders and rare earth tri-iodide salts in vapor phase have been
studied spectroscopically by photopumping in the ultraviolet. Knowing the
spectral response of these molecules with respect to incident light and un-
derstanding the energy level structure entailed would be useful to establish
their suitability for lighting or lasing. This thesis describes the spectroscopic
experiments performed, reports the measured data and analyzes them.
ii

To my parents, for their love and support
iii

ACKNOWLEDGMENTS
I would like to thank all of the people who have helped me out along the
way to fulfill what I have done. First, I would like to address my thanks
to my adviser Professor J. Gary Eden for his guidance, encouragement, and
the enthusiasm he has transmitted to me. Thanks to Darby Hewitt for his
practical advice and experimental suggestions, to “Gamma Tom” Galvin for
his theoretical supervision and precious Matlab programming tips, and to
“Scruffy Tom” Houlahan for his software and hardware troubleshooting ex-
pertise. I do not forget all my other colleagues at the Laboratory for Optical
Physics and Engineering for their assistance, good mood and friendship.
I am also grateful to Carl Johnson and the II-VI Foundation for giving me
the opportunity to perform my research at University of Illinois at Urbana-
Champaign by funding this project. Thanks also to Jay Meikrantz and Pre-
cision Glassblowing Inc. for providing samples used in the experiments.
Last but not least, special thanks goes to my family, especially Maman,
Papa and Coco for their endless support, the love they have given me and
without which I would not have been able to pursue such ambitious studies
in a foreign country. Finally I have a thought of gratitude to all of my grand-
parents, uncles, aunts, and cousins for their trust and encouragement, as well
as all my friends that made my stay in the USA a wonderful experience.
iv

TABLE OF CONTENTS
CHAPTER 1 MOTIVATION AND BACKGROUND . . . . . . . . . 1
CHAPTER 2 EXPERIMENTS . . . . . . . . . . . . . . . . . . . . . 32.1 Fluorescence of Powder Samples . . . . . . . . . . . . . . . . . 32.2 Fluorescence of Vapor Phase Samples . . . . . . . . . . . . . . 102.3 Absorption of Vapor Phase Samples . . . . . . . . . . . . . . . 132.4 Comments . . . . . . . . . . . . . . . . . . . . . . . . . . . . . 18
CHAPTER 3 DISCUSSION . . . . . . . . . . . . . . . . . . . . . . . 213.1 Photoexcitation Process . . . . . . . . . . . . . . . . . . . . . 213.2 Perspectives for Lighting with DyI3 . . . . . . . . . . . . . . . 223.3 Analysis of the ScI3 900 nm Fluorescence Feature . . . . . . . 23
CHAPTER 4 CONCLUSION AND FUTURE WORK . . . . . . . . 28
REFERENCES . . . . . . . . . . . . . . . . . . . . . . . . . . . . . . . 29
v

CHAPTER 1
MOTIVATION AND BACKGROUND
The overarching goal of the research in this thesis is to study the optical
properties of selected atoms and molecules and, more broadly, to search
for new laser gain media. To reach this target, several different types of
materials have been investigated. This document focuses on the study of
several molecules, most of which are diatomic monohalides, in the form of
powders and salts in the vapor phase.
Understanding how a material absorbs and emits photons is a key to infer-
ring molecular energy structures [1]. Once these structures are understood,
efficient approaches to producing light at desired wavelengths may then be
deduced, by optimizing the excitation process to populate an energy level of
interest. Thus, the main process under scrutiny is the interaction of matter
with light radiation, in terms of absorption or optical emission. In the latter
case, fluorescence spectra are recorded following excitation in the ultraviolet
(UV) that is provided by an argon-fluoride (ArF) or a krypton-fluoride (KrF)
excimer laser that produces a powerful laser beam at peak wavelengths of
193 nm and 248 nm, respectively.
On the one hand, interest in this thesis research has been focused on the
topic of random lasers and the study of various molecules in powder form.
This type of laser employs a disordered gain medium and no optical cav-
ity. The produced light generally contains many wavelengths emitted over
a large solid angle. Such lasing has been observed in a wide variety of me-
dia, including laser dye solutions containing microparticles [2], semiconductor
powders [3], thin films, and ceramics. An attractive aspect of random lasers
is that they do not require precisely designed mirrors or a carefully aligned
optical cavity that are required for conventional lasers. Rather, the light scat-
ters multiple times before escaping the medium, thus making random lasers
potentially less expensive and more robust than conventional laser sources.
After considering the generation of light in the interstellar medium, Letokhov
1

et al. reported in 1966 a laser with nonresonant feedback using scattering re-
flectors [4]. Later in the 1980s, Markushev et al. observed lasing in Nd-doped
laser crystal powder [5]. Eventually, lasing was first demonstrated from zinc
oxide (ZnO) powder by R. K. Thareja and A. Mitra in 2000 [6].
The second emphasis of this thesis is the optical properties of several metal-
halide diatomic molecules in the vapor phase. Such salts are a component
of virtually all metal-halide arc lamps that were developed in the 1960s and
have been in use worldwide ever since. This type of high-intensity gas dis-
charge lamp produces light by an electric arc in a mixture of mercury and
metal-halide vapors. The tube is filled with a low background pressure of
a rare gas (such as argon) that facilitates the initial strike of the arc. As
the lamp heats, the metal-halide and mercury (Hg) evaporate, producing a
high-temperature (roughly 8000 K) arc in the vapors. These salts have quite
literally revolutionized lighting by increasing the intensity of light produced
by the arc while reducing its power consumption, thus improving efficiency,
and generating an output spectrum having a color rendering index (CRI) well
above 90 (for a CRI value of 100, the maximum value, the colors of objects
are seen as they would appear under an incandescent or daylight spectrum
of the same correlated color temperature). Also, high-intensity discharge
lamps emit a greater fraction of their radiation in the visible domain than do
fluorescence and incandescent lamps. Moreover, its spectrum more closely
matches that of a 6000 K blackbody which represents approximately the solar
spectrum.
However, electrical ballast is required to regulate the arc current (to cope
with the negative resistance of electric arcs) and supply the proper voltage to
the arc. Finally, metal-halide arc lamps are widely used in public areas, ath-
letic facilities, professional lighting fixtures and projectors, as well as by the
film and entertainment industry. In fact, the metal-halide arc lamp currently
bears much of the worldwide load in total visible output power, providing
more than a GW continuously. However, the mixture of metal and metal-
halide vapors currently used in commercial lamps was determined through
a largely empirical process and little is known regarding the spectroscopic
properties and structure of the diatomics and triatomics that are produced
in the lamp by the dissociation of the triatomic “parent” molecules such as
scandium tri-iodide.
2

CHAPTER 2
EXPERIMENTS
The laser used in the following spectroscopic measurements is an LPX 105 NT
excimer laser manufactured in Germany by Lambda Physik. It is capable of
producing laser pulses from both argon fluoride (ArF) at 193 nm and krypton
fluoride (KrF) at 248 nm. The pulse energy is about 50 mJ with ArF and
up to 200 mJ with KrF; the typical repetition rate used for the experiments
is typically 10 Hz.
2.1 Fluorescence of Powder Samples
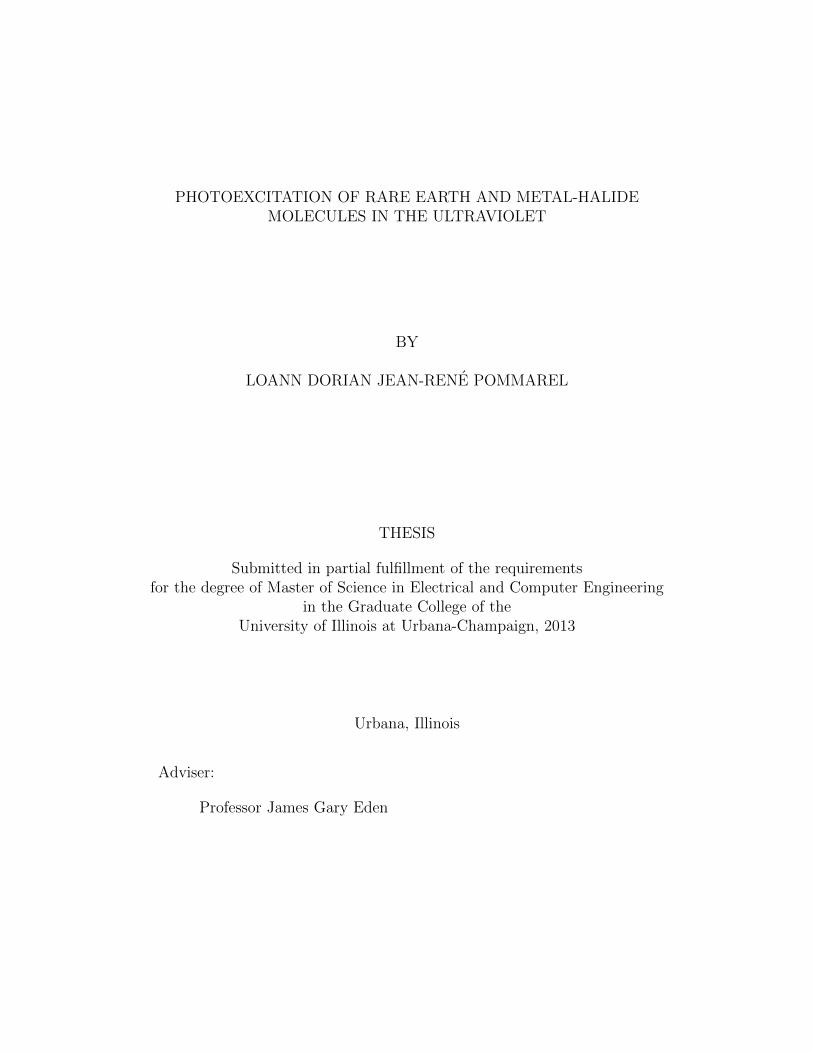
As indicated in the diagram of the experiment in Figure 2.1, the laser beam
is directed onto the sample with mirrors. The incident beam photoexcites
the molecules and induces fluorescence from the sample which is dispersed
into 4π steradians. A fiber picks up a fraction of the emitted light and directs
it into a spectrometer connected to a computer that records the data. The
behavior of the samples has been studied both at room temperature and
77 Kelvin. The latter is achieved by placing samples in a small, UV grade
quartz cell and cooling the cell with liquid nitrogen.
The powder samples examined in the experiments include ZnO (since ran-
dom lasing has already been obtained from ZnO powder and nanostructures),
as well as several lanthanide halide molecules such as LaF3, PrF3, and PrCl3.
Several of these molecules have lased previously when in the form of a single
crystal [7].
Fluorescence spectra recorded from photoexcited zinc oxide (ZnO) powder
are shown in Figure 2.2. Notice that as the sample is cooled, peak fluores-
cence shifts from 394 nm to 372 nm, and the spectral width of this dominant
peak narrows from 22 to 7 nm Full Width at Half Maximum (FWHM). Ran-
dom lasers involving ZnO material have been achieved in the form of thin
3
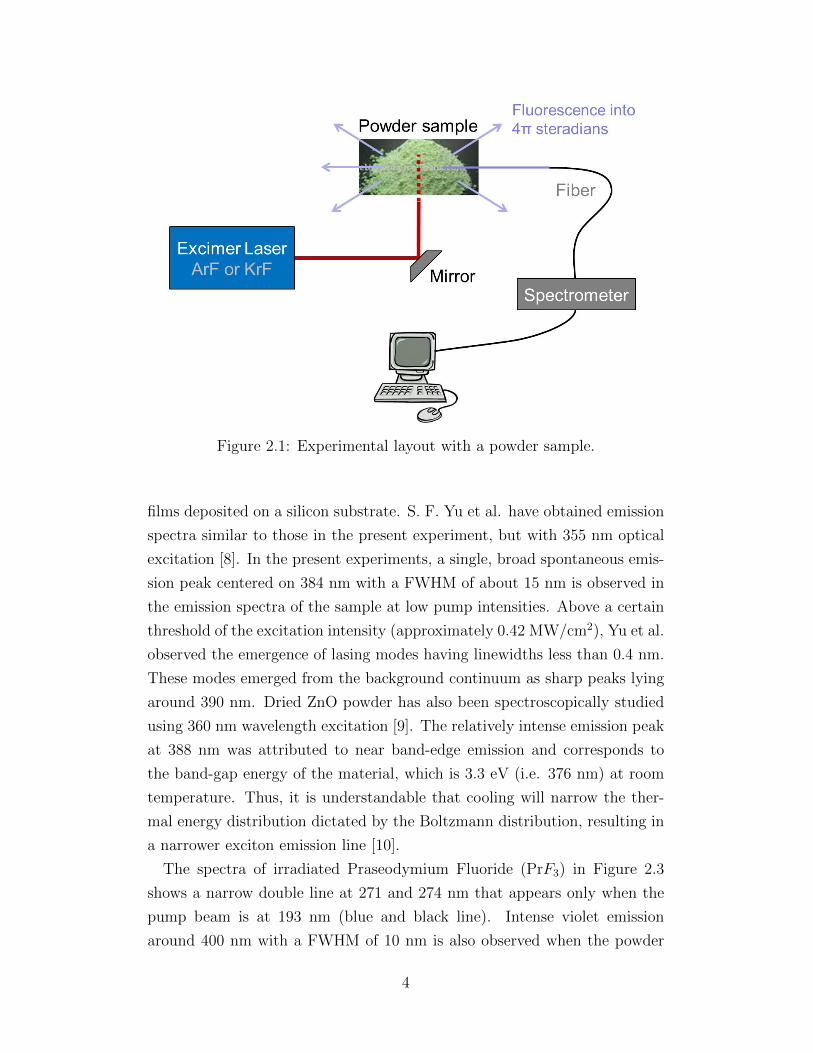
Figure 2.1: Experimental layout with a powder sample.
films deposited on a silicon substrate. S. F. Yu et al. have obtained emission
spectra similar to those in the present experiment, but with 355 nm optical
excitation [8]. In the present experiments, a single, broad spontaneous emis-
sion peak centered on 384 nm with a FWHM of about 15 nm is observed in
the emission spectra of the sample at low pump intensities. Above a certain
threshold of the excitation intensity (approximately 0.42 MW/cm2), Yu et al.
observed the emergence of lasing modes having linewidths less than 0.4 nm.
These modes emerged from the background continuum as sharp peaks lying
around 390 nm. Dried ZnO powder has also been spectroscopically studied
using 360 nm wavelength excitation [9]. The relatively intense emission peak
at 388 nm was attributed to near band-edge emission and corresponds to
the band-gap energy of the material, which is 3.3 eV (i.e. 376 nm) at room
temperature. Thus, it is understandable that cooling will narrow the ther-
mal energy distribution dictated by the Boltzmann distribution, resulting in
a narrower exciton emission line [10].
The spectra of irradiated Praseodymium Fluoride (PrF3) in Figure 2.3
shows a narrow double line at 271 and 274 nm that appears only when the
pump beam is at 193 nm (blue and black line). Intense violet emission
around 400 nm with a FWHM of 10 nm is also observed when the powder
4
3 6 0 3 8 0 4 0 0 4 2 0 4 4 00
1 0 0 0
2 0 0 0
3 0 0 0
4 0 0 0
5 0 0 0
6 0 0 0
7 0 0 0
8 0 0 0
λ p = 1 9 3 n m
λ p = 2 4 8 n mZnO
Relat
ive In
tensity
of Zn
O Flu
oresce
nce
W a v e l e n g t h ( n m )
R o o m t e m p e r a t u r e
7 7 K
Figure 2.2: Emission spectrum in the near-UV and visible domain producedby ZnO powder photoexcited at 193 nm (black and blue curves) and248 nm (grey and red curves) for different temperatures, that is, roomtemperature (black and grey curves) and 77 K (blue and red curves).
5

2 5 0 3 0 0 3 5 0 4 0 0 4 5 00
2 0 0 0
4 0 0 0
6 0 0 0
8 0 0 0
1 0 0 0 0
λ p = 2 4 8 n m
λ p = 1 9 3 n m
PrF3
Relat
ive In
tensity
of Pr
F 3 Fluo
resce
nce
W a v e l e n g t h ( n m )
3 0 0 K7 7 K
Figure 2.3: Emission spectrum of photoexcited PrF3 powder in the visibleand UV region.
6
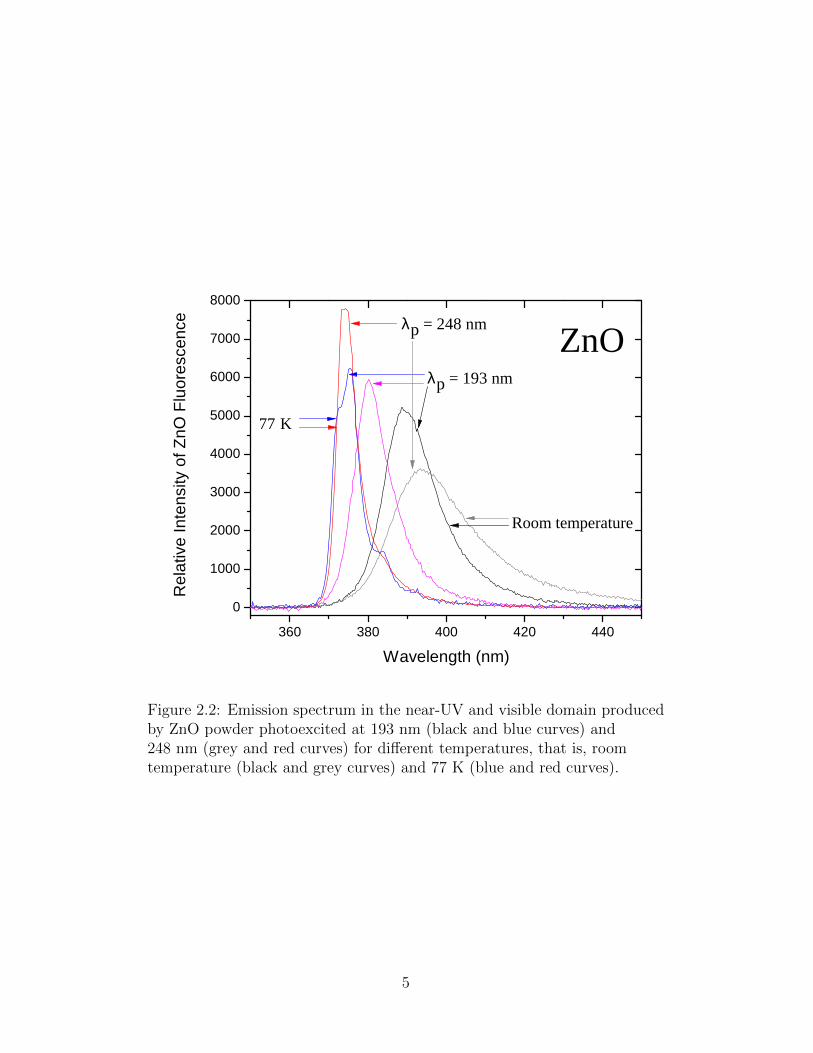
is illuminated with the ArF laser. Conversely, KrF laser excitation of the
powder produces strong continua in the mid-UV, peaking at 287 nm and
302 nm, but the violet and 270 fluorescence have vanished. This suggests
that some molecular levels are accessed only with the energy afforded by an
ArF photon (6.4 eV).
2 0 0 3 0 0 4 0 0 5 0 0 6 0 0 7 0 0 8 0 00
5 0 0
1 0 0 0
1 5 0 0
2 0 0 0
2 5 0 0
3 0 0 0S c a t t e r e d p u m p
λ p = 1 9 3 n m
λ p = 2 4 8 n mLaF3
Relat
ive In
tensity
of La
F 3 Fluo
resce
nce
W a v e l e n g t h ( n m )
3 0 0 K
7 7 K
Figure 2.4: Emission spectrum in the UV and visible domain ofphotoexcited LaF3 powders.
Figure 2.4 illustrates the photoluminescence spectrum of lanthanum tri-
fluoride (LaF3) powder. Besides a large double-band peaking at 400 and
500 nm, it depicts a peculiar hump around 300 nm that only appears under
the 248 nm excitation at room temperature.
PrCl3 powders exhibit a significantly different behavior under ArF or KrF
laser excitation. As can be seen in Figure 2.5, PrCl3 pumped by a 193 nm
radiation generates a multi-peak fluorescence band between 230 nm and
300 nm. When cooled, the bluer component separates more clearly into two
7

2 0 0 3 0 0 4 0 0 5 0 0 6 0 0 7 0 0- 2 0 0 0
0
2 0 0 0
4 0 0 0
6 0 0 0
W h i t e C r y s t a l
H y d r a t e d P r C l 3 7 H 2 0 a t 3 0 0 KC o o l e d a t 7 7 K w i t h l i q u i d N 2
R a w p o w d e r a t r o o m t e m p e r a t u r e
P r C l 3λ p = 1 9 3 n m
Relat
ive In
tensity
of Pr
Cl 3 Fluo
resce
nce
W a v e l e n g t h ( n m )
Figure 2.5: Emission spectrum in the UV and visible region resulting from193 nm photoexcitation of PrCl3 powders and by-product. The 1000intensity shifts have been introduced between the various curves for clarityand readability of the graph.
8
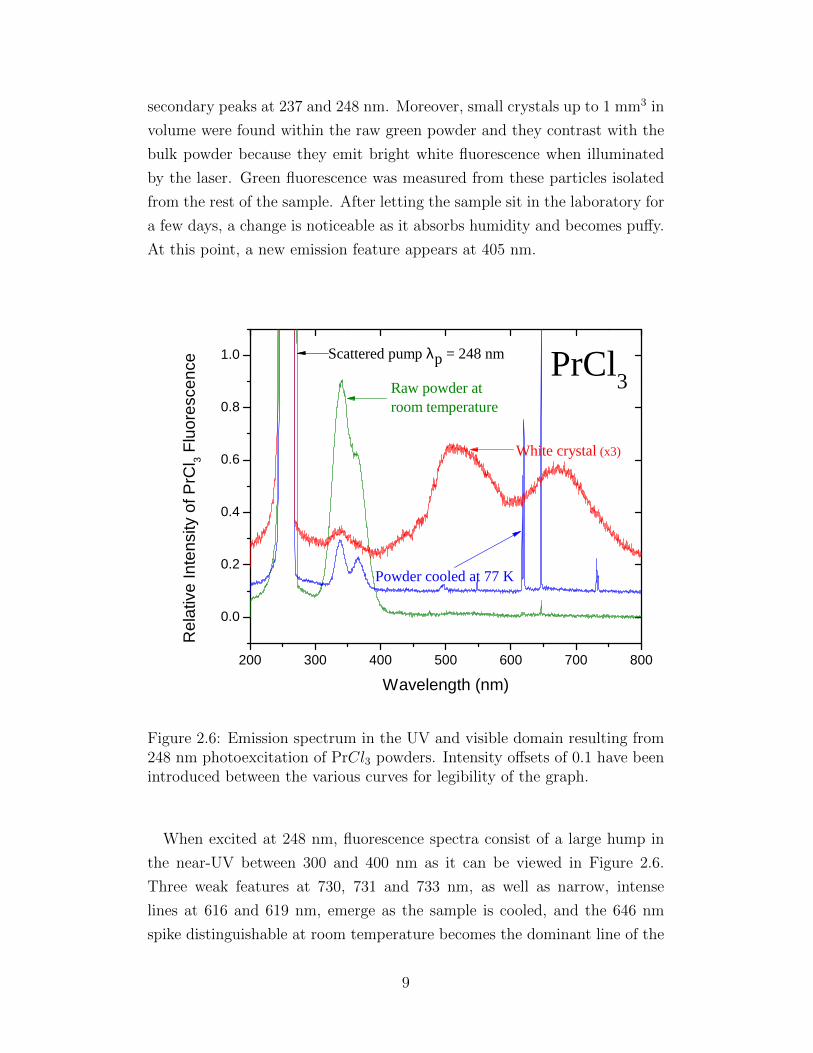
secondary peaks at 237 and 248 nm. Moreover, small crystals up to 1 mm3 in
volume were found within the raw green powder and they contrast with the
bulk powder because they emit bright white fluorescence when illuminated
by the laser. Green fluorescence was measured from these particles isolated
from the rest of the sample. After letting the sample sit in the laboratory for
a few days, a change is noticeable as it absorbs humidity and becomes puffy.
At this point, a new emission feature appears at 405 nm.
2 0 0 3 0 0 4 0 0 5 0 0 6 0 0 7 0 0 8 0 0
0 . 0
0 . 2
0 . 4
0 . 6
0 . 8
1 . 0R a w p o w d e r a tr o o m t e m p e r a t u r e
W h i t e c r y s t a l ( x 3 )
P o w d e r c o o l e d a t 7 7 K
Relat
ive In
tensity
of Pr
Cl 3 Fluo
resce
nce
W a v e l e n g t h ( n m )
S c a t t e r e d p u m p λ p = 2 4 8 n m P r C l 3
Figure 2.6: Emission spectrum in the UV and visible domain resulting from248 nm photoexcitation of PrCl3 powders. Intensity offsets of 0.1 have beenintroduced between the various curves for legibility of the graph.
When excited at 248 nm, fluorescence spectra consist of a large hump in
the near-UV between 300 and 400 nm as it can be viewed in Figure 2.6.
Three weak features at 730, 731 and 733 nm, as well as narrow, intense
lines at 616 and 619 nm, emerge as the sample is cooled, and the 646 nm
spike distinguishable at room temperature becomes the dominant line of the
9
spectrum. With regard to the spectra produced by the small crystals, a
second hump appears between 650 and 700 nm.
2.2 Fluorescence of Vapor Phase Samples
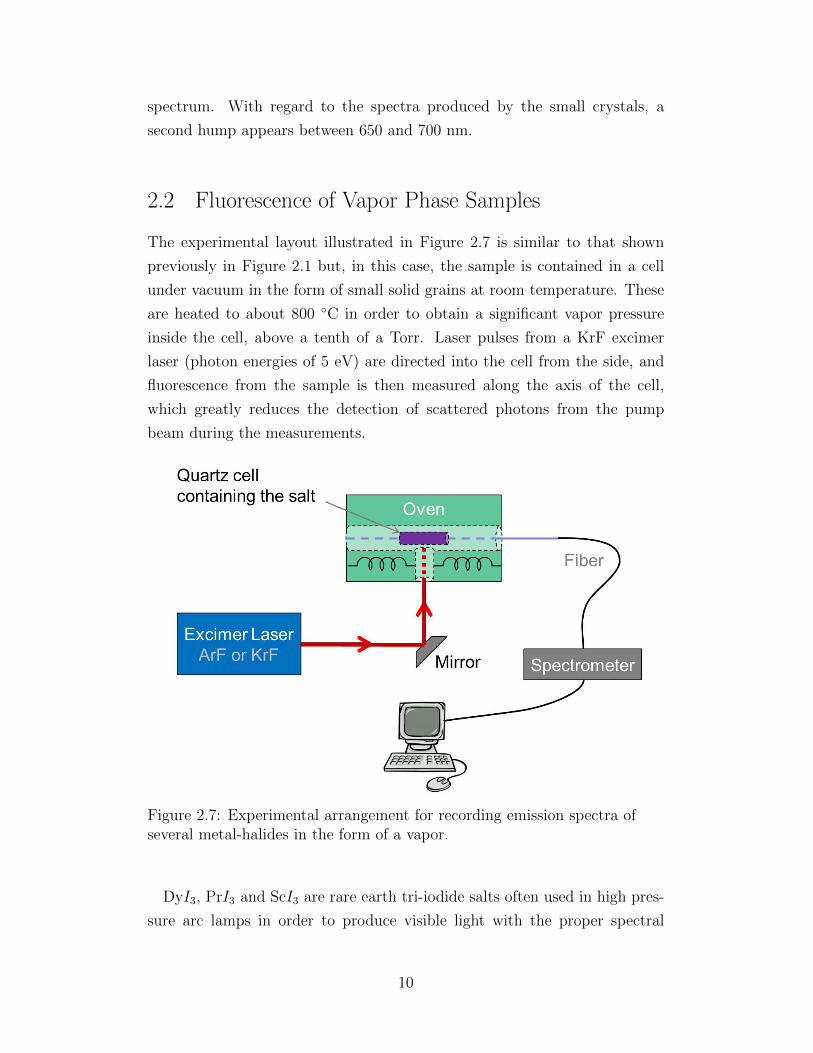
The experimental layout illustrated in Figure 2.7 is similar to that shown
previously in Figure 2.1 but, in this case, the sample is contained in a cell
under vacuum in the form of small solid grains at room temperature. These
are heated to about 800 ◦C in order to obtain a significant vapor pressure
inside the cell, above a tenth of a Torr. Laser pulses from a KrF excimer
laser (photon energies of 5 eV) are directed into the cell from the side, and
fluorescence from the sample is then measured along the axis of the cell,
which greatly reduces the detection of scattered photons from the pump
beam during the measurements.
Figure 2.7: Experimental arrangement for recording emission spectra ofseveral metal-halides in the form of a vapor.
DyI3, PrI3 and ScI3 are rare earth tri-iodide salts often used in high pres-
sure arc lamps in order to produce visible light with the proper spectral
10
properties. The sample is contained inside a cell under vacuum and com-
prises solid grains at room temperature. As the temperature of the sample
in the cell initially under vacuum increases, the salt produced vapor within
the cell and the pressure corresponding to a given temperature can be deter-
mined from the vapor pressure curves (for a thermodynamic equilibrium of
the vapor with its condensed phases and the pressure depends only on the
temperature). Formulas have been derived and can be found in the litera-
ture for the compound related to the present thesis (DyI3 [11], PrI3 [12] and
ScI3 [13]).
2 0 0 4 0 0 6 0 0 8 0 0 1 0 0 00
1 0 0 0
2 0 0 0
3 0 0 0
4 0 0 0
5 0 0 0
6 0 0 0
8 1 1 ° C - 0 . 3 t o r r
Scattered KrF pump
7 7 2 ° C - 0 . 1 t o r r
8 3 0 ° C - 0 . 5 t o r r
λ p = 2 4 8 n m
Relat
ive In
tensity
W a v e l e n g t h ( n m )
8 4 3 ° C - 0 . 7 t o r r
D y I 3
Figure 2.8: Emission spectrum in the near-UV, visible and near-IRresulting from 248 nm photoexcitation of DyI3. Each of the curves shownhas been intentionally offset for the sake of clarity.
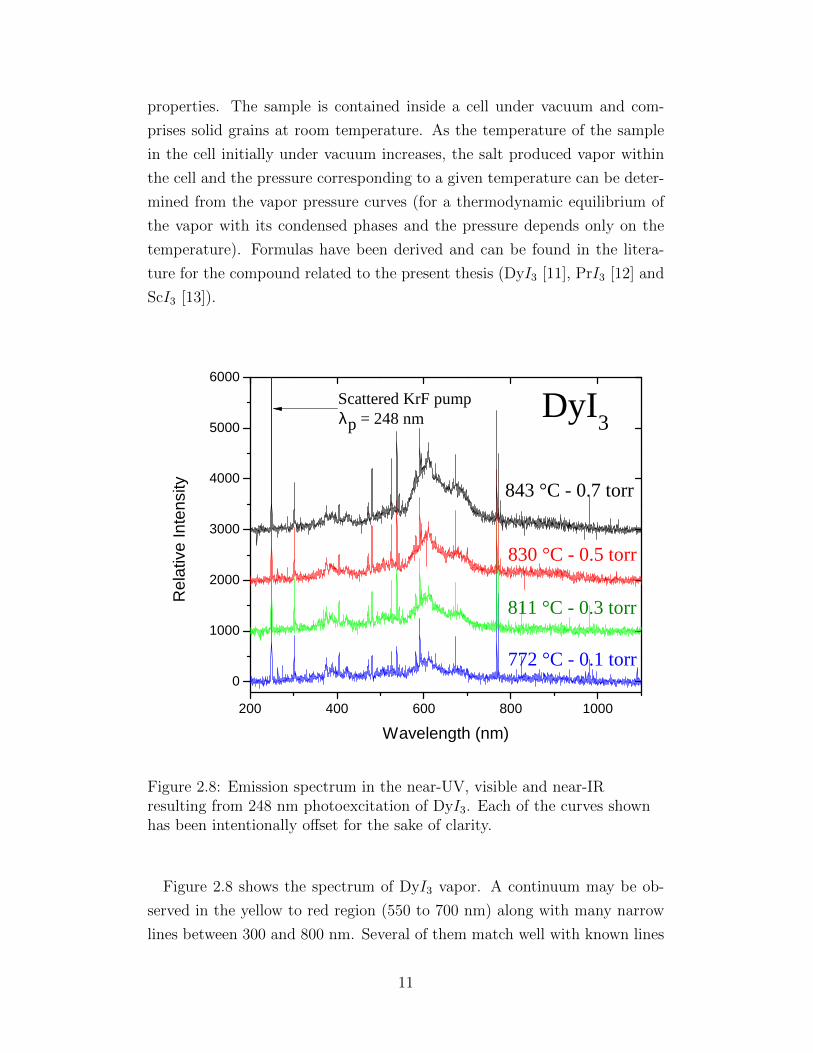
Figure 2.8 shows the spectrum of DyI3 vapor. A continuum may be ob-
served in the yellow to red region (550 to 700 nm) along with many narrow
lines between 300 and 800 nm. Several of them match well with known lines
11
of atomic dysprosium, or the singly charged ion. Emission at 479.129 nm
and 608.826 nm, for example, are attributed to neutral Dy, whereas lines at
756.296 nm and 766.678 nm originate from the ionized species Dy+.
2 0 0 4 0 0 6 0 0 8 0 0 1 0 0 00
1 0 0 0
2 0 0 0
3 0 0 0
4 0 0 0
5 0 0 0
6 0 0 0
Re
lative
Fluo
resce
nce I
ntens
ity
W a v e l e n g t h ( n m )
7 3 7 ° C - 0 . 1 t o r r
7 9 1 ° C - 0 . 5 t o r r
8 1 8 ° C - 1 t o r r
S c I 3
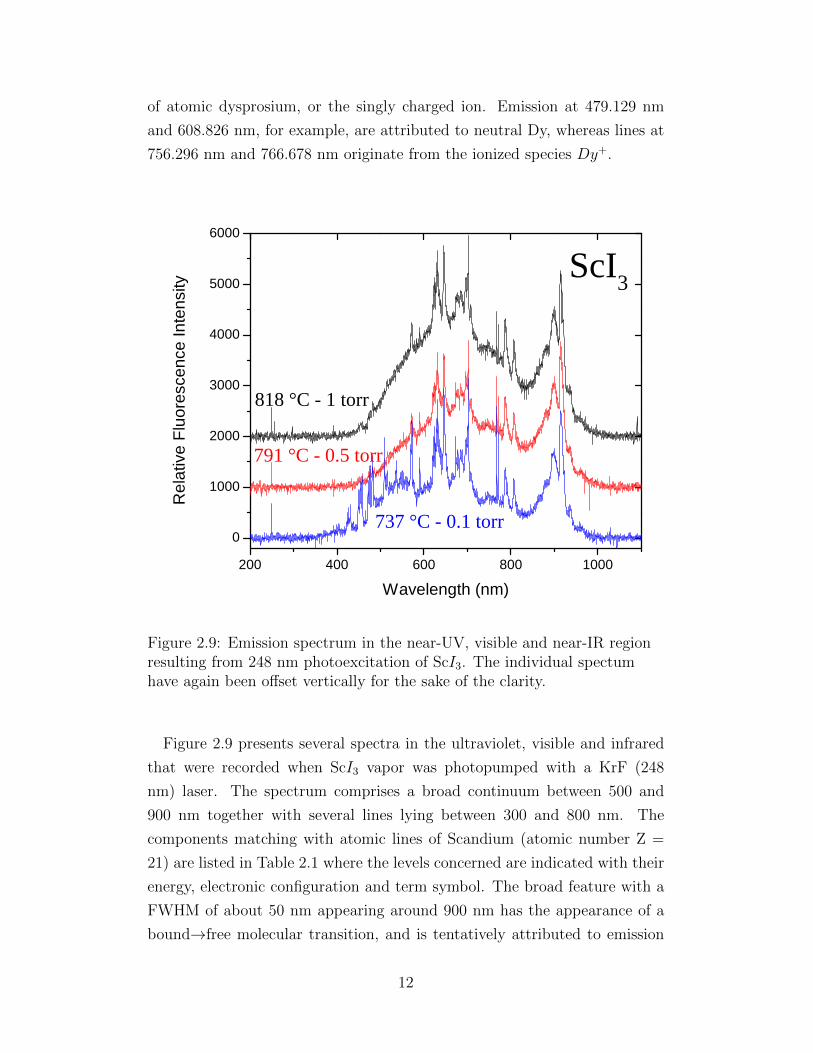
Figure 2.9: Emission spectrum in the near-UV, visible and near-IR regionresulting from 248 nm photoexcitation of ScI3. The individual spectumhave again been offset vertically for the sake of the clarity.
Figure 2.9 presents several spectra in the ultraviolet, visible and infrared
that were recorded when ScI3 vapor was photopumped with a KrF (248
nm) laser. The spectrum comprises a broad continuum between 500 and
900 nm together with several lines lying between 300 and 800 nm. The
components matching with atomic lines of Scandium (atomic number Z =
21) are listed in Table 2.1 where the levels concerned are indicated with their
energy, electronic configuration and term symbol. The broad feature with a
FWHM of about 50 nm appearing around 900 nm has the appearance of a
bound→free molecular transition, and is tentatively attributed to emission
12
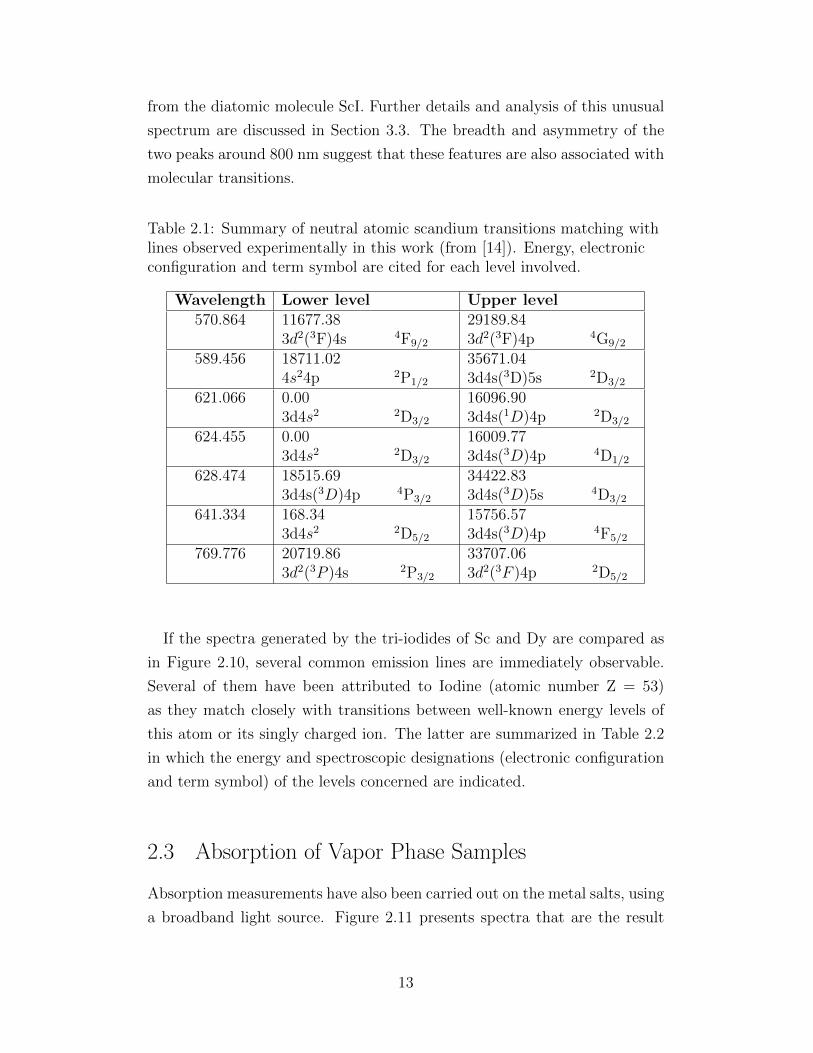
from the diatomic molecule ScI. Further details and analysis of this unusual
spectrum are discussed in Section 3.3. The breadth and asymmetry of the
two peaks around 800 nm suggest that these features are also associated with
molecular transitions.
Table 2.1: Summary of neutral atomic scandium transitions matching withlines observed experimentally in this work (from [14]). Energy, electronicconfiguration and term symbol are cited for each level involved.
Wavelength Lower level Upper level570.864 11677.38
3d2(3F)4s 4F9/2
29189.843d2(3F)4p 4G9/2
589.456 18711.024s24p 2P1/2
35671.043d4s(3D)5s 2D3/2
621.066 0.003d4s2 2D3/2
16096.903d4s(1D)4p 2D3/2
624.455 0.003d4s2 2D3/2
16009.773d4s(3D)4p 4D1/2
628.474 18515.693d4s(3D)4p 4P3/2
34422.833d4s(3D)5s 4D3/2
641.334 168.343d4s2 2D5/2
15756.573d4s(3D)4p 4F5/2
769.776 20719.863d2(3P )4s 2P3/2
33707.063d2(3F )4p 2D5/2
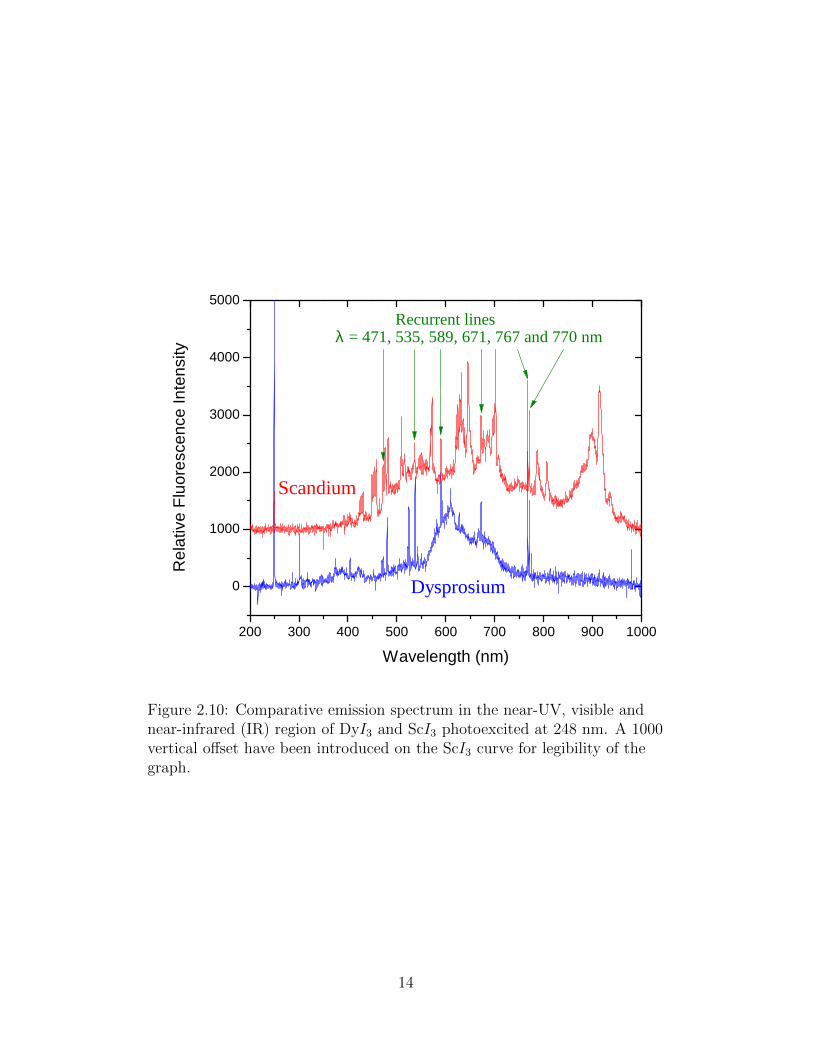
If the spectra generated by the tri-iodides of Sc and Dy are compared as
in Figure 2.10, several common emission lines are immediately observable.
Several of them have been attributed to Iodine (atomic number Z = 53)
as they match closely with transitions between well-known energy levels of
this atom or its singly charged ion. The latter are summarized in Table 2.2
in which the energy and spectroscopic designations (electronic configuration
and term symbol) of the levels concerned are indicated.
2.3 Absorption of Vapor Phase Samples
Absorption measurements have also been carried out on the metal salts, using
a broadband light source. Figure 2.11 presents spectra that are the result
13
2 0 0 3 0 0 4 0 0 5 0 0 6 0 0 7 0 0 8 0 0 9 0 0 1 0 0 0
0
1 0 0 0
2 0 0 0
3 0 0 0
4 0 0 0
5 0 0 0Recurrent lines
S c a n d i u m
λ = 4 7 1 , 5 3 5 , 5 8 9 , 6 7 1 , 7 6 7 a n d 7 7 0 n m
Relat
ive Fl
uores
cenc
e Inte
nsity
W a v e l e n g t h ( n m )
D y s p r o s i u m
Figure 2.10: Comparative emission spectrum in the near-UV, visible andnear-infrared (IR) region of DyI3 and ScI3 photoexcited at 248 nm. A 1000vertical offset have been introduced on the ScI3 curve for legibility of thegraph.
14

Table 2.2: Summary of atomic and singly ionized iodine transitions(from [15, 16]) corresponding with transitions observed in thephotodissociation of both DyI3 and ScI3.
Species Wavelength Lower level Upper levelI+ 534.51 nm 96 650.55 cm−1
5s25p3(2D◦)6s3D3
115 353.94 cm−1
5s25p3(2D◦)6p3F4
I 589.40 nm 56 092.88 cm−1
5s25p4(3P2)6s2[2]3/2
73 054.598 cm−1
5s25p4(3P1)6p2[1]◦3/2
I+ 671.88 nm 87 734.06 cm−1
5s25p3(4S◦)5d5D◦
1
102 613.52 cm−1
5s25p3(4S◦)6p3P2
I 770.02 nm 66 020.47 cm−1
5s25p4(3P2)5d2[3]5/2
79 003.596 cm−1
5s25p4(1D2)6p2[3]◦7/2
of detecting light that is transmitted by the DyI3 sample heated at several
temperatures.
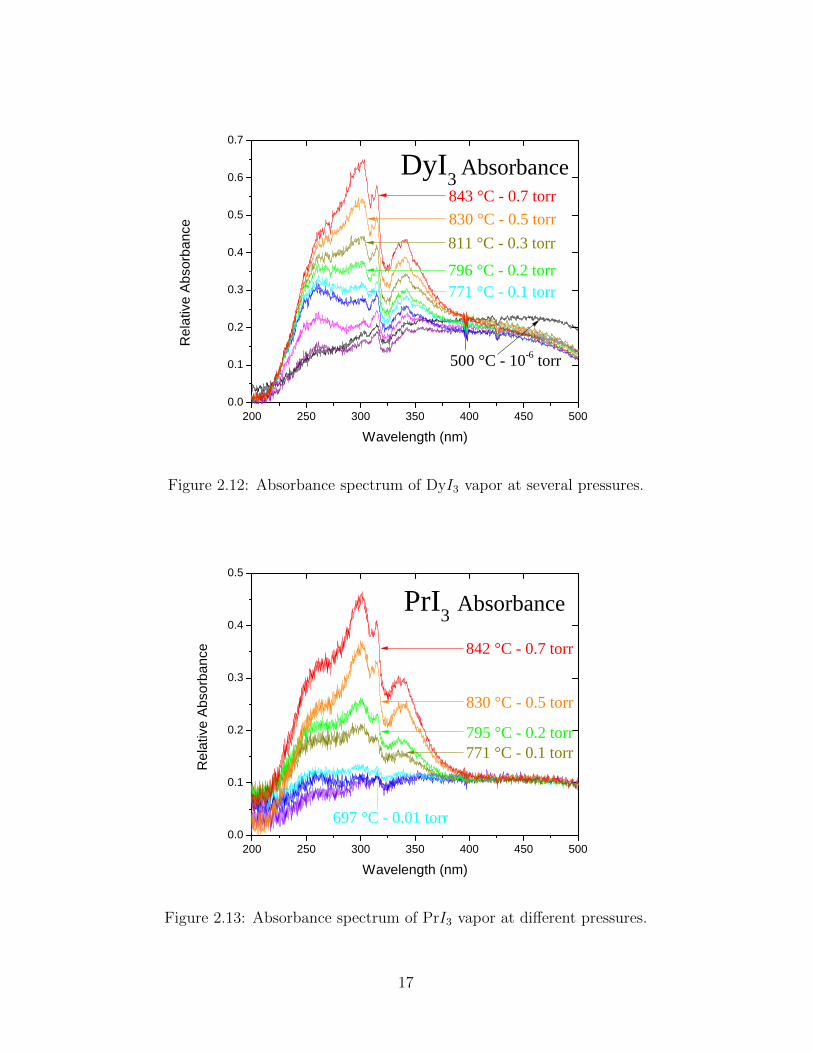
To get a better picture of the light absorbed by the sample, it is relevant to
plot the absorbance, as in Figure 2.12. Absorbance is given by the following
Beer-Lambert expression: α(T ) = ln(I(T )/I0). Most of the absorption is
concentrated in the ultraviolet region between 225 and 400 nm. The peculiar
shape of the graph may also be dependent on the spectrum of the light source,
especially below 300 nm where the incident intensity is low and the semi-log
scale could emphasize the details. This could explain the peak and null lying
between 300 and 350 nm, and the resemblance with Figure 2.13 associated
with PrI3.
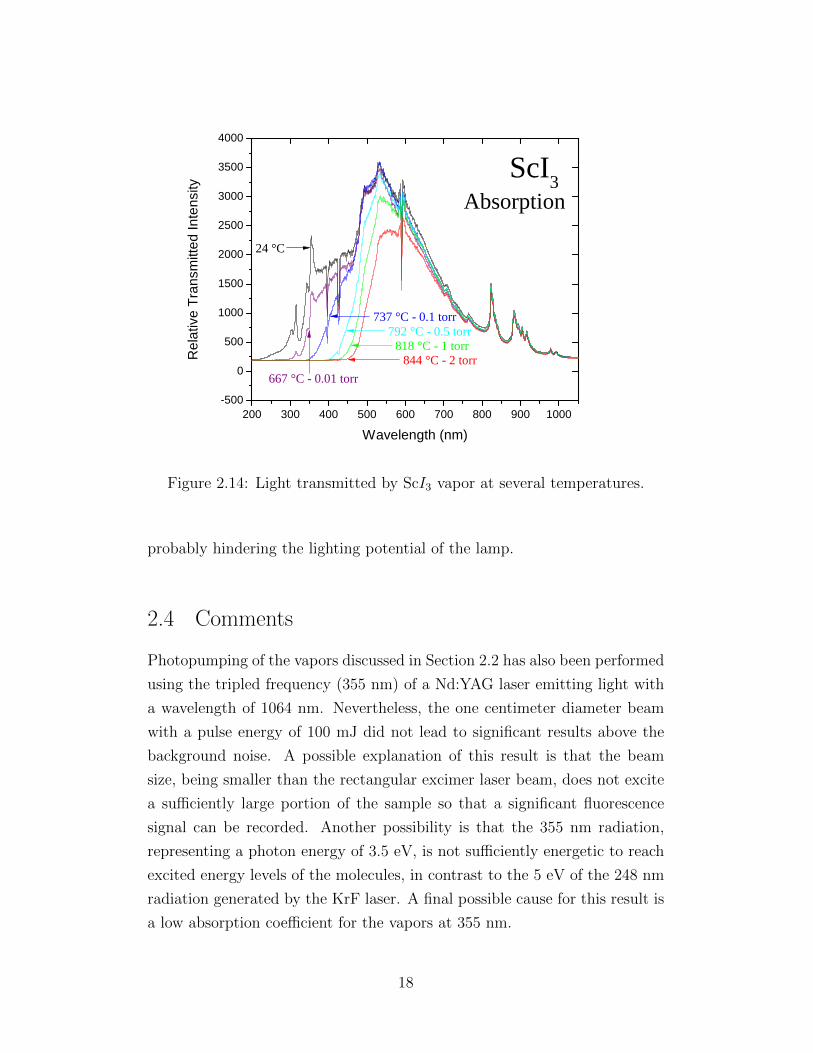
Interesting features are observed in the ScI3 absorption spectra (see Fig-
ures 2.14 and 2.15). If the absorbance spectrum of ScI3 up to 330 nm is
similar to the previous molecules described, the 350 to 550 nm range demon-
strates a rising level of absorption as the temperature and partial pressure
of the vapor increases, while absorption of higher frequencies remains at
a steady level. This means that the blue component of ScI3 emitted by
molecules located in the center of the active medium of a metal-halide arc
lamp would be partially absorbed before reaching the outside environment,
15

2 0 0 3 0 0 4 0 0 5 0 0 6 0 0 7 0 0 8 0 0 9 0 0 1 0 0 00
5 0 0
1 0 0 0
1 5 0 0
2 0 0 0
2 5 0 0
3 0 0 0
3 5 0 0
4 0 0 0
A b s o r p t i o nR e f e r e n c e s p e c t r u m :t r a n s m i t t e d l i g h t t h r o u g ht h e s a m p l e a t r o o m t e m p e r a t u r e
Relat
ive Tr
ansm
itted I
ntens
ity
W a v e l e n g t h ( n m )
D y I 3
Figure 2.11: Light transmitted through the DyI3 sample heated to differenttemperatures. The top black curve represents the measurement performedat room temperature and it reflects the spectrum of the incident light fromthe source.
16
2 0 0 2 5 0 3 0 0 3 5 0 4 0 0 4 5 0 5 0 00 . 0
0 . 1
0 . 2
0 . 3
0 . 4
0 . 5
0 . 6
0 . 7
Relat
ive Ab
sorba
nce
W a v e l e n g t h ( n m )
5 0 0 ° C - 1 0 - 6 t o r r
7 7 1 ° C - 0 . 1 t o r r7 9 6 ° C - 0 . 2 t o r r8 1 1 ° C - 0 . 3 t o r r8 3 0 ° C - 0 . 5 t o r r8 4 3 ° C - 0 . 7 t o r r
D y I 3 A b s o r b a n c e
Figure 2.12: Absorbance spectrum of DyI3 vapor at several pressures.
2 0 0 2 5 0 3 0 0 3 5 0 4 0 0 4 5 0 5 0 00 . 0
0 . 1
0 . 2
0 . 3
0 . 4
0 . 5
6 9 7 ° C - 0 . 0 1 t o r r
Relat
ive Ab
sorba
nce
W a v e l e n g t h ( n m )
7 7 1 ° C - 0 . 1 t o r r7 9 5 ° C - 0 . 2 t o r r8 3 0 ° C - 0 . 5 t o r r
8 4 2 ° C - 0 . 7 t o r r
P r I 3 A b s o r b a n c e
Figure 2.13: Absorbance spectrum of PrI3 vapor at different pressures.
17
2 0 0 3 0 0 4 0 0 5 0 0 6 0 0 7 0 0 8 0 0 9 0 0 1 0 0 0- 5 0 0
0
5 0 0
1 0 0 0
1 5 0 0
2 0 0 0
2 5 0 0
3 0 0 0
3 5 0 0
4 0 0 0
A b s o r p t i o n
Relat
ive Tr
ansm
itted I
ntens
ity
W a v e l e n g t h ( n m )
8 4 4 ° C - 2 t o r r
S c I 3
8 1 8 ° C - 1 t o r r7 9 2 ° C - 0 . 5 t o r r
7 3 7 ° C - 0 . 1 t o r r
2 4 ° C
6 6 7 ° C - 0 . 0 1 t o r r
Figure 2.14: Light transmitted by ScI3 vapor at several temperatures.
probably hindering the lighting potential of the lamp.
2.4 Comments
Photopumping of the vapors discussed in Section 2.2 has also been performed
using the tripled frequency (355 nm) of a Nd:YAG laser emitting light with
a wavelength of 1064 nm. Nevertheless, the one centimeter diameter beam
with a pulse energy of 100 mJ did not lead to significant results above the
background noise. A possible explanation of this result is that the beam
size, being smaller than the rectangular excimer laser beam, does not excite
a sufficiently large portion of the sample so that a significant fluorescence
signal can be recorded. Another possibility is that the 355 nm radiation,
representing a photon energy of 3.5 eV, is not sufficiently energetic to reach
excited energy levels of the molecules, in contrast to the 5 eV of the 248 nm
radiation generated by the KrF laser. A final possible cause for this result is
a low absorption coefficient for the vapors at 355 nm.
18
2 0 0 3 0 0 4 0 0 5 0 0 6 0 0 7 0 00 . 0
0 . 5
1 . 0
1 . 5
2 . 0
2 . 5
6 1 8 ° C - 2 . 6 m t o r r
A b s o r b a n c e
Relat
ive Ab
sorba
nce
W a v e l e n g t h ( n m )
8 4 4 ° C - 2 t o r r
S c I 3
8 1 8 ° C - 1 t o r r7 7 4 ° C - 0 . 3 t o r r7 3 7 ° C - 0 . 1 t o r r
7 1 4 ° C - 0 . 0 5 t o r r
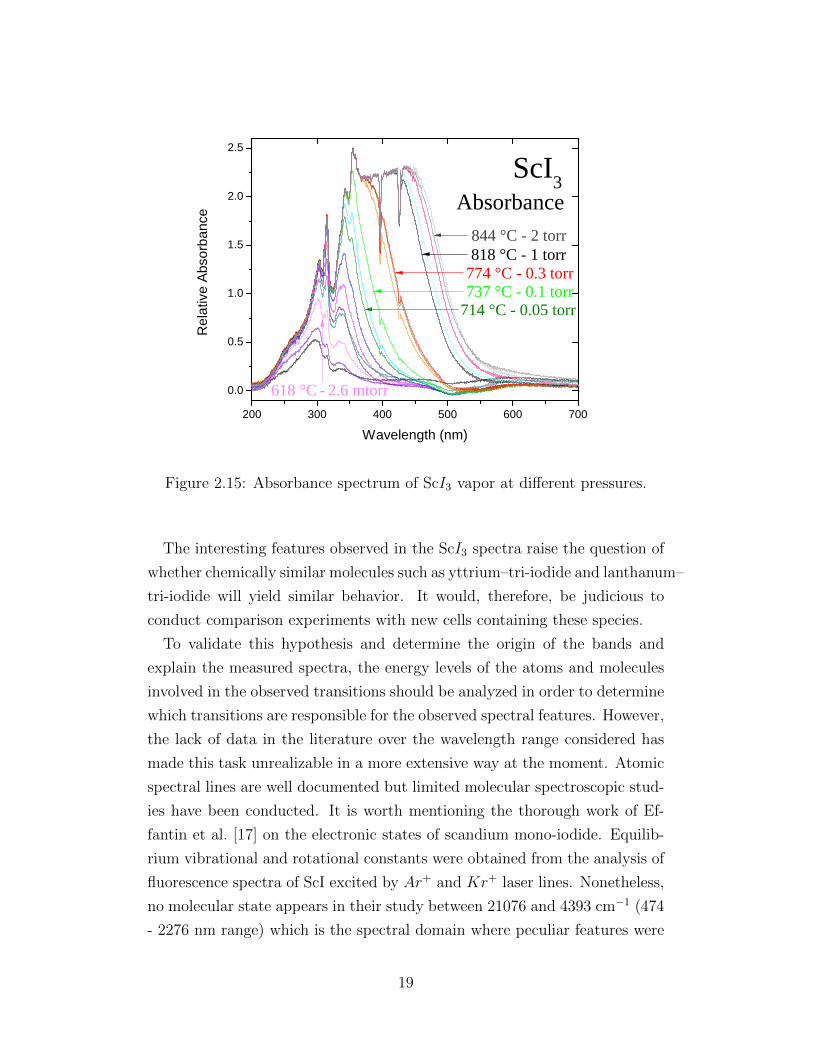
Figure 2.15: Absorbance spectrum of ScI3 vapor at different pressures.
The interesting features observed in the ScI3 spectra raise the question of
whether chemically similar molecules such as yttrium–tri-iodide and lanthanum–
tri-iodide will yield similar behavior. It would, therefore, be judicious to
conduct comparison experiments with new cells containing these species.
To validate this hypothesis and determine the origin of the bands and
explain the measured spectra, the energy levels of the atoms and molecules
involved in the observed transitions should be analyzed in order to determine
which transitions are responsible for the observed spectral features. However,
the lack of data in the literature over the wavelength range considered has
made this task unrealizable in a more extensive way at the moment. Atomic
spectral lines are well documented but limited molecular spectroscopic stud-
ies have been conducted. It is worth mentioning the thorough work of Ef-
fantin et al. [17] on the electronic states of scandium mono-iodide. Equilib-
rium vibrational and rotational constants were obtained from the analysis of
fluorescence spectra of ScI excited by Ar+ and Kr+ laser lines. Nonetheless,
no molecular state appears in their study between 21076 and 4393 cm−1 (474
- 2276 nm range) which is the spectral domain where peculiar features were
19

observed with the ScI3 sample. Xia et al. also did spectroscopic studies on
ScI but they were focused on the rotational analysis of the D1Π − X1Σ+
system in the range 613 - 704 nm [18].
20
CHAPTER 3
DISCUSSION
3.1 Photoexcitation Process
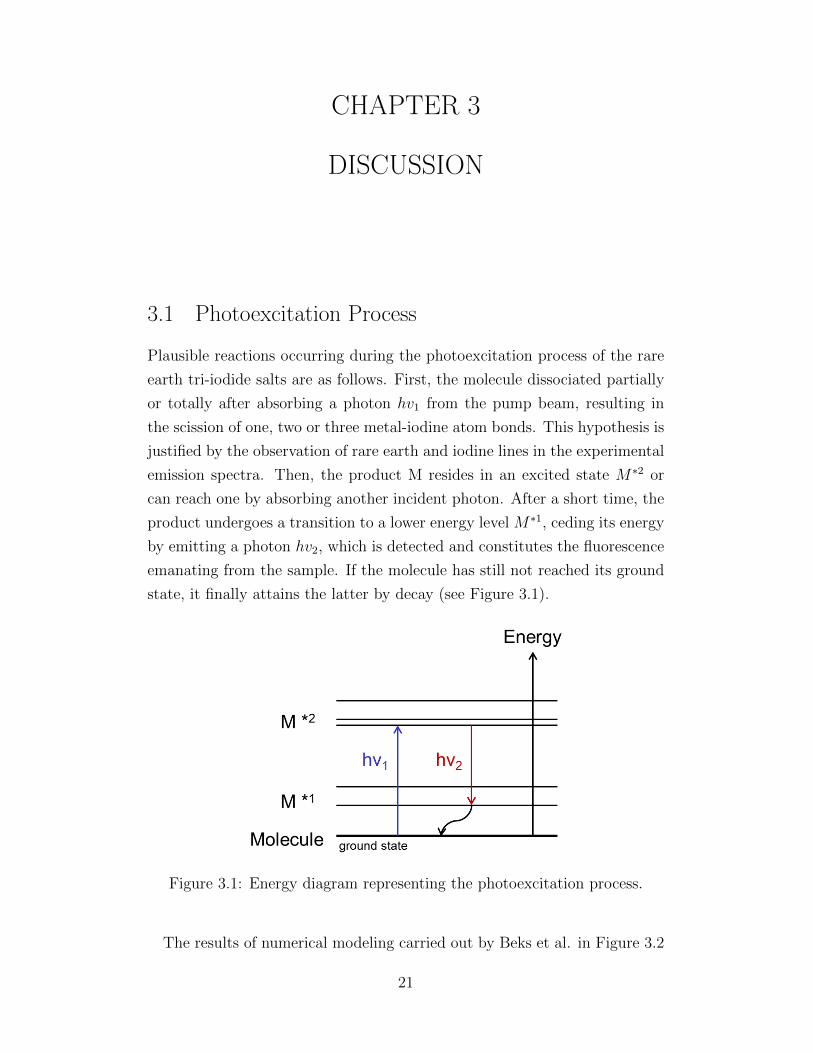
Plausible reactions occurring during the photoexcitation process of the rare
earth tri-iodide salts are as follows. First, the molecule dissociated partially
or totally after absorbing a photon hv1 from the pump beam, resulting in
the scission of one, two or three metal-iodine atom bonds. This hypothesis is
justified by the observation of rare earth and iodine lines in the experimental
emission spectra. Then, the product M resides in an excited state M∗2 or
can reach one by absorbing another incident photon. After a short time, the
product undergoes a transition to a lower energy level M∗1, ceding its energy
by emitting a photon hv2, which is detected and constitutes the fluorescence
emanating from the sample. If the molecule has still not reached its ground
state, it finally attains the latter by decay (see Figure 3.1).
Figure 3.1: Energy diagram representing the photoexcitation process.
The results of numerical modeling carried out by Beks et al. in Figure 3.2
21

shows which dysprosium compounds can be found as a function of tem-
perature in a gas mixture at local thermodynamic equilibrium [19]. DyI3
dominates by several orders of magnitude below 1000 K where a noticeable
fraction of DyI2 begins to appear and dominate above 1500 K. The temper-
ature in the experiments performed never exceeded 847 ◦C or 1120 K and,
therefore, the prevailing specie of the unexcited sample is presumed to be
DyI3.
Figure 3.2: Densities of selected species containing dysprosium, calculatedfor a mixture containing mercury, dysprosium and iodine. The elementaldysprosium pressure is 100 Pa, the elemental iodine pressure is 300 Pa andthe total pressure is 2 MPa (from [19]).
3.2 Perspectives for Lighting with DyI3
Curry et al. reported in 2012 that a strong enhancement in rare-earth vapor
densities arises when Dy is placed in equilibrium with a DyI3/InI conden-
sate, as compared to vapors in equilibrium with the pure rare-earth metal-
halides [20]. Moreover, the study was conducted for a temperature range
and salt mixtures relevant to the operation of metal-halide high-intensity
22
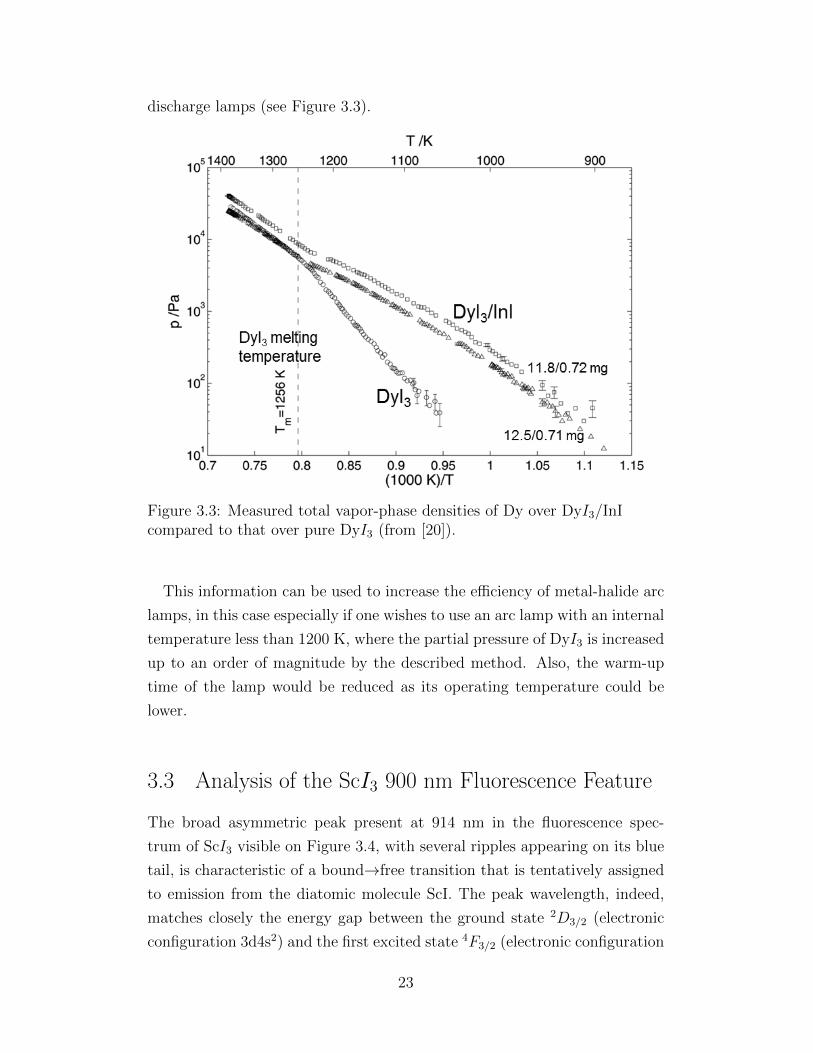
discharge lamps (see Figure 3.3).
Figure 3.3: Measured total vapor-phase densities of Dy over DyI3/InIcompared to that over pure DyI3 (from [20]).
This information can be used to increase the efficiency of metal-halide arc
lamps, in this case especially if one wishes to use an arc lamp with an internal
temperature less than 1200 K, where the partial pressure of DyI3 is increased
up to an order of magnitude by the described method. Also, the warm-up
time of the lamp would be reduced as its operating temperature could be
lower.
3.3 Analysis of the ScI3 900 nm Fluorescence Feature
The broad asymmetric peak present at 914 nm in the fluorescence spec-
trum of ScI3 visible on Figure 3.4, with several ripples appearing on its blue
tail, is characteristic of a bound→free transition that is tentatively assigned
to emission from the diatomic molecule ScI. The peak wavelength, indeed,
matches closely the energy gap between the ground state 2D3/2 (electronic
configuration 3d4s2) and the first excited state 4F3/2 (electronic configuration
23
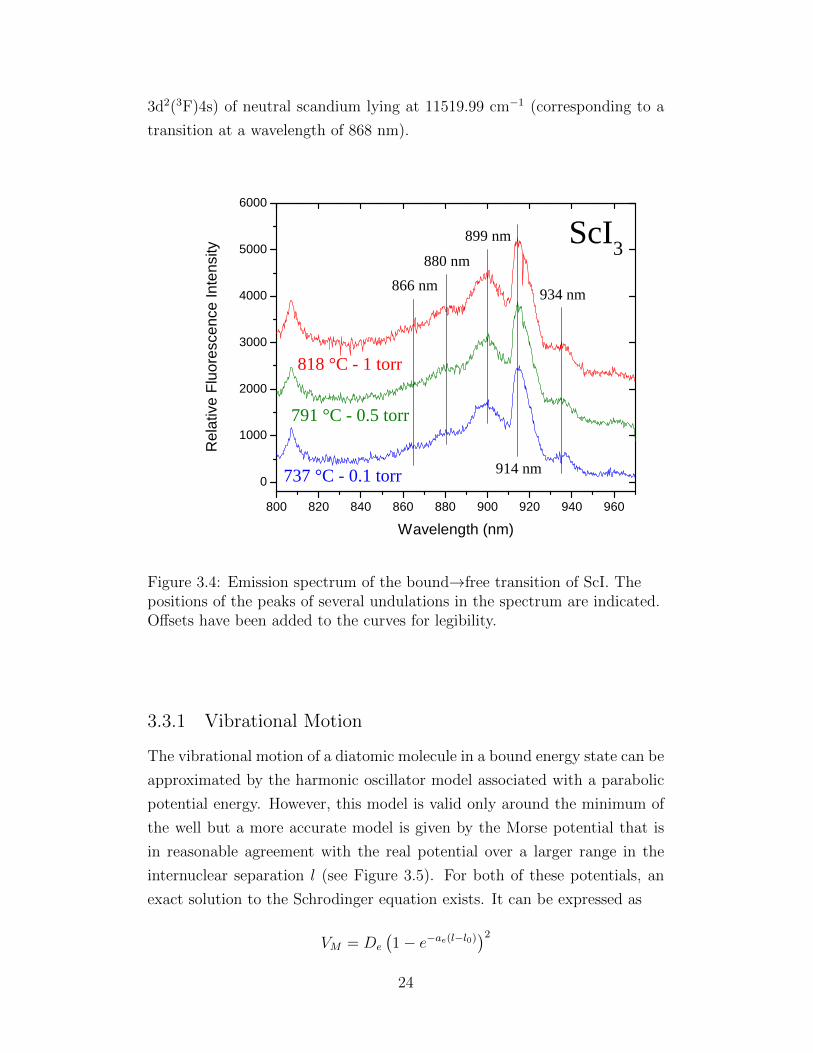
3d2(3F)4s) of neutral scandium lying at 11519.99 cm−1 (corresponding to a
transition at a wavelength of 868 nm).
8 0 0 8 2 0 8 4 0 8 6 0 8 8 0 9 0 0 9 2 0 9 4 0 9 6 00
1 0 0 0
2 0 0 0
3 0 0 0
4 0 0 0
5 0 0 0
6 0 0 0
934 nm
914 nm
Re
lative
Fluo
resce
nce I
ntens
ity
W a v e l e n g t h ( n m )
S c I 3899 nm
880 nm
866 nm
8 1 8 ° C - 1 t o r r
7 9 1 ° C - 0 . 5 t o r r
7 3 7 ° C - 0 . 1 t o r r
Figure 3.4: Emission spectrum of the bound→free transition of ScI. Thepositions of the peaks of several undulations in the spectrum are indicated.Offsets have been added to the curves for legibility.
3.3.1 Vibrational Motion
The vibrational motion of a diatomic molecule in a bound energy state can be
approximated by the harmonic oscillator model associated with a parabolic
potential energy. However, this model is valid only around the minimum of
the well but a more accurate model is given by the Morse potential that is
in reasonable agreement with the real potential over a larger range in the
internuclear separation l (see Figure 3.5). For both of these potentials, an
exact solution to the Schrodinger equation exists. It can be expressed as
VM = De
(1− e−ae(l−l0)
)2
24

Figure 3.5: Potential energy diagram of a molecular bound state using theharmonic oscillator model and the Morse potential.
where l is the internuclear separation. An energy level is described by three
independent parameters associated with the Morse potential: ωe the har-
monic vibrational frequency, χeωe the anharmonicity constant, and l0 the
equilibrium internuclear distance. The dissociation energy De can be de-
duced from the other variables using the relationship De = hωe/4χe. The
factor ae controls the width of the potential and is obtained using the equa-
tion ae =√ke/2De, where ke is the bond force constant equal to the second
derivative of the potential at the minimum of the well. Notice that per-
forming a Taylor expansion of the exponential to the first order, the Morse
potential reduces to the harmonic oscillator for l ≈ l0:
VM ≈ Deae (l − l0)2 =ke2
(l − l0)2
The Morse parameters are not available in the literature for ScI diatomic
molecule, but it is possible to infer those assuming that the observed emission
is related to a transition from a bound excited state of ScI to its dissociative
ground state.
First, the harmonic vibrational frequency is the wavelength spacing be-
tween the secondary peaks from Figure 3.4 and can roughly be determined
25
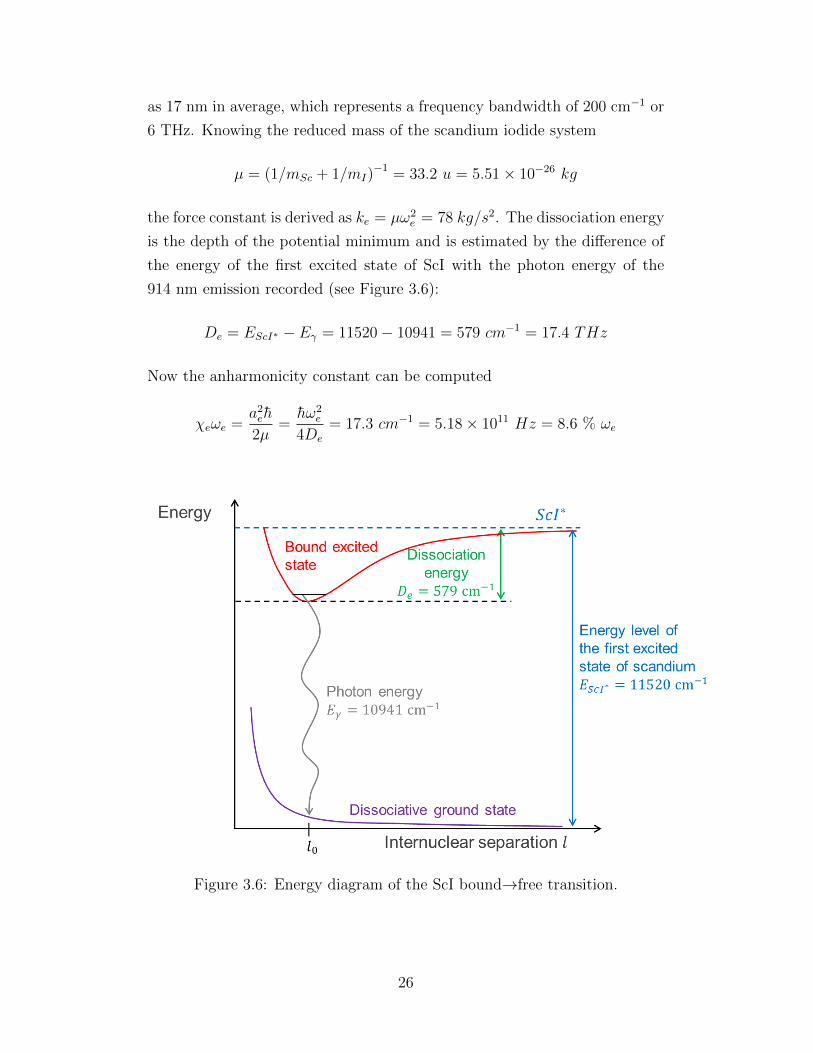
as 17 nm in average, which represents a frequency bandwidth of 200 cm−1 or
6 THz. Knowing the reduced mass of the scandium iodide system
µ = (1/mSc + 1/mI)−1 = 33.2 u = 5.51× 10⁻²⁶ kg
the force constant is derived as ke = µω2e = 78 kg/s2. The dissociation energy
is the depth of the potential minimum and is estimated by the difference of
the energy of the first excited state of ScI with the photon energy of the
914 nm emission recorded (see Figure 3.6):
De = EScI∗ − Eγ = 11520− 10941 = 579 cm−1 = 17.4 THz
Now the anharmonicity constant can be computed
χeωe =a2eh
2µ=hω2
e
4De
= 17.3 cm−1 = 5.18× 10¹¹ Hz = 8.6 % ωe
Figure 3.6: Energy diagram of the ScI bound→free transition.
26
3.3.2 Rotational Motion
The simplest approach to analyze the rotational motion of a diatomic molecule
is to use the rigid rotator model. It assumes that the distance between the
two masses is fixed and the molecule simply rotates about its center of mass.
This is a reasonable approximation as vibrational amplitudes are small com-
pared with the bond length. The discrete energy levels are given according
to the formula EJ = h2
2IJ(J+1), where the positive integer J is the rotational
quantum number. Postulating an r = 200 pm internuclear separation, which
is the order of magnitude for ionic diatomic molecules, the momentum of
inertia is inferred
I = mScr2Sc +mIr
2I = µr2 = 2.2× 10−45 kg.m2
Therefore, the spacing between energy levels is
∆EJ = EJ+1 − EJ =h2
I(J + 1) =
h2
4π2I(J + 1) = 2Bh(J + 1)
This leads to a spectrum consisting in a series of lines with an constant
separation of 2B = 0.25 cm−1 = 7.6 GHz. This value is almost one thousand
times smaller than the spacing between vibrational levels. It is too tiny to
be singled out by the laboratory spectrometer and only contributes to the
width of the vibrational lines. Thus, the bond length of the molecule could be
determined from an accurate measurement of the width of the spectral lines,
taking into consideration the number of rotational energy levels involved.
27
CHAPTER 4
CONCLUSION AND FUTURE WORK
Emission from molecules in various form photoexcited in the ultraviolet has
been achieved. Some spectral features have been attributed to atomic lines,
but at least one is considered to be a bound→free transition of the ScI di-
atomic molecule.
There are still a number of promising experiments to be performed. The
use of a monochromator having a finer resolution than the spectrometer
utilized to record the spectra displayed in this thesis could confirm some
hypothesis. The measurement of the fluorescence lifetime of the 914 nm line
would be useful to determine the lasing potential of ScI at that wavelength.
Furthermore, it would be of interest to perform photopumping using ArF on
the vapor phase sample to see if other energy levels are reached leading to the
detection of new wavelengths in the fluorescence measurements. Simulations
and alternative experimental methods to obtain parameters of the Morse
potential could also be carried out in order to confirm the suggested bound
to free transition.
28

REFERENCES
[1] G. Herzberg and K.-P. Huber, Molecular Spectra and Molecular Struc-ture. I. Spectra of Diatomic Molecules, 2nd ed., ser. Molecular Spectraand Molecular Structure. Van Nostrand Reinhold, June 1950, vol. 1.
[2] N. M. Lawandy, R. M. Balachandran, A. S. L. Gomes, and E. Sauvain,“Laser action in strongly scattering media,” Nature, vol. 368, pp. 436 –438, March 1994.
[3] H. Cao, Y. G. Zhao, H. C. Ong, S. T. Ho, J. Y. Dai, J. Y. Wu, andR. P. H. Chang, “Ultraviolet lasing in resonators formed by scatteringin semiconductor polycrystalline films,” Applied Physics Letters, vol. 73,no. 25, pp. 3656 – 3658, December 1998.
[4] R. V. Ambartsumyan, N. G. Basov, P. G. Kryukov, and V. S. Letokhov,“A laser with a nonresonant feedback,” IEEE Journal of Quantum Elec-tronics, vol. 2, no. 9, pp. 442 – 446, September 1966.
[5] V. M. Markushev, V. F. Zolin, and C. M. Briskina, “Luminescenceand stimulated emission of neodymium in sodium lanthanum molyb-date powders,” Soviet Journal of Quantum Electronics, vol. 16, no. 2,pp. 281 – 283, 1986.
[6] R. Thareja and A. Mitra, “Random laser action in zno,” Applied PhysicsB: Lasers and Optics, vol. 71, no. 2, pp. 181 – 184, August 2000.
[7] J. Hegarty and W. M. Yen, “Laser action in PrF3,” Journal of AppliedPhysics, vol. 51, no. 7, pp. 3545 – 3547, July 1980.
[8] S. F. Yu, C. Yuen, S. P. Lau, and H. W. Lee, “Zinc oxide thin-filmrandom lasers on silicon substrate,” Applied Physics Letters, vol. 84,no. 17, pp. 3244 – 3246, April 2004.
[9] M. J. Choi, K. E. McBean, P. H. R. Ng, A. M. McDonagh, P. J. May-nard, C. Lennard, and C. Roux, “An evaluation of nanostructured zincoxide as a fluorescent powder for fingerprint detection,” Journal of Ma-terials Science, vol. 43, no. 2, pp. 732 – 737, January 2008.
29
[10] C. Xu, K. Rho, J. Chun, and D. E. Kim, “Fabrication and photolu-minescence of zno hierarchical nanostructures containing Bi2O3,” Nan-otechnology, vol. 17, no. 1, pp. 60 – 64, November 2006.
[11] B. Brunetti, P. Vassallo, V. Piacente, and P. Scardala, “Vaporizationstudies of dysprosium trichloride, tribromide, and triiodide,” Journal ofChemical & Engineering Data, vol. 4, no. 3, pp. 509 – 515, March 1999.
[12] A. R. Villani, B. Brunetti, and V. Piacente, “Vapor pressures and sub-limation enthalpies of praseodymium trichloride, tribromide, and triio-dide,” Journal of Chemical & Engineering Data, vol. 45, no. 6, pp. 1167– 1172, October 2000.
[13] C. Hirayama, P. Castle, W. Snider, and R. Kleinosky, “Mass spectraand vapor pressure of scandium triiodide, and thermochemistry for thedimerization of ScI3 (g),” Journal of the Less Common Metals, vol. 57,no. 1, pp. 69 – 77, January 1978.
[14] Z. B. Ahmed and J. Verges, “Extension de l’etude du spectre d’arc duscandium. 1. resultats experimentaux,” Physica B+C, vol. 92, no. 1, pp.113 – 121, August - September 1977.
[15] L. Minnhagen, “The energy levels of neutral atomic iodine,” Arkiv Fysik,vol. 21, no. 26, pp. 415 – 465, January 1962.
[16] W. C. Martin and C. H. Corliss, “The spectrum of singly ionized atomiciodine (i ii),” Journal of Research of the National Bureau of Standards-A. Physics and Chemistry, vol. 64A, no. 6, p. 443, November 1960.
[17] C. Effantina, E. Shenyavskayab, J. d’incana, A. Bernardc,A. Topouzkhaniana, and G. Wannousa, “Electronic states of scandiummonoiodide,” Journal of Molecular Spectroscopy, vol. 185, no. 2, pp.249 – 255, October 1997.
[18] Z. H. Xia, Y. Xia, M.-C. Chan, and A. S. C. Cheung, “Laser spec-troscopy of sci: Rotational analysis of the D1π – X1σ+ system,” Jour-nal of Molecular Spectroscopy, vol. 268, no. 1-2, pp. 3 – 6, July - August2011.
[19] M. L. Beks, M. Haverlag, and J. J. A. M. van der Mullen, “A modelfor additive transport in metal halide lamps containing mercury anddysprosium tri-iodide,” Journal of Physics D: Applied Physics, vol. 41,no. 12, p. 125209, May 2008.
[20] J. J. Curry, E. G. Estupinan, W. P. Lapatovich, A. Henins, S. D. Shas-tri, and J. E. Hardis, “Observation of vapor pressure enhancement ofrare-earth metal-halide salts in the temperature range relevant to metal-halide lamps,” Applied Physics Letters, vol. 100, no. 8, p. 083505, Febru-ary 2012.
30


