c 2015 Mayank Pundir brought to you by CORE View metadata, citation and similar papers at core.ac.uk provided by Illinois Digital Environment for Access to Learning and Scholarship Repository
Submitted in partial fulfillment of the requirementsfor the degree of Master of Science in Computer Science
in the Graduate College of theUniversity of Illinois at Urbana-Champaign, 2015
Urbana, Illinois
Advisers:
Professor Roy H. CampbellAssociate Professor Indranil Gupta
ABSTRACT
Distributed graph processing frameworks have become increasingly popular forprocessing large graphs. However, existing frameworks either lack the ability torecovery from failures or support proactive recovery methods. Proactive recoverymethods like checkpointing incur high overheads during failure-free executionmaking failure recovery an expensive operation.
Our hypothesis is that reactive recovery of failures in graph processing that pro-
vides a zero-overhead alternative to expensive proactive failure recovery mecha-
nisms is feasible, novel and useful. We support the hypothesis with Zorro, a recov-ery protocol that reactively recovers from machine failures. Zorro utilizes vertexreplication inherent in existing graph processing frameworks to collectively re-build the state of failed servers. Surviving servers transfer the states of inherentlyreplicated vertices back to replacement servers, which rebuild their state using thereceived values. This fast recovery mechanism prioritizes high degree vertices en-suring high accuracy of graph processing applications. We have implemented ourapproach in two existing distributed graph processing frameworks: LFGraph andPowerGraph. Experiments using graph applications on real-world graphs showthat Zorro is able to recover between 87-92% graph state when half the clusterfails and maintains at least 97% accuracy in all experimental failure scenarios.
ii
To my parents and brother, for their love and support.
iii
ACKNOWLEDGMENTS
I would like to thank my advisers Professor Roy H. Campbell and Associate Pro-fessor Indranil Gupta for their invaluable support and advice during my Mastersdegree. They helped ensure that I had all the resources and guidance I needed tocomplete my projects. I would like to thank Luke Leslie who collaborated withme on this project. I would like to acknowledge the guidance provided by SystemsResearch Group and Distributed Protocols Research Group students like CristinaAbad, Faraz Faghri, Muntasir Rahman and Mainak Ghosh. Finally, I would like tothank my family and friends for their love and support. My research assistantshipduring my Masters degree was funded by an NSF grant.
Large graphs derived from online social networks [31], search engines [10, 9] andbiological networks [11] have made centralized methods of graph processing in-adequate. Today, graphs consisting of trillions of edges are common in the Indus-try [16]. As graphs continue to grow, distributed graph processing is employed toextract valuable information. Google’s Pregel [38] was one of the first distributedcomputation paradigms for processing large graphs. Subsequently, frameworkssuch as GraphLab [33], PowerGraph [23], LFGraph [26], GraphX [24], Pega-sus [30] and GPS [46] have progressed the field of distributed graph processing.
To process large graphs, these distributed graph processing frameworks oftenrun on clusters consisting of hundreds or even thousands of servers [38]. Asthe scale of distributed graph processing grows, failure recovery is increasinglyneeded. The most common failure recovery mechanisms in graph processingare proactive in nature i.e., they prepare for failures during failure-free execu-tion. Pregel [38], Piccolo [42], Graph Processing System (GPS) [46], DistributedGraphLab [33] and PowerGraph [23] all use proactive checkpoint-based failurerecovery mechanisms. Periodically, the framework saves a global snapshot of thesystem on reliable storage. After failures, the most recent snapshot is used to re-build the last persisted graph state, from which processing resumes. Checkpoint-based recovery mechanisms incur a high overhead in planning for future failuresduring failure-free execution. For example, determining and saving a snapshot ofapplication state on real world graphs partitioned across 16 servers increases theexecution time of one iteration of PageRank application by 8−31 times as shownin Figure 1.1
More recently, a replication based proactive failure recovery mechanism [55]has been proposed wherein K+1 replicas of each vertex are maintained to toleratea K server failure. Even though this forced replication mechanism uses inherentlycreated replicas, it incurs a constant overhead of updating the additional replicasin each iteration.
1
0 5
10 15 20 25 30 35
CA-Road Twitter UK-WebSlowdown Fac
tor
Graph Dataset
SSD HDD
Figure 1.1: Overhead of determining and saving PageRank application statecheckpoint on 16 servers (each with an SSD), using the graph datasets in Table1.1.
Dataset Vertex Count Edge CountRoad Network (CA) [6] 1.96 M 2.76 MTwitter [31] 41.65 M 1.47 BUK Web Graph [10] [9] 105.9 M 3.74 B
Table 1.1: Graph datasets.
In this thesis, we argue that failure recovery mechanisms in graph process-ing that incur an overhead during failure-free execution are unnecessary. To thisend, we introduce Zorro - a Zero-COst Reactive RecOvery protocol for distributedgraph processing frameworks. Zorro does not prepare for server failures andhence, incurs no overhead during failure-free execution. When failures occur,it exploits vertex replication inherent in distributed graph processing frameworksto collectively rebuild the state of failed servers. Surviving servers transfer thestates of inherently replicated vertices back to replacement servers which rebuildtheir state using the received states. This fast recovery mechanism prioritizes highdegree vertices ensuring high accuracy of graph processing applications.
1.1 Contributions
Our hypothesis is that reactive recovery of failures in graph processing that pro-
vides a zero-overhead alternative to expensive proactive failure recovery mecha-
2
nisms is novel, feasible and useful.We support the hypothesis using the following:
• Reactive recovery is novel: Existing graph processing frameworks eitherlack failure recovery or utilize expensive proactive recovery mechanismslike checkpointing and replication. To the best of our knowledge, we arethe first to explore reactive failure recovery in distributed graph processingframeworks. We discuss related work in Chapter 2.
• Reactive recovery is feasible: We show that reactive recovery is feasibleby implementing Zorro in two popular distributed graph processing frame-works: LFGraph [26] and PowerGraph [23]. We further discuss the moti-vation and feasibility of Zorro in Chapter 4.
• Reactive recovery is useful: We show that Zorro reactive recovery mecha-nism provides a fast, cheap and accurate alternative to expensive proactiverecovery mechanisms. We show that recovery with Zorro is fast and takesless than the time taken by an iteration of graph processing applications.We show that Zorro results in accurate recovery with popular graph pro-cessing applications exhibiting more than 97% accuracy even with half ofthe cluster servers failing. We discuss detailed experimental evaluation inChapter 7.
The rest of the thesis is organized as follows: In Chapter 2 we discuss relatedwork and compare Zorro with existing literature. In Chapter 3, we present back-ground of distributed graph processing. In Chapter 4, we motivate reactive recov-ery in graph processing. In Chapter 5, we discuss the design of Zorro reactiverecovery protocol. In Chapter 6, we classify distributed graph processing frame-works intro two categories and discuss the implementation of Zorro in each cat-egory. In Chapter 7, we experimentally evaluate the implementation of Zorro indistributed graph processing frameworks using real-world graph and applications.We discuss directions for future work in Chapter 8. Finally, we conclude the thesisin Chapter 9.
3
Chapter 2
RELATED WORK
In this thesis, we have studied failure recovery in distributed graph processingframeworks. In this chapter, we discuss existing graph processing frameworksand their recovery mechanisms.
2.1 Distributed Graph Processing Frameworks
Distributed processing of large graphs began with the advent of data-parallel para-digms such as MapReduce [19]. Such paradigms enabled processing large datasetswithout the users being aware of the distributed nature of computation. TheMapReduce paradigm and its open-source implementation Hadoop [3] utilize datapartitioned across a distributed file system [50] [22] using a series of Map, ShuffleReduce task. The MapReduce paradigm enabled the execution of graph process-ing applications such as PageRank [12], single-source shortest paths, connectedcomponents, label propagation, etc. For example, [43] discusses scalable methodsof performing graph processing with the MapReduce paradigm.
However, the research community realized the inflexibility of the MapReduceparadigm for graph processing [36] which led to paradigms customized for graphprocessing. To this end, Pregel [38], a vertex-centric abstraction suitable for dis-tributed processing of large graphs was proposed by Google.
Pregel and its open source implementations Piccolo [42] and Giraph [1] providea vertex-centric abstraction for graph processing where a user-defined program isexecuted at vertices in parallel. The vertex-centric program follows the Gather-Scatter-Apply model whereby it executes the stages of Gather, Apply and Scatter.In the Gather phase, a vertex aggregates values from incoming neighbors. In theApply phase, it processes the aggregated value to update its own value and in theScatter phase, the result of processing is transferred to outgoing neighbors.
Graph Processing System [46] is an extension of the Pregel model with op-
4
timizations such as dynamic re-partitioning of vertices to reduce communica-tion costs during the Scatter phase. To further reduce the communication costsin the Pregel model, GraphLab [34] and Distributed GraphLab‘[33] were intro-duced. GraphLab reduces the communication cost by replicating vertices onservers that need them for the Gather phase. These replicas are called Ghost ver-tices and are updated after each iteration by the master replica. PowerGraph [23],GraphLab’s successor reduces the computation cost by distributing the computa-tion load across these replicas. This is particularly useful for power-law graphs [7]where vertices may have arbitrarily large degrees. After each iteration, the mir-rored replicas send the values of their partial computation to the master replicawhich aggregates them and transfers the aggregate value back to the mirroredreplicas. LFGraph [26] further reduces the computation and communication costfor the Gather-Apply-Scatter model of graph processing. PowerLyra [15] providesan extension to PowerGraph for handling low-degree and high-degree verticesseparately to better handle graphs with power-law distribution. In LFGraph [26],vertices are mirrored only at their outgoing neighbors on remote servers reducingcommunication cost to update the mirrors.
More recently, a Resilient Distributed Datasets (RDDs) abstraction of data-parallel processing was proposed in Spark [58] [59] [5] which is used by thegraph processing framework GraphX [24] [2]. An RDD is an in-memory, read-only dataset which can be built either from data stored on persistent storage suchas disks or from other RDDs. Each RDD maintains the sequence of operationsrequired to build it in the form of a lineage graph. Different combinations of oper-ations provided by the RDD abstraction (such as map, join and filter) to transformone RDD to another enable distributed graph processing in GraphX. In additionto graph processing, GraphX also provides the operations performed by a generaldata-flow system such as graph loading and graph analytics.
2.2 Failure Recovery in Graph Processing
To the best of our knowledge, we are the first to explore reactive failure recoveryin distributed graph processing frameworks.
In the MapReduce paradigm, tasks being executed at workers are monitored bya master. The master receives regular progress reports from workers in the formof heartbeats. In the absence of heartbeats from a task, the master considers the
5
task failed and initiates a new copy of the task on a different server. Additionally,the master measures the progress of Map tasks and spawns backup copies of slowor straggler tasks. This process of mitigating straggler tasks is called speculativeexecution [19]. Fault tolerance using re-execution of tasks and speculative exe-cution are possible in MapReduce because of the independence among differentMap tasks. Re-execution of tasks is not possible in specialized graph processingframeworks because of dependence among tasks being executed across servers.The Gather-Apply-Scatter phases of graph processing need to be performed si-multaneously at all servers. Even with asynchronous computation models definedin GraphLab [33] and PowerGraph [23], tasks being executed by a server have astrong dependency on the in-memory graph state.
In specialized graph processing frameworks, two proactive recovery techniquesare prominent: (i) Replication-based recovery and (ii) Checkpointing-based re-covery.
Imitator [55] has a similar goal as Zorro of reconstructing graph state fromsurviving servers. However, it utilizes vertex replication mechanism to ensure thateach vertex has at least K + 1 replicas to tolerate a K server failure. The vertexreplication mechanism is optimized by using the replicas that are already createdon remote servers by the computation model in Hama [4]. This forced replicationmechanism incurs a constant overhead of updating the additional replicas in eachiteration. Additionally, the replication mechanism requires setting the value of K
which may be hard as failures are unpredictable.Checkpoint-based recovery is the most common failure recovery mechanism in
distributed graph processing frameworks. Pregel [38], Piccolo [42], Graph Pro-cessing System [46], Distributed GraphLab [33] and PowerGraph [23] all providefailure recovery using checkpoint-based mechanisms.
In Pregel [38], workers checkpoint the state of vertex and edge values as well asthe received messages from incoming neighbors. Additionally, the master check-points the state of global aggregators. Pregel uses a heartbeating mechanism forworker membership maintenance wherein worker failures by the absence of heart-beats. The master process reassigns partitions that failed servers were process-ing to either remaining servers or replacement servers. The authors in [38] alsopropose a confined recovery mechanism wherein workers checkpoint the state ofoutgoing messages in addition to vertex and edge values and received messages.Checkpointing of outgoing messages reduces the recovery cost by ensuring thatonly the replacement servers need to repeat the lost iterations. However, the au-
6
thors do not evaluate the overhead involved in checkpointing or during failurerecovery.
Piccolo [42], an open-source implementation of Pregel uses checkpointing alongwith user-assistance to recover from failures. At periodic intervals, it uses theChandy-Lamport snapshot algorithm [14] to determine a global snapshot of thesystem which is then checkpointed. The user needs to assist the process by check-pointing the program information. In addition to original Chandy-Lamport snap-shot algorithm based checkpointing, Distributed GraphLab [33] also proposes anasynchronous variant of the algorithm suitable for GraphLab’s asynchronous com-putation mode. The graph processing application may proceed along with thesnapshot algorithm which masks the cost of checkpointing. However, after fail-ures, some iterations may need to be repeated which increases the recovery costsignificantly.
The authors in [49] propose a partition-based recovery (PBR) mechanism thatachieves faster recovery than traditional checkpoint-based mechanisms. It does soby generating a recovery plan to parallelize and partition the recovery task amongsurviving servers with the aim of greedily optimizing the computation and com-munication cost of rebuilding the lost state. The authors claim that the proposedrecovery mechanism is the first in distributed graph processing frameworks tohandle cascading failures. It does so by initiating a new recovery plan consideringthe most recent cluster state.
All proactive recovery mechanisms incur a constant overhead even during failure-free execution of graph processing frameworks. The authors of GraphX [24] statethat checkpointing in distributed graph processing and data-flow systems is soexpensive that users never turn it on. The authors of Distributed GraphLab [33]state that checkpoint-based failure recovery makes users explicitly balance failurerecovery costs against restarting computation. Zorro adopts the stance that it isunnecessary to incur this overhead by showing that it is possible to recovery alarge percentage of the graph (87− 92%) even with half of the servers failing ina cluster without incurring any overhead during failure-free execution. Addition-ally, Zorro recovers from arbitrary number of independent and cascading serverfailures with over 97% accuracy for graph processing applications. To summarize,Zorro makes recovery from failures reactive, cheap and simple.
To reduce dependence on checkpointing, GraphX [58] uses lineage graph-basedrecovery provided by the Resilient Distributed Datasets (RDDs) abstraction pro-vided by Spark [58]. An RDD stores the sequence of transformations that were
7
used to create it and replays the transformations on the input data which present onpersisted storage. However, even with the fast reconstruction of RDDs the execu-tion time with one server failure (out of 16) incurs an overhead of 36% [24] whileperforming PageRank using the UK web graph [9] [10]. Additionally, lineage-based recovery may require checkpoints to reduce the size of lineage graphs.
2.3 Failure Recovery in Related Systems
The authors in [47] propose an optimistic failure recover mechanism for iterativedata-flow systems such as Stratosphere [21]. They claim that the processing statein such systems can reach a consistent state even after failures using “algorith-mic compensation” functions. The system allows users to specify a “compensate”function appropriate for the distributed application. They show that such functionsexist for three categories of applications involving link exploration (e.g. central-ity computation), path exploration (e.g. shortest paths computation) and matrixfactorization.
RAMCloud [41], an in-memory storage framework distributes data replicasacross servers. After failures, RAMCloud proposes fast recovery by enablingsurviving servers to participate in the state reconstruction of the failed servers inparallel.
There has been a lot of research in the field of failure recovery [20, 13]. Opti-mistic failure recovery has also been explored in distributed systems [53, 29, 51, 8]and large networks [35]. However, most of the optimistic failure recovery mech-anisms use checkpointing. Even though checkpoint-based mechanisms have beenvery effective in storage systems [22] [44] and virtualization systems [17] [40],they incur high overheads in distributed graph processing.
8
Chapter 3
BACKGROUND
Distributed processing becomes a necessity for graphs consisting of billions ofvertices and trillions of edges [16]. The MapReduce [19] distributed data pro-cessing paradigm and its open source implementation [3] enabled processing oflarge datasets without users worrying about the distributed nature of computation.MapReduce performs a specified data processing job using map, shuffle and re-duce tasks. Map tasks process the input data in parallel to create intermediatekey-value pairs, while reduce tasks process values aggregated on keys by shuffletasks. Even though the MapReduce paradigm proved very successful for batchprocessing of large datasets [18], it often proved too rigid and inefficient for largescale graph processing [38] [36]. In this chapter, we provide background of dis-tributed graph processing frameworks and failure recovery mechanisms employedby them.
3.1 Gather-Apply-Scatter Model
To eliminate the inefficiencies of graph processing using general data process-ing paradigms like MapReduce, Google proposed Pregel [38], one of the firstdistributed processing frameworks built for efficiently processing large graphs.Pregel utilizes a vertex-centric graph processing paradigm within the Gather-Apply-Scatter decomposition, wherein graph processing is divided into iterations ofa user-defined program (called vertex-program) executed in parallel at vertices.Within each iteration, a vertex program performs three phases shown in Figure3.1:
• Gather: In the gather phase, a vertex collects values form its incomingneighbors (step 1 in Figure 3.1(a)).
• Apply: In the apply phase, a vertex processes the values collected in the
9
(a) Gather (Step 1), Apply (Step2) and Scatter (Step 3) on an ex-ample graph.
(b) Phases in synchronousGather-Apply-Scatter (GAS)graph processing model.
Figure 3.1: Gather-Apply-Scatter model of distributed graph processing.
gather phase and modifies its own value based on the processing (step 2 inFigure 3.1(a)). The actual processing depends on the user-defined vertexprogram.
• Scatter: In the scatter phase, a vertex transfers the result of processing to itsoutgoing neighbors (step 3 in Figure 3.1(a)).
Consider an example using the single-source shortest paths (SSSP) graph pro-cessing application. SSSP computes the distance to every vertex in the graphfrom a user-specified source vertex. In the first iteration, vertices do not gatherany values and instead perform an initialization step. The initialization assigns 0to the source vertex and infinity to the remaining (non-source) vertices. Vertexvalues are then transferred to outgoing neighbors, combined with the weight ofconnecting edges if edges are associated with weights. In subsequent iterations,each vertex collects values from incoming neighbors in the gather phase, and thenupdates its current value as the minimum value from the collected messages inthe apply phase. The updated value therefore represents the vertex’s current min-imum distance from the source vertex. If the value of a vertex is changed in thisiteration, it performs the scatter phase by transferring its own value (plus the edgeweight of its outgoing edges) to the local outgoing neighbors. This iterative pro-cess converges when no vertex undergoes an update. Any vertices that still haveinfinity as their associated value are not reachable from the source.
Figure 3.1 shows the stages involved in a synchronous GAS model. The graphis first partitioned across the cluster servers. The graph processing application
10
then proceeds in iterations. In each iteration, vertices gather values from incomingneighbors, process and apply the values, and then scatter the results to their outgo-ing neighbors. More recently, an edge-centric graph processing paradigm [45] hasbeen proposed. In edge centric iterations [45], edges gather values from sourcevertices and scatter to target vertices. In the Gather-Apply-Scatter model, the val-ues associated with vertices and/or edges collectively form the graph state. In therest of this thesis, we will use the terms state and value interchangeably.
In the synchronous GAS decomposition, the gather, apply and scatter stages ineach iteration are synchronized using barriers to ensure that all servers executethese stages simultaneously. GraphLab [34] [33] and PowerGraph [23] also pro-vide an asynchronous computation model which may benefit iterative machinelearning applications such as Alternating Least Squares (ALS) [27] and GradientDescent [56].
3.2 Distributed Graph Processing Frameworks
Graph Processing System [22], GraphLab [34] [33], PowerGraph [23] and LF-Graph [26] have all extended the original distributed graph processing paradigmintroduced by Pregel [38]. In this section, we discuss the computation and com-munication models used in popular distributed graph processing frameworks.
In Pregel’s communication model, a server transfers all messages sent by localvertices to neighboring vertices on remote servers. This action may require trans-ferring multiple copies of a message to a remote server if multiple neighbors of avertex reside on that server. To reduce the communication overhead by removingsuch redundancy, GraphLab [33] introduced the concept of ghost vertices. Afterpartitioning vertices across servers, GraphLab creates these ghost vertices on eachserver for neighbors of its local vertices. These ghost vertices are updated aftereach iteration.
The authors of PowerGraph [23] observed that performing computation on avertex requires collecting values from neighbors, which may be very expensivefor high-degree vertices prominent in power-law graphs [52]. To this end, Pow-erGraph proposes partitioning edges across servers where each edge is assignedto exactly one server. For vertices having edges on multiple servers, one of thecopies is labeled as the master while others as mirrors. Mirrors help reduce thecomputation load on the master replica. In each iteration, the master and the mir-
11
rors of each vertex perform partial computation based on the neighbors availableat their respective servers. After each iteration, all mirrors transfer their values tothe master which combines the values and transfers the combined result back tothe mirrors.
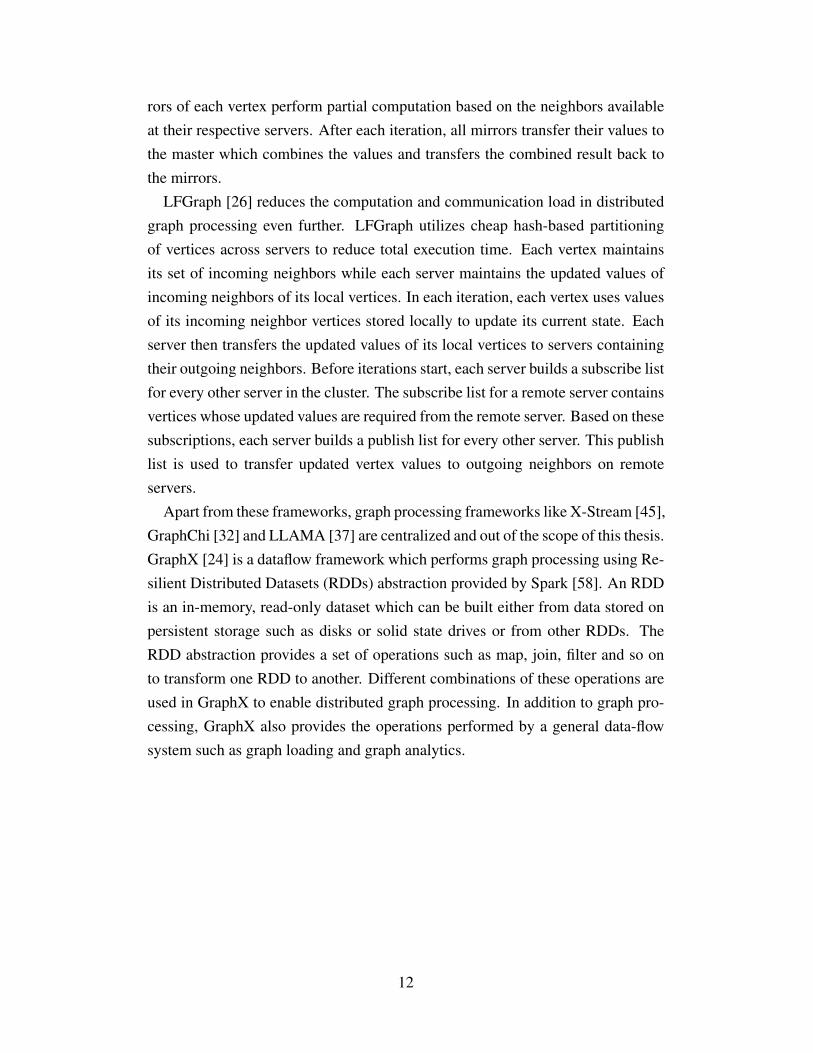
LFGraph [26] reduces the computation and communication load in distributedgraph processing even further. LFGraph utilizes cheap hash-based partitioningof vertices across servers to reduce total execution time. Each vertex maintainsits set of incoming neighbors while each server maintains the updated values ofincoming neighbors of its local vertices. In each iteration, each vertex uses valuesof its incoming neighbor vertices stored locally to update its current state. Eachserver then transfers the updated values of its local vertices to servers containingtheir outgoing neighbors. Before iterations start, each server builds a subscribe listfor every other server in the cluster. The subscribe list for a remote server containsvertices whose updated values are required from the remote server. Based on thesesubscriptions, each server builds a publish list for every other server. This publishlist is used to transfer updated vertex values to outgoing neighbors on remoteservers.
Apart from these frameworks, graph processing frameworks like X-Stream [45],GraphChi [32] and LLAMA [37] are centralized and out of the scope of this thesis.GraphX [24] is a dataflow framework which performs graph processing using Re-silient Distributed Datasets (RDDs) abstraction provided by Spark [58]. An RDDis an in-memory, read-only dataset which can be built either from data stored onpersistent storage such as disks or solid state drives or from other RDDs. TheRDD abstraction provides a set of operations such as map, join, filter and so onto transform one RDD to another. Different combinations of these operations areused in GraphX to enable distributed graph processing. In addition to graph pro-cessing, GraphX also provides the operations performed by a general data-flowsystem such as graph loading and graph analytics.
12
Chapter 4
MOTIVATION
We define failure recovery in distributed graph processing systems as the recoveryof the graph state from the iteration on which failures occurred. In an ideal sce-nario, failure recovery mechanisms in distributed graph processing frameworksshould exhibit the following three characteristics:
• Complete failure recovery: A failure recovery mechanism should be ableto recover the entire state of graph processing application after failures andmaintain complete accuracy of results.
• Zero-overhead failure recovery: A failure recovery mechanism should notincur any overhead preparing for failures during failure-free execution.
• Fast failure recovery: A failure recovery mechanism should be able torecover from any number of failures quickly.
It is difficult for a failure recovery mechanism to exhibit all three characteristics;it must choose one out of costless failure recovery and complete failure recovery.This is because, after server failures, the in-memory state of the graph applicationwill be lost if not persisted. On the other hand, if the in-memory state of the graphapplication is persisted, it will incur an overhead during failure-free execution.
4.1 Limitations of Proactive Approaches
Existing failure recovery mechanisms in distributed graph processing are proac-tive in nature and can be classified into the following two categories: (i) Check-point -based recovery mechanisms, and (ii) Replication-based recovery mecha-nisms. Both categories of proactive failure recovery mechanisms prefer completefailure recovery over costless failure recovery.
13
(a) Proactive checkpointing-based failure recovery in dis-tributed graph processing.
(b) Reactive replication-based failure recovery in dis-tributed graph processing.
Figure 4.1: Proactive vs. reactive failure recovery in distributed graph processing.
4.1.1 Checkpoint-based recovery mechanisms
Checkpoint-based failure recovery mechanisms are most common in distributedgraph processing frameworks. Pregel [38], Piccolo [42], Graph Processing Sys-tem [46], Distributed GraphLab [33] and PowerGraph [23] all use checkpoint-based failure recovery mechanisms. An example checkpoint-based failure recov-ery mechanism is shown in Figure 4.1(a). These mechanisms periodically check-point a snapshot of the graph state. After failures, computation resumes by loadingthe previously saved checkpoint. Even though these mechanisms achieve com-plete recovery, the processes of snapshot determination and checkpointing incurhigh overhead during failure-free execution, violating the costless failure recoverycharacteristic of an ideal mechanism.
Checkpoint-based failure recovery mechanisms have been successful in storagesystems [22] [44] and virtualization systems [17] [40]. However, we argue thatthey incur unnecessary overhead for distributed graph processing applications be-
14
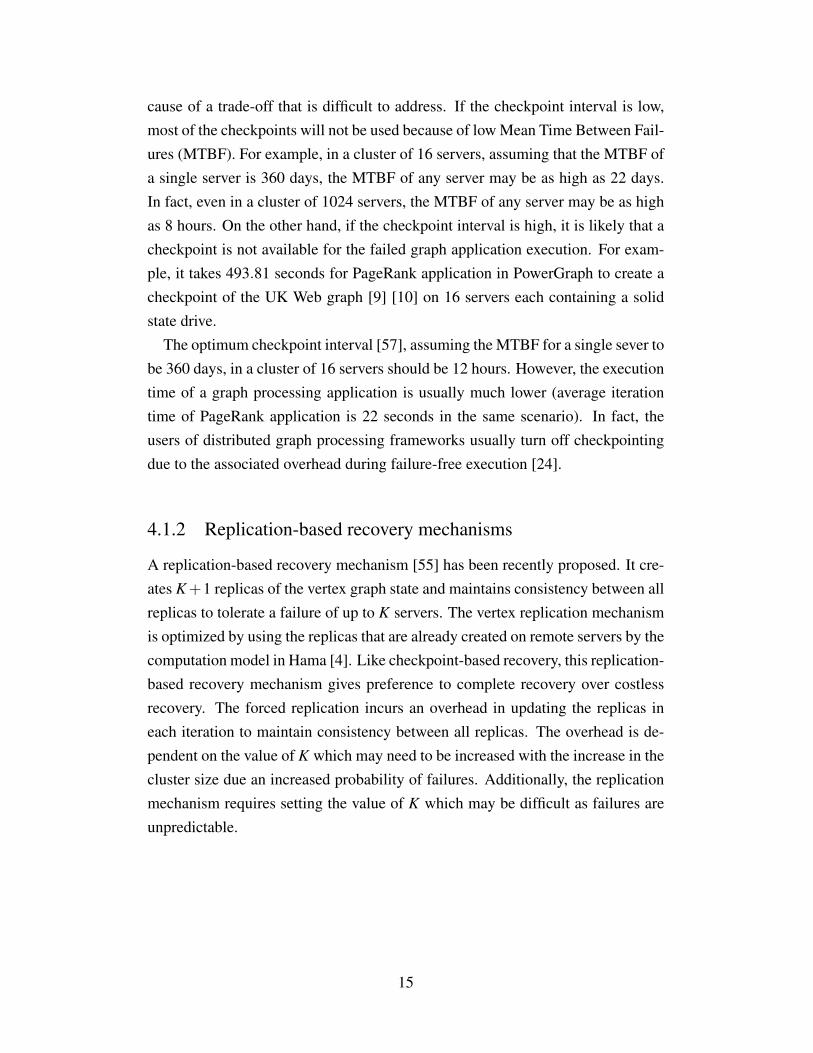
cause of a trade-off that is difficult to address. If the checkpoint interval is low,most of the checkpoints will not be used because of low Mean Time Between Fail-ures (MTBF). For example, in a cluster of 16 servers, assuming that the MTBF ofa single server is 360 days, the MTBF of any server may be as high as 22 days.In fact, even in a cluster of 1024 servers, the MTBF of any server may be as highas 8 hours. On the other hand, if the checkpoint interval is high, it is likely that acheckpoint is not available for the failed graph application execution. For exam-ple, it takes 493.81 seconds for PageRank application in PowerGraph to create acheckpoint of the UK Web graph [9] [10] on 16 servers each containing a solidstate drive.
The optimum checkpoint interval [57], assuming the MTBF for a single sever tobe 360 days, in a cluster of 16 servers should be 12 hours. However, the executiontime of a graph processing application is usually much lower (average iterationtime of PageRank application is 22 seconds in the same scenario). In fact, theusers of distributed graph processing frameworks usually turn off checkpointingdue to the associated overhead during failure-free execution [24].
4.1.2 Replication-based recovery mechanisms
A replication-based recovery mechanism [55] has been recently proposed. It cre-ates K+1 replicas of the vertex graph state and maintains consistency between allreplicas to tolerate a failure of up to K servers. The vertex replication mechanismis optimized by using the replicas that are already created on remote servers by thecomputation model in Hama [4]. Like checkpoint-based recovery, this replication-based recovery mechanism gives preference to complete recovery over costlessrecovery. The forced replication incurs an overhead in updating the replicas ineach iteration to maintain consistency between all replicas. The overhead is de-pendent on the value of K which may need to be increased with the increase in thecluster size due an increased probability of failures. Additionally, the replicationmechanism requires setting the value of K which may be difficult as failures areunpredictable.
15
4.2 Reactive Failure Recovery
Zorro, a reactive failure recovery mechanism, gives preference to zero-overheadrecovery over complete recovery. An example reactive failure recovery mecha-nism is shown in Figure 4.1(b). Zorro does not prepare for failures and incurszero overhead during failure-free execution. When failures occur, it utilizes graphstate inherently replicated in distributed graph processing frameworks at survivingservers to rebuild the state of failed servers. Graph state is replicated in distributedgraph processing frameworks in the following forms:
• Messages: Servers maintain messages received from incoming neighborspresent on remote servers from which the state of incoming neighbors canbe derived. For example, Pregel [38] and its open source implementationsGiraph [1] and Piccolo [42].
• Shadows: Servers maintain shadow copies of incoming neighbors presenton remote servers from which the state of the incoming neighbors can bederived. For example, LFGraph [26].
• Mirrors: Servers maintain mirrored copies of both incoming and outgoingneighbors present on remote servers from which their sate can be derived.For example, distributed GraphLab [33] and PowerGraph [23].
As Zorro prefers zero-overhead recovery over complete recovery, a fraction ofthe most recent graph state is lost in recovering from failures. The fraction of thegraph state that is recovered by Zorro depends on the following:
• Structure of the graph used for executing graph processing applications.
• Partitioning function used for initial graph partitioning across cluster servers.
• Graph computation and communication model used by the framework whichdetermines the graph state that is replicated across servers.
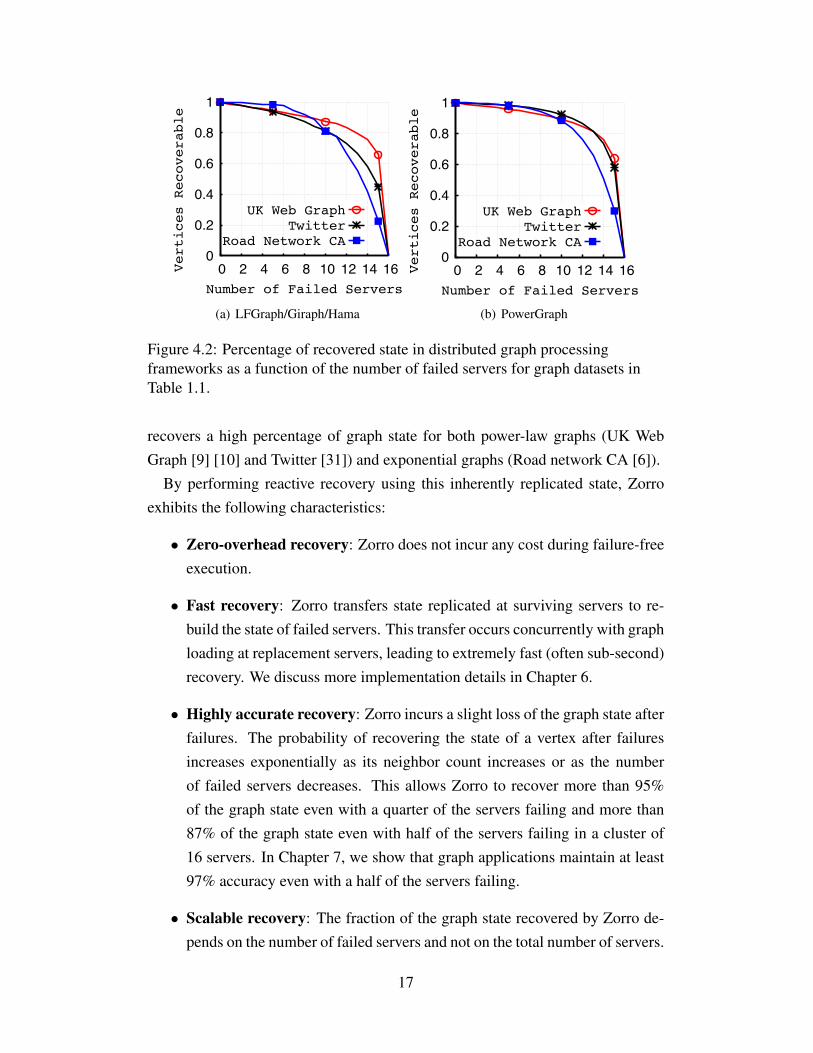
Figure 4.2 shows the percentage of recoverable state with Zorro in existingdistributed graph processing frameworks assuming hash-based graph partitioning.As shown in the figure, Zorro is able to recover more than 95% of the graph stateeven with a quarter of the servers failing and more than 87% of the graph stateeven with half of the servers failing. Additionally, the Figure shows that Zorro
16
0
0.2
0.4
0.6
0.8
1
0 2 4 6 8 10 12 14 16Vertices Recoverable
Number of Failed Servers
UK Web GraphTwitter
Road Network CA
(a) LFGraph/Giraph/Hama
0
0.2
0.4
0.6
0.8
1
0 2 4 6 8 10 12 14 16Vertices Recoverable
Number of Failed Servers
UK Web GraphTwitter
Road Network CA
(b) PowerGraph
Figure 4.2: Percentage of recovered state in distributed graph processingframeworks as a function of the number of failed servers for graph datasets inTable 1.1.
recovers a high percentage of graph state for both power-law graphs (UK WebGraph [9] [10] and Twitter [31]) and exponential graphs (Road network CA [6]).
By performing reactive recovery using this inherently replicated state, Zorroexhibits the following characteristics:
• Zero-overhead recovery: Zorro does not incur any cost during failure-freeexecution.
• Fast recovery: Zorro transfers state replicated at surviving servers to re-build the state of failed servers. This transfer occurs concurrently with graphloading at replacement servers, leading to extremely fast (often sub-second)recovery. We discuss more implementation details in Chapter 6.
• Highly accurate recovery: Zorro incurs a slight loss of the graph state afterfailures. The probability of recovering the state of a vertex after failuresincreases exponentially as its neighbor count increases or as the numberof failed servers decreases. This allows Zorro to recover more than 95%of the graph state even with a quarter of the servers failing and more than87% of the graph state even with half of the servers failing in a cluster of16 servers. In Chapter 7, we show that graph applications maintain at least97% accuracy even with a half of the servers failing.
• Scalable recovery: The fraction of the graph state recovered by Zorro de-pends on the number of failed servers and not on the total number of servers.
17
This allows Zorro to scale independent of the total number of servers in thecluster.
18
Chapter 5
ZORRO PROTOCOL DESIGN
In this Chapter, we present the design of Zorro reactive recovery protocol. Westate the systems assumptions and discuss the workflow of graph processing frame-works equipped with Zorro reactive failure recovery.
5.1 Systems Assumptions
In this section, we state Zorro’s systems assumptions before discussing Zorro fail-ure recovery protocol.
5.1.1 Synchronous GAS Model
Zorro assumes a synchronous Gather-Apply-Scatter (GAS) graph processing mo-del. Most popular frameworks such as PowerGraph [23], GraphLab [34], LF-Graph [26] and Giraph [1] support this processing model. In Chapter 3, wediscussed the synchronous Gather-Apply-Scatter model. Here, we give a briefoverview.
Figure 3.1 shows the phases involved in a synchronous GAS model. The graphis first partitioned across the cluster servers. The graph processing application,then proceeds in iterations. In each iteration, vertices gather values from in-coming neighbors, process and apply the values and scatter the results to theiroutgoing neighbors. In this model, graph state constitutes the values associatedwith the vertices of the graph. We use the terms graph state and vertex valuesinterchangeably. In the synchronous GAS model, the gather, apply and scatterstages in each iteration are synchronized using a barrier to ensure that all serversexecute these stages simultaneously. More recently an asynchronous graph pro-cessing model [23] has also gained popularity. We leave extending Zorro reactiverecovery for asynchronous models as future work.
19
5.1.2 Failures and Replacements
Zorro assumes crash-stop failures with replacements where any server can crashat any time, even during recovering from other failures. Zorro assumes that eachcrashed server is replaced for computation to proceed. The assumption of eachfailed server getting replaced can be avoided by supporting elasticity techniquesin graph processing where graph partitions are modified on the fly to compensatefor failed servers. We leave extending Zorro for such a scenario as future work.
5.2 Framework Classification
In this Section, we classify popular distributed graph processing frameworks intotwo categories based on the inherent vertex replication in their computation andcommunication model. In subsequent sections, we discuss Zorro recovery proto-col in these categories of frameworks.
5.2.1 Out-neighbor Replication
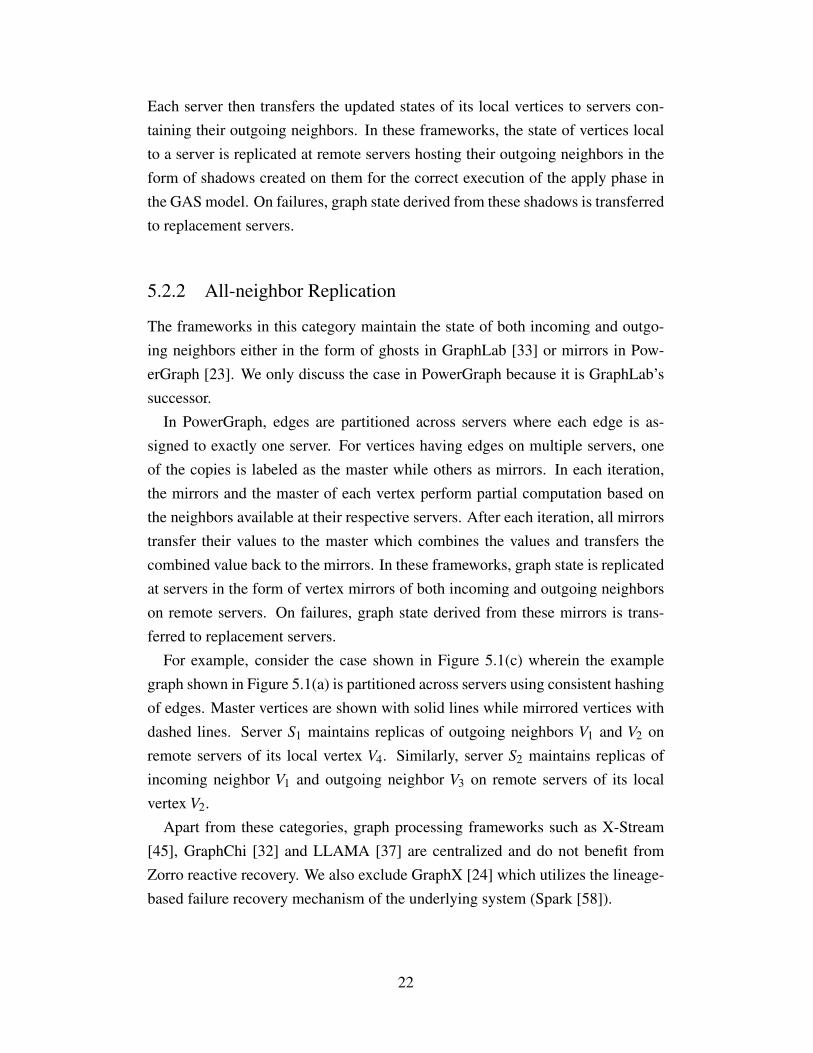
In frameworks belonging to out-neighbor replication category, the state of verticeslocal to a server is replicated at remote servers hosting their outgoing neighbors.Graph processing frameworks LFGraph [26], Giraph [1] and Hama [4] belongto this category. For example, consider the case shown in Figure 5.1(b) whereinthe example graph shown in Figure 5.1(a) is partitioned across servers using con-sistent hashing of vertices. Original vertices are shown with solid circles whilereplicated vertices with dashed circles. In the Figure, the state of vertex V2 hostedon server S2 is maintained at server S3. Similarly, the state of vertex V1 hosted onserver S1 is maintained at servers S2 and S3, and the state of vertex V4 also hostedon server S1 is maintained at server S2.
These frameworks can be further classified into two categories based on theform in which the state of vertices is replicated at servers hosting outgoing neigh-bors:
Message-based out-neighbor replication frameworks: Graph processing frame-works Giraph [1] and Hama [4] belong to this category. In these frameworks,vertices are partitioned across servers where each vertex is assigned to exactlyone server. Each vertex maintains its outgoing edges and buffered messages re-
20
(a) Example graph.
(b) Out-neighbor vertex replication in LF-Graph and Hama.
(c) All-neighbor vertex replication in Power-Graph.
Figure 5.1: Vertex replication for a graph partitioned across three servers usinghash-based partitioning.
ceived in the previous iteration. In each iteration, a vertex receives messages fromincoming neighbors, processes the messages to update its state, and finally sendsupdates to its outgoing neighbors. Servers are responsible for passing receivedmessages to the appropriate vertices. In these frameworks, the state of verticeslocal to a server is replicated at remote servers hosting their outgoing neighborsin the form of messages delivered to them for the correct execution of the applyphase in the GAS model. On failures, graph state derived from buffered messagesis transferred to replacement servers.
Shadow-based out-neighbor replication frameworks: Graph processing frame-work LFGraph [26] belongs to this category. Like message-based frameworks,vertices are partitioned across servers where each vertex is assigned to exactlyone server. Each vertex maintains its incoming neighbors while each server main-tains shadows of incoming neighbors of its local vertices. In each iteration, avertex utilizes state of its incoming neighbor vertices to update its current state.
21
Each server then transfers the updated states of its local vertices to servers con-taining their outgoing neighbors. In these frameworks, the state of vertices localto a server is replicated at remote servers hosting their outgoing neighbors in theform of shadows created on them for the correct execution of the apply phase inthe GAS model. On failures, graph state derived from these shadows is transferredto replacement servers.
5.2.2 All-neighbor Replication
The frameworks in this category maintain the state of both incoming and outgo-ing neighbors either in the form of ghosts in GraphLab [33] or mirrors in Pow-erGraph [23]. We only discuss the case in PowerGraph because it is GraphLab’ssuccessor.
In PowerGraph, edges are partitioned across servers where each edge is as-signed to exactly one server. For vertices having edges on multiple servers, oneof the copies is labeled as the master while others as mirrors. In each iteration,the mirrors and the master of each vertex perform partial computation based onthe neighbors available at their respective servers. After each iteration, all mirrorstransfer their values to the master which combines the values and transfers thecombined value back to the mirrors. In these frameworks, graph state is replicatedat servers in the form of vertex mirrors of both incoming and outgoing neighborson remote servers. On failures, graph state derived from these mirrors is trans-ferred to replacement servers.
For example, consider the case shown in Figure 5.1(c) wherein the examplegraph shown in Figure 5.1(a) is partitioned across servers using consistent hashingof edges. Master vertices are shown with solid lines while mirrored vertices withdashed lines. Server S1 maintains replicas of outgoing neighbors V1 and V2 onremote servers of its local vertex V4. Similarly, server S2 maintains replicas ofincoming neighbor V1 and outgoing neighbor V3 on remote servers of its localvertex V2.
Apart from these categories, graph processing frameworks such as X-Stream[45], GraphChi [32] and LLAMA [37] are centralized and do not benefit fromZorro reactive recovery. We also exclude GraphX [24] which utilizes the lineage-based failure recovery mechanism of the underlying system (Spark [58]).
22
5.3 Zorro Failure Recovery Protocol
Zorro, a reactive failure recovery mechanism, gives preference to costless recov-ery over complete recovery. Zorro does not prepare for failures and incurs zerooverhead during failure-free execution. When failures occur, it utilizes vertexstate inherently replicated in distributed graph processing frameworks at surviv-ing servers to rebuild the state of failed servers.
The execution flow of distributed graph processing during failure recovery us-ing Zorro is shown in Figure 5.2. In the discussion below, we number the eventsaccording to their labels in the figure. Zorro performs failure recovery in threephases:
• Replace Phase: Zorro recovery protocol utilizes a membership mainte-nance service (indicated by MS in Figure 5.2) such as Zookeeper [28] tomaintain the list of member servers. During the replace phase, the failure offailed servers is identified (1) and the surviving servers are informed aboutthe failed servers using a leave callback (leave cb) (2). On receiving thecallback, surviving servers suspend their ongoing graph processing and waitfor the failed servers to get replaced and perform pre-processing steps suchas graph loading. After the failed server gets replaced and joins the cluster(3), all servers are informed about the newly joined servers by the MS usinga join callback (join cb) (4).
Relying on a membership maintenance service is not considered an over-head during failure-free execution as existing frameworks already includea membership maintenance service such as ZooKeeper or a heartbeatingmechanism.
• Rebuild Phase: In the rebuild phase, replacement servers rebuild their localstate using the state replicated at and transferred by surviving servers. InFigure 5.2), on receiving the join callback, surviving servers transfer (usingsend state) replicated state of vertices hosted on replacement servers (5).The replacement servers acknowledge the completion of state transfer usinga send callback (send cb) (8).
• Resume Phase: In the resume phase, all servers resume the graph process-ing application from the iteration at which failures occurred. Zorro utilizes
the membership maintenance service (MS) to store the most recent iterationnumber.
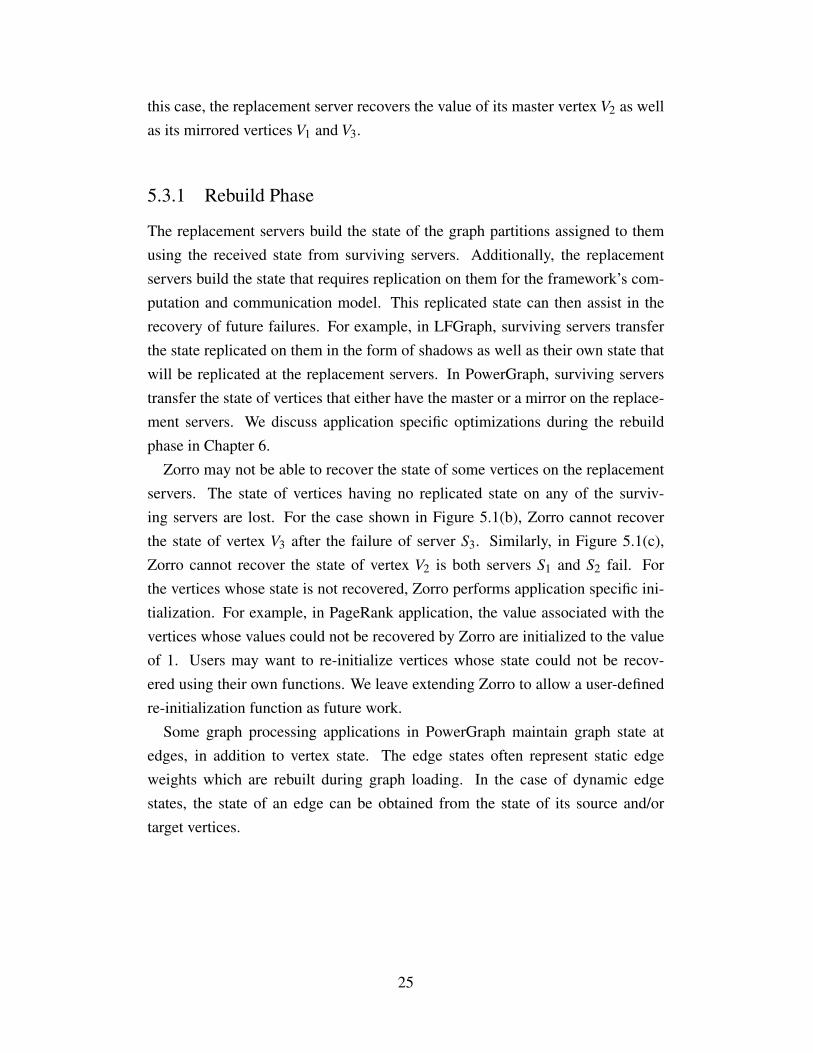
In LFGraph (Figure 5.1(b)), after the failure of server S1, the state of vertex V1
replicated at servers S2 and S3 and that of V4 replicated at server S2 are transferredto the replacement server. In this case, the replacement server recovers the valuesof both vertices V1 and V4 assigned to it. In PowerGraph(Figure 5.1(c)), afterthe failure of server S2, the state of vertices V2 replicated at server S1 and that ofvertices V1 and V3 present at server S3 are transferred to the replacement server. In
24
this case, the replacement server recovers the value of its master vertex V2 as wellas its mirrored vertices V1 and V3.
5.3.1 Rebuild Phase
The replacement servers build the state of the graph partitions assigned to themusing the received state from surviving servers. Additionally, the replacementservers build the state that requires replication on them for the framework’s com-putation and communication model. This replicated state can then assist in therecovery of future failures. For example, in LFGraph, surviving servers transferthe state replicated on them in the form of shadows as well as their own state thatwill be replicated at the replacement servers. In PowerGraph, surviving serverstransfer the state of vertices that either have the master or a mirror on the replace-ment servers. We discuss application specific optimizations during the rebuildphase in Chapter 6.
Zorro may not be able to recover the state of some vertices on the replacementservers. The state of vertices having no replicated state on any of the surviv-ing servers are lost. For the case shown in Figure 5.1(b), Zorro cannot recoverthe state of vertex V3 after the failure of server S3. Similarly, in Figure 5.1(c),Zorro cannot recover the state of vertex V2 is both servers S1 and S2 fail. Forthe vertices whose state is not recovered, Zorro performs application specific ini-tialization. For example, in PageRank application, the value associated with thevertices whose values could not be recovered by Zorro are initialized to the valueof 1. Users may want to re-initialize vertices whose state could not be recov-ered using their own functions. We leave extending Zorro to allow a user-definedre-initialization function as future work.
Some graph processing applications in PowerGraph maintain graph state atedges, in addition to vertex state. The edge states often represent static edgeweights which are rebuilt during graph loading. In the case of dynamic edgestates, the state of an edge can be obtained from the state of its source and/ortarget vertices.
25
5.3.2 Cascading Failures
Cascading failures are those failures that occur while the system is recoveringfrom a previous failure. The strength of Zorro is that recovery of a replacementserver is independent of the recovery of other replacement servers and can beperformed in parallel for all replacement servers. This enables Zorro to handlecascading failures trivially. In addition, existing replacement servers assist in therecovery of newly failed servers by sending back any state that they may havereceived during recovery.
We show the execution flow of graph processing frameworks during recoveryfrom cascading failures in Figure 5.2. As the cluster is recovering from the failureof server S3, server S2 fails. The failure of server S2 is detected by the membershipmaintenance service (MS) (6) and the surviving servers are informed about thefailure using a callback (leave cb) (7). The failure of server S2 does not interferewith the recovery of server S3. The replacement server of S3 participates in therecovery by transferring any state it may have received from server S2 when it wasalive back to the replacement server of S2 (11). After the transfer of replicatedstate from server S1 to server S2 and from server S3 to S2 gets completed, thereplacement server acknowledges transfer completion (12).
For example, in Figure 5.1(b) we consider the case where the framework isrecovering from the failure of server S1 and server S2 crashes. The recovery ofserver S1 involves sending the state of vertex V1 from servers S3 and S2 and vertexV4 from server S2. If server S2 fails, the recovery of S1 from server S2 is un-affected. Similarly, in Figure 5.1(c) we consider the case where the frameworkis recovering from the failure of server S3 and server S1 crashes. The recoveryof server S3 involves sending the state of vertex V1 from servers S2 and S3 andvertex V3 from server S2. If server S1 fails, the recovery of S3 from server S2 isunaffected. This independence of recovery for each failed server allows Zorro torecover from cascading failures efficiently.
5.4 Analyzing Reactive Recovery
In this section, we theoretically analyze the probability of recovering a vertex withZorro reactive recovery.
We define recovery neighbors as the neighbors of a vertex that enable replica-
26
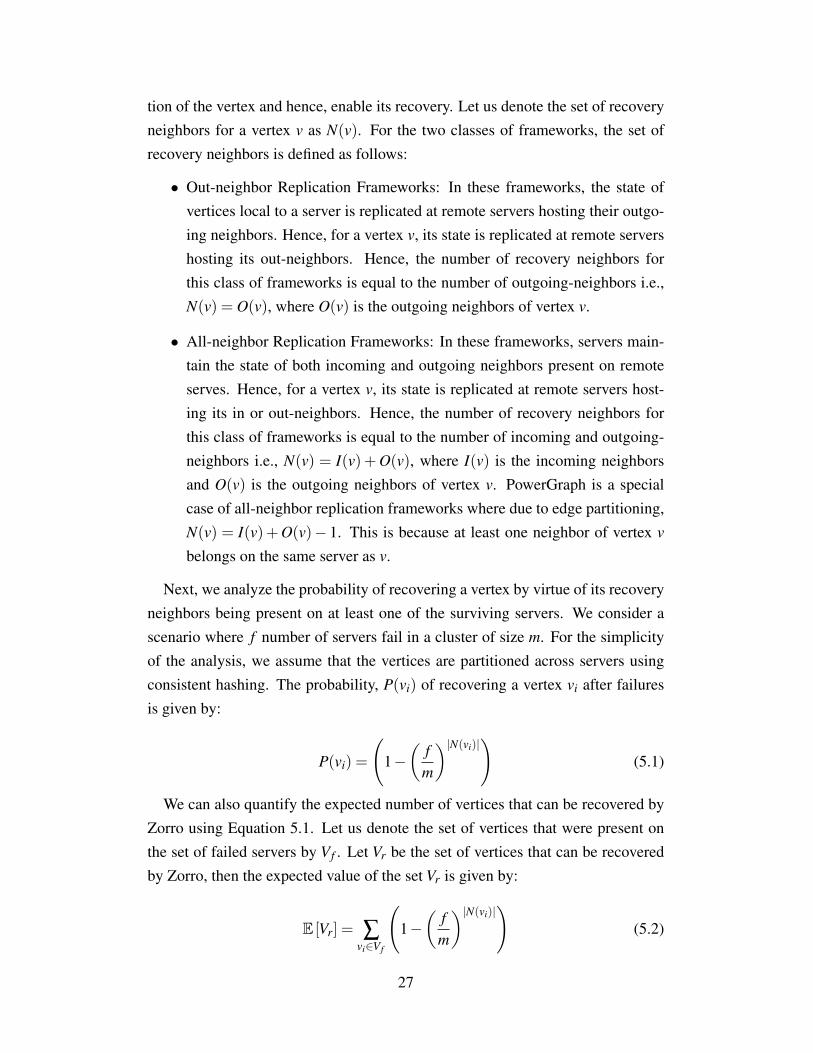
tion of the vertex and hence, enable its recovery. Let us denote the set of recoveryneighbors for a vertex v as N(v). For the two classes of frameworks, the set ofrecovery neighbors is defined as follows:
• Out-neighbor Replication Frameworks: In these frameworks, the state ofvertices local to a server is replicated at remote servers hosting their outgo-ing neighbors. Hence, for a vertex v, its state is replicated at remote servershosting its out-neighbors. Hence, the number of recovery neighbors forthis class of frameworks is equal to the number of outgoing-neighbors i.e.,N(v) = O(v), where O(v) is the outgoing neighbors of vertex v.
• All-neighbor Replication Frameworks: In these frameworks, servers main-tain the state of both incoming and outgoing neighbors present on remoteserves. Hence, for a vertex v, its state is replicated at remote servers host-ing its in or out-neighbors. Hence, the number of recovery neighbors forthis class of frameworks is equal to the number of incoming and outgoing-neighbors i.e., N(v) = I(v)+O(v), where I(v) is the incoming neighborsand O(v) is the outgoing neighbors of vertex v. PowerGraph is a specialcase of all-neighbor replication frameworks where due to edge partitioning,N(v) = I(v)+O(v)− 1. This is because at least one neighbor of vertex v
belongs on the same server as v.
Next, we analyze the probability of recovering a vertex by virtue of its recoveryneighbors being present on at least one of the surviving servers. We consider ascenario where f number of servers fail in a cluster of size m. For the simplicityof the analysis, we assume that the vertices are partitioned across servers usingconsistent hashing. The probability, P(vi) of recovering a vertex vi after failuresis given by:
P(vi) =
(1−(
fm
)|N(vi)|)
(5.1)
We can also quantify the expected number of vertices that can be recovered byZorro using Equation 5.1. Let us denote the set of vertices that were present onthe set of failed servers by Vf . Let Vr be the set of vertices that can be recoveredby Zorro, then the expected value of the set Vr is given by:
E [Vr] = ∑vi∈V f
(1−(
fm
)|N(vi)|)
(5.2)
27
Equation 5.2 shows that the probability of recovering the state of a vertex afterfailures increases exponentially as its neighbor count increases or as the numberof failed servers decreases.
28
Chapter 6
IMPLEMENTATION DETAILS
We implement and evaluate Zorro reactive recovery protocol in exemplar frame-works from the two categories: LFGraph [26] from Out-neighbor replication cat-egory and PowerGraph [23] from All-neighbor replication category.
6.1 LFGraph
LFGraph is an example of shadow-based out-neighbor replication frameworks.Servers in LFGraph maintain shadows of incoming neighbors on remote servers.
Before iterations start, each server builds a subscribe list for each remote servercontaining vertices whose state is required from the remote server for the gatherphase. Shadow copies of the vertices present in the server’s subscription listsare created. Based on these subscriptions, each server builds a publish list forevery remote server. The publish list is used to transfer vertex states to outgoingneighbors on remote servers and update the shadow copies.
These values are stored on remote servers as shadows. For the case shown inFigure 5.1(b), server S1 has vertex V1 in the publish list for servers S2 and S3 andvertex V4 in the publish list for server S2. Similarly, server S2 has vertex V2 in thepublish list for server S3 while its publish list for server S1 is empty. Finally, thepublish lists of server S3 are empty for both servers S1 and S2.
In the gather phase, each vertex iterates over its incoming neighbor state repli-cated locally as shadows, processes them and modifies its own state based on theprocessing. This state is then transferred to outgoing neighbors using the publishlists in the scatter phase to update remote shadows. The scatter phase at the end ofeach iteration ensures that the shadows at each server reflect the latest changes. InLFGraph, each server maintains two copies of its local vertices: an original copyand a backup copy. During the apply phase, updates are made to the original copywhich are then merged into the backup copy at the end of apply phase.
29
We implement Zorro in LFGraph by modifying the computation worker andcommunication worker classes within the JobServer. The three stages of Zorroreactive recovery in LFGraph are summarized below:
1. Replace: LFGraph uses ZooKeeper [28] to identify server failures. Onfailures, Zookeeper issues a leave callback to all surviving servers. On re-ceiving the leave callback, the surviving servers suspend their iteration, savethe iteration number in Zookeeper and wait at a barrier for failed servers toget replaced. As replacement servers join the cluster after loading their re-spective graph partitions, Zookeeper issues a join callback to all survivingservers.
2. Rebuild: The graph state maintained at each server as the shadows of in-coming neighbors is used to re-build the state of failed servers. On receivinga join callback, each surviving server initiates the rebuild process for the re-placement server. The rebuild process transfers two sets of vertices to thereplacement server:
• Shadow vertices on surviving server having their master copies onthe failed server. These vertices constitute the incoming neighborsof the surviving server’s local vertices present on the failed server i.e.,vertices present in the surviving server’s subscribe list for the failedserver. These vertices build the publish list at the replacement serverfor the sender surviving server.
• Master vertices on surviving server having their shadows on the failedserver. These vertices constitute the incoming neighbors of the failedserver’s local vertices present on the surviving server i.e., verticespresent in the surviving server’s publish list for the failed server. Thesevertices build the subscribe list at the replacement server for the sendersurviving server.
The transfer of graph state from surviving to replacement servers ensuresthat the publish and subscribe lists at replacement servers get re-built for allsurviving servers. As such, the publish-subscribe phase needs to be repeatedonly among replacement servers. LFGraph stores original and backup ver-tex copies separately. This allows sending the two sets of vertices in parallelto replacement servers.
30
3. Resume: Servers resume computation from the start of the last iterationbefore failure. This iteration number is saved by surviving servers withZooKeeper. For correctness of computation after recovering from failures,each server operates on the most recent states of the incoming neighbors ofits local vertex set. A server receives the states of the incoming neighborsof its local vertex set as part of the replicated state during rebuild phase.Additionally, Zorro performs an additional partial scatter among replace-ment servers to ensure that each vertex works on the most recent states onits incoming neighbors.
6.1.1 Correctness
We discuss failures during phases of the Gather-Apply-Scatter model in LFGraphand the correctness of our approach in handling these failures.
In the gather phase, vertices iterate over incoming neighbors present on thelocal server as shadows. Zorro handles failures during the gather phase as serversresume the iteration from beginning after recovery.
In the apply phase, vertices process the states of incoming neighbors collectedin the gather phase to update their own state. As mentioned before, each servermaintains two copies of its local vertices: an original copy and a backup copy.The updated state after apply phase is written to the original copy by default. Theupdates to the original copy are merged with the backup copy after all verticeshave finished the apply phase. Zorro handles failures during the apply phase bytransferring vertex states from backup copies during recovery which are updatedonly if all servers have finished the apply phase. This ensures that the backupcopies do not reflect any changes of the apply phase if failures occur during theapply phase. Essentially, Zorro merges vertex state copies after Scatter, ratherthan between Apply and Scatter as in vanilla LFGraph.
In the scatter phase, updated states of vertices are transferred to remote servershosting outgoing neighbors using publish lists. Zorro handles failures during thescatter phase by receiving all updated values from incoming neighbors beforeupdating the remote value store by creating a copy of the remote value store inthe background during the Apply phase. This results in an average per-iterationoverhead of just 0.8%. This is the only instance of overhead incurred by Zorro.
31
6.2 PowerGraph
PowerGraph is an example of all-neighbor replication frameworks. Servers inPowerGraph maintain mirrors of both incoming and outgoing neighbors on remoteservers.
In PowerGraph, edges are partitioned across servers where each edge is as-signed to exactly one server. For vertices having edges on multiple servers, one ofthe copies is labeled as the master while others as mirrors. For the case shown inFigure 5.1(c), the edges (V4,V1) and (V4,V2) are assigned to server S1, (V1,V2) andV2,V3 to server S2 and (V1,V3) to server S3. Vertices V1, V2 and V2 span multipleservers and hence, have mirrors. We represent the master vertex copies with solidcircles and mirror vertex copies with dashed circles. Vertex V2 has its master atserver S2 while a mirror at server S1, vertex V3 has master at S3 and mirror at S2
while V1 has master at S3 and mirrors at S1 and S2.The mirrors on remote servers provide the replication required by Zorro to re-
cover from failures. In each iteration, the mirrors and the master of each vertexperform partial computation based on the neighbors available at their respectiveservers. After each iteration, all mirrors transfer their values to the master whichcombines the values and transfers the combined value back to the mirrors. Sucha design distributed the computation load at a vertex due to a large degree acrossthe master and mirrors. This optimization is aimed at power-law graphs whereinvertices may have arbitrarily large degrees.
We implement Zorro in PowerGraph by modifying the synchronous engine
class which implements synchronous Gather-Apply-Scatter model. We also mod-ify the local graph class which provides data structures for the representationof the local graph on each server.
1. Replace: As with LFGraph, PowerGraph identifies failures using ZooKee-per. After failures, survivors retain the local graph state while terminatingthe synchronous engine.
2. Rebuild: The graph state maintained at each server as the mirrors and mas-ters of vertices present on the failed servers is used to re-build their state.After failures, all servers load their respective graph partitions and trans-fer the edges previously held by failed servers to the replacement servers.The servers join the cluster after loading graph partitions by contactingZookeeper which issues join callbacks to broadcast the join operation.
32
On receiving a join callback, each surviving server initiates the rebuild pro-cess for the replacement server. Surviving servers iterate over local mastersand mirrors and transfer the state of vertices that have either a master ora mirror on the replacement servers. This is possible as each vertex copymaintains the set of servers where it is present either as the master or mir-rors. The replacement servers update their graph state with the receivedvertex states.
Each vertex copy maintaining its set of hosting servers allows an optimiza-tion to reduce the network costs during recovery. Only one of the survivingservers need to transfer the state of a vertex held by the replacement serverseither as the master or mirrors. Zorro achieves this using the followingcheck for each vertex:
procid == argminp∈PS(v)
|p.procid− (v.id % |S|) | (6.1)
,where procid is the process id of the server, PS(v) is the set of survivingservers that hold vertex v either as the master or a mirror and S is the setof all servers in the cluster. This optimization ensures that only a singlesurviving server is responsible for transferring the state of a vertex requiredby the replacement servers.
The above mentioned optimization requires handling cascading failures dif-ferently in PowerGraph. Cascading failures require that the recovery offailed servers is not affected by more servers failing during the recovery.This may require surviving servers to make multiple iterations over theirlocal vertices as they may become responsible for transferring the state ofvertices due to failures during the recovery process.
3. Resume: Servers resume computation from the start of the last iterationbefore failure. This iteration number is saved by surviving servers withZooKeeper. For correctness of computation after recovering from failures,each server requires knowledge of the vertices active in the current iterationand the messages that they should work on from their incoming neighbors.To ensure this, Zorro performs an additional partial scatter where mirrorand master vertices scatter to their local neighbors. This scatter is localand incurs no network overhead as vertices only need to signal their localneighbors in PowerGraph.
33
6.2.1 Correctness
We discuss failures during phases of the Gather-Apply-Scatter model in Power-Graph and the correctness of our approach in handling these failures.
In the gather phase, the mirrors and the master perform partial computationusing the neighbors available locally on the their respective servers. The partialcomputation results are stored in accumulators. Zorro handles failures during thegather phase trivially as all servers terminate their ongoing computation and thestate of accumulators does not affect vertex states.
In the apply phase, partial results from mirrors are transferred to the masterwhich aggregates them and transfers the result back to mirrors to synchronizetheir values. Zorro handles failures during the apply phase by ensuring that allmasters receive all partial results from their respective mirrors before updatingtheir states.
In the scatter phase, vertices signal their neighbors is their state gets updated.Zorro handles failures during the scatter phase by performing a partial scatter afterrecovery.
34
Chapter 7
EVALUATION
In this Chapter, we experimentally evaluate Zorro reactive recovery protocol. Wehave implemented Zorro in LFGraph [26], an in-neighbor replication frameworkand PowerGraph [23], an all-neighbor replication framework. Our evaluationgoals for each framework are as follows:
• Evaluate the accuracy of graph applications with varying number of failedservers
• Evaluate the accuracy of graph applications with varying iteration numberat which failures occur.
• Evaluate the time take by Zorro to recover from failures with varying num-ber of failed servers.
• Evaluate the network overhead incurred by Zorro during recovery.
7.1 Experimental Setup
We perform our experiments on a cluster consisting of 16 servers. Each servercontains 16 Intel Xeon E5620 processors and 64 GB RAM. The servers are con-nected to each other using a 1 Gbps network.
We use the following three graph datasets for our experiments:
• Road Network (CA): The graph representing California road network [6].It is an exponential graph containing 1.96 M vertices and 2.76 M edges.
• Twitter: The graph representing follower-followee relationship betweenTwitter users [31]. It is a power-law graph containing 41.65 M vertices and1.47 B edges.
35
• UK Web: The graph representing UK webpages and links between them. Itis a power-law graph containing 105.9 M vertices and 3.74 B edges.
We introduce failures at random servers by terminating the graph processingframework processes within a given iteration. In our experiments, we run graphapplications for a fixed number of iterations and not wait for convergence afterfailures. For example, if PageRank application fails at iteration 5 when beingexecuted for 10 iterations, the application, after recovery, resumes from iteration5 and terminates at iteration 10 irrespective of convergence. This allows us toevaluate the accuracy with Zorro reactive recovery protocol correctly. For eachexperiment, we report the average over three trials.
7.2 Applications
We evaluate Zorro reactive recovery using two popular graph processing appli-cations: PageRank [12], Single-Source Shortest Paths (SSSP) [38], ConnectedComponents (CC) [46] and K-core [48].
7.2.1 PageRank
PageRank [12] computes the rank of each page iteratively based on the ranksof each incoming neighbors. Pregel [38] introduced a vertex-centric PageRankwhich has been adopted in all distributed graph processing frameworks [23] [26][1] [4] [42].
Metrics
Let Pko be the original top-k pages based on their PageRank values. Let Pk
n be thetop-k pages after recovery from failures using Zorro. We evaluate the accuracy ofPageRank application using the top-k pages based on their PageRank values usingthe following metrics used in [39]:
• Top-k Lost (TL): This metric measures the fraction of the top-k verticeslost due to failures. Mathematically, PageRank top-k lost is represented as|Po\Pn||Po| .
36
0.000
0.005
0.010
0.015
0.020
0.025
0.030
1 2 3 4 5 6 7 8
Inaccuracy
Number of Failed Servers
UK: MLUK: TL
Twitter: MLTwitter: TL
(a) PowerGraph
0.000
0.005
0.010
0.015
0.020
0.025
0.030
1 2 3 4 5 6 7 8
Inaccuracy
Number of Failed Servers
UK: MLUK: TL
Twitter: MLTwitter: TL
(b) LFGraph
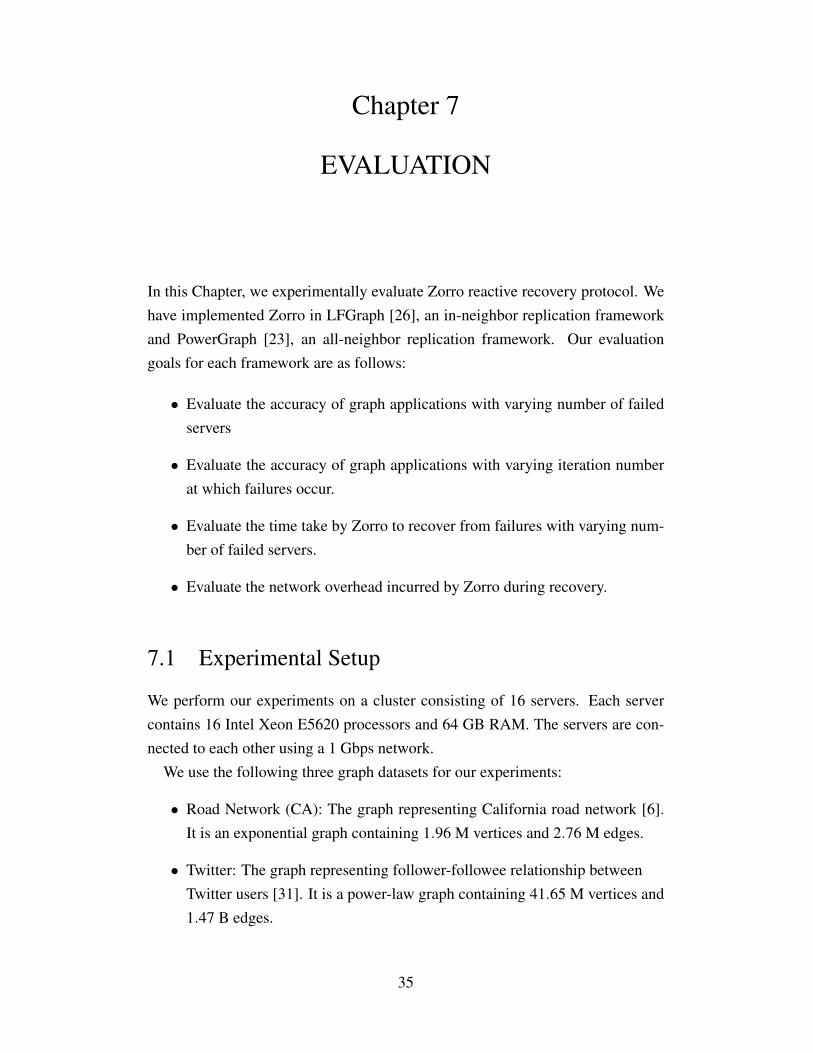
Figure 7.1: PageRank inaccuracy as a function of the number of failures. Serversare failed randomly at the fifth (out of 10) iteration.
• Mass Lost: This metric measures the fraction of PageRank scores lost bythe application after recovering from failures. Mathematically, PageRankmass lost is represented as ∑e∈Po\Pn Rank(e)/∑e∈Po Rank(e)
Results
We evaluate the accuracy obtained with Zorro reactive recovery by varying thenumber of failed servers and by varying the iteration at which failure occurs.
Figure 7.1(a) shows the accuracy of PageRank application on PowerGraph withvarying number of failures recovered using Zorro. PowerGraph incurs no accu-racy loss on the Twitter graph, and no accuracy loss on the UK Web graph forfewer than 6 server failures out of 16. Even with half of the servers failing, theaccuracy loss in PowerGraph with the UK Web graph is only 2% of the intersec-tion (i.e., two of the top-100 ranked vertices are not present in the results afterrecovering from failures), and less than 1.5% mass retained.
Figure 7.1(b) shows the accuracy of PageRank application on LFGraoh withvarying number of failures recovered using Zorro. LFGraph, even with a lessfavorable replication model, exhibits no accuracy loss with the Twitter graph forfewer than 8 server failures out of 16. Even with half of the servers failing, theaccuracy loss is at most 1% with Twitter graph and 3% with UK Web graph.
Since LFGraph exhibits out-neighbor replication, the accuracy loss with LF-Graph is higher than with PowerGraph. In out-neighbor replication, only theout-neighbors of vertices are replicated at remote servers whereas in all-neighbor
37
0.000
0.005
0.010
0.015
0.020
0.025
0.030
0 1 2 3 4 5 6 7 8 9
Inaccuracy
Failure Iteration
UK: MLUK: TL
Twitter: MLTwitter: TL
(a) PowerGraph
0.000
0.005
0.010
0.015
0.020
0.025
0.030
0 1 2 3 4 5 6 7 8 9
Inaccuracy
Failure Iteration
UK: MLUK: TL
Twitter: MLTwitter: TL
(b) LFGraph
Figure 7.2: PageRank inaccuracy as a function of the iteration at which a quarterof the servers (4) fail.
replication (exhibited by PowerGraph), both in- and out-neighbors are replicatedat remote servers. In LFGraph, the vertices which are lost from top-100 resultsare only those which have no out-neighbors and, hence, no replicas on remoteservers. We expect very few vertices to have zero out-degrees contributing to highaccuracy results even in LFGraph.
Next, we present accuracy results by varying the failure iteration (out of 10 iter-ations) and fixing the number of failures at 4 out of 16 servers. Figure 7.2(a) showsthe accuracy of PageRank application on PowerGraph with varying the iterationat which failures occur. PowerGraph incurs no accuracy loss on the Twitter graphfor failures occurring before iteration 8, and no accuracy loss on the UK Webgraph. Even with a quarter of the servers failing on the last iteration, PowerGraphincurs 1% accuracy loss.
Figure 7.2(b) shows the accuracy of PageRank application on LFGraph withvarying the iteration at which failures occur. LFGraph incurs no accuracy losswith both Twitter and UK Web graphs for failures occurring before iteration 9.Even with a quarter of the servers failing at the last iteration, the accuracy lossin LFGraph is at most 3% with the UK Web graph and less than 2.5% with theTwitter graph..
As failures occur at later iterations, loss of accuracy increases because thosevertices whose value could not be recovered after failures are not able to re-converge within the remaining iterations. Note that, in our experiments, we fixthe number of iterations and do not increase the number of iterations even afterfailures.
38
0.0000
0.0002
0.0004
0.0006
0.0008
1 2 3 4 5 6 7 8
Inaccuracy
Number of Failed Servers
UK: ADUK: PL
Twitter: ADTwitter: PLCA Road: ADCA Road: PL
(a) PowerGraph
0.0000
0.0002
0.0004
0.0006
0.0008
1 2 3 4 5 6 7 8
Inaccuracy
Number of Failed Servers
UK: ADUK: PL
Twitter: ADTwitter: PLCA Road: ADCA Road: PL
(b) LFGraph
Figure 7.3: SSSP inaccuracy as a function of the number of failures. Servers arefailed randomly at the fifth (out of 10) iteration.
7.2.2 Single-Source Shortest Paths (SSSP)
Single-source shortest paths application computes the lengths of shortest pathsfrom a user-defined source vertex to every vertex in the graph. For our experi-ments, we use the vertex with the maximum degree as the source.
Metrics
We evaluate the accuracy of SSSP application using the following metrics:
• Average Difference (AD): This metric measures the average normalized dif-ference in the shortest path lengths of vertices [25]. Mathematically, it isrepresented as 1
|V |∑v∈V (ssspnv− ssspo
v)/ssspov , where V is the set of vertices
in the graph, ssspov is the actual shortest path length from source to vertex v,
and ssspnv is the shortest path length after recovering from failures. Average
difference does not include vertices for which SSSP application could notdetermine a path after failures but a path actually exists. These vertices aremeasured using the fraction of paths lost metric.
• Fraction of Paths Lost (PL): This metric measures the fraction of verticeswhich are actually reachable from the given source vertex but SSSP appli-cation could not find a path to them after recovering from failures.
39
0.000000.000050.000100.000150.000200.000250.00030
0 2 4 6 8 10 12 14
Inaccuracy
Failure Iteration
UK: ADUK: PL
Twitter: ADTwitter: PLCA Road: ADCA Road: PL
(a) PowerGraph
0.000000.000050.000100.000150.000200.000250.00030
0 2 4 6 8 10 12 14
Inaccuracy
Failure Iteration
UK: ADUK: PL
Twitter: ADTwitter: PLCA Road: ADCA Road: PL
(b) LFGraph
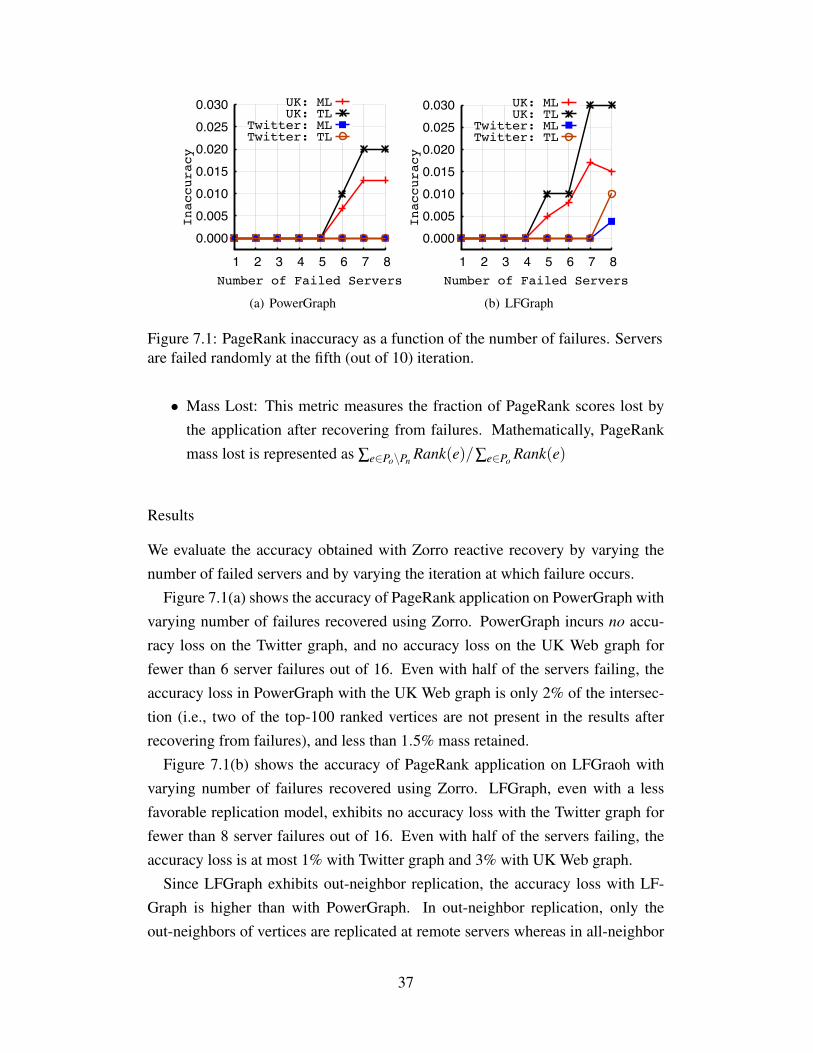
Figure 7.4: SSSP inaccuracy as a function of the iteration at which a quarter ofthe servers (4) fail.
Results
We evaluate the accuracy obtained with Zorro reactive recovery by varying thenumber of failed servers and by varying the iteration at which failure occurs.
Figure 7.3(a) shows the accuracy of SSSP application on PowerGraph withvarying number of failures recovered using Zorro. PowerGraph incurs no accu-racy loss on the Twitter and the graph of California road network (CA Road), andno accuracy loss on the UK Web graph for fewer than 8 (out of 16) server failures.Even with half of the servers failing with the UK Web Graph, PowerGraph incursno average difference and negligible paths lost (3.6×10⁻⁴% of the total).
Figure 7.3(b) shows the accuracy of SSSP application on LFGraph with varyingnumber of failures recovered using Zorro. LFGraph exhibits no accuracy loss withthe Twitter graph and the CA road graph. For the UK Web graph, LFGraph incursno average difference and only 0.06% paths lost even with half of the serversfailing.
The accuracy loss with PowerGraph is lower than that with LFGraph due to thedifferent replication models.
Next, we present accuracy results by varying the iteration at which failures oc-cur (out of 15 total) and fixing the number of failures at 4 out of 16 servers. Figure7.4(a) shows the accuracy of SSSP application on PowerGraph with varying theiteration at which failures occur. PowerGraph again incurs no accuracy loss onthe CA road graph. With Twitter graph, it exhibits no accuracy loss for failuresoccurring before iteration 14 and even with a quarter of the servers failing on the
40
last iteration, only 0.24% paths are lost. With UK Web graph, it incurs no accu-racy loss for failures occurring before iteration 11 and even with a quarter of theservers failing on the last iteration, accuracy loss is negligible (0.0013% paths lostand 0.0025%).
Figure 7.4(b) shows the accuracy of SSSP application on LFGraph with varyingthe iteration at which failures occur. LFGraph exhibits no accuracy loss with theCA road graph. With the Twitter graph, it incurs no accuracy loss for failuresoccurring before iteration 14 and even with a quarter of the servers failing on thelast iteration, accuracy loss is negligible (0.005% paths lost). With the UK Webgraph, it incurs at most 0.02% paths lost.
As failures occur at later iterations, inaccuracy increases as vertices whose val-ues could not be recovered after failures are not able to re-converge within theremaining iterations.
7.2.3 Connected Components (CC)
Connected Components application implements the label propagation algorithmwherein vertices propagate their component labels. We use weak connected com-ponents algorithm popular in distributed graph processing systems [38] where thelabel of a component is the minimum vertex ID among its member vertices. Weevaluate Zorro’s inaccuracy after failures while running CC with 10 iterations onall three graphs. For LFGraph, we use undirected versions of Twitter and UK Webgraphs for this set of experiments.
Metrics
We evaluate the accuracy of CC application using the following metric:
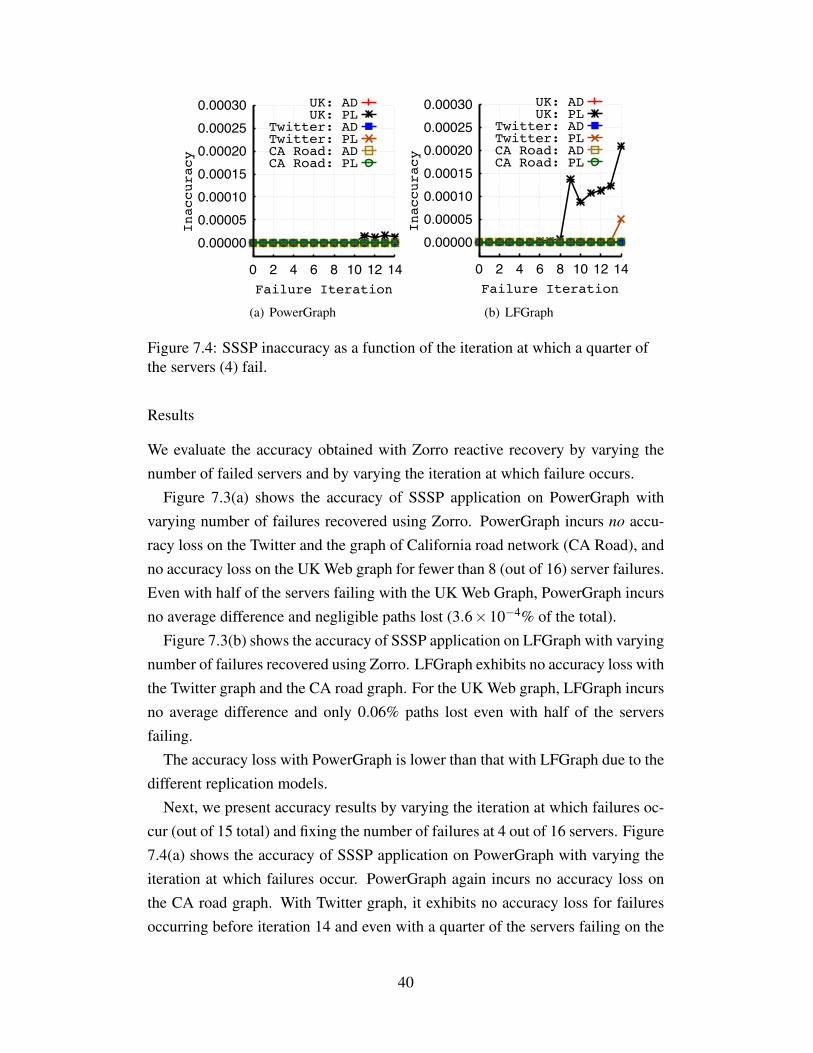
• Incorrect Labels (IL): The fraction of vertices which have a different label(i.e., component) than the original result. This metric evaluates the inaccu-racy incurred by the algorithm in determining connected components afterfailures.
41
0.000
0.005
0.010
0.015
0.020
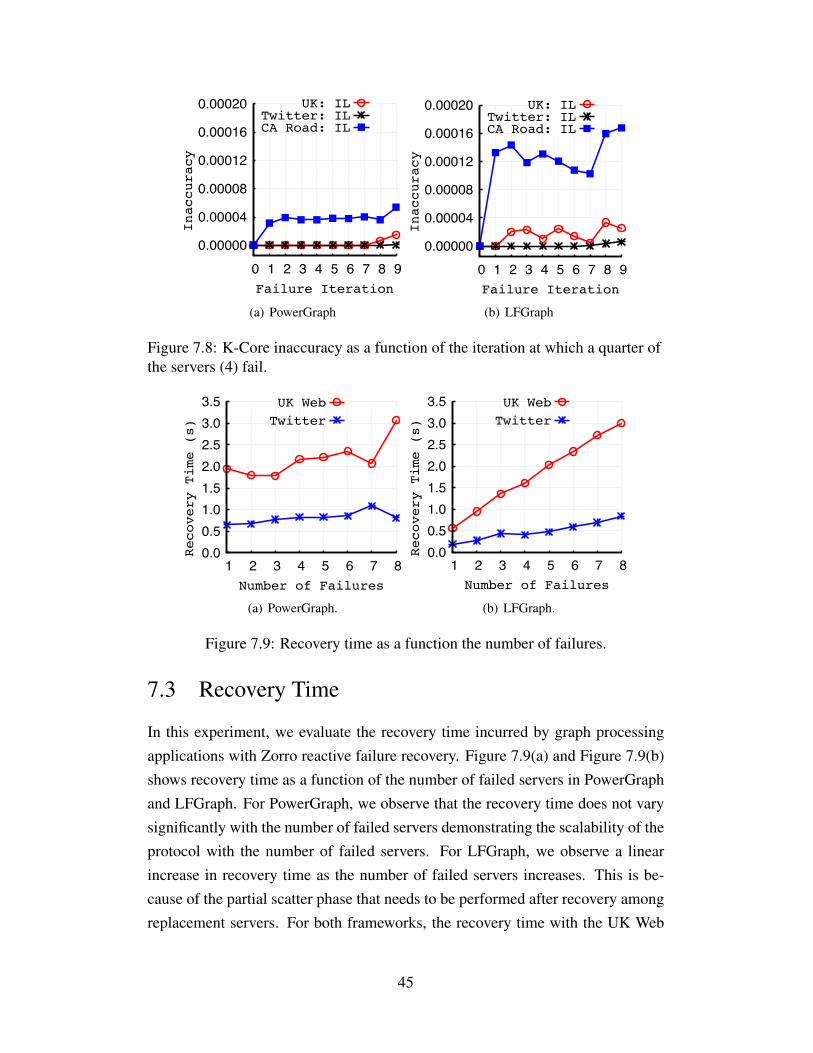
0.025
1 2 3 4 5 6 7 8
Inaccuracy
Number of Failed Servers
UK: ILTwitter: ILCA Road: IL
(a) PowerGraph
0.000
0.005
0.010
0.015
0.020
0.025
1 2 3 4 5 6 7 8
Inaccuracy
Number of Failed Servers
UK: ILTwitter: ILCA Road: IL
(b) LFGraph
Figure 7.5: CC inaccuracy as a function of the number of failures. Servers arefailed randomly at the fifth (out of 10) iteration.
0.00
0.002
0.004
0.006
0.008
0 1 2 3 4 5 6 7 8 9
Inaccuracy
Failure Iteration
UK: ILTwitter: ILCA Road: IL
(a) PowerGraph
0.00
0.002
0.004
0.006
0.008
0 1 2 3 4 5 6 7 8 9
Inaccuracy
Failure Iteration
UK: ILTwitter: ILCA Road: IL
(b) LFGraph
Figure 7.6: CC inaccuracy as a function of the iteration at which a quarter of theservers (4) fail.
Results
We evaluate the accuracy obtained with Zorro reactive recovery by varying thenumber of failed servers and by varying the iteration at which failure occurs.
Figure 7.5(a) shows the accuracy of CC application on PowerGraph with vary-ing the number of failures. PowerGraph incurs negligible accuracy loss for theUK Web and Twitter graphs even with half of the servers failing (at most 0.02%and 2.4× 10⁻⁶% with UK Web and Twitter respectively). With CA road graph,it incurs an accuracy loss of 1.57% with 8 servers failing while only 0.13% with4 servers failing. The accuracy loss is higher in CA road network because of itshigh diameter where vertices take much longer to converge.
42
Figure 7.5(b) shows the accuracy of CC application on LFGraph with varyingthe number of failures. LFGraph incurs negligible accuracy loss (2.4× 10⁻⁵%)for the Twitter graph even with half of the servers failing. With 8 servers failing,the accuracy loss with UK Web graph is 0.77% and with CA road graph, it is2.15%.
Next, we present accuracy results by varying the iteration at which failuresoccur (out of 10 total) and fixing the number of failures at 4 out of 16 servers.Figure 7.6(a) shows the accuracy of CC application on PowerGraph with varyingthe iteration at which failures occur. PowerGraph incurs negligible accuracy lossfor the UK Web and Twitter graphs even with failures occurring at the last iteration(at most 0.0015% and 2.86×10⁻⁴% with UK Web and Twitter respectively). WithCA road graph, it incurs an accuracy loss of 0.17% with 8 servers failing whileonly 0.13% with 4 servers failing.
Figure 7.6(b) shows the accuracy of CC application on LFGraph with varyingthe iteration at which failures occur. LFGraph incurs negligible accuracy loss(0.005%) for the Twitter graph even with half of the servers failing. With 8 serversfailing, the accuracy loss with UK Web graph is 0.67% and with CA road graph,it is 0.57%.
7.2.4 K-core
K-core application [48] identifies sub-graphs within a given graph such that ver-tices in the induced sub-graphs have at least k neighbors. We evaluate Zorro’sinaccuracy after failures while running k-core decomposition with 10 iterationson all three graphs. For LFGraph, we use undirected versions of Twitter and UKWeb graphs for this set of experiments.
Metrics
We evaluate the accuracy of k-core application using the following metric:
• Incorrect Labels (IL): The fraction of vertices which have a different label(i.e., k-core membership) than the original result. This metric evaluates theinaccuracy incurred by the algorithm in determining k-core membershipafter failures.
43
0.000
0.004
0.008
0.012
1 2 3 4 5 6 7 8
Inaccuracy
Number of Failed Servers
UK: ILTwitter: ILCA Road: IL
(a) PowerGraph
0.000
0.004
0.008
0.012
1 2 3 4 5 6 7 8
Inaccuracy
Number of Failed Servers
UK: ILTwitter: ILCA Road: IL
(b) LFGraph
Figure 7.7: K-Core inaccuracy vs. the number of failures. Servers are failedrandomly at the fifth (out of 10) iteration.
Results
We evaluate the accuracy obtained with Zorro reactive recovery by varying thenumber of failed servers and by varying the iteration at which failure occurs.
First, we present results by varying the number of failed servers. Figure 7.7(a)shows the accuracy of k-core application on PowerGraph with varying the numberof failures. PowerGraph incurs no accuracy loss for the Twitter graph. Even with 8servers failing, it incurs negligible accuracy loss with the UK Web (6.03×10⁻⁴%)and CA road graph (0.0047%).
Figure 7.7(b) shows the accuracy of k-core application on LFGraph with vary-ing the number of failures. LFGraph incurs 5.58×10⁻⁴% accuracy loss with theUK Web graph, 3.05×10⁻⁴% with the Twitter graph and 1.39% with the CA roadgraph with half of the servers failing.
Next, we present results by varying the iteration at which failures occur. Fig-ure 7.8(a) shows the accuracy of k-core application on PowerGraph with varyingthe iteration at which failures occur. PowerGraph incurs negligible accuracy lossfor all three graphs even with failures occurring on the last iteration (0.0015% forUK Web, 5.52×10⁻⁵% for Twitter and 0.0053% for CA road).
Figure 7.8(b) shows the accuracy of k-core application on LFGraph with vary-ing the iteration at which failures occur. LFGraph incurs negligible accuracy lossfor all three graphs even with failures occurring on the last iteration (0.0026% forUK Web, 6.2×10⁻⁴% for Twitter and 0.017% for CA road).
44
0.00000
0.00004
0.00008
0.00012
0.00016
0.00020
0 1 2 3 4 5 6 7 8 9
Inaccuracy
Failure Iteration
UK: ILTwitter: ILCA Road: IL
(a) PowerGraph
0.00000
0.00004
0.00008
0.00012
0.00016
0.00020
0 1 2 3 4 5 6 7 8 9
Inaccuracy
Failure Iteration
UK: ILTwitter: ILCA Road: IL
(b) LFGraph
Figure 7.8: K-Core inaccuracy as a function of the iteration at which a quarter ofthe servers (4) fail.
0.00.51.01.52.02.53.03.5
1 2 3 4 5 6 7 8
Recovery Time (s)
Number of Failures
UK Web
Twitter
(a) PowerGraph.
0.00.51.01.52.02.53.03.5
1 2 3 4 5 6 7 8
Recovery Time (s)
Number of Failures
UK Web
Twitter
(b) LFGraph.
Figure 7.9: Recovery time as a function the number of failures.
7.3 Recovery Time
In this experiment, we evaluate the recovery time incurred by graph processingapplications with Zorro reactive failure recovery. Figure 7.9(a) and Figure 7.9(b)shows recovery time as a function of the number of failed servers in PowerGraphand LFGraph. For PowerGraph, we observe that the recovery time does not varysignificantly with the number of failed servers demonstrating the scalability of theprotocol with the number of failed servers. For LFGraph, we observe a linearincrease in recovery time as the number of failed servers increases. This is be-cause of the partial scatter phase that needs to be performed after recovery amongreplacement servers. For both frameworks, the recovery time with the UK Web
45
0.00
0.02
0.04
0.06
0.08
0.10
1 2 3 4 5 6 7 8
Relative Overhead
Number of Failed Servers
UK WebTwitterCA Road
(a) PowerGraph.
0.00
0.02
0.04
0.06
0.08
0.10
1 2 3 4 5 6 7 8
Relative Overhead
Number of Failed Servers
UK WebTwitterCA Road
(b) LFGraph.
Figure 7.10: Ratio of bytes transferred over 10 iterations of SSSP to bytestransferred during failure recovery by Zorro as a function the number of failures.
graph is more than that with the Twitter graph because of its larger size. Moregraph state is transferred over the network with the UK Web graph than withthe Twitter graph. Most importantly, the recovery time in both PowerGraph andLFGraph is less than the average iteration time. The average iteration time inPowerGraph is 11.7 seconds with the Twitter graph and 22 seconds with the UKWeb graph while in LFGraph it is 2 seconds with the Twitter graph and 6 secondswith the UK Web graph.
The low recovery times with Zorro reactive recovery protocol are because ofthe ability of servers to load graph partitions while receiving replicated state fromsurviving servers in parallel. This requires to store the state transferred by surviv-ing servers in a temporary datastore before merging it with the loaded graph. Thelow recovery times demonstrate the ability of Zorro reactive recovery protocol toenable quick recovery.
7.4 Communication Overhead
In this section, we evaluate the network communication overhead incurred byZorro recovery protocol. Figure 7.10 shows the ratio of the bytes transferred dur-ing recovery with Zorro to the total bytes transferred during failure-free executionof 10 iterations of PageRank application. This relative network overhead in Pow-erGraph (Figure 7.10(a)) is at most 2% while it is at most 9.15% in LFGraphwith half of the servers failing. The relative overhead is smaller in PowerGraph
46
than LFGraph because of the rebuild optimization possible in PowerGraph modelwhere in only a single surviving server is responsible for transferring the stateof a vertex required by the replacement servers. This is achieved by using thefollowing check for each vertex:
procid == argminp∈PS(v)
|p.procid− (v.id % |S|) | (7.1)
,where procid is the process id of the server, PS(v) is the set of surviving serversthat hold vertex v either as the master or a mirror and S is the set of all servers inthe cluster.
This optimization is not possible in LFGraph as the locations of the replicas ofa vertex are not available.
47
Chapter 8
FUTURE WORK
Distributed GraphLab [33] and PowerGraph [23] provide an asynchronous com-putation model. Asynchronous computation may benefit iterative machine learn-ing applications like Alternating Least Squares (ALS) [27]. One immediate direc-tion for future work is the application of Zorro reactive recovery protocol for asyn-chronous computation in PowerGraph. Another important direction is to study thefeasibility of Zorro-based failure recovery in GraphX [24] to assist its default re-covery using the lineage graph. Yet another direction of future work is to studythe application of Zorro for applications that use delta-updates between iterations.
In the current design, Zorro assumes that all failed servers are replaced beforegraph processing continues. Studying elasticity techniques to enable the frame-work to scale-out/in graph computation on failures depending depending upon theavailability of replacement servers is an important future direction. After failures,different applications may require different initialization functions for the verticeswhose state could not be recovered. To this end, a graph processing frameworkcould allow users to define a re-initialization function based on their needs. Ona theoretical side, it is important to study the roles different vertices play in theconvergence of graph applications. The studied properties can be used to enhancereactive recovery mechanisms in distributed graph processing frameworks.
Finally, reactive failure recovery mechanisms offer a cheap and effective alter-native to expensive proactive recovery mechanisms. Studying their applicationin other distributed data processing frameworks like stream processing frame-works [54] [60] is an important future direction.
48
Chapter 9
CONCLUSION
In this thesis, we have shown that reactive failure recovery mechanisms provide acheap, useful and accurate alternative to proactive recovery mechanisms. We pre-sented Zorro, a zero cost reactive recovery protocol which recovers from any num-ber of independent and cascading failures in distributed graph processing frame-works. By allowing replacement servers to rebuild their state using inherentlyreplicated state in distributed graph processing, Zorro enables failure recoverywhich maintains very high levels of accuracy.
[7] A.-L. Barabsi and R. Albert. Emergence of Scaling in Random Networks.In Science, 1999.
[8] B. Bhargava and S.-R. Lian. Independent Checkpointing and ConcurrentRollback for Recovery in Distributed Systems-An Optimistic Approach.
[9] P. Boldi, M. Rosa, M. Santini, and S. Vigna. Layered Label Propagation:A MultiResolution Coordinate-Free Ordering for Compressing Social Net-works. In Proceedings of the International Conference on World Wide Web(WWW). ACM, 2011.
[10] P. Boldi and S. Vigna. The WebGraph Framework I: Compression Tech-niques. In Proceedings of the International World Wide Web Conference(WWW). ACM, 2004.
[11] M. Bota, H.-W. Dong, and L. W. Swanson. From gene networks to brainnetworks. In Nature neuroscience, 2003.
[12] S. Brin and L. Page. The Anatomy of a Large-scale Hypertextual Web SearchEngine. In Computer networks and ISDN systems, 1998.
[13] R. H. Campbell and B. Randell. Error Recovery in Asynchronous Systems.Transactions on Software Engineering, 1986.
[14] K. M. Chandy and L. Lamport. Distributed Snapshots: Determining GlobalStates of Distributed Systems. In Transactions on Computer Systems(TOCS). ACM, 1985.
50
[15] R. Chen, J. Shi, Y. Chen, H. Guan, B. Zang, and H. Chen. Powerlyra: Dif-ferentiated Graph Computation and Partitioning on Skewed Graphs. In Pro-ceedings of the European Conference on Computer Systems (EuroSys), 2015.
[16] A. Ching. Scaling apache giraph to a trillion edges. Facebook Engineeringblog, 2013.
[17] C. Clark, K. Fraser, S. Hand, J. G. Hansen, E. Jul, C. Limpach, I. Pratt,and A. Warfield. Live Migration of Virtual Machines. In Proceedings ofthe Symposium on Networked Systems Design and Implementation (NSDI).USENIX, 2005.
[18] J. Dean. Experiences with mapreduce, an abstraction for large-scale compu-tation. In PACT, 2006.
[19] J. Dean and S. Ghemawat. MapReduce: Simplified Data Processing onLarge Clusters. In Communications of the ACM. ACM, 2008.
[20] E. N. Elnozahy, L. Alvisi, Y.-M. Wang, and D. B. Johnson. A Survey ofRollback-recovery Protocols in Message-passing Systems. ACM ComputingSurveys (CSUR), 2002.
[21] S. Ewen, S. Schelter, K. Tzoumas, D. Warneke, and V. Markl. Iterative Par-allel Data Processing with Stratosphere: An Inside Look. In Proceedings ofInternational Conference on Management of Data (SIGMOD). ACM, 2013.
[22] S. Ghemawat, H. Gobioff, and S.-T. Leung. The Google File System. InSIGOPS operating systems review. ACM, 2003.
[23] J. E. Gonzalez, Y. Low, H. Gu, D. Bickson, and C. Guestrin. PowerGraph:Distributed Graph-Parallel Computation on Natural Graphs. In Proceedingsof Symposium on Operating Systems Design and Implementation (OSDI).USENIX, 2012.
[24] J. E. Gonzalez, R. S. Xin, A. Dave, D. Crankshaw, M. J. Franklin, and I. Sto-ica. Graphx: Graph Processing in a Distributed Dataflow Framework. InProceedings of Symposium on Operating Systems Design and Implementa-tion (OSDI). USENIX, 2014.
[25] A. Gubichev, S. Bedathur, S. Seufert, and G. Weikum. Fast and AccurateEstimation of Shortest Paths in Large Graphs. In Proceedings of the Inter-national Conference on Information and Knowledge Management (CIKM).ACM, 2010.
[26] I. Hoque and I. Gupta. LFGraph: Simple and Fast Distributed Graph Analyt-ics. In Proceedings of Conference on Timely Results In Operating Systems(TRIOS). ACM, 2013.
51
[27] Y. Hu, Y. Koren, and C. Volinsky. Collaborative Filtering for Implicit Feed-back Datasets. In Proceedings of the International Conference on Data Min-ing (ICDM). IEEE, 2008.
[28] P. Hunt, M. Konar, F. P. Junqueira, and B. Reed. ZooKeeper: Wait-free Coor-dination for Internet-scale Systems. In Proceedings of the Annual TechnicalConference (ATC). USENIX, 2010.
[29] D. B. Johnson and W. Zwaenepoel. Recovery in Distributed Systems usingAsynchronous Message Logging and Checkpointing. In Proceedings of theSymposium on Principles of Distributed Computing (PODC). ACM, 1988.
[30] U. Kang, C. E. Tsourakakis, and C. Faloutsos. Pegasus: A peta-scale graphmining system implementation and observations. In Proceedings of the In-ternational Conference on Data Mining (ICDM). IEEE, 2009.
[31] H. Kwak, C. Lee, H. Park, and S. Moon. What is Twitter, a Social Networkor a News Media? In Proceedings of International Conference on WorldWide Web (WWW). ACM, 2010.
[32] A. Kyrola, G. E. Blelloch, and C. Guestrin. GraphChi: Large-Scale GraphComputation on Just a PC. In Proceedings of Symposium on OperatingSystems Design and Implementation (OSDI). ACM, 2012.
[33] Y. Low, D. Bickson, J. Gonzalez, C. Guestrin, A. Kyrola, and J. M. Heller-stein. Distributed GraphLab: A Framework for Machine Learning and DataMining in the Cloud. Proceedings of VLDB Endowment, 2012.
[34] Y. Low, J. Gonzalez, A. Kyrola, D. Bickson, C. Guestrin, and J. M. Heller-stein. GraphLab: A New Parallel Framework for Machine Learning. InConference on Uncertainty in Artificial Intelligence (UAI), 2010.
[35] A. Lowry, J. R. Russell, and A. P. Goldberg. Optimistic Failure Recoveryfor Very Large Networks. In Proceedings of the Symposium on ReliableDistributed Systems. IEEE, 1991.
[36] A. Lumsdaine, D. Gregor, B. Hendrickson, and J. Berry. Challenges in par-allel graph processing. In Parallel Processing Letters, 2007.
[37] P. Macko, V. J. Marathe, D. W. Margo, and M. I. Seltzer. LLAMA: EfficientGraph Analytics Using Large Multiversioned Arrays. 2015.
[38] G. Malewicz, M. H. Austern, A. J. Bik, J. C. Dehnert, I. Horn, N. Leiser, andG. Czajkowski. Pregel: A System for Large-Scale Graph Processing. In Pro-ceedings of International Conference on Management of Data (SIGMOD).ACM, 2010.
52
[39] I. Mitliagkas, M. Borokhovich, A. G. Dimakis, and C. Caramanis.FrogWild!–Fast PageRank Approximations on Graph Engines. In NIPSWorkshop on Distributed Machine Learning and Matrix Computations,2014.
[40] A. B. Nagarajan, F. Mueller, C. Engelmann, and S. L. Scott. Proactive FaultTolerance for HPC with Xen Virtualization. In Proceedings of the Interna-tional conference on Supercomputing (SC). ACM, 2007.
[41] D. Ongaro, S. M. Rumble, R. Stutsman, and J. Ousterhout. Fast crash re-covery in RAMCloud. In Proceedings of Symposium on Operating SystemsPrinciples (SOSP). ACM, 2011.
[42] R. Power and J. Li. Piccolo: Building Fast, Distributed Programs with Par-titioned Tables. In Proceedings of the Symposium on Operating SystemsDesign and Implementation (OSDI), 2010.
[43] L. Qin, J. X. Yu, L. Chang, H. Cheng, C. Zhang, and X. Lin. Scalablebig graph processing in mapreduce. In Proceedings of the InternationalConference on Management of Data (SIGMOD). ACM, 2014.
[44] M. Rosenblum and J. K. Ousterhout. The design and implementation ofa log-structured file system. In ACM Transactions on Computer Systems(TOCS). ACM, 1992.
[45] A. Roy, I. Mihailovic, and W. Zwaenepoel. X-stream: Edge-centric graphprocessing using streaming partitions. In Proceedings of Symposium on Op-erating Systems Principles (SOSP). ACM, 2013.
[46] S. Salihoglu and J. Widom. GPS: A Graph Processing System. In Pro-ceedings of International Conference on Scientific and Statistical DatabaseManagement. ACM, 2013.
[47] S. Schelter, S. Ewen, K. Tzoumas, and V. Markl. All Roads lead to Rome:Optimistic Recovery for Distributed Iterative Data Processing. In Proceed-ings of International Conference on Information and Knowledge Manage-ment (CIKM). ACM, 2013.
[48] S. B. Seidman. Network structure and minimum degree. Social networks,1983.
[49] Y. Shen, G. Chen, H. V. Jagadish, W. Lu, B. C. Ooi, and B. M. Tudor. FastFailure Recovery in Distributed Graph Processing Systems. In Proceedingsof the VLDB Endowment, 2015.
[50] K. Shvachko, H. Kuang, S. Radia, and R. Chansler. The Hadoop DistributedFile System. In Proceedings IEEE Symposium on Mass Storage Systems andTechnologies (MSST), 2010.
53
[51] S. W. Smith, D. B. Johnson, and J. Tygar. Completely Asynchronous Op-timistic Recovery with Minimal Rollbacks. In Proceedings of the Interna-tional Symposium on Fault-Tolerant Computing. IEEE, 1995.
[52] S. H. Strogatz. Exploring Complex Networks. Nature, 410, 2001.
[53] R. Strom and S. Yemini. Optimistic Recovery in Distributed Systems. ACMTransactions on Computer Systems (TOCS), 1985.
[54] A. Toshniwal, S. Taneja, A. Shukla, K. Ramasamy, J. M. Patel, S. Kulkarni,J. Jackson, K. Gade, M. Fu, J. Donham, et al. Storm @ Twitter. In Proceed-ings of the International Conference on Management of Data (SIGMOD).ACM, 2014.
[55] P. Wang, K. Zhang, R. Chen, H. Chen, and H. Guan. Replication-basedFault-tolerance for Large-scale Graph Processing. In International Confer-ence on Dependable Systems and Networks (DSN). IEEE, 2014.
[56] J. Ye, J.-H. Chow, J. Chen, and Z. Zheng. Stochastic Gradient Boosted Dis-tributed Decision Trees. In Proceedings of the Conference on Informationand Knowledge Management (CIKM). ACM, 2009.
[57] J. W. Young. A First Order Approximation to the Optimum CheckpointInterval. In Communications of the ACM. ACM, 1974.
[58] M. Zaharia, M. Chowdhury, T. Das, A. Dave, J. Ma, M. McCauley, M. J.Franklin, S. Shenker, and I. Stoica. Resilient Distributed Datasets: A Fault-tolerant Abstraction for In-memory Cluster Computing. In Proceedingsof Conference on Networked Systems Design and Implementation(NSDI).USENIX, 2012.
[59] M. Zaharia, M. Chowdhury, M. J. Franklin, S. Shenker, and I. Stoica. Spark:Cluster Computing with Working Sets. In Proceedings of Conference on Hottopics in Cloud Computing. USENIX, 2010.
[60] M. Zaharia, T. Das, H. Li, T. Hunter, S. Shenker, and I. Stoica. DiscretizedStreams: Fault-tolerant Streaming Computation at Scale. In Proceedings ofthe Symposium on Operating Systems Principles (SOSP). ACM, 2013.