49
c 2018 Jayasi Mehar

c© 2018 Jayasi Mehar
MELANGE: MULTI-TENANT SCHEDULING WITH ADAPTIVE EVICTION FORGRAPH PROCESSING CLUSTERS
BY
JAYASI MEHAR
THESIS
Submitted in partial fulfillment of the requirementsfor the degree of Master of Science in Computer Science
in the Graduate College of theUniversity of Illinois at Urbana-Champaign, 2018
Urbana, Illinois
Adviser:
Professor Indranil Gupta

ABSTRACT
Multi-tenancy is an important approach to resource consolidation in cluster management.
In this thesis we design and evaluate Melange, an efficient multi-tenant scheduler targeted
towards graph processing jobs. Melange supports job priorities and eviction, while attempt-
ing to avoid starvation. We propose novel ways of exploiting domain-specific knowledge to
achieve better scheduling decisions for graph processing jobs. We evaluate static eviction
policies and design Melange to adapt to the cluster and job state at run time to reduce
overhead costs during eviction. We have developed Melange as a cross-layer scheduler built
over Apache Giraph and YARN, and show experimental results with synthetic as well as
production workloads.
ii
To my parents, for their love and support.
iii

ACKNOWLEDGMENTS
This project has been done under the guidance of Professor Indranil Gupta. I want to
thank him for all the valuable feedback and academic advice throughout the course of my
degree.
I would also like to thank Mayank Bhatt without whom this work would not have been
possible. I also want to thank Faria Kalim, who has been a big pillar of support as a friend
as well as a colleague throughout my time at UIUC.
Finally, I deeply thank my family for always motivating me to see my goals come through.
iv

TABLE OF CONTENTS
CHAPTER 1 INTRODUCTION . . . . . . . . . . . . . . . . . . . . . . . . . . . . 11.1 Contributions of this Thesis . . . . . . . . . . . . . . . . . . . . . . . . . . . 2
CHAPTER 2 BACKGROUND . . . . . . . . . . . . . . . . . . . . . . . . . . . . . 42.1 Distributed Graph Processing Frameworks . . . . . . . . . . . . . . . . . . . 42.2 Multi-Tenancy in Cloud Systems . . . . . . . . . . . . . . . . . . . . . . . . 62.3 YARN . . . . . . . . . . . . . . . . . . . . . . . . . . . . . . . . . . . . . . . 7
CHAPTER 3 RELATED WORK . . . . . . . . . . . . . . . . . . . . . . . . . . . . 93.1 Cluster Scheduling . . . . . . . . . . . . . . . . . . . . . . . . . . . . . . . . 93.2 Multi-tenant Resource Management and Scheduling . . . . . . . . . . . . . . 93.3 Graph Processing Systems Scheduling . . . . . . . . . . . . . . . . . . . . . . 10
CHAPTER 4 SYSTEM DESIGN . . . . . . . . . . . . . . . . . . . . . . . . . . . . 114.1 Design Dimensions . . . . . . . . . . . . . . . . . . . . . . . . . . . . . . . . 114.2 Architecture . . . . . . . . . . . . . . . . . . . . . . . . . . . . . . . . . . . . 12
CHAPTER 5 SCHEDULING POLICIES . . . . . . . . . . . . . . . . . . . . . . . . 155.1 Notation . . . . . . . . . . . . . . . . . . . . . . . . . . . . . . . . . . . . . . 155.2 Priority Scheduling . . . . . . . . . . . . . . . . . . . . . . . . . . . . . . . . 155.3 Best Fit . . . . . . . . . . . . . . . . . . . . . . . . . . . . . . . . . . . . . . 165.4 Preemptive Shortest Job First . . . . . . . . . . . . . . . . . . . . . . . . . . 18
CHAPTER 6 PROGRESS COMPUTATION . . . . . . . . . . . . . . . . . . . . . . 206.1 Active Vertex Count Percentage . . . . . . . . . . . . . . . . . . . . . . . . . 206.2 Supersteps . . . . . . . . . . . . . . . . . . . . . . . . . . . . . . . . . . . . . 206.3 Speed of algorithm run . . . . . . . . . . . . . . . . . . . . . . . . . . . . . . 206.4 Measuring metrics . . . . . . . . . . . . . . . . . . . . . . . . . . . . . . . . 21
CHAPTER 7 EVICTION POLICIES . . . . . . . . . . . . . . . . . . . . . . . . . . 227.1 Eviction Policy . . . . . . . . . . . . . . . . . . . . . . . . . . . . . . . . . . 227.2 Eviction Mechanism . . . . . . . . . . . . . . . . . . . . . . . . . . . . . . . 237.3 Microbenchmarks . . . . . . . . . . . . . . . . . . . . . . . . . . . . . . . . . 24
CHAPTER 8 EVALUATION . . . . . . . . . . . . . . . . . . . . . . . . . . . . . . 288.1 Experimental Setup . . . . . . . . . . . . . . . . . . . . . . . . . . . . . . . . 288.2 Waiting Time . . . . . . . . . . . . . . . . . . . . . . . . . . . . . . . . . . . 288.3 Cluster Utilization . . . . . . . . . . . . . . . . . . . . . . . . . . . . . . . . 34
CHAPTER 9 CONCLUSION . . . . . . . . . . . . . . . . . . . . . . . . . . . . . . 35
v
CHAPTER 10 FUTURE WORK . . . . . . . . . . . . . . . . . . . . . . . . . . . . 3610.1 Adaptive Scheduling Engine . . . . . . . . . . . . . . . . . . . . . . . . . . . 3610.2 Edge Migration . . . . . . . . . . . . . . . . . . . . . . . . . . . . . . . . . . 3610.3 Lightweight Checkpointing . . . . . . . . . . . . . . . . . . . . . . . . . . . . 3610.4 Prescheduling . . . . . . . . . . . . . . . . . . . . . . . . . . . . . . . . . . . 37
REFERENCES . . . . . . . . . . . . . . . . . . . . . . . . . . . . . . . . . . . . . . . 38
vi

CHAPTER 1: INTRODUCTION
We are living in a digital age where massive amounts of valuable data is being continuously
generated due to the rapid growth of the internet, social media and the spread of IoT devices.
Processing this data is a key aspect in many machine learning and data mining applications
that provide better user experiences, policy decisions and aid in preventing calamities.
A lot of this data is represented in graphical forms—a basic data structure where entities
have connections between them. These connections can represent anything, for example, in
the Facebook social graph [1] the entities are users and an edge between them represents
friendship. Similarly, search engines [2], biological networks [3] and road network data [4] are
a part of graphical datasets which commonly consist of trillions of edges. Distributed graph
processing hence became a necessity to analyze graphs of such sizes. Google’s Pregel [5]
was one of the first distributed computation paradigms for processing large graphs. Build-
ing on this paradigm, frameworks such as Giraph [6], GraphLab, PowerGraph [7], LFGraph
[8], GraphX [9], have emerged in the field of distributed graph processing. Similar to how
the MapReduce programming model [10] allowed easily parallelizable programs, such frame-
works embody simplicity of development, by allowing users to write programs in an iterative
manner.
As these systems have matured, there has been some interest in developing multi-tenant
schedulers that can support graph processing jobs [11]. With multi-tenancy, jobs with differ-
ent demands can share a variety of computing resources within a single cluster. For example,
jobs with different priorities can be run on the same cluster. Multi-tenancy offers various
benefits, including consolidation of resources, where different jobs can load the same input
datasets from a common distributed file system. With graphs containing trillions of vertices,
replicating the datasets across different clusters could add a lot of memory overhead. With
multi-tenancy there is also a higher resource utilization which leads to lower capital expenses
(Capex), improved return on investment (ROI), and a smaller total cost of ownership (TCO).
However, multi-tenancy also brings a set of scheduling challenges alongside it. In a cluster
which is running jobs of different priorities, it is critical to produce timely results since it
can directly affect the revenue [12].
We propose using domain knowledge of the jobs to help scheduling decisions. Prior work
has shown the benefits of leveraging application level progress to prefetch data on machines
where job tasks are about to complete [11]. Similarly, we posit that leveraging application
specific information in graph processing could help improve the quality of scheduling decisions
1

in the cluster. To the best of our knowledge Melange is the first preemptive scheduler that
can work in a multi-tenant environment for graph processing jobs.
1.1 CONTRIBUTIONS OF THIS THESIS
This thesis describes our experiences in building Melange, a multi-tenant preemptive sched-
uler designed to incorporate graph processing jobs. The following are the goals of our work,
along with brief explanations of how our contributions help achieve them:
1.1.1 Goals
1. To run a consolidated cluster of graph processing jobs that can supportdifferent priorities and deadlines.
It is common for system administrators to run consolidated clusters just for graph pro-
cessing jobs so that existing data-sets on the shared storage can be reused. These jobs can
have different priorities which would be taken into account by the scheduler.
2. To achieve low waiting time for high priority jobs.
Higher priority jobs should be scheduled as soon as possible and can come at the cost of
evicting lower priority jobs.
3. Minimize overhead and slowdown by keeping context switch time minimized.
Evicting low priority jobs would involve some overhead, and we want to come up with a
mechanism that can minimize this cost.
4. Avoid starvation of low priority jobs.
While we want high priority jobs to be scheduled as soon as possible, we want to ensure
that low priority jobs are not completely starved.
5. Achieve high cluster utilization.
Scheduling policies that account for different priorities should also account for cluster
resources and ensure minimum idle containers.
2

1.1.2 Contributions
1. We design different scheduling policies that support priorities and multi-tenancy.
2. We use characteristics specific to graph processing jobs to device an efficient eviction
engine that can choose the way preemptions are handled to reduce duplicate work.
3. We extend Apache Giraph and YARN to develop a cross-layer preemptive scheduler
that can accept graph processing jobs of varying priorities.
4. We provide API hooks to allow custom policies for scheduling and eviction decisions.
5. We evaluate production and synthetic traces to conclude how our scheduling and evic-
tion policy compares with the default policies.
The rest of this thesis is organized as follows: In Chapter 2 we discuss the background of
distributed graph processing frameworks, multi-tenancy systems and cluster scheduling. In
Chapter 3 we discuss related work. Chapter 4 discusses the architecture for Melange and
the design decisions behind the same. Chapter 5 discusses our Scheduling Engine and the
policies that we implemented, Chapter 6 talks about how we measure job progress and 7
discusses our adaptive Eviction Engine. Chapter 8 is an overview of our experiments and
we discuss our conclusions in Chapter 9. Chapter 10 of this thesis talks about the scope for
future work.
3

CHAPTER 2: BACKGROUND
In this chapter, we discuss the background in current graph processing systems, multi-
tenancy in cloud systems and some existing work in cluster scheduling.
2.1 DISTRIBUTED GRAPH PROCESSING FRAMEWORKS
The first distributed graph processing paradigm was introduced by Google [5] in the Pregel
system. Pregel follows a Bulk Synchronous Processing model [13] of graph computation.
Each vertex is assigned to a node, and each process computes new values for each vertex
that it owns. This entire process is carried out in a series of synchronized ‘super steps’,
where there is a barrier between the different super steps in the processing. Within each
superstep the vertices compute in parallel, each executing the same user-defined function that
expresses the logic of a given algorithm. Thus, every process must finish its computations
for an iteration before the algorithm can proceed with the next iteration.
Algorithms written in such a paradigm can end in two ways - either by specifying a fixed
number of supersteps, or by waiting for all vertices to halt. When an algorithm starts, all
vertices are in the active state and participate in the computation that is required in a
superstep. A vertex deactivates itself by voting to halt, which implies that the vertex does
not participate in the computation of a superstep anymore. The framework will not execute
the vertex in the next supersteps unless that vertex receives a message from a neighbour
vertex. To deactivate itself again, the vertex must vote to halt again. The algorithm will
be terminate at a time when all the vertices are inactive and there are no more messages in
transit.
Figure 2.1 provides an illustration of the Shortest Paths algorithm implemented in the
Pregel paradigm. Here, every vertex is attempting to find its distance from a single source
vertex (initialized with a distance of 0). Every superstep, a vertex receives messages from the
previous iteration, updates its own distance from the source if needed, and then broadcasts
its new value to its neighbours. This process repeats until all vertices converge to their final
values, and hence all vote to halt.
Most distributed graph processing systems employ the paradigm called “Think Like a
Vertex”. Programmers write programs from the viewpoint of a vertex. For instance, in
4

Figure 2.1: Pregel Paradigm: An example of the Shortest Paths algorithm in Pregel.Dotted arrows represent messages. Each superstep, a vertex that received a message in theprevious iteration sends its value to its neighbours, until there are no more messages sent.
PageRank [14], the equation to update a vertex’s rank is as follows:
PR(v) =∑
q,(q,v)∈E
PR(q)
|out(q)|× 0.85 + 0.15 (2.1)
where out(q) represents outgoing edges from vertex q, PR(q) is the PageRank of vertex q,
and E is the graph’s edge set.
2.1.1 Giraph
Apache Giraph was developed as the open source framework built on the Pregel paradigm.
It is an iterative graph processing system that is built for high scalability. Facebook actively
uses Giraph to analyze the social graph formed by users and their connections. Giraph
added new functionality to the Pregel model by introducing things like master computation,
5

sharded aggregators, edge oriented input, out-of-core computation and more. Built in Java
and integrated with HDFS and Hadoop, we found it ideal to use it for our work.
2.1.2 Graph Algorithms
Several algorithms can be expressed using the Gather-Apply-Scatter paradigm, and each
one of them has different computation and network characteristics.
• PageRank - Used to rank websites in a web link graph.
• Approximate Diameter - Used to find the diameter of the given graph.
• Undirected Triangle Counting - Counts the number of three edge cycles in a graph.
• Single Source Shortest Path (SSSP) - This algorithm computes the shortest path
from a single vertex to all other vertices in the graph.
• K-Core Decomposition - This algorithm finds a maximal subgraph of a graph G
in which all vertices have degree at least k. Batagelj et al. [15] developed a parallel
version of it.
• Graph Coloring - This algorithm assigns labels (colors) to graph vertices such that
no two adjacent vertices have the same label.
Frameworks for distributed graph processing have also found their use in expressing ma-
chine learning algorithms. For instance, PowerGraph ships with an implementation of Latent
Dirichlet Allocation [16], used in analyzing text corpora, and collaborative filtering [17], used
in providing recommendations to users based on their interests and the interests of other
users. Other examples include matrix factorization [18], click through rate prediction [19],
and Collapsed Gibbs Sampling [20]. Given the growing interest in machine learning and
massive amounts of data available, optimizing the performance such frameworks has become
increasingly important.
2.2 MULTI-TENANCY IN CLOUD SYSTEMS
Multi-tenancy is a standard approach to resource consolidation in cloud computing, in
order to reduce operating costs. This involves multiple users using the same underlying
central infrastructure. Multi-tenancy thus necessitates systems for access control, isolation,
fairness, etc. For instance, a failure in a job of tenant A should not adversely affect the jobs
6

of tenant B. Similarly, if tenant A submits an overwhelmingly large number of jobs to the
cluster, tenant B’s jobs should not starve for resources.
Multi-tenancy also opens up the possibilities of SLOs (Service Level Objectives) wherein
the system should make certain minimum guarantees to tenants. For instance, a multi-tenant
database system might guarantee that 95th percentile latencies on queries will fall below a
certain threshold.
Alternatively, multi-tenancy allows for different priorities between the requests of different
tenants. For instance, if the same cluster is used for both production jobs that may impact
business intelligence, making them time critical (e.g., ad click analysis might need to be
done quickly) and research jobs, which may include experimental algorithms that are not as
business critical. The scheduler may choose to preferentially schedule the jobs of the former,
to ensure they finish quickly. In order to free up cluster resources, it may even preempt
the relatively low priority jobs so that business critical jobs may be run. For instance, the
YARN Fair Scheduler [21] can be configured to allow jobs from certain pools (say, production
workloads) to kill tasks in other pools (say, research jobs) to make room to run. This feature
is also supported in the YARN Capacity Scheduler [22]. Other multi-tenant systems are
discussed as part of related work in Chapter 3.
2.3 YARN
The YARN (Yet Another Resource Negotiator) scheduler was introduced in Hadoop 2.0
[23]. A key concept in YARN is the notion of a container, which is a unit of resource
allocation in the cluster. For instance, the ResourceManager (the ‘master’ that handles
resource allocation in the cluster) can be configured to allocate containers that contain 1 GB
of memory and 2 vCPUs. In the general workflow of a YARN application, an Application
Master (AM) is started on a single container, and then used to bootstrap the rest of the
YARN application, by requesting containers from the ResourceManager in order to run the
various tasks of the job.
For a Giraph application, the additional containers act as either a master or a worker.
The master is responsible for coordinating the supersteps of graph processing. The workers
are responsible for running the vertex programs, updating their own state, sending messages
to other vertices, and voting to halt the computation.
In a typical multi-tenant scenario, the YARN cluster is set up with multiple queues. For
instance, the cluster may have two queues, one for research jobs and one for production
jobs. YARN has a number of scheduling strategies to determine the distribution of resources
between these queues eg. Fair Scheduling and Capacity Scheduling.
7
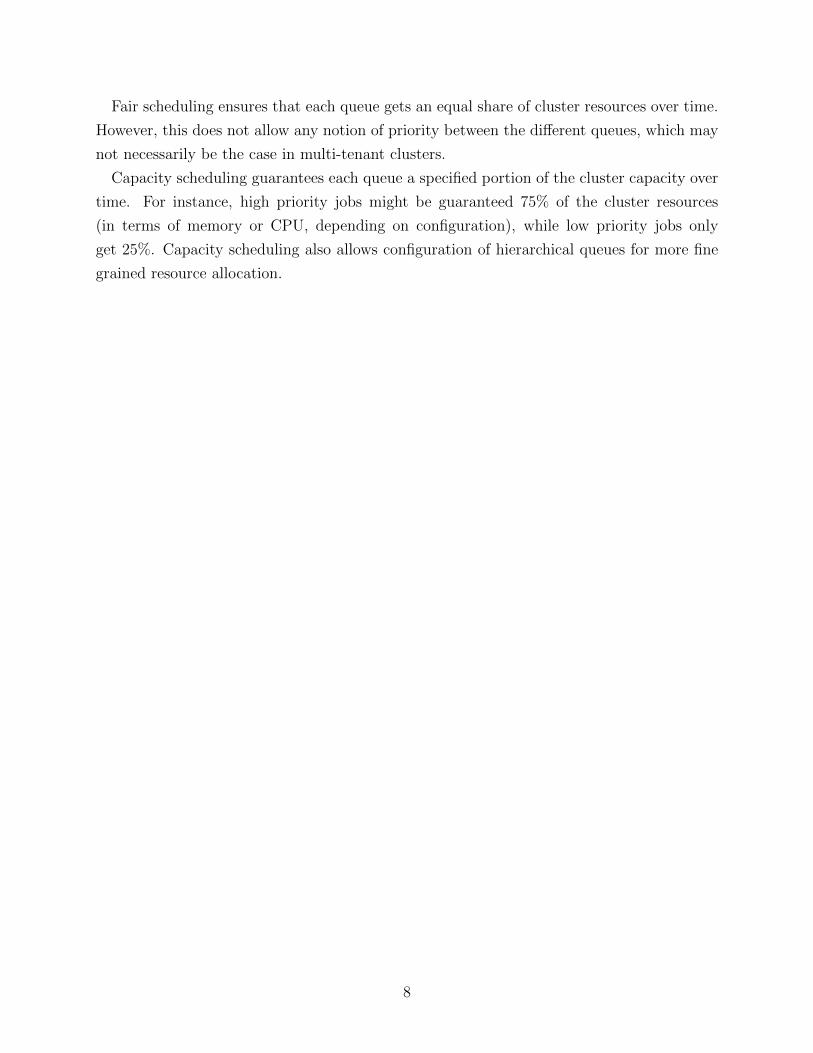
Fair scheduling ensures that each queue gets an equal share of cluster resources over time.
However, this does not allow any notion of priority between the different queues, which may
not necessarily be the case in multi-tenant clusters.
Capacity scheduling guarantees each queue a specified portion of the cluster capacity over
time. For instance, high priority jobs might be guaranteed 75% of the cluster resources
(in terms of memory or CPU, depending on configuration), while low priority jobs only
get 25%. Capacity scheduling also allows configuration of hierarchical queues for more fine
grained resource allocation.
8

CHAPTER 3: RELATED WORK
In this chapter, we discuss previous literature which is related to our work in this thesis.
Since we propose a multi-tenant preemptive scheduler for graph processing jobs, we look at
related work in domains of scheduling, graph processing and multi-tenancy.
3.1 CLUSTER SCHEDULING
There has been significant work on building various types of cluster schedulers in prior lit-
erature, including centralized schedulers such as YARN [23], Quincy [24] and Firmament [25]
to distributed schedulers like Mesos [26] and Sparrow [27], to hybrid schedulers like Eagle [28]
and Hawk [29]. However, most of them focus on addressing scalability and performance chal-
lenges of schedulers, and do not directly deal with multi-tenancy.
3.2 MULTI-TENANT RESOURCE MANAGEMENT AND SCHEDULING
There has been significant work on multi-tenancy in the domain of database systems, such
as DAX [30], ElasTRaS [31], Zephyr [32], Albatross [33], SWAT [34], and Schism [35]. Each
of them present a database design or technique that enhances multi-tenancy. However, they
do not deal with job scheduling. STeP [36] is also a multi-tenant system for Database as
a Service (DBaaS) workloads which looks into machine level resources to make scheduling
decisions. However, our work only considers container level granularity for making scheduling
decisions to avoid the overhead of looking into machine level statistics. Our work focuses
more on when to schedule rather than where to schedule.
There has been prior work on multi-tenancy in other domains, such as Pisces (key-value
store), Natjam [12] (deadlines in MapReduce scheduling), Amoeba (for data intensive compu-
tation) [37], and Henge [38] (stream processing). However, none of them address scheduling
in graph processing systems like Giraph or PowerGraph. We believe that adding graph pro-
cessing domain specific knowledge to a scheduler could help it make more efficient schedul-
ing decisions for the entire cluster. Some schedulers have also explored enforcing Service
Level Objectives (SLOs), such as Omega [39], Cake [40], Centrifuge [41], Azure [42], and
Jockey [43].
9
3.3 GRAPH PROCESSING SYSTEMS SCHEDULING
OPTiC [11] introduces a multi-tenant scheduler for graph processing workloads. However,
that work is orthogonal to ours because they do opportunistic scheduling to pre-schedule a
job on a set of machines and do not cover preemptive techniques.
10

CHAPTER 4: SYSTEM DESIGN
In this chapter, we give an overview of the system goals for Melange followed by a discussion
of it’s overall architecture. We explain our system design in detail and talk about the
decisions behind our choices.
4.1 DESIGN DIMENSIONS
To provide optimized completion times for high priority jobs, we sometimes need to free
cluster resources by preempting lower priority jobs. This section discusses how we achieve
this. We enumerate the different dimensions along which we design an efficient multi-tenant
scheduler:
1. Decide which job should be scheduled: Given a queue of waiting jobs, the sched-
uler decides which job should be scheduled next based on priority and resource re-
quirements. Low priority jobs can afford to wait if cluster resources are not available,
whereas higher priority jobs might need to be immediately scheduled.
2. Decide whether some job(s) need to be preempted: If there aren’t enough
cluster resources available for a job to run, decide whether a lower priority job has to
be preempted, based on the cost of preemption.
3. Decide how this job has to be preempted, by either killing or checkpointing
it:
• Eviction by Killing: If a job is evicted by killing, all the prior work that has been
done by the job will be lost. When this job is resumed, it will start from the
ingress stage again. The benefit of this type of eviction is that the waiting job
can be scheduled immediately without any delay.
• Eviction by Checkpointing: If a job is evicted using checkpointing, the job will
be restarted with a previously saved state and will finish quicker than the resume
from start. However, checkpointing a job will take time which will delay running
the waiting job.
To build such a scheduler, we look at two separate goals: efficient scheduling policies and
efficient eviction policies. Melange APIs are designed to distinguish mechanisms (the actual
11

enforcement of scheduling or eviction decisions) from policy (making such decisions). Thus,
Melange simplifies the task of writing a new scheduling or eviction policy, by allowing any
user-defined scheduling functions to be called.
4.2 ARCHITECTURE
We extend Apache Giraph [6] to build Melange. Giraph has abstractions that allow jobs
being submitted to a YARN cluster, and it runs atop Apache ZooKeeper [44] for communi-
cation between workers. Any data that is accessed by Giraph is stored in HDFS [45]. Over
Giraph, we developed a cross-layer scheduler that can accept graph processing jobs from
users and sync with YARN to schedule jobs efficiently. We are able to directly plug into
YARN because our work focuses only on using the number of containers for scheduling (we
don’t worry about which machine in the cluster the job should be submitted at).
Figure 4.1: System Design: Our cross-layer scheduler is built atop Giraph, and usesZooKeeper and HDFS for its internal engines.
Melange has a YARN-Client to keep track of the cluster and job state, based on which it
decides which order jobs would be submitted to YARN. Within the Melange scheduler, we
have two engines, the Scheduling Engine and the Eviction Engine. The Scheduling Engine
decides which job will be scheduled next, and the Eviction Engine decides if there needs to
be a job evicted and how to evict that job from the cluster. Both modules are independent
from each other to provide easy APIs to switch scheduling and eviction policies. The third
12

module in our scheduler is the Progress Estimation Engine, which keeps track of running
jobs’ metrics and comes up with a comparable score for each job. This progress is used
by the Eviction Engine to evict jobs. We discuss all policies that we implemented in these
engines in Chapter 5 and Chapter 7.
Our scheduler can be invoked when a new job is submitted, or when a running job finishes.
It also periodically runs as a background daemon in search of jobs near completion. Each
time the scheduler is invoked, it first updates its local state, by pruning finished jobs from
its data structures and updating the progress metrics of currently running jobs. We do this
by syncing with the YARN cluster state.
To track each job in the cluster, Melange issues its own job IDs rather than leverage the
existing YARN application IDs. This is because, over the course of a job’s lifetime, it may
be preempted and restarted multiple times, each time obtaining a different application ID,
necessitating an identification that is independent of the executing YARN application. The
scheduler tracks the life cycle of a job, which can go through various states as shown in
Figure 4.2:
Figure 4.2: State Diagram: The various states a process can be in after being submittedto the scheduler.
In addition, Melange also tracks the total number of free containers available in the cluster.
The total number of containers in a cluster are based on the physical resources available on
each machine and the number of total machines in the cluster, hence making the initial
configuration of total containers easy.
Following this, Melange runs the configured engines in order to produce a scheduling
decision (the list of jobs to be run and preempted, respectively). The Eviction Engine also
further decides whether to checkpoint or kill (any) jobs based on the job requirements and
the data received from the Progress Engine.
In order to track application progress, we leverage ZooKeeper as the coordination service
between the running jobs and our scheduler. Each job’s master updates its progress met-
rics on ZooKeeper, and this information is periodically read by our scheduler whenever it
makes a scheduling pass (either periodically or on job submission). Since the master and
13

workers already interact with ZooKeeper to coordinate the supersteps of the algorithm, this
additional data does not add overhead to our algorithm running time.
14

CHAPTER 5: SCHEDULING POLICIES
In this chapter, we discuss different policies for scheduling that we have implemented
with Melange. Some of them are well studied in literature [46], while others leverage graph
application progress in making decisions. Melange’s Scheduling Engine provides an API
to write different policies that the scheduler can run. Given the set of waiting jobs, this
component decides which job to run based on the current waiting job priorities, waiting
times and cluster state.
The choice of scheduling policy is important because it can affect the turn around time
for jobs. We propose modifying the existing classical scheduling algorithms to utilize the
progress updates obtained from graph processing jobs, as well as to account for priority, and
starvation time. In this section we talk about our proposed modifications.
5.1 NOTATION
Let J = (j1, j2, j3, ..jn) be the set of all the jobs. We use T = (t1, t2, t3...tn) to represent
the inter-arrival times of these jobs respectively. containers(ji) and priority(ji) represent
the resource requirements and priority of job ji respectively. Furthermore, we can define two
sets, RJS and WJS, which represent the current running and waiting jobs in the cluster,
respectively.
Given the above notation, we explore modifying the classical scheduling algorithms to
account for priority and starvation time in the following sections.
5.2 PRIORITY SCHEDULING
One of the major goals of this thesis was to reduce the waiting time for high priority jobs
and we look to address that first. Priority based scheduling is one of the most common
strategies used in batch systems. Traditionally it is a non-preemptive scheduling strategy
where a job with the highest priority is scheduled first. Since we are running a multi-tenant
system which has jobs of different priority, this was intuitively the first scheduling strategy
that we chose to explore.
However, this strategy can lead to starvation in lower priority jobs. It is also important
to schedule as many jobs as possible at a time so that the throughput remains high. Given
these requirements, this strategy had to be modified to account for resource requirement,
15

waiting time and the eviction of currently running, low priority jobs. Given two waiting
jobs, we propose the following heuristics for Priority Scheduling:
1. We want to first schedule the job which is higher in priority.
2. If the priorities of both jobs are the same, we look at the resource requirement of the
two jobs and schedule the one with lower resource requirement. With this, multiple
jobs can be scheduled leading to a higher throughput.
3. If both jobs need the same amount of resources, then we schedule the job that has
been waiting the longest.
The above heuristics can be represented in the form of a cost function. In summary, we
want to schedule a job with highest priority or very high starvation first, and we capture
this by the following equation:
cost(j) = w1 × priority(j) + w2 × waiting(j) (5.1)
In the above equation, waiting(ji) = current− ti.Equation 5.2 has three parts over which it sums over. The first part of the equation
captures the priority of the job, and the second part of the equation captures the container
requirement. We have an inverse relation for container requirement so that lower containers
can give us a higher score. The last part of the equation captures the waiting time of the
job to avoid starvation.
schedule next = argmaxji∈WJS
(cost(ji)) (5.2)
The job with the highest cost would be selected by the scheduler, as captured by Equation
5.2. We implement this strategy using the APIs provided by the Scheduling Engine and
compare it with the baseline first in first out (FIFO) and our other implemented strategies
in Chapter 8.
5.3 BEST FIT
Our second scheduling policy is the Best Fit scheduling. It gives priority to those jobs
which have the closest resource requirements to what is available in the cluster. We mod-
16

ify the classical scheduling algorithm to incorporate priority and waiting time. Given two
waiting jobs, we have the following heuristics to modify Best Fit:
1. If both jobs need fewer number of containers than the number of available containers,
then:
• The job which needs more containers (better fit) should be scheduled first.
• If both jobs need the same number of containers, then the job with the higher
priority should be scheduled first.
• If both jobs have the same priority, then the job with the higher waiting time
should be scheduled first.
2. If one job needs higher number of containers than currently available and the other
job needs lower number of containers than currently available:
• Schedule the job with lower number of containers requirement.
3. If both jobs need higher number of containers than currently available:
• Schedule based on priority and waiting time, and then let the eviction engine take
care of whether and how to preempt enough jobs to make resources available.
Using α to denote the number of containers available in the cluster currently, we express
the above heuristics in the form of a cost function:
cost(j) = w1 ×1
ε+ (α− containers(j))+ w2 × priority(j) + w3 × waiting(j) (5.3)
The first term of Equation 5.3 captures the “Best Fit” score. Having an inverse relation
with (α− containers(j)) ensures that the score is highest when α is equal to containers(j).
We add ε, a small constant to avoid divide by zero errors. The second term of the equation
adds a cost for the job priority, so a job with a higher priority will have a higher score.
The third part of the equation adds a value to the cost for starving jobs. A job which has
been waiting longer would have a higher total cost. Melange will schedule the job which has
the highest cost value, as given in Equation 5.2. The weights can be tuned to increase or
decrease the value of the different terms.
We compared Melange Best Fit with vanilla Best Fit and found that our policy reduces
the number of preemptions, as seen in Table 5.1. We implement this strategy and compare
it with other policies in Chapter 8.
17

Vanilla Best Fit Melange Best Fit
Preemptions 18 11
Table 5.1: Number of Preemptions: Melange Best Fit reduces the total number ofpreemptions.
5.4 PREEMPTIVE SHORTEST JOB FIRST
We next explore the preemptive version of Shortest Job First, where the scheduler decides
to schedule the job which has the shortest execution time. Apriori knowledge of the run
time of a job is a difficult problem. There are a lot of varying factors including the size of
the graph, the algorithm being run and the number of workers for the job. We ran some
profiling experiments with different graphs and workers to come up with an approximate
metric for run time. Our results are shown in Figures 5.1 and 5.2.
Figure 5.1: Run time Variation with graph size: The run time of a job increases withthe size of the input, enabling better estimates for our Shortest Job First policy.
As shown above, we found that the run time of a job is highly correlated with the size of
the input graph. A job which is submitted with a graph size of million vertices is likely to
take more execution time than a job that is submitted with a graph size of 150000 vertices.
We can also see that the number of workers also affect the total time that the job takes to
execute. Higher the number of workers, the faster the job takes to run. However, as seen in
Figure 5.2, the improvements saturate after a certain level of parallelism because the cost of
dividing the graph is higher than the benefit of multiple workers.
Based on our observed results, we device a cost function for Preempted Shortest Job First
that can account for estimated running time of the job as well as priority and starvation.
18

Figure 5.2: Run time Variation with number of workers: The run time of analgorithm decreases up to a point as workers are added, after which the coordinationoverhead increases.
cost(ji) = w1 × waiting(ji)× priority(ji) + w2 ×containers(ji)
size(graphi)(5.4)
We aim to schedule the job which maximizes the score given by Equation 5.4. The first
part of this equation is the starvation score. We weigh it by the priority of the job, so that
long waiting high priority jobs get more weight. The second part of the equation captures
the estimated running time of the job. We have seen a correlation between the number of
containers and the size of the input graph. Our score will maximize for a higher number of
containers and a smaller graph size. We have chosen this relation because a larger graph
size is linked with higher running time, and more parallel jobs tend to finish faster as seen
from the graph. There are weights assigned to each of the terms in the equation which can
be tuned to increase or decrease the value given to starvation of a job.
19

CHAPTER 6: PROGRESS COMPUTATION
In this chapter, we discuss the metrics that are used by Melange to compute progress of
running jobs. This progress is computed by the Progress Engine. This module of our system
aids the Eviction Engine to decide which jobs to evict.
There can be multiple ways in which one can compute the progress of a graph processing
job. One such way would be to leverage YARN or Mesos metrics. However, such metrics
will not generalize for graph processing jobs that do not rely on staged dataflows, e.g., Chaos
[47]. Rahman et al [11] propose graph-domain techniques of measuring progress. We build
upon that notion and propose further optimizations that we use for Melange.
6.1 ACTIVE VERTEX COUNT PERCENTAGE
Graph algorithms in Giraph are iterative, and in each iteration vertices receive and send
messages. Based on the messages they receive, the vertices can change their own state.
Vertices are allowed to become inactive - which essentially means that they have no more
state change or messages to send. Once a vertex becomes inactive, Giraph does not wake
it up, unless it receives new messages. During a single run of a graph processing job, the
percentage of active vertices can vary, as discussed in [11]. In most algorithms, the active
vertices follow the trend of increasing with time till all vertices become active, after which
the active vertex percentage starts to decrease.
6.2 SUPERSTEPS
In certain algorithms like PageRank, the percentage of active vertices remains constant
throughout the algorithm run. Such algorithms only halt after a fixed number of supersteps.
Since these supersteps are provided when submitting a job to our scheduler, we use the
percentage of supersteps completed as a progress metric.
6.3 SPEED OF ALGORITHM RUN
Based on the graph size, and the algorithm running, certain jobs tend to finish faster than
others even if they are at the same progress. For example, one iteration of PageRank is much
slower than one iteration of SSSP on the same graph. In such case, given that the SSSP job
20

started later than PageRank, it is possible that it overtakes it and finishes faster. Since jobs
running in a cluster can be heterogeneous, we propose also utilizing the rate of change of
progress, which is the speed of the run, as another metric.
speed =progress
timeTaken(6.1)
Here, progress can be calculated using either of the above two ways.
6.4 MEASURING METRICS
All the above metrics can only be used if all workers send consolidated individual metrics
to a central worker. Running in a distributed environment, each partition contains local
statistics about how many vertices are active. These numbers are consolidated and sent
to our scheduler by the ApplicationMaster. To achieve this, all individual partitions write
their statistics to ZooKeeper. In each superstep, the Master accesses these statistics from
ZooKeeper and consolidates them. After aggregating all the metrics, the Master writes
these metrics back to ZooKeeper with the unique job identification. As a part Melange, the
Progress Engine can go over the list of running jobs and directly access their metrics from
ZooKeeper.
21

CHAPTER 7: EVICTION POLICIES
In this chapter, we talk about the design of our adaptive Eviction Engine. Every time
a job is evicted, it comes with a cost of the context switch - the time it takes to preempt
and the amount of duplicate work a job will have to do. To keep this cost minimized, we
propose an adaptive Eviction Engine. When the Scheduling Engine decides which job it has
to schedule, the decision is passed on to the Eviction Engine if enough resources are not
available in the cluster. Given a job ji which has to be scheduled, and the set RJS of all
the running jobs, the Eviction Engine answers the following questions:
1. Which job(s) to evict from RJS?
2. What is the best eviction mechanism for each individual job that has to be evicted?
In the following sections, we talk about how Melange decides to answer the above two
questions.
7.1 EVICTION POLICY
There is a lot of past literature surrounding eviction policies. For Melange, we consider
the following two policies for our Eviction Engine.
7.1.1 Progress Based Eviction
This strategy aims to evict new jobs - those jobs which have not made enough progress
yet. Evicting jobs based on progress has the advantage of saving work. Basically, if a running
job has made 90% progress, we do not want to evict it in comparison to a job which has
made just 10% progress. Given the progress of each job via the Progress Engine, we start to
eliminate the jobs with lowest progress till the time there are enough resources available for
the new job to run. The progress engine returns a normalized score for all jobs, and it can
use different ways to calculate scores for jobs running different graph algorithms. Our work
focuses on this kind of eviction.
7.1.2 Resource Based Eviction
Given that we want to schedule ji, which requires c = containers(ji) containers to run,
we find the minimum number of running jobs to evict. This means that we want to find
22

those jobs, which will release just enough containers for the new job to be scheduled.
minsize(RJS)
∑ji∈RJS
containers(j) = crequired (7.1)
This can be thought similar to the best fit scheduling algorithm. In scheduling we find the
job that best fits the total number of containers available, and in eviction, we look for the
running job that best matches the number of containers required by the job which is waiting
to be scheduled next. Since we are not looking at a lot of graph domain specific knowledge
in this type of eviction, implementing this remains a part of our future work.
7.2 EVICTION MECHANISM
Previous work has shown that naive killing of jobs for for eviction is not necessarily op-
timal [48]. On the other hand, techniques like checkpointing lead to an initial overhead of
saving the state of the job and resuming it, adding storage and compute overhead (due to
saving state in a DFS, and optionally compressing checkpoint data for storage). We explore
trade-offs in this section.
7.2.1 Kill-based Preemption
Killing a job is a faster process, but it discards any progress a job has already made, that
is, when the job is rescheduled, it must be restarted from the ingress stage. Thus, it may
be the appropriate choice if a job has made little progress (say, if it is still in the ingress
phase), or the containers must be quickly freed and given to another job (since a job being
checkpointed will continue to hold resources until it saves its state).
7.2.2 Checkpointing Based Preemption
Checkpointing is a work-saving technique for eviction. As part of checkpointing, the graph
state is saved to disk, and a job can resume from that saved state later in time. Traditionally,
periodic checkpointing is used for fault tolerance in graph processing systems, wherein the
nodes save their respective states to a DFS after a specified number of supersteps. However,
since it is an expensive operation (due to the overhead of writing to replicated storage in
a DFS), it is usually disabled, and failed jobs are restarted [1]. Instead, we consider using
on-demand checkpointing, similar to Natjam [12]. Thus, Melange can signal the job to
checkpoint at some point during this execution. This allows saving the progress of a job only
23

if needed. This approach may work better if we are evicting a job that has made significant
progress, but must be preempted. Thus, we can avoid repeated a significant part of the
computation by leveraging checkpoints stored in a DFS.
7.2.3 Edge Migration
An alternative to preemption would be dynamically adding or removing workers to/from
jobs at runtime. This would be a more elastic approach to scheduling, having the benefit
of avoiding preemption completely. However, it presents some additional overhead in that
a job will presumably have to stall in its current superstep while the graph is repartitioned
across the workers. This is out of the scope of this current work right now. Indeed, prior
work has explored some of these ideas, although not in the context of multi-tenancy [49]
7.3 MICROBENCHMARKS
As discussed above, different eviction mechanisms come with different trade-offs. We
wanted Melange to be able to make a decision at run time on which eviction method to use.
The scheduler should be able to switch between different eviction mechanisms. We performed
some microbenchmarks with jobs of varying sizes, and explore checkpointing and killing the
job as ways to preempt in different scenarios. For the purpose of these experiments, we set
up an Emulab cluster of 10 d710 nodes, and configure YARN to create 25 containers. We
generate synthetic traces which just schedule one job at a time and evict it during different
stages of progress. We use synthetic Power-law graphs [50] for our experiments, and run jobs
with SSSP and PageRank.
7.3.1 Time to Checkpoint
While checkpointing leads to saving work that has already been done by a job, it also
adds an extra overhead to the new jobs waiting to be scheduled. The new job can not be
scheduled till the time the evicted job finishes checkpointing. The total time to checkpoint
a job can vary based on various metrics, and we explore the effect of graph size on the same.
We measure the time to checkpoint at different progress stages of a job run.
As seen from Figure 7.1, the time that it takes to checkpoint varies with the progress of
the job, as well as the graph size. It takes lesser time to checkpoint a job which is running on
a smaller graph size compared to a job which is running on a larger graph. This is because
a smaller graph size means that there is less state that needs to be checkpointed. We also
24
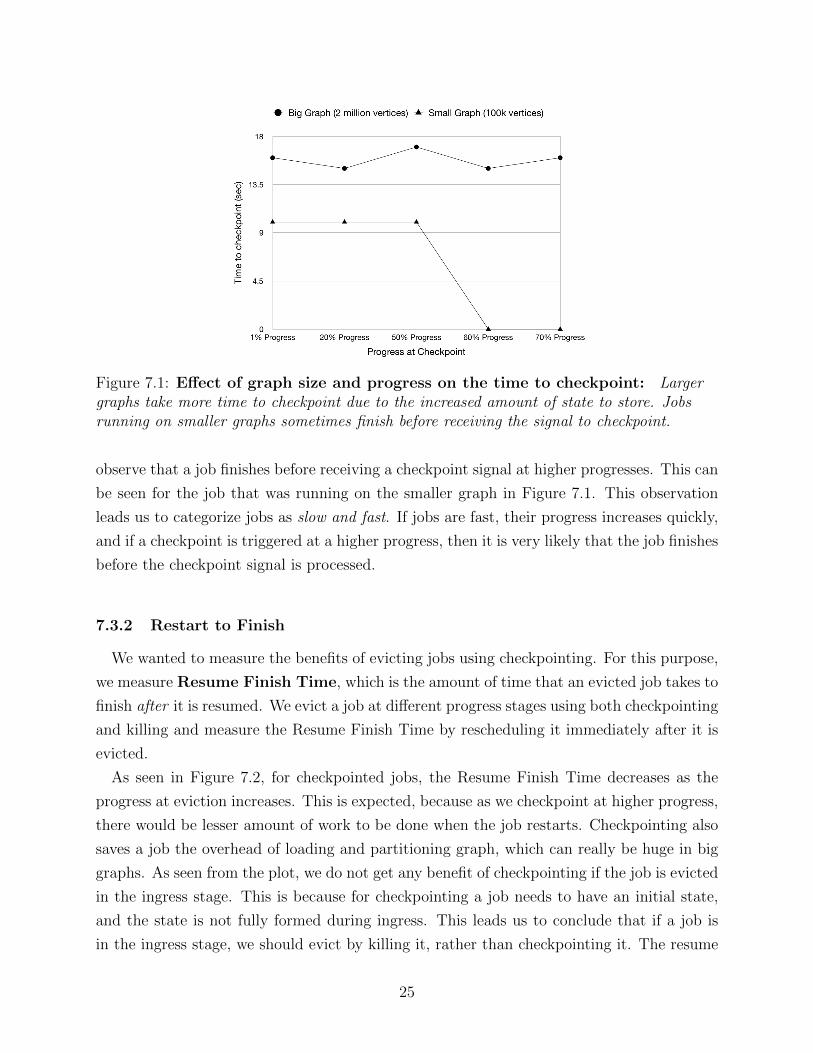
Figure 7.1: Effect of graph size and progress on the time to checkpoint: Largergraphs take more time to checkpoint due to the increased amount of state to store. Jobsrunning on smaller graphs sometimes finish before receiving the signal to checkpoint.
observe that a job finishes before receiving a checkpoint signal at higher progresses. This can
be seen for the job that was running on the smaller graph in Figure 7.1. This observation
leads us to categorize jobs as slow and fast. If jobs are fast, their progress increases quickly,
and if a checkpoint is triggered at a higher progress, then it is very likely that the job finishes
before the checkpoint signal is processed.
7.3.2 Restart to Finish
We wanted to measure the benefits of evicting jobs using checkpointing. For this purpose,
we measure Resume Finish Time, which is the amount of time that an evicted job takes to
finish after it is resumed. We evict a job at different progress stages using both checkpointing
and killing and measure the Resume Finish Time by rescheduling it immediately after it is
evicted.
As seen in Figure 7.2, for checkpointed jobs, the Resume Finish Time decreases as the
progress at eviction increases. This is expected, because as we checkpoint at higher progress,
there would be lesser amount of work to be done when the job restarts. Checkpointing also
saves a job the overhead of loading and partitioning graph, which can really be huge in big
graphs. As seen from the plot, we do not get any benefit of checkpointing if the job is evicted
in the ingress stage. This is because for checkpointing a job needs to have an initial state,
and the state is not fully formed during ingress. This leads us to conclude that if a job is
in the ingress stage, we should evict by killing it, rather than checkpointing it. The resume
25
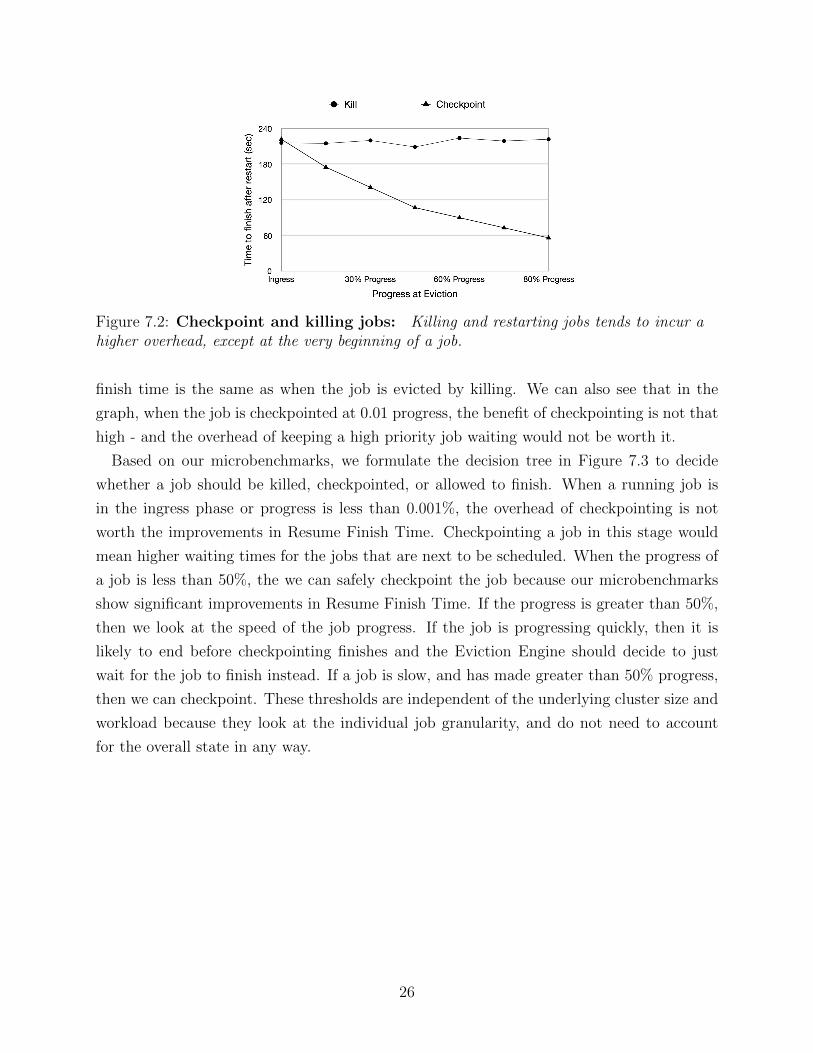
Figure 7.2: Checkpoint and killing jobs: Killing and restarting jobs tends to incur ahigher overhead, except at the very beginning of a job.
finish time is the same as when the job is evicted by killing. We can also see that in the
graph, when the job is checkpointed at 0.01 progress, the benefit of checkpointing is not that
high - and the overhead of keeping a high priority job waiting would not be worth it.
Based on our microbenchmarks, we formulate the decision tree in Figure 7.3 to decide
whether a job should be killed, checkpointed, or allowed to finish. When a running job is
in the ingress phase or progress is less than 0.001%, the overhead of checkpointing is not
worth the improvements in Resume Finish Time. Checkpointing a job in this stage would
mean higher waiting times for the jobs that are next to be scheduled. When the progress of
a job is less than 50%, the we can safely checkpoint the job because our microbenchmarks
show significant improvements in Resume Finish Time. If the progress is greater than 50%,
then we look at the speed of the job progress. If the job is progressing quickly, then it is
likely to end before checkpointing finishes and the Eviction Engine should decide to just
wait for the job to finish instead. If a job is slow, and has made greater than 50% progress,
then we can checkpoint. These thresholds are independent of the underlying cluster size and
workload because they look at the individual job granularity, and do not need to account
for the overall state in any way.
26

Figure 7.3: Preemption Method decision tree: Based on our microbenchmarks, weformulate a decision tree to determine whether a job should be killed, checkpointed, orallowed to complete.
27

CHAPTER 8: EVALUATION
This chapter presents our experimental results with different workloads, scheduling policies
and eviction strategies. We show how we have achieved each of our goals as laid out in
Chapter 1:
1. To run a consolidated cluster of graph processing jobs that can support different pri-
orities and deadlines.
2. To achieve low waiting time for high priority jobs.
3. Avoid starvation of low priority jobs.
4. Minimize overhead and slowdown by keeping context switch time minimized.
5. Achieve high cluster utilization.
8.1 EXPERIMENTAL SETUP
We run our experiments on an Emulab [51] cluster of 25 containers. We use eleven d710
nodes, and set up Hadoop with YARN having workers of 2 GB each. For our workloads, we
use Yahoo! MapReduce traces [12]. To the best of our knowledge, there is no publicly avail-
able workload for graph processing jobs. Since Giraph converts jobs internally to mappers
and reducers, we found it suitable to use the MapReduce job traces from Yahoo! for our
experiments.
We use the total running time of the job to decide how big the graph should be. The
number of mappers and reducers are used to decide how many workers the job should be
submitted with. All generated graphs are Power-law and are generated by Darwini [50],
a synthetic graph generator. We combine the production and research traces to one trace
containing both kinds of jobs and use it for our evaluation. By providing the functionality
to submit graph processing jobs of different priorities, we have achieved our first goal.
8.2 WAITING TIME
The turn around time of a job involves (1) the waiting time, i.e., the amount of time a
job has to wait before it has been given enough resources to start running, (2) the running
28
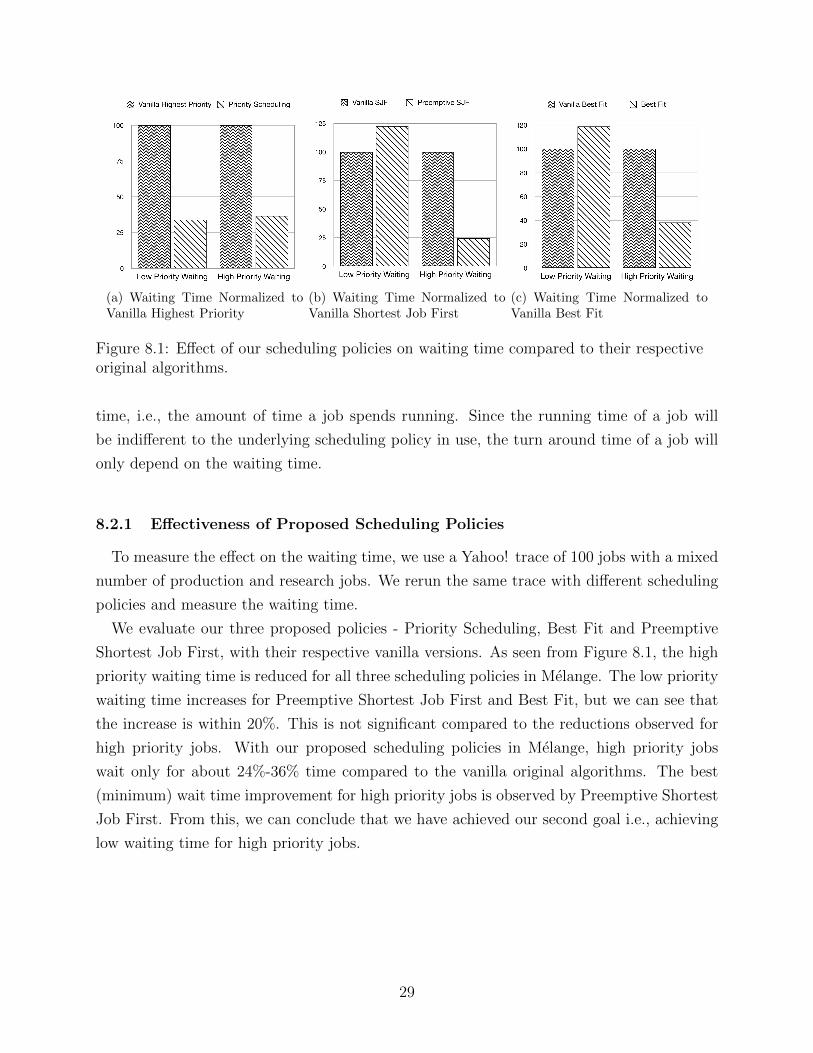
(a) Waiting Time Normalized toVanilla Highest Priority
(b) Waiting Time Normalized toVanilla Shortest Job First
(c) Waiting Time Normalized toVanilla Best Fit
Figure 8.1: Effect of our scheduling policies on waiting time compared to their respectiveoriginal algorithms.
time, i.e., the amount of time a job spends running. Since the running time of a job will
be indifferent to the underlying scheduling policy in use, the turn around time of a job will
only depend on the waiting time.
8.2.1 Effectiveness of Proposed Scheduling Policies
To measure the effect on the waiting time, we use a Yahoo! trace of 100 jobs with a mixed
number of production and research jobs. We rerun the same trace with different scheduling
policies and measure the waiting time.
We evaluate our three proposed policies - Priority Scheduling, Best Fit and Preemptive
Shortest Job First, with their respective vanilla versions. As seen from Figure 8.1, the high
priority waiting time is reduced for all three scheduling policies in Melange. The low priority
waiting time increases for Preemptive Shortest Job First and Best Fit, but we can see that
the increase is within 20%. This is not significant compared to the reductions observed for
high priority jobs. With our proposed scheduling policies in Melange, high priority jobs
wait only for about 24%-36% time compared to the vanilla original algorithms. The best
(minimum) wait time improvement for high priority jobs is observed by Preemptive Shortest
Job First. From this, we can conclude that we have achieved our second goal i.e., achieving
low waiting time for high priority jobs.
29

Figure 8.2: Average Waiting Time We are able to reduce the average waiting time forhigh priority jobs using Melange scheduling policies.
8.2.2 Comparison between Proposed Scheduling Policies
To compare how our proposed policies perform with respect to each other, we evaluate the
waiting time of low and high priority jobs running the same trace with different policies in
Melange. As seen in Figure 8.2, all three of our proposed algorithms reduce the waiting time
of high priority jobs compared to the baseline FIFO scheduling. We observe that Preemptive
Shortest Job First has the lowest wait time for both the high and low priority jobs.
Best Fit Priority Scheduling Preemptive Shortest Job First
Preemptions 18 6 9
Table 8.1: Number of jobs preempted with each policy in Melange.
From Figure 8.2 we can see that the waiting time for low priority jobs in Priority Scheduling
and Best Fit increases in comparison to the baseline FIFO. The waiting time of low priority
jobs can be high because of (1) the number of evictions are high or (2) the scheduling policy
does not decide to schedule job. As seen in Table 8.1, Best Fit preempts the most number
of jobs, which is why the waiting time for low priority jobs is highest for this policy. For
Priority Scheduling, the high waiting for low priority jobs can be attributed to the scheduling
decisions made by the policy, i.e., not scheduling low priority jobs till there are high priority
jobs waiting.
In both these policies, the increase in low priority waiting time is under 15% of the high
priority waiting time as seen in Figure 8.2. From this we conclude that we have achieved
our third goal, i.e., avoiding starvation for low priority jobs.
30

8.2.3 Effectiveness of Eviction Mechanism
Figure 8.3: Waiting time CDF for low priority jobs with different evictionmechanisms: Melange Eviction reduces the waiting time for low priority jobs.
Our adaptive Eviction Engine is based on our microbenchmarks and subsequent decision
tree as discussed in Chapter 7. We measure the improvements in waiting time by running
a trace with three different eviction mechanisms: only checkpointing, only killing and using
the adaptive technique implemented in Melange. As seen in the wait time CDF in Figure 8.3,
Melange’s dynamic mechanism reduces the wait time for about 50% of the low priority jobs.
Towards the tail, the Melange eviction mechanism performs similar to the other preemption
mechanisms. This is because the scheduling policy chooses not to schedule low priority jobs
over waiting high priority jobs.
We measure the waiting time accounting for both low and high priority jobs in Figure 8.4.
While Melange’s dynamic eviction shows more prominent results for the waiting time of low
priority jobs, Figure 8.4 shows that there is also an improvement in the overall waiting time.
From this we can conclude that we have minimized the cost of context switching during
eviction and hence achieved our fourth goal.
8.2.4 Different Traces
We measure the waiting time of high priority jobs running in three different traces. We
tune the ratio of research (low priority) to production (high priority) jobs and see the effect
of our scheduling policies on the waiting time by looking at the wait time CDF for production
31
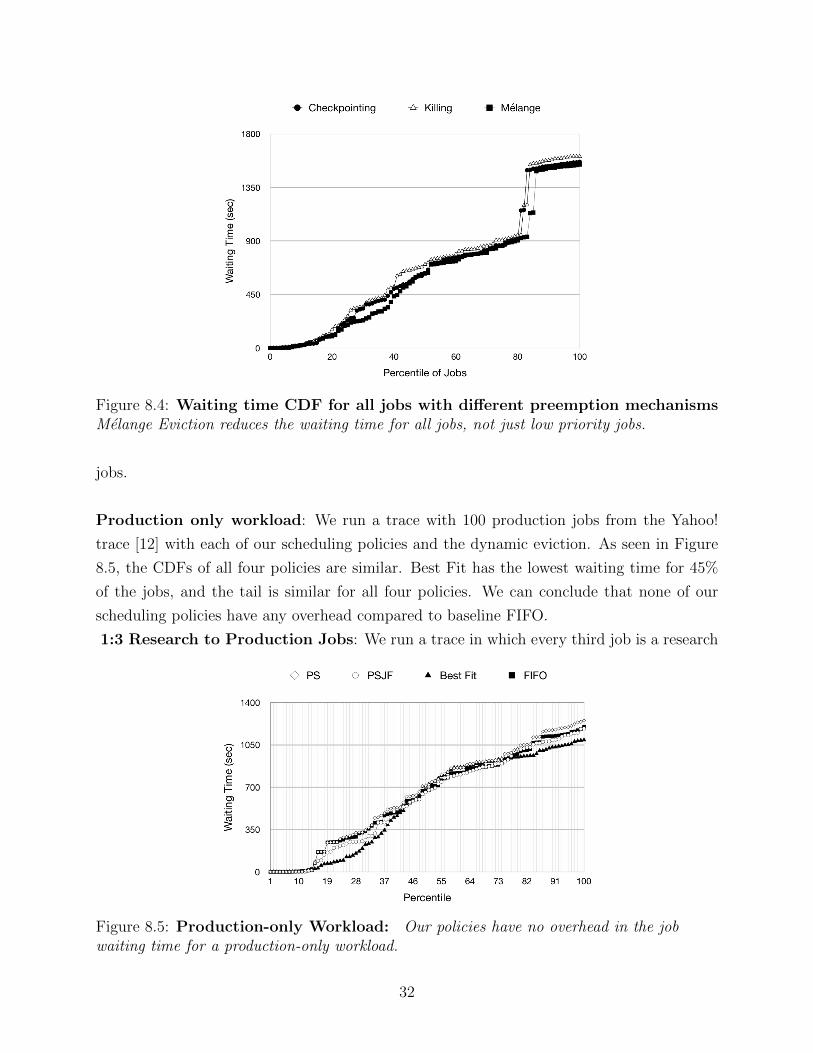
Figure 8.4: Waiting time CDF for all jobs with different preemption mechanismsMelange Eviction reduces the waiting time for all jobs, not just low priority jobs.
jobs.
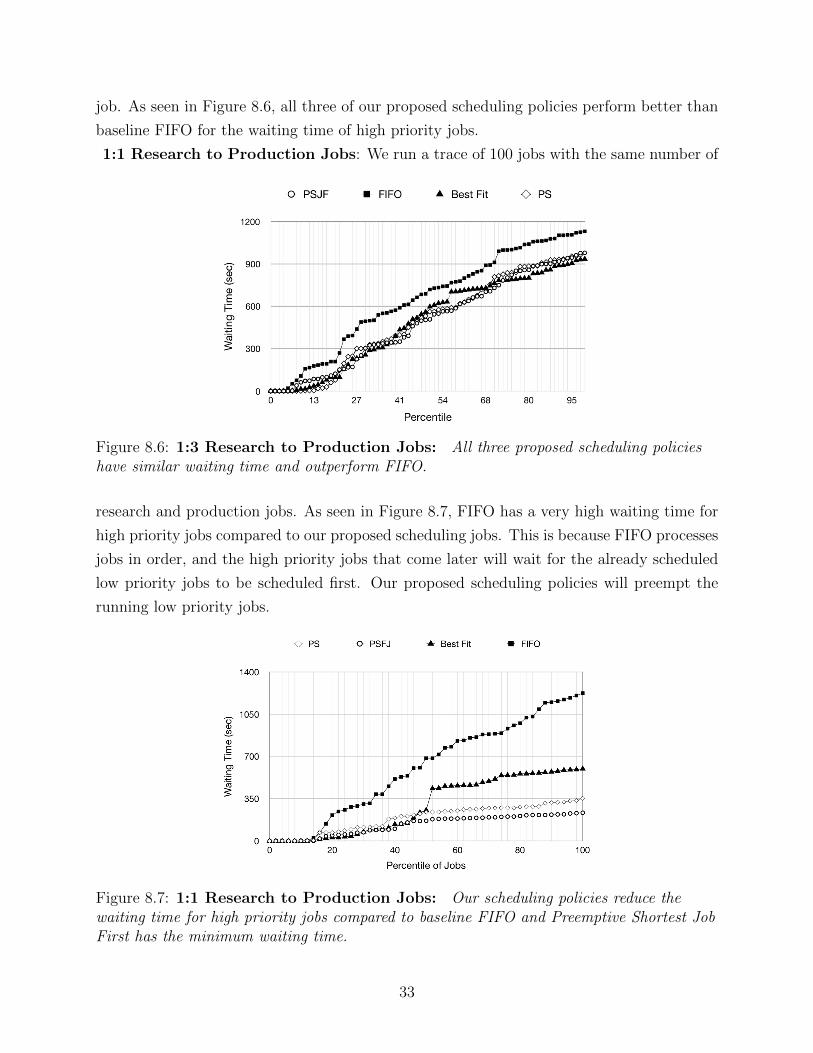
Production only workload: We run a trace with 100 production jobs from the Yahoo!
trace [12] with each of our scheduling policies and the dynamic eviction. As seen in Figure
8.5, the CDFs of all four policies are similar. Best Fit has the lowest waiting time for 45%
of the jobs, and the tail is similar for all four policies. We can conclude that none of our
scheduling policies have any overhead compared to baseline FIFO.
1:3 Research to Production Jobs: We run a trace in which every third job is a research
Figure 8.5: Production-only Workload: Our policies have no overhead in the jobwaiting time for a production-only workload.
32
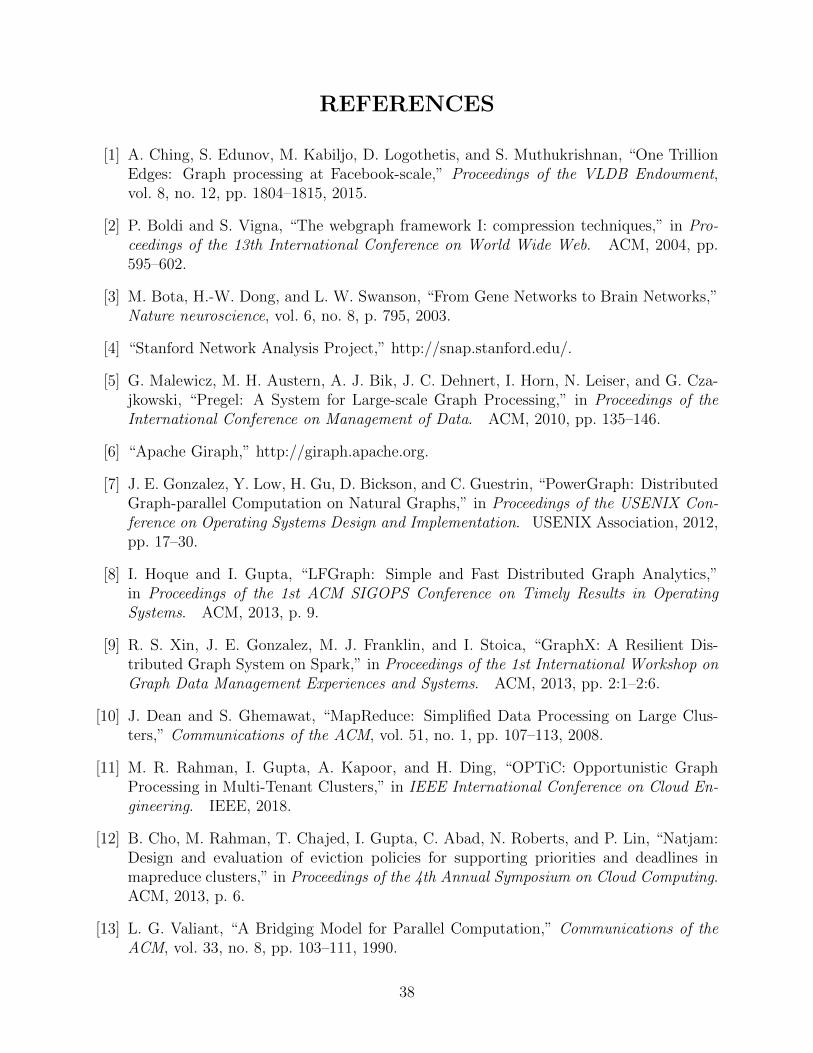
job. As seen in Figure 8.6, all three of our proposed scheduling policies perform better than
baseline FIFO for the waiting time of high priority jobs.
1:1 Research to Production Jobs: We run a trace of 100 jobs with the same number of
Figure 8.6: 1:3 Research to Production Jobs: All three proposed scheduling policieshave similar waiting time and outperform FIFO.
research and production jobs. As seen in Figure 8.7, FIFO has a very high waiting time for
high priority jobs compared to our proposed scheduling jobs. This is because FIFO processes
jobs in order, and the high priority jobs that come later will wait for the already scheduled
low priority jobs to be scheduled first. Our proposed scheduling policies will preempt the
running low priority jobs.
Figure 8.7: 1:1 Research to Production Jobs: Our scheduling policies reduce thewaiting time for high priority jobs compared to baseline FIFO and Preemptive Shortest JobFirst has the minimum waiting time.
33

From these experiments we can conclude that the improvements from the scheduling poli-
cies implemented in Melange increase as there are more research jobs in the workload. The
least improvements observed are in a production-only workload and the maximum improve-
ments are in a 1:1 production-research ratio. From these observations we are able to conclude
that our scheduling policies perform better or same compared to baseline FIFO.
8.3 CLUSTER UTILIZATION
Multi-tenancy has various benefits, including better resource utilization. To measure the
cluster utilization, we measure Underutilized Containers in Melange. We define this
metric as average percentage of containers that are not in use whenever there is at least one
job in the waiting queue. Containers can be unused in the following scenario:
1. There are no jobs to schedule.
2. The scheduler is slow in making the scheduling decision.
3. The scheduling policy is inefficient with it’s selection of jobs.
Since we want to measure the effectiveness of our scheduling policy, we only want to look
at free containers when there is job available in the waiting queue. Melange executes the
scheduling policies at the same speed, hence our defined metric of Underutilized Containers
would only capture the efficiency of our scheduling policy on resource utilization.
Table 8.2 shows the Underutilized Containers for our scheduling policies. We can see
that Best Fit gives us the best cluster utilization with Underutilized Containers at 9.6%,
compared to FIFO which has 14.3% Underutilized Containers. From this, we can conclude
that we have achieved our fifth goal i.e., to achieve high cluster utilization.
FIFO Best FitPriority
Scheduling
PreemptiveShortest Job
First
UnderutilizedContainers
14.3% 9.6% 12% 14.24%
Table 8.2: Cluster Utilization: Average percentage of free containers when there is atleast one job waiting.
34

CHAPTER 9: CONCLUSION
In this thesis, we discussed the design and evaluation of Melange, a cross-layer preempted
scheduler for graph processing jobs. By making a modular scheduler, we allow developers
to plug in their custom policies for scheduling and eviction. We also present techniques
for measuring the progress of a job using ”active vertices” and superstep percentage. We
find that using domain-specific knowledge can give insights that can be used for making
better scheduling and eviction decisions. We design an Eviction Engine that can switch
between eviction mechanisms at run time by using this domain-specific knowledge about the
running jobs. Our evaluation shows that our policies are able to perform better than vanilla
non-preemptive policies and that out adaptive eviction engine performs better than static
preemption mechanisms.
35

CHAPTER 10: FUTURE WORK
We devise Melange, a multi-tenant, preemptive scheduler for graph processing jobs in this
thesis. We talk about adaptive eviction, where our Eviction Engine is able to pick the best
eviction policy for the specific job to evict. In this chapter we talk about the various avenues
to extend this work.
10.1 ADAPTIVE SCHEDULING ENGINE
In a multi-tenant cluster, the workload can change over a period of time. Based on the
time of the day, a cluster can receive more production or research jobs. We want to explore
characterizing the current workload based on parameters like waiting queue size, inter-arrival
time of jobs, the ratio of production to research jobs and the size of the waiting jobs. This
workload can change over a period of time, and a static scheduling policy might not be the
best choice for such a workload that continues to change. We want to explore making our
Scheduling Engine adaptive like our Eviction Engine. Based on the current workload, the
Scheduling Engine can learn which scheduling policy to run.
10.2 EDGE MIGRATION
Killing jobs requires restarting the everything from scratch, while checkpointing may con-
serve job progress, it takes time to save the state of the job to the DFS, continuing to utilize
cluster resources for a period of time after being preempted.
An alternative method we could explore would involve migrating edges or vertices between
workers at runtime. This would enable elasticically scaling up or down the job’s container
allocation during job execution, allowing it to continue executing while enabling other jobs to
make progress. However, this approach would also require halting the job momentarily while
the workers migrate data among themselves. We consider exploring the potential tradeoff of
this approach as future work in multi-tenant graph processing schedulers.
10.3 LIGHTWEIGHT CHECKPOINTING
If a job is checkpointed multiple times, it currently repeatedly stores the entire state of
the graph algorithm, which may prove expensive in terms of storage and compute resources.
36

An alternative would be to use delta-based checkpointing, where additional checkpoints only
track the changes in values between successive checkpoints. This may increase the time taken
to restore a graph from checkpoints, but would reduce the time spent checkpointing and the
state to be stored in the DFS. Integrating such lightweight approaches to checkpointing to
our work may enhance the benefits of our preemptive scheduling algorithms.
10.4 PRESCHEDULING
Since the ingress cost includes the cost of loading graph data from the DFS, another
optimization would be to ‘preschedule’ the next job on machines that are running jobs near
completion. This would ensure data locality when the next set of workers are scheduled on
those nodes. This approach has been shown to have benefits in [11]. It might be worth
expanding the prescheduling feature by doing some initial partitioning before the workers
have started.
37
REFERENCES
[1] A. Ching, S. Edunov, M. Kabiljo, D. Logothetis, and S. Muthukrishnan, “One TrillionEdges: Graph processing at Facebook-scale,” Proceedings of the VLDB Endowment,vol. 8, no. 12, pp. 1804–1815, 2015.
[2] P. Boldi and S. Vigna, “The webgraph framework I: compression techniques,” in Pro-ceedings of the 13th International Conference on World Wide Web. ACM, 2004, pp.595–602.
[3] M. Bota, H.-W. Dong, and L. W. Swanson, “From Gene Networks to Brain Networks,”Nature neuroscience, vol. 6, no. 8, p. 795, 2003.
[4] “Stanford Network Analysis Project,” http://snap.stanford.edu/.
[5] G. Malewicz, M. H. Austern, A. J. Bik, J. C. Dehnert, I. Horn, N. Leiser, and G. Cza-jkowski, “Pregel: A System for Large-scale Graph Processing,” in Proceedings of theInternational Conference on Management of Data. ACM, 2010, pp. 135–146.
[6] “Apache Giraph,” http://giraph.apache.org.
[7] J. E. Gonzalez, Y. Low, H. Gu, D. Bickson, and C. Guestrin, “PowerGraph: DistributedGraph-parallel Computation on Natural Graphs,” in Proceedings of the USENIX Con-ference on Operating Systems Design and Implementation. USENIX Association, 2012,pp. 17–30.
[8] I. Hoque and I. Gupta, “LFGraph: Simple and Fast Distributed Graph Analytics,”in Proceedings of the 1st ACM SIGOPS Conference on Timely Results in OperatingSystems. ACM, 2013, p. 9.
[9] R. S. Xin, J. E. Gonzalez, M. J. Franklin, and I. Stoica, “GraphX: A Resilient Dis-tributed Graph System on Spark,” in Proceedings of the 1st International Workshop onGraph Data Management Experiences and Systems. ACM, 2013, pp. 2:1–2:6.
[10] J. Dean and S. Ghemawat, “MapReduce: Simplified Data Processing on Large Clus-ters,” Communications of the ACM, vol. 51, no. 1, pp. 107–113, 2008.
[11] M. R. Rahman, I. Gupta, A. Kapoor, and H. Ding, “OPTiC: Opportunistic GraphProcessing in Multi-Tenant Clusters,” in IEEE International Conference on Cloud En-gineering. IEEE, 2018.
[12] B. Cho, M. Rahman, T. Chajed, I. Gupta, C. Abad, N. Roberts, and P. Lin, “Natjam:Design and evaluation of eviction policies for supporting priorities and deadlines inmapreduce clusters,” in Proceedings of the 4th Annual Symposium on Cloud Computing.ACM, 2013, p. 6.
[13] L. G. Valiant, “A Bridging Model for Parallel Computation,” Communications of theACM, vol. 33, no. 8, pp. 103–111, 1990.
38

[14] L. Page, S. Brin, R. Motwani, and T. Winograd, “The PageRank Citation Ranking:Bringing Order to the Web,” Stanford InfoLab, Tech. Rep., 1999.
[15] V. Batagelj and M. Zaversnik, “An O(m) Algorithm for Cores Decomposition of Net-works,” eprint arXiv:cs/0310049, Oct. 2003.
[16] D. M. Blei, A. Y. Ng, and M. I. Jordan, “Latent Dirichlet Allocation,” Journal ofMachine Learning Research, vol. 3, no. Jan, pp. 993–1022, 2003.
[17] Y. Zhou, D. Wilkinson, R. Schreiber, and R. Pan, “Large-Scale Parallel CollaborativeFiltering for the Netflix Prize,” in Proceedings of the 4th International Conference onAlgorithmic Aspects in Information and Management. Springer-Verlag, 2008, pp. 337–348.
[18] H.-F. Yu, C.-J. Hsieh, S. Si, and I. Dhillon, “Scalable Coordinate Descent Approachesto Parallel Matrix Factorization for Recommender Systems,” in Proceedings of the 2012IEEE 12th International Conference on Data Mining. IEEE Computer Society, 2012,pp. 765–774.
[19] T. Graepel, J. Q. Candela, T. Borchert, and R. Herbrich, “Web-scale Bayesian Click-through Rate Prediction for Sponsored Search Advertising in Microsoft’s Bing SearchEngine,” in Proceedings of the 27th International Conference on International Confer-ence on Machine Learning. Omnipress, 2010, pp. 13–20.
[20] T. L. Griffiths and M. Steyvers, “Finding Scientific Topics,” Proceedings of the NationalAcademy of Sciences, vol. 101, no. suppl 1, pp. 5228–5235, 2004.
[21] “Fair Scheduler,” https://hadoop.apache.org/docs/r1.2.1/fair scheduler.html, accessed:2018-03-28.
[22] “Better SLAs via Resource Preemption in YARN’s Capacity Scheduler,”https://hortonworks.com/blog/better-slas-via-resource-preemption-in-yarns-capacityscheduler/, accessed: 2018-03-28.
[23] “Apache Hadoop YARN,” https://goo.gl/2gHfmQ/.
[24] M. Isard, V. Prabhakaran, J. Currey, U. Wieder, K. Talwar, and A. Goldberg, “Quincy:Fair Scheduling for Distributed Computing Clusters,” in Proceedings of the ACMSIGOPS 22nd Symposium on Operating Systems Principles. ACM, 2009, pp. 261–276.
[25] I. Gog, M. Schwarzkopf, A. Gleave, R. N. M. Watson, and S. Hand, “Firmament:Fast, Centralized Cluster Scheduling at Scale,” in Proceedings of the 12th USENIXConference on Operating Systems Design and Implementation. USENIX Association,2016, pp. 99–115.
[26] B. Hindman, A. Konwinski, M. Zaharia, A. Ghodsi, A. D. Joseph, R. Katz, S. Shenker,and I. Stoica, “Mesos: A Platform for Fine-grained Resource Sharing in the Data Cen-ter,” in Proceedings of the 8th USENIX Conference on Networked Systems Design andImplementation. USENIX Association, 2011, pp. 295–308.
39

[27] K. Ousterhout, P. Wendell, M. Zaharia, and I. Stoica, “Sparrow: Distributed, LowLatency Scheduling,” in Proceedings of the 24th ACM Symposium on Operating SystemsPrinciples. ACM, 2013, pp. 69–84.
[28] P. Delgado, D. Didona, F. Dinu, and W. Zwaenepoel, “Job-aware Scheduling in Eagle:Divide and Stick to Your Probes,” in Proceedings of the 7th ACM Symposium on CloudComputing. ACM, 2016, pp. 497–509.
[29] P. Delgado, F. Dinu, A.-M. Kermarrec, and W. Zwaenepoel, “Hawk: Hybrid Data-center Scheduling,” in Proceedings of the 2015 USENIX Conference on Usenix AnnualTechnical Conference. USENIX Association, 2015, pp. 499–510.
[30] R. Liu, A. Aboulnaga, and K. Salem, “DAX: a widely distributed multitenant storageservice for DBMS hosting,” in Proceedings of the 39th International Conference on VeryLarge Data Bases. VLDB Endowment, 2013, pp. 253–264.
[31] S. Das, D. Agrawal, and A. El Abbadi, “ElasTraS: An Elastic, Scalable, and Self-managing Transactional Database for the Cloud,” ACM Transactions on Database Sys-tems, vol. 38, no. 1, pp. 5:1–5:45, Apr. 2013.
[32] A. J. Elmore, S. Das, D. Agrawal, and A. El Abbadi, “Zephyr: Live Migration inShared Nothing Databases for Elastic Cloud Platforms,” in Proceedings of the 2011ACM International Conference on Management of Data. ACM, 2011, pp. 301–312.
[33] S. Das, S. Nishimura, D. Agrawal, and A. El Abbadi, “Albatross: Lightweight Elasticityin Shared Storage Databases for the Cloud Using Live Data Migration,” Proceedings ofthe VLDB Endowment, vol. 4, no. 8, pp. 494–505, May 2011.
[34] H. J. Moon, H. Hac, Y. Chi, and W.-P. Hsiung, “SWAT: A Lightweight Load BalancingMethod for Multitenant Databases,” in Proceedings of the 16th International Conferenceon Extending Database Technology. ACM, 2013, pp. 65–76.
[35] C. Curino, E. Jones, Y. Zhang, and S. Madden, “Schism: A Workload-driven Approachto Database Replication and Partitioning,” Proceedings of the VLDB Endowment, vol. 3,no. 1-2, pp. 48–57, Sep. 2010.
[36] R. Taft, W. Lang, J. Duggan, A. J. Elmore, M. Stonebraker, and D. DeWitt, “STeP:Scalable Tenant Placement for Managing Database-as-a-Service Deployments,” in Pro-ceedings of the 7th ACM Symposium on Cloud Computing. ACM, 2016, pp. 388–400.
[37] G. Ananthanarayanan, C. Douglas, R. Ramakrishnan, S. Rao, and I. Stoica, “TrueElasticity in Multi-tenant Data-intensive Compute Clusters,” in Proceedings of the 3rdACM Symposium on Cloud Computing. ACM, 2012, pp. 24:1–24:7.
[38] F. Kalim, L. Xu, S. Bathey, R. Meherwal, and I. Gupta, “Henge: Intent-driven Multi-Tenant Stream Processing,” ArXiv e-prints, Jan. 2018.
40

[39] M. Schwarzkopf, A. Konwinski, M. Abd-El-Malek, and J. Wilkes, “Omega: Flexible,Scalable Schedulers for Large Compute Clusters,” in Proceedings of the 8th ACM Eu-ropean Conference on Computer Systems. ACM, 2013, pp. 351–364.
[40] A. Wang, S. Venkataraman, S. Alspaugh, R. Katz, and I. Stoica, “Cake: Enabling High-level SLOs on Shared Storage Systems,” in Proceedings of the 3rd ACM Symposium onCloud Computing. ACM, 2012, pp. 14:1–14:14.
[41] A. Adya, J. Dunagan, and A. Wolman, “Centrifuge: Integrated Lease Managementand Partitioning for Cloud Services,” in Proceedings of the 7th USENIX Conference onNetworked Systems Design and Implementation. USENIX Association, 2010, pp. 1–1.
[42] B. Calder, J. Wang, A. Ogus, N. Nilakantan, A. Skjolsvold, S. McKelvie, Y. Xu, S. Sri-vastav, J. Wu, H. Simitci, J. Haridas, C. Uddaraju, H. Khatri, A. Edwards, V. Be-dekar, S. Mainali, R. Abbasi, A. Agarwal, M. F. u. Haq, M. I. u. Haq, D. Bhardwaj,S. Dayanand, A. Adusumilli, M. McNett, S. Sankaran, K. Manivannan, and L. Rigas,“Windows Azure Storage: A Highly Available Cloud Storage Service with Strong Con-sistency,” in Proceedings of the 23rd ACM Symposium on Operating Systems Principles.ACM, 2011, pp. 143–157.
[43] A. D. Ferguson, P. Bodik, S. Kandula, E. Boutin, and R. Fonseca, “Jockey: Guaran-teed Job Latency in Data Parallel Clusters,” in Proceedings of the 7th ACM EuropeanConference on Computer Systems. ACM, 2012, pp. 99–112.
[44] “Apache ZooKeeper,” https://zookeeper.apache.org/.
[45] K. Shvachko, H. Kuang, S. Radia, and R. Chansler, “The Hadoop Distributed FileSystem,” in Proceedings of the 2010 IEEE 26th Symposium on Mass Storage Systemsand Technologies. IEEE Computer Society, 2010, pp. 1–10.
[46] R. L. Henderson, “Job Scheduling Under the Portable Batch System,” in Workshop onJob Scheduling Strategies for Parallel Processing. Springer, 1995, pp. 279–294.
[47] A. Roy, L. Bindschaedler, J. Malicevic, and W. Zwaenepoel, “Chaos: Scale-out GraphProcessing from Secondary Storage,” in Proceedings of the 25th Symposium on OperatingSystems Principles. ACM, 2015, pp. 410–424.
[48] W. Chen, J. Rao, and X. Zhou, “Preemptive, Low Latency Datacenter Scheduling viaLightweight Virtualization,” in Proceedings of the 2017 USENIX Conference on UsenixAnnual Technical Conference. USENIX Association, 2017, pp. 251–263.
[49] M. Pundir, M. Kumar, L. M. Leslie, I. Gupta, and R. H. Campbell, “Supporting on-demand Elasticity in Distributed Graph Processing,” in IEEE International Conferenceon Cloud Engineering. IEEE, 2016, pp. 12–21.
[50] S. Edunov, D. Logothetis, C. Wang, A. Ching, and M. Kabiljo, “Darwini: Generatingrealistic large-scale social graphs,” CoRR, vol. abs/1610.00664, 2016. [Online].Available: http://arxiv.org/abs/1610.00664
41

[51] B. White, J. Lepreau, L. Stoller, R. Ricci, S. Guruprasad, M. Newbold, M. Hibler,C. Barb, and A. Joglekar, “An Integrated Experimental Environment for DistributedSystems and Networks,” in Proceedings of the 5th Symposium on Operating SystemsDesign and Implementation. USENIX Association, Dec. 2002, pp. 255–270.
42


![Giraph Unchained: Barrierless Asynchronous Parallel Execution in … · tems such as Apache Giraph [1] and GraphLab [24]. For graph processing systems, one key systems-level per-formance](https://static.documents.pub/doc/80x56/5fbe93d1eebf215bd4273834/giraph-unchained-barrierless-asynchronous-parallel-execution-in-tems-such-as-apache.jpg)


