216
7601 c U-005-307.1 I NATIONAL FUNCTIONAL GUIDELINES FOR CHEMICAL DATA REVIEW - (USED AS A REFERENCE IN OU3 RI/FS/PP) 07/01 /88 USEPA 400 GUl DELlNES
| Date post: | 15-May-2018 |
| Category: |
Documents |
| Upload: | truongngoc |
| View: | 214 times |
| Download: | 1 times |

7 6 0 1
c
U-005-307.1 I
NATIONAL FUNCTIONAL GUIDELINES FOR CHEMICAL DATA REVIEW - (USED AS A REFERENCE IN OU3 RI/FS/PP)
07/01 /88
USEPA 400 GUl DELlN ES

NATIONAL FUSCTIONAL GUIDELINES FOR CHEbIICAL DATA REVIEW
Prepared for the
HAZARDOUS SITE EVALUATION DIVISION U.S. ENVIRONMENTAL PROTECTION AGENCY
Compiled by
Ruth Bleyler Sample Management Oflie
Viar and Company
Prepared by
The USEPA Data Review Work Group Jeanne Haskins - EPA Region III - Chairperson Frank Messina, Laura Scalise - EPA Region I1
Gary Bennett - EPA Region IV Ida Levin - EPA Region V
Mahmoud El-Feky - EPA Region VI Larry Marchin - EPA Region VII
July 1, 1988

I ' .
TABLEOFCON TENTS Pane
INTRODUCTION .......................................................................................................................... 1
PRELIMINARY REVIEW ............................................................................................................ 2
INORGANICS PROCEDURE ....................................................................................................... 2
I .
I1 .
III .
IV .
v .
VI .
VI1 . Vm .
Ix . X .
XI .
XII .
Holding Times .................................................................................................................... 3
Calibration ...................................................................................... .. .................................. 4
Blanks ............................. : ................................................................................................... 6
ICP Interference Check Sample (ICs) .............................................................................. 7
Laboratory Control Sample (LCS) ..................................................................................... Duplicate Sample Analysis .............................................................................................. 10
Matrix Spike Sample Analysis ........................................ .............................................
Furnace Atomic Absorption qC ..................................................................................... 12
11
ICP Serial Dilution ......................................................................................................... 13
Sample Result Verification ............................................................................................. 14
Field Duplicates ............................................................................................................... 14
Overall Assessment of Data for a Case ............ ............................................................. 15 -
GLOSSARY A: Data Qualifier Definitions .............................................................................. 16
GLOSSARY B: Additional Terms ...................................................... ... ................. c .................. 17
7/88
1 ' .
INTRODUCTION
This document is designed to offer guidance in laboratory data evaluation and validation. In some aspects, it is equivalent to a Standard Operating Procedure (SOP). In other. more subjective areas, only general guidance is offered due to the complexities and uniqueness of data relative to specific samples. These Guidelines have been updated to include all requirements in the 7/87 Statement of Work (SOW) for Inorganics, Amendment I and December 1987 Revisions.
Those areas where specific SOPS are possible are primarily areas in which definitive performance requirements are established. These requirements are concerned with specifications that are not sample dependenq they specify performance requirements on matters that should be fully under a laboratory's control. These specific areas include blanks, calibration standards, calibration verification standards, laboratory control standards, and interference check standards. In particular, mistakes such as calculation and transcription errors must be rectified by resubmission of corrected data sheets.
This document is intended for technical review. Some areas of overlap between technical review and Contract Compliance Screening (CCS) exist however, determining contract compliance is not intended to be a goal of these guidelines. It is assumed that t ke CCS is available and can be utilized to assist in the data review procedure.
At times, there may be an urgent need to use data which do not meet all contract requirements and technical criteria. constitute either a new requirement standard or full acceptance of the data. Any decision to utilize data for which performance criteria have not been met is strictly to facilitzte *c p m g m of projects requiring the availability of the data. A contract laboratory submitting data which are out of specification may be required to rerun or resubmit data even if the previously submitted data have been utilized due to urgent program needs; data which do not meet specified requirements are never fully acceptable. The only exception to this requirement is in the area of requirements for individual sample analysis; if the nature of the sample itself limits the attainment of specifications, appropriate allowances must be made. The overriding concern of the Agency is to obtain data .which are technically valid and legally defensible.
Use of these data does
All data reviews must have, as a cover sheet, the Inorganic Regional Data Assessment (IRDA) form. (A copy is attached at the end of this document) If mandatory actions are required, they should be specifidly noted on this form. In addition, this form is to be used to summarize overall deficiencies requiring attention, as well as general laboratory performance and any discernible trends in the quality of the data. (This form is not a replacement for the data review.) Sufficient supplementary documentation must accompany the form to clearly identify the problems associated with a Case. The form and any attachments must be submitted to the Contract Laboratory Program Quality Assurance Coordinator (CLP QAC), the Regional Deputy Project Officer (DPO), and the Environmental Monitoring Systems Laboatory in Las Vegas (EMSL/LV).
-
- It is the responsibility of the data reviewer to notify the Regional DPO concerning problems and shortcomings with regard to laboratory data. If there is an urgent requirement, the DPO-may be contacted by telephone to expedite corrective action. It is recommended that all items for DPO action be presented at one time. In any case, the Inorganic Regional Data Assessment form must be completed and submitted.
000003
1 7/88

, ' .
7601' PRELIMINARY REVIEW
In order to use this document effectively, the reviewer should have a general overview of the Case at hand. The exact number of samples, their assigned numbers, their matrix, and the number of laboratories involved in their analysis are essential information. Background information on the site is helpful but often this information is very difficult to locate. The site project officer is the best source for answers or further direction.
CCS is a source of a large quantity of summarized information. 'It can be used to alert the reviewer of problems in the Case or what may be sample-specific problems. This information may be utilized in data validation. If CCS is unavailable, those criteria affecting data vaiidity must be addressed by the data reviewer.
Cases routinely have unique samples which require special attention by the reviewer. The Field blanks, field duplicates, and performance audit sampies need to be identified.
sampling records should provide:
1. Project Officer for site
2. Complete list of samples with notations on
a) sample matrix
b) blanks*
c) field duplicates*
d) field spikes*
e) QC audit sample*
f) shipping dates
g) labs involved
- * If applicable
The chain-of-custody record includes sample descriptions and date of sampling. Although sampling date is not addressed by contract requirements, the reviewer must take into account lag time between sampling and shipping while assessing sample holding times.
INORCANICS PROCEDURE
The requirements to be checked in validation are listed below. ("CCS" indicates that the contractual requirements for these items will also be checked by CCS; CCS requirements are not always the same as the data review criteria.)
1. Holding Times (CCS - Lab holding times only)
2 7/88

11.
111.
IV.
V.
VI.
VU.
Calibration
o Initial (CCS)
o
Blanks (CCS)
ICP Interference Check Sample (CCS)
Laboratory Control Sample (CCS)
Duplicate Sample (CCS)
Matrix Spike Sample (CCS)
Initial and Continuing Calibration Verification (CCS)
Vm. Furnace Atomic Absorption QC (CCS)
IX. ICP Serial Dilution (CCS)
X
XI. Field Duplicates
XII. Overall Assessment of Data for a Case
Sample Result Verification (CCS - 10%)
1. HOLDING TIM ES
A. Objective
The objective is to ascertain the validity of results based on the holding time of the sample from t-u 1 to time of analysis.
p&& The holding time is based on the date of collection, rather than verified time of sample receipt, and date of digestion/distilhtion. It is a technical evaluation rather than a contracrud requirement.
B. Criteria
Technical requirements for sample holding times have only been established for water matrices. The following holding time and preservation requirements were established under 40 CFR 136 (Clean Water Act) and are found in Volume 49, Number 209 of the Federal Register, page 43260, issued on October 26, 1984.
METALS 6 months, preserved to pH < 2 .. I'dERCURY 28 days; preserved to pH < 2
CYANIDE 14 days; preserved to pH > I2
3

C. Evaluation Procedure
Actual holding times are established by comparing the sampling date on the EPA Sample Traffic Report with the dates of analysis found in the laboratory raw data (digestion logs and instrument run logs). Examine the digestion and/or distillation logs to determine if samples were preserved at the proper pH.
Analyte Holding Time (Days) = Analysis Date - Sampling Date
D. Action
1. If 40 CFR 136 criteria for holding times and preservation are not met, qualify ail results > Instrument Detection Limit (IDL) as estimated (J) and results < IDL as estimated (UJ).
2. If holding t imb are exceeded, the reviewer must use professional judgment to determine the reliability of the data and the effects of additional storage on the sample results. The expected bias wouid be low and the reviewer may determine that results < IDL are unusable (R).
Due to limited information concerning holding times for soil samples, it is left to the discretion of the data reviewer whether to apply water holding time criteria to soil samples. If the data are qualified when water holding time criteria are applied to soil samples, it must be clearly documented in the review.
- 3.
11. CALIBRATION
A. Objective
Compliance requirements for satisfactory instrument calibration are established to ensure that the instrument is capable of producing acceptable quantitative data. Initial calibration demonstrates that the instrument is capable of acceptable performance at the beginning of the analysis run, and continuing calibration verification documents that the initial calibration is still valid.
B. Criteria
1. Initial Calibration
Instruments must be calibrated daily and each time the instrument is set up.
a. ICP Analysis
A blank and at least one standard must be used in establishing the analytical curve.
b. Atomic Absorption Analysis (AA)
1) A blank and at least three standards, one of which must be at the Contract Required Detection Limit (CRDL), must be used in establishing the analytical curve.
OQOQ86 4 7/88

2) The correlation coefficient must be ~ 0 . 9 9 5 .
and not contractual. The correlation coefficient of 0.995 is a technical criterion
C. Mercury Analysis
1)
2)
A blank and at least four standards must be used in establishing the analytical curve. The correlation coefficient must be ~ 0 . 9 9 5 .
d. Cyanide Analysis
I)
2) 3) A correlation coefficient 20.995 is required for photometric
A blank and at least three standards must be used in establishing the analytical curve. A midrange standard must be distilled.
determination.
2. Initial and Continuing Calibration Verification (ICV and CCV) - a. Analysis results must fall within the control limits of 90 - 1 1 0 percent
Recovery (%R) of the true value for all analytes except mercury and cyanide.
b. Analysis results for mercury must fall within the control limits of 80- 12096R.
C. Analysis results for cyanide must fall within the control limits of 85- 1 15%R.
C. Evaluation Procedure
1. Verify that the instrument was calibrated daily and each time the instrument was set up using the correct number of standards and blank.
2. Verify that the correlation coefficient is 10.995
3. Check the distillation log and verify that the midrange CN standard was distilled.
4. Recalculate one or more of the ICV and CCV %R per type of analysis (ICP, GFAA, etc.) using the following equation and verify that the recalculated value agrees with the laboratory reported values on Form IIA. Due to possible rounding discrepancies, allow results to fall within 1% of the contract windows (e& 89- 1 1 1%).
Found x 100 True
.. %R =
Where,
Found = concentntion (in ug/L) of each analyte mensured in the analysis of the ICV or CCV solution
5

D.
A.
B.
7 6 0 1
True = concentration (in ug/L) of each analyte in the ICV or CCV source
Action
1.
2.
- Vote:
If the minimum number of standards as defined in section B.were not used for initial calibration, or if the instrument was not calibrated daily and each time the instrument was set up, qualify the data as unusable (R).
If the correlation coefficient is <0.995, qualify results > IDL as estimated (J), and results < IDL as estimated (UJ).
For critical samples, further evaluation of the calibration curve may be warranted to determine if qualification is necessary.
3. If the midrange CN standard was not distilled, qualify all associated results as estimated (J).
4. If the ICV or CCV %R fails outside the acceptance windows, use professicmi judgment to qualify all associated data. If possible, indicate the bias in the review. The following guidelines are recommended:
a. If the ICV or CCV %R falls outside the acceptance windows but within the ranges of 7549% or 111-125% (CN, 7044% or 116-13096; Hg, 65- 79% or 121-135%). qualify results > IDL as estimated (J). If the ICV or CCV %R is within the range of 111-125% (CN, 116-130%; Hg, 121-135%), results
b. IDL are acceptable.
c.
d.
If the ICV or CCV %R is 75-89’46 (CN, 70434%; Hg, 65-79%), qualify results < IDL as estimated (UJ). If the ICV or CCV %R is <75%, (CN, <70% Hg, <65%), qualify all positive results as unusable (R).
e. If the ICV or CCV %R is ~12596, (CN >130% Hg >135%), qualify results > IDL as unusable (R); results < IDL are acceptable.
Objective
The assessment of blank analysis results is to determine the existence and magnitude of contamination problems. The criteria for evaluation of blanks applies to any blank associated with the samples. If problems with am blank exist, all data associated with the Case must be carefully evaluated to determine whether or not there is an inherent variability in the data for the Case, or if the problem is an isolated occurrence not affecting other data.
Criteria
$0 contaminants should be in the blank(s).
6 ’ 7/88

C.
D.
A.
B.
C.
Evaluation Procedures
Review the results reported on the Blank Summary (Form 111) as well as the raw data . (ICP printouts, strip charts, printer tapes, bench sheets, etc.) for all blanks and veriiy that the results were accurately reported.
Action
Action in the case of unsuitable blank results depends on the circumstances and origin of the blank. Sample results > IDL but 4 times the amount in any blank should be qualified as (U).
Any blank with a negative result whose absolute value is > IDL must be carefully evaluated to determine its effect on the sample data.
The blank analyses may not involve the same weights, volumes, or dilution factors as the associated samples. In particular, soil sample results reported on Form I will not be on the same bash (units, dilution) as the calibrat ion blank data reported on Form In. The reviewer may find it easier to work from the raw data when applying 5X criteria to soil sample data/calibration blank data. - In instances where more than one blank is associated with a given sample, q&ication should be based upon a comparison with the associated blank having the highest concentration of a contaminant. The results must be corrected by subtracting any blank value.
IV. ICP INTERFERENCE CHECK SA MPLE (ICs)
Objective
The ICP Interference Check Sample verifies the contract laboratory's interelement and background correction factors. . Criteria
1. An ICs must be run at the beginning and end of each sample analysis run (or a minimum of twice per 8 hour working shift, whichever is more frequent).
2. Results for the ICs solution AB analysis must fall within the control limits of - + 20% of the true value.
Evaluation Procedure
1. Recalculate from the raw data (ICP printout) one or more of the recoveries using the following equation (%R) and verify that the recalculated value a g m with the laboratory reported
ICs %R =
values on Form IV.
Found Solution AB True Solution A B
x 100
7 7/88

7601' Where,
D.
Found Solution AB = concentration (in ug/L) of each analyte measured in the analysis of solution AB
True Solution AB = concentration (in ug/L) of each analyte in solution AB
2. Check ICs raw data for results with an absolute value > IDL for those analytes which are not present in the.ICS solution.
Action
1. For samples with concentrations of AI , Ca, Fe, and Mg which are comparable to or greater than their respective levels in the Interference Check Sample:
a. If the ICs recovery for an element is >120% and the sample results are < IDL, this data is acceptable for use.
b. If the ICs recovery for an element is >I2096 and the sample results are > IDL, qualify the affected data as estimated (J). -
C. If the ICs recovery for an element fails between 50 and 79% and the sample results are > IDL, qualify the affected data as estimated (J).
d. If sample results are IDL, and the ICs recovery for that analyte falls within the range of 50-7996, the possibility of false negatives may exist. Qualify the data for these samples as estimated (UJ).
e. If ICs recovery results for an element fall 40%. qualify the affected data as unusable (R).
If possible, indicate the bias for the estimated results in the review.
2. If results > IDL are observed for elements which are not present in the EPA provided ICs solution, the possibility of false positives exists. An evaluation of the associated sample data for the affected elements should be made. For samples with comparable or higher levels of interferenu and with analyte concentrations that approximate those levels found in 'the ICs (false positives), qualify sample results > IDL as estimated (J).
-
3. If negative results are observed for elements that are not present in the EPA ICs solutions, snd their absolute value is > IDL, the possibility of false negatives in the samples may exist. If the absolute value of'the negative results is > IDL, an evaluation of the associated sample data should be made. For samples with comparable or higher levels of interferents, qualify results for the affected analytes < IDL as estimated (UJ).
4.-. In general, the-sample data can be accepted if the concentrations of AI , Ca. Fe and Mg in the sample are found to be less than or equal to their respective concentrations in the ICs. If these elements are present at concentrations greater than the level in the ICs, or other elements are present in the sample at >IO mg/L. the reviewer should investigate the possibility of other interference effects by using Table 2 given on page D-22 of the 7/87 SOW. These analyte concentration equivalents presented in the Table should be
8

I
considered only as estimated values. since the exact value of any analytical system is instrument specific. Therefore, estimate the concennation produced by an interfering element If the estimate is d X CRDL and alro greater than 10% of the rcwrted concentration of the affecred element, qualify the affected resUlK as estimated (J).
V. LABORATORY CONTRO L SAMPLE ( L a 1
A. Objective
The laboratory control sample s e n a as a monitor of the overall performance of all steps in the analysis, including the sample preparation.
B. Criteria
1. All aqueous LCS results must fall within the control lisnitt of 80-120%R, except Sb and Ag which have no control limits. 1 8 7 / E - ’ a
’
2. All solid LCS results must fall within the control limits established by the EPA. This information is available from EMSLILY. 7 8 3 / e 4 r -
C. Evaluation Procedure
1. Review Form VII and verify that results fall within the control h i t s .
2. Gsck the raw data (rCP. printout, strip charts, beach sheets) to verify the. reported recoveries on Form Vn. Recalculate one or more of the recoveries (%R) using the following equation:
und x 100 LCS Fo LCS True
LCS 96R =
Where,
LCS Found = concentration (in ug/L for aqueous: mg/kg for solid) of each analyte measured in the analysis of LCS solution
LCS True = concentration (in ug/L for aqueous; &/kg for solid) of each analyte in the LCS source
-
D. Action
1. Aqueous LCS
a. IT the LCS recovery for any analyte falls within the range of 50 - 79% or >120%, qualify results > IDL as estimated (a-
b. If results are < IDL and the LCS recovery is greater than 12046, the data are accepmble,
C. If results are < IDL and the LCS recovery falls within the range of 50- 79%. ~ ~ d i f y the data for the affected snalytw as estimated (UJ). .
. . . . . . ..
9

. .
6 If LCS recovery results are 40%- qualify the data for these samples as unusable (R).
-. '? Solid LCS
a. If the solid LCS recovery for any analyte falls outside the EPA control limits, qualify all sample results > IDL as estimated (J).
b. If the LCS results are higher than the control limits and the sample results are < IDL, the data are acceptable.
C. If the LCS results are lower than the control limits, qualify all sample results < IDL as estimated (UJ).
VI. DUPLTCATE S AMPLE ANALYSIS
A. Objective
Duplicate analyses are indicators of laboratory precision based on each sample mat&-
B. Criteria
1. Samples identified as field blanks cannot be used for duplicate sample analysis.
2. A control limit of 2 20% (35% for toil) for the Relative Percent Difference (RPD) shall be used for sample values >SX CRDL.
3. A control limit of kCRDL (k2X CRDL for soil) shall be used for sample values <SX CRDL, including the case when only of the duplicate sample values is <SX CRDL.
C. Evaluation Procedure
1. Review Form VI and verify that results fall within the control limits.
2. Check the raw data and recalculate one or more RPD using the following equation to verify that results have been correctly reported on Form VI.
Where,
S = First Sample Value (original) D =I Second Sample Value (duplicate)
3. .t Verify that the field blank was not used for duplicate analysis.
D. Action
1. If duplicate analysis results for a particular analyte fall outside the appropriate control windows, qualify the results for that analyte in all associated samples of the same matrix as estimated (J).
IO

2. If the field blank was used for duplicate analysis, all other QC data must be carefully checked and professional judgment exercised when evaluating the data.
This information must be included on the IRDA form.
VII. hfATR1X SPIKE SAMPLE ANALYSIS
A. Objective
The matrix spike sample analysis provides information about the effect of each sample matrix on the digestion and measurement methodology.
B. Criteria
1. Samples identified as field blanks cannot be used for spiked sample analysis.
2. Spike recovery (%R) must be within the limits of 75-125%. However, spike recovery limits do not apply when sample concentration exceeds the spike concentration by a factor of 4 or more.
C. Evaluation Procedure
1.
2.
Review Form V and verify that results fall within the specified limits.
Check raw data and recalculate one or more %R using the following equation to verify that results were correctly reported on Form V.
%R = (SSR-SR) x 100 SA
Where,
SSR = Spiked Sample Result SR = Sample Result SA = Spike Added
3. Verify that the field blank was not used for spike analysis.
D. Action
1. If the spike recovery is >125% and the reported sample results dre < IDL, the data is acceptable for use.
2. If the spike recovery is >I=% or <75% and the sample results are > IDL, qualify the data for these samples as estimated (J).
If the spike recovery falls within the range of 30-7496 and the sample results are
..
3. IDL, qualify the data for these samples as estimated (UJ).
4. If spike recovery results fall c30% and the sample results are < IDL. qualify the data for these samples as unusable (R).
000013 1 1 7/88

A.
B.
C.
D.
5. If the field blank was used for matrix spike analysis, all other QC data must be carefully checked and professional judgment exercised when evaluating the da t a
This information must be included on the IRDA form.
- Note: If the matrix spike recovery does not meet criteria (except in Ag), a post digestion spike is required for all methods except furnace, but this data is not used to qualify sample results. However, this information must be included in the IRDA report.
Vm. FURNACE ATOMIC ABSORVTTO N O c
Objective
Duplicate injections and furnace post digestion spikes establish the precision and accuracy of the individual analytical determinations.
- Criteria
1. For sample concentrations > CRDL, duplicate injections must agree within +20% Relative Standard Deviation (RSD), (or Coefficient of Variation (CV)), otherwise the sample must be rerun once (at least two additional injections).
L) -. Spike recovery must be 185% and 51 15%.
3. The Furnace Atomic Absorption Scheme must be followed as described in the 7/87 SOW, p. E-15.
Evaluation Procedure
1. Check raw data to verify that duplicate injections agree within 220% RSD (or CV) for sample concentrations > CRDL.
2. Review Furnace AA raw data to verify that the Furnace Atomic Absorption Scheme has been followed. -
Action
1. If duplicate injections are outside the 220% RSD (or CV) limits and the sample has not been rerun once as required, qualify the data as estimated (J).
If the r e m sample results do not agree within 520% RSD (or CV), qualify the data as estimated (J).
2.
3. If the post digestion spike recovery is <40%, qualify results > IDL as estimated (J).
If the post digestion spike recovery is ?IO%, but <40%, qualify results c IDL as estimated (UJ).
4.
5. If the post digestion spike recovery is <IO%, qualify results < IDL as unusable (R).
I2

A.
B.
c.
6. If sample absorbance is 40% of the post digestion spike absorbance then:
a. If the furnace post digestion spike recovery is not within 85-115%. qualify the sample results > IDL as estimated (J).
b. If the furnace post digestion spike recovery is not within 85-11596, qualify the sample results < IDL as estimated (UJ).
7. If Method of Standard Additions (MSA) is required but has not been done, qualify the data as estimated (J).
8. If any of the samples run by MSA have not been spiked at the appropriate levels, qualify the data as estimated (J).
9. If the MSA correlation coefficient is ~0.995, qualify the data as estimated (J).
IX. ICP SE RIAL DILUTTON
0 b jective
The serial dilution determines whether significant physica. or chemical interferences exist due to sample matrix.
Criteria
If the anaiyte concentrauon is sufficiently high (concentration in the original sample is minimally a factor of 50 above the IDL), an analysis of a 5-fold dilution must agree within 10% Difference (%D) of the original results.
Evaluation Procedures
1. Check the raw data and recalculate the %D using the following equation to verify that the dilution analysis results agree with results reported on Form IX.
%D = x 100 I
Where,
I P I n k Sample Result S 5 Serial Dilution Result (Instrument Reading x 5 )
2. Check the raw data for evidence of negative interference, Le., results of the diluted sample are significantly higher than the original sample.
D. Action
1." When criteria are not met, qualify the associated data as estimated (J).
2. If evidence of negative interference is found, use professional judgment to qualify the data.
13 7/88

... c
X. SAMPLE RESULT VERIFICATION
A. ' Objective
. The objective is to ensure that the reported quantitation results are accurate.
. B. Criteria
Xnalyte quantitation must be calculated according to the appropriate SOW.
C. Evaluation Procedures
The raw data should be examined to verify the correct calculation of sample results reported by the laboratory. Digestion and distillation logs, instrument printouts, strip charts, etc. should be compared to the reported sample results.
1. Examine the raw data for any anomalies (Le., baseline shifts, negative absorbances, omissions, legibility, etc.).
2. Verify that t hen are no transcription or reduction errors (e.g.. d i lu t iom percent solids, sample weights) on one or more samples.
3. Verify that results fall within the linear range of the ICP (Form Xnr) and within the calibrated range for the non-ICP parameten.
4. Verify that sample results are >5X ICP IDL, if ICP analysis results are used for As, TI, Se, or Pb.
&$g When the laboratory provides both ICP and furnace results for an analyte in a sample and the concentration is > ICP IDL, the results can assist in identifying quantitation problems.
D. Action
If there are any discrepancies found, the laboratory may be contacted by the designated representative to obtain additional information that could resolve any differences. If a discrepancy remainn unresolved, the reviewer may determine - qualification of the data is warranted.
XI. FlELD DUPLTCATES
A. Objective
Field duplicate samples may be taken and analyzed as an indication of overall precision. These analyses measure both field and lab precision; therefore, the results may have more variability than lab duplicates which measure only lab performance. It -is also expected that soil duplicate results will have a greater variance than water matrices due to difficulties associated with collecting identical field samples.
8. Criteria
There are no review criteria for field duplicate analyses comparability.

C. Evaluation Procedures
Samples which are field duplicates should be identified using EPA Sample Traffic Reports or sample field sheets. The reviewer should compare the results reported for each sample and calculate the Relative Percent Difference (RPD), if appropriate.
D. Action
Any evaluation of the field duplicates should be provided with the reviewer's comments.
XII. OVERALL ASSESSMENT OF DATA FOR A CASE
It is appropriate for the data reviewer to make professional judgments and express concerns and comments on the validity of the overall data for a Case. Thh is particuiarly appropriate when there are several QC criteria out of specification. The additive nature of QC factors out of specification is difficult to assess in an objective manner, but the reviewer has a responsibility to inform the user concerning data quality and data limitations in order to assist that user in avoiding inappropriate use of the data, while not precluding an@ consideration of the data at all. If qualifien other than those used in thU document are necessary to describe or qualify the data, it is neassary to thoroughly document/explain the additional qualirien used. The data reviewer would be greatly assisted in this endeavor if the data quality objectives were provided. The cover form and supplementary documentation mutt be included with the review.
I5

GLOSSARY A
Data Qualifier Definitions
For the purposes of this document the following code letters and associated definitions are provided.
U
J
R
UJ
- The material was analyzed for, but was not detected above the level of the associated value. The associated value is either the sample quantitation limit or the sample detection limit.
- The associated value is an estimated quantity.
- The data are unusable. (Note: Analyte may or may not be present.)
- The material was analyzed for, but was not detected. The associated value is an estimate and may be inaccurate or imprecise. -
16 7/88

1 6 0 1 . GLOSSARY B
Additlonal Terms
Associated Samples
AA
Calibration Curve
Case
CCB
CCS
CCV
CLP
CRDL
cv DPO
EMSL/LV
Field Blank
Any sample related to a particular QC analysis. For example:
For ICV, all samples run under the same calibration curve.
-
- For duplicate RPD, all SDG samples digested/distilled of the same matrix.
Atomic Absorption
A plot of absorbance versus concentration of standards
A finite, usually predetermined number of s a m p k collected in a given time period for a particular site. A Case consists of one or more Sample Delivery Groups.
Continuing Calibration Blank - a deionized water sample run every ten samples designed to detect any carryover contamination.
Contract Compliance Screening - process in which SMO inspects analytical data for contractual compliance and provides EMSL/LV, laboratories, and the Regions with their findings.
Continuing Calibration Verification - a standard run every ten samples designed to test instrument performance.
Contract Laboratory Program
Contract Required Detedon Limit
Coefficient of Variation
Deputy Project Officer
Environmental Monitoring System Laboratory/ Las Vegas (P.O. Box 15027, Las Vegat, Nevada 89 1 14)
Field blanks are intended to identify contaminants that may have been introduced in the field. Examples are trip blsnks, travel blanks, rinsate blanks, and decontamination blanks.
17 7/88

Field Duplicate
Holding Time
ICB
ICP
I C s
ICV
Initial Calibration
IRDA
LCS
Ms
MsA
Post digestion Spike
QAC
RPD
RSCC
RSD
Serial Dilution
A duplicate sample generated in the field, not in the laboratory.
The time from sample collection to laboratory analysis.
Initial Calibration Blank - first blank standard run to confirm the calibration curve.
Inductively Coupled Plasma
Interference Check Sample
Initial Calibration Verification - first standard run to confirm the calibration curve.
The establishment of a calibration curve with the appropriate number of standards and concentration range. The calibration curve plots absorbance or emission versus concentration uf standards.
Inorganic Regional Data Assessment
Laboratory Control Sample - supplied by EPA
Matrix Spike - introduction of a known concentration of analyte into a sample to provide information about the effect of the sample matrix on the digestion and measurement methodology.
Method of Standard Addition
The addition of a known amount of standard after digestion. (Also identified as analytical spike, or spike, for furnace analyses.)
Quality Assurance Coordinator
Relative Percent Difference
Regional Sample Control Center
Relative Standard Deviation
A sample run at a specific dilution to determine whether any significant chemical or physical interferences exist due to sample matrix effects. (ICP only)
18 7/88

* ' ,
SDG
SMO
SOP
sow
Sample Delivery Group - defined by one of the following, whichever O C C U ~ fint
- case of field samples
- each twenty field samples in a Case
- each 14-day calendar period during which field samples in a Case are received, beginning with receipt of the first sample in the SDG.
19
Sample Management Office
Standard Opeating Procedure
Statement of Work

SDG
SMO
SOP
sow
Sample Delivery Group - defined by one of the following, whichever occurs first
- case of field samples
- each twenty field samples in a Case
- each 14-day calendar period during which field samples in a Case are received, beginning with receipt of the first sample in the SDG.
Sample Management Office
Standard Operating Procedure
Statement of Work
19
800022
7/88

Region INORGANIC REGIONAL DATA ASSESSMENT
CASE NO. SITE LABORATORY NO. OF SAMPLES/
SDG# REVIEWER (IF NOT ESD)
SOW# REVIEWER’S NAME DPO: ACTION m COMPLETION DATE
MATRIX
DATA ASS-ENT SUMMARY
1.
2. - 1.
4.
5.
6.
7.
8.
9.
10.
11.
12.
ICP
HOLDINGTIMES .
CALIBRATIONS
BLANKS
I C s
LCS
DUPLICATE ANALYSIS
MATRIX SPIKE
MSA
SERIAL DILUTION
SAMPLE VERIFICATION
OTHER QC
OVERALL ASSESSMENT
AA CYANIDE
0 = Data had no problems/or qualified due to &or problexu. M = Data qualified due to major problems. 2 = Data unacceptable. X = Problem, but do not affect data.
ACTION ITEMS:
AREAS OF CONCERN:
NOTABLE PERFORMANCE - __ O U U U ~ ~

7 6 0 1
REGION I
LABORATORY DATA VALIDATION
RTNCTIONAL GUIDELINES FOR EVALUATING INORGANICS ANALYSES
Prepared for the
HAZARDOUS SITE EVALUATION DIVISION
U.S. ENVIRONMENTAL PROTECTION AGENCY
Compiled by
Ruth Bleyler Sample Management Office
VIAR & COMPANY
Prepared by
THE USEPA DATA REVIEW WORKGROUP Scott Siders - EPA HQ - Co-Chairperson
Jeanne Hankins - EPA Region I11 - Co-Chairperson Frank Messina - Laura Scalise - EPA Region I1
Gary Bennet - EPA Region IV Ida Levin - EPA Region V
Mahmoud El Feky - EPA Region VI Larry Marchin - EPA Region VI1
June 13, 1988
Modified by Deborah Szaro - EPA Region I
Karol-Anne O'Leary - ESAT Region I EPA Contract No. 68-01-7443
February 1989
i

TABLE OF CONTENTS Page
Title Page .......................................................... i
Table of Contents .................................................. ii
List of Appendices ................................................. iv
Preface ............................................................. v
Scope of the CLP Routine Analytical Services ....................... vi
Role of the Reviewer .............................................. vii
1.0 INTRODUCTION ................................................... 1
1.1 Overview of the Data Review Process ............................ 2
1.2 Information Available to the Reviewer .......................... 2
1.2.1 The Data Package ........................................ 2 1.2.2 Information Supplied by the Sampling Team ............... 3
Field QA/QC Samples .............................. 3
1.2.2.2 Sample Descriptions .............................. 4
1 . 2 . 3 Laboratory Contract Compliance Screening (CCS) .......... 5
1.2.4
1.2.2.1
Performance Evaluation Samples .......................... 6 The Regional/Laboratory Communication Network .................. 6 1 . 3
1.4 The DPO Communication Network .................................. 8
1.5 The Data Validation Report ................................... . . 8
2.0 PRELIMINARY REVIEW ........................................ o . o . 1 4
2.1 The Data S u ~ a r y .............................................. 14
2.2 Usage of Qualifier Codes on the Data SClllllllary .................. 14 3.0 INORGANIC VALIDATION PROCEDURE ................................ 16
I . Data Completeness ...................................... 17
I1 . Holding times .......................................... 17
ii QQQICP25

TABLE OF CONTENTS (concluded)
3.0 INORGANIC VALIDATION PROCEDURE Page
iII. Calibration. ...................0.s....0...........0.0..~18
IV. (Blanks... . . . . . . . . . . . . . . . . . . . . . . . . . . . . . .000e.. .0. . .~0.0.22
v. ICP Interference Check Sample ...................;....,.24
VI. Matrix Spike Analysis ...............................,.~27
VII. Laboratory Duplicate Sample.Analysis ................... 29 VIII. Field Duplicate Sample Analysis ..........................
IX. Laboratory Control Sample Analysis .......................
X. Furnace Atomic Absorption Analysis .................. .**33 XI . ICP Serial Dilution Analysis ........................... 34
XII. Detection Limits. . . . . . . . . . . . . . . . . . . . . . . . . . . . . . . . . . . .0~.35
XIII. Sample Result Verification........ ..................... 37 XIV. Overall Assessment of Data for a Case.................38
GLOSSARY A: Data Qualifier Definitions.......... ................. -39 GLOSSARY B: Other T e r m s . . . . . . . . . . . . . . . . . . . . . . . . . . . . . . . . . . . . . . ~ . . . . . 4 0
LIST OF APPENDICES
Appendix
Appendix
Appendix
Appendix
A:
B:
C:
D:
Contract Compliance Screening Inorganics Data Package
Contract Compliance Screening Statements
Completed
Figures
Figure
Figure
Figure
1:
2:
3 :
Procedures for
- Listing of
Data Validation Report
Region I Data Validation Roles and Responsibilities
Overview of the Data Validation
Inorganic Traffic Report
1
* U S
Defect
Process
iii

Figure 4: Chain-of-Custody Form
Figure 5: Contract Laboratory Program Telephone Record Log
Figure 6: Data Quality Objectives Summary Form
Figure 7: Data Summary Tables
Figure 8: Standard Worksheets
Figure 9: Inorganic Regional Data Assessment Form
A Completed Inorganic Regional Data Assessment Form (IRDA) and Guidance for Completing the IRDA.
Appendix E:
iv

PREFACE
The Laboratory Data Validation Functional Guidelines for Evaluating Inorganics Analyses (June 1988 revision) have been modified for use within Region I. The modifications were performed to delineate regionally required actions that were not specified in the June 1988 revision. Formats and procedures relating to information transfer within Region I have also been incorporated. presenting additional guidance, this document will assist the reviewer in using professional judgement to make more informed decisions and in better serving the needs of the data users.
By
V

SCOPE OF THE CONTRACT LABORATORY PROGRAM ROUTINE ANALYTICAL SERVICES
Samples from hazardous waste sites are generally unpredictable, and may contain high concentrations of contaminants, complex mixtures of contaminants, and constituents that interfere with the analytical method. The Routine Analytical Services (RAS) Statement of Work (SOW) for the Contract Laboratory Program (CLP) is a contractual step-by-step method intended to obtain characterization of the contaminants present at the highest concentration and identification of samples that may need special methods for proper analysis. CLP SOW requires a substantial amount of quality control and complete documentation of all steps employed during the analysis. information is necessary for a reliable validation process, and is essential for litigation.
The
This
A major driving force of the CLP is to provide routine analysis of a large number of samples. For the majority of samples, valid, usable data are obtained. For those difficult samples, however, CLP provides sufficient documentation to indicate the nature of the problem. CLP Special Analytical Services ( S A S ) can then be employed to target the analysis problem. The risk of obtaining unusable data is highest when little site information is known or when interferen- ces are present. results obtained by the same method may not be consistent for all samples.
EPA recognizes that the quality of the analytical
As presented in this document, the reviewer assumes that the precision and accuracy of the CLP meets or exceeds the Data Quality Objectives (DQOs) for the sampling event. It is beyond the scope of this document to compare site-specific DQOs to the data quality obtained. However, the DQO Summary Form enclosed with each data package should enable the data reviewer to assess site-specific data usability for particular data sets.
Summarv
1.
2 .
3 .
4 .
The CLP analyzes large numbers of potentially complex environ- mental samples.
The SOW requires that analysis be attempted via a rigid proto- col. Under normal circumstances, proper analysis is achieved. When complex or difficult samples are analyzed, the SOW focuses the laboratory's effort on the constituents present at the highest concentrations. For these samples, the SOW does not require that minimum detection limits be achieved.
The SOW requires a substantial amount of quality control and documentation as part of the analysis.
The required documentation permits full-scale data review by EPA .
vi

ROLE OF THE REVIEWER
Upon completion of analysis, the CLP laboratory sends a repli- cate data package to each of the following: the Region requesting the analysis, EPA's Sample Management Office (SMO), and the Environ- mental Monitoring Systems Laboratory (EMSL-LV). It is SMO's respon- sibility to determine whether the laboratory was contractually compliant with the SOW through Contract Compliance Screening (CCS) as part o f the government's right of inspection. On the other hand, the Reaional data reviewer takes the results from the Statement of Work (SOW) analysis, receives input from the user as to objectives of the sampling effort, and attempts to determine if the data meet the user's needs. contractually compliant data are not always technically useful and that contractually non-compliant data are sometimes very useful.
from four perspectives: technical objective of the criteria, the criteria itself, evaluation of the criteria, and actions resulting from the review. narrative report indicating the data quality and identifying specific problem areas is written for the user.
'
The driving force for Regional data validation is that
Throughout this document, data validation criteria are discussed
Once the entire data set has been reviewed, a
Summary
Data review requires that four objectives be simultaneously con- sider ed :
1. To assess and'sunrmarize the quality and reliability of. CLP data for the user (usability);
To document (for the historical record of the site) factors affecting usability:
2 .
a. discrepancies;in the data,
b. poor labor&ory,practice .not regulated in the SOW, and
c. sfte:locations which are difficult to analyze:,
3 . To assist regional DPOs in monitoring CLP laboratory performance and maintaining good lab practices: and
4 . To provide program personnel with information concerning -
the effectiveness of SOW methods and the CLP,. and to identify problems requiring resolution by headquarters.
vii

7 6 0 1 LABORATORY DATA VALIDATION
ETJNCTIONAL GUIDELINES FOR EVALUATING INORGANICS ANALYSES
1.0 INTRODUCTION
This document is designed to offer guidance in laboratory data evaluation and validation. In some aspects, it is equivalent to a Standard Operating Procedure (SOP). In other, more subjective areas, only general guidance is offered due to the complexities and uniqueness of data relative to specific samples. These Guidelines have been updated to include all requirements in the 7/87 Statement of Work (SOW) for Inorganics.
Those areas where specific SOPS are possible are primarily areas in which definitive performance requirements are established. These areas also correspond to specific requirements in Agency contracts and these requirements are concerned with specifications that are not sample dependent; they sgecify performance requirements on matters that shouid be fully under a laboratory's control. These specific areas include blanks, calibration standards, performance evaluation standard materials, and tuning. In particular, mistakes such as calculation and transcription errors must be rectified by resubmission of corrected data sheets.
This document is intended to provide guidance for technical data review. Some areas of overlap exist between technical review and Contract Compliance Screening (CCS); however, contract compliance is not intended to be a goal of these guidelines. It is assumed that the CCS is available and can be utilized to assist in the data review procedure.
Some requirements are not identical for every Case or batch of samples. Requirements for frequency of Quality Control (QC) actions are dependent on the number of samples, sample preparation technique, time of analysis, etc. Specific Case requirements and the impact of non-conformance must be addressed on a case by case basis; no specific guidance is provided.
At times, there may be an urgent need to use data which do not meet all contract requirements and technical criteria. Use of these data does not constitute either a new requirement standard or full acceptance- the data. Any decision to utilize data for which performance criteria have not been met is strictly to facilitate the progress of projects requiring the availability of the data. A contract laboratory submitting data which are out of specification may be required to re-run or submit data even if the previously submitted data have been utilized due to urgent program needs: data which do not meet specified requirements are never fully acceptable.
The only exception to this requirement is in the area of requirements for individual sample analysis: if the nature of the
1

sample itself limits the attainment of specifications, appropriate allowances must be made. obtain data which are technically valid and legally defensible.
The overriding concern of the Agency is to
All data reviews must have, as a cover sheet, the inorganic regional data assessment (IRDA) form (see Appendix D, Figure 9). If mandatory actions are required, they should be specifically noted on this form. deficiencies requiring attention, as well as general laboratory performance and any discernible trends in the quality of the data. (This form is not a replacement for the data review.) supplementary documentation must accompany the form to clearly identify the problems associated with a Case. attachments must be submitted to the Contract Laboratory Program Quality Assurance Officer (CLP QAO), the Regional Deputy Project Officer (DPO), and the Environmental Monitoring Systems Laboratory in Las Vegas (EMSL/LV).
It is the responsibility of the data reviewer to notify the Regional DPO concerning problems and shortcomings with regard to laboratory data in writing. If there is an urgent requirement, the DPO may be contacted by telephone to expedite corrective action. is recommended that all items regarding a specific case needing DPO action be presented at one time. data assessment form must be completed and submitted.
In addition, this form is to be used to summarize overall
Sufficient
The form and any
It
In any case, the inorganic regional
1.1 Overview of the Data Review Process
In Region I, the CLP DPO provides all data validation training and oversight of contractor work. qualifications, presents workshops to teach step-by-step data validation and to introduce new regional guidelines and procedures, and audits data validation packages for technical content, format, and accuracy. /
The DPO approves data reviewer
Appendix D, Figures 1 and 2 illustrate the normal flow of the data review process. Sources of information are noted, as well as communication channels and key decision points in the review process.
1.2 Information Available to the Reviewer
1.2.1 The Data Package
A. Objective
The CLP data package is designed to provide all necessary documentation to verify compliance to the Statement of Work (SOW) and to enable verification of the accuracy and reliability of the reported results.
2

B.
C.
D.
Requirements
Items examined during CCS and contractual quality control requirements are presented in Appendix A and B of this document, respectively. deliverables is contained in the SOW.
A list of the required
Evaluation Trocedure
Procedures for the evaluation of specific deliverables are referenced in Sections 3 of this document.
Action
When contract-required information necessary for data validation is missing from the data package, the reviewer should call the laboratory and request the omitted data according to the procedure referenced in Section 1.3. contact the laboratory.
Only authorized regional personnel may
1 . 2 . 2 Information Supplied by the Sampling Team
In order to use this document effectively, the reviewer should have a general overview of the case at hand: the exact number of samples, their assigned numbers, their matrix, and the number of laboratories involved for the analysis are essential information. Additional useful information includes the types of waste disposal, the overall purpose and goals of the sampling investigation, sample locations/descriptions (particularly identification of any residen- tial wells within the sample set), and knowledge of any positive results from prior on-site sampling efforts. on the site is very helpful and an effort should be made to obtain these data. manager are the best sources for answers or further direction.
Background information
The EPA site project officer or contractor site project
1.2.2.1 Field QA/QC Samples
A.
B.
C.
Objective
Field QA/QC samples, such as trip blanks, equipment blanks, and field duplicates, enable data reviewers to evaluate sampling conditions, techniques, and preci- sion.
A t a minimum, equipment blanks and duplicates must be included at a frequency of five percent.
Evaluation Procedure
3 (300033

D.
The revcewer should evaluate the contamination found in the blanks as part of the lab method blank review, and the field duplicate precision concurrent with lab duplicate precision evaluation.
Action
1. If the laboratory has not provided results for any of the samples that were shipped, the reviewer should check the case narrative for a possible explanation (broken sample, insufficient sample for re-analysis, etc.). If no explanation is found, the RSCC should be contacted to further investigate and resolve the issue.
2 . The sampler should be called if any of the follow- ing problems are noted:
a. equipment blanks or field duplicates not identified: and
b. anomalies such as traffic report numbers listed twice, etc.
1.2.2.2 Sample Descriptions
A. Objective
Sample descriptions/locations are necessary information for preparing the data summary tables and for the evaluation of holding times (see Section 3.2). (In addition, sample descriptions are useful as supplemen- tary information for the consideration and discussion of matrix problems and chemical constituents identified in particular samples.)
B. Requirements
Copies of the traffic reports (see Appendix D, Figure 3) are mandatory deliverables in the laboratory data package. In addition, a copy of the chain-of-custody form (COC) (see Appendix D, Figure 4) may be provided in the data package or may be available to the reviewer from the sampling team. Both forms contain the date of sampling as well as the sampling locations.
C. Evaluation Procedure ,
Traffic reports and the COC form must be compared for
4

consistency with respect to the designation of quality control samples (blanks and field duplicates) and the identification numbers for field samples.
D. Action
1. If discrepancies are identified, the sampler should be contacted for resolution.
2. If information is illegible (sample descriptions or sampling date), the sampler should also be contacted to provide a legible copy of this information.
3. If traffic reports are missing, the laboratory should be contacted for this required deliverable.
1.2.3 Laboratory Contract Compliance Screening (CCS)
A. Objective
CCS provides a rapid, high volume assessment of deliverables for technical compliance to contract requirements. The primary application is to enable a determination of payment recommendation. Because of this direct link to payment, CCS fosters a somewhat timely resolution of contractual problems.
B. Requirements
Items examined by CCS are listed in Appendix A. The Sample Management Office (SMO) performs CCS on 100 percent of data packages submitted. Laboratories are required to submit all missing data, and resubmit or explain all data identified as non-compliant during ccs .
C. Evaluation Procedure
CCS must be used by the reviewer, when available, to evaluate those technical criteria that are also contractual criteria and to determine the completeness of the data package. The CCS results should be previewed to determine important compliance issues. The reviewer should compare the findings of the CCS to the laboratory data package in the course of data validation. CCS is contained in Appendix B.
A list of defect statements utilized by
D. Action
1. If the CCS is not provided with the data package,
5 000035

it should be requested through the RSCC. data review can still be initiated without CCS results, provided the reviewer assesses non- compliance issues which may affect the usability of the data.
However,
2 . If errors are noted on the CCS, they should be flagged and forwarded to the attention of the Region I DPO.
3 . When a contract-required re-analysis or deliverable was noted as missing by CCS, the reviewer should call the laboratory to find out the expected delivery date.
1.2.4 Performance Evaluation SamDles
The reviewer should contact the sampler to determine if any PE Samples were sent with the case. obtain a l l pertinent identification information (i.e. Traffic Report Nos., EPA identification no., etc.). Once this information is obtained, the data'reviewer should call Cheryl O'Halloran at (617) 860-4614 to obtain the true values of the sample for comparison to the laboratory results.
If they were, the reviewer should
1.3 The Regional/Laboratory Communication Network
A. Objective
In January 1983, the National Program Office estab- lished a system of direct communication between the regions and contract laboratories as a routine method for regional data review staff to obtain answers to technical questions concerning program data in the timeliest and most direct manner possible.
B. Requirements
The ground rules for this system are as follows:
1. Regional contact of laboratories is permissible only after laboratory data submission.
2. All logistical questions involving data delivery, contractual requirements, procedural recommenda- tions, and other general matters are to be referred to the RSCC, to SMO, or to program management (i.e., DPO) as appropriate. In addition, re- analysis requests originating from the data reviewer must be channeled through the RSCC or the Region I DPO.
(6QQ036 6

.e
3. Only authorized regional personnel may contact laboratories and they may contact only the speci- fied laboratory personnel.
C. Procedure
1. All conversations between the regions and the laboratories are recorded by both the laboratory and the regional contact on the CLP telephone record log (Appendix D, Figure 5).
2. One copy of the telephone record log is forwarded by the reviewer to each of the following:
- SMO - the Region 1 'laboratory DPO - the laboratory - RSCC
D. Action
' 1. When requesting information from the laboratory, the insistence on short deadlines by the data reviewer during the initial contact has been shown to be the primary factor in minimizing the time required to get an answer.
2 . The four types of problems that require direct contact between the reviewer and the laboratory for resolution are illustrated in the attached flow chart (Appendix D, Figure 2) and are described below:
a. In the case of missing or illegible deliver- ables, the reviewer should call the laboratory to establish and record the expected due date for the requested deliverable.
b. When a contract-required re-analysis necessary for data validation is missing, the reviewer should check to see if the problem was noted by the CCS. If so, the reviewer should call the laboratory to find out the expected due date. If the problem was not noted by CCS, the reviewer, in conjunction with the site project manager, must decide whether initiation of a re-analysis request would provide usable data (weighing a consideration of holding times, etc.). To initiate a re-analysis request, the reviewer must contact the RSCC or the Region I laboratory DPO.
7

c. Clarification of discrepancies or errors in the reported data usually requires correction and re-submission of results by the laboratory. If the laboratory does not verify the error, the reviewer should doublecheck his work to insure the accurate reporting and qualification of data.
then
d. In some cases, it may be necessary to have the laboratory provide certain explanations or details of the conditions of analysis that do not correspond to any of the SOW required deliverables. In such cases, a verbal answer is all that is required of the laboratory.
1.4 The DPO Communication Network
Similar to the above, DPO communications involve contact with project officers, laboratories, SMO, and data reviewers. The DPO receives numerous reports from SMO and EMSL-LV. directly and specifically to data review will be forwarded to reviewers as appropriate. protocols as they are received.
are referred to DPOs for resolution. For instance, if Region 1 data reviewers uncovered a possible contamination problem in a laboratory assigned to Region 2, the problem is first referred to the Region 1 DPO who then contacts the DPO in Region 2.
It is recommended that the DPO be notified of all problems and requirements for a case at one time. ment, the DPO may be contacted by phone to expedite corrective action. must be submitted to the DPO to provide documentation of the data review, and for resolution of inter-regional problems.
Those which relate
The DPOs will also provide updates to SOW
Inter-regional questions or problems with laboratory performance
If there is an urgent require-
A data validation report with the ORDA form as a cover page
1.5 The Data Validation Report
A. Objective
The findings of the review are distributed to readers for three distinct applications: oversight of Contract Laboratory Program (CLP) labora- tory and method performance, and oversight of the data review contractors performance. For individuals involved in site-related decisions, it is imperative that the data validation report present a clear explanation of those issues affecting the application
site assessment, -
(-J064038 a

B ' 1 6 0 1
of the data to the site investigation. provide the data users with an overview of data quality, but should also explain the qualitative confidence and quantitative error associated with all individual results. In addition, the data users require a condensed form of the analytical results which includes all positive sample results, detection limits, and associated qualifier codes.
The report must
On the other hand, the EPA individuals responsible for management and oversight of CLP laboratory and method performance require a presentation of issues related to laboratory non-compliance, poor laboratory practice not regulated in the SOW, and any unusual method or analytical problems.
For both contractual issues and problems affecting the usability of the data for site assessment, support documentation must be sufficient to allow EPA to perform a full-scale review of the data validation in order to substantiate the report's conclusions.
B. Requirements b
In order to meet the needs of the data users, a four-part data validation report and an Inorganic Regional Data Assessment form are the required data validation deliverables.
1. DQO Summary Form The DQO Summary Form submitted with the one-month projections must be included in the data validation report. An example of a blank form and a completed form is contained in Appendix D, Figure 6 and Appendix C, respectively.
2. Memo - This should briefly identify the scope of the analytical effort, provide a general overview of data quality, and list and interpret specific problem areas that affect the usability of the data . A l l memos must be addressed to the RSCC and the Region I DPO must be copied.
The following parameters must be covered in the memo :
- A brief summary of the type and number of samples analyzed, the case and SDG numbers, the
9 0 8 8 (0 3 9

site, the laboratory that performed the analysis, the type of analysis performed, whether routine or non-routine protocols were followed, the parameters evaluated, and t,ie type and number of field QC samples included in the sample set.
- A balanced perspective of the data quality must be provided by summarizing the usable aspects of the data and areas of compliant laboratory performance, as well as qualifying problems as having either a major or minor impact on data usability.
- For each result which has been qualified, the memo must identify the associated analytical problem or quality control criterion which was not met, and explain the resultant effect on the data. The memo must clearly differentiate problems affecting the confidence concerninq the presence of a compound versus those involving quantitative error. The message to the user ,
should be conveyed in simple, concise language that an individual without an extensive background in analytical chemistry could understand. The narrative should also list or reference all changes that the reviewer has made to the laboratory's reported data, whether due to misidentification or errors in transcription or calculation. Lastly, the narrative should identify support documentation attachments and should include the reviewer's name and signature. The format of the memo, and a brief explanation of how it is to be completed follows:
10

3. Data Summary
Separate tables in Lotus 1 , 2 , 3 have been developed for soil and water analyses and for organics and inorganics analyses. These tables must include all positive sample results, IDLs and CRDLs and associated qualifier codes. Traffic report numbers, sample locations/descriptions, matrix, concentration units, site name, case number, and SDG number should be clearly identified. Examples of the data summary tables are provided in Appendix D, Figure 7 and Appendix C. Only codes defined by this document are permitted to qualify data. Should it be necessary to include other codes, prior approval must be obtained through the Region I DPO. If approval is given, complete definitions must be supplied in the key for data summary tables. The glossary of standard codes for use in qualifying data as per this SOP is located in Glossary A.
4. Standard Worksheets
These worksheets must be utilized to perform the data review. Examples of blank and completed worksheets can be found in Appendix D, Figure 8 and Appendix C, respectively.
5 . Inorganic Reqional Data Assessment Form (IRDA)
The IRDA delineates those issues relating to laboratory non-compliance, poor laboratory practice, and any unusual method or analytical problems resulting in unacceptable or qualified data. The form contains a checklist of areas verified during the review with notations on data qualification in each area. DPO Action items must be detailed and documented, with notations indicating which issues require special attention or follow-up action. Specific recommended actions should be noted on the IRDA. An example of a blank form and a completed form is contained in Appendix D, Figure 9 and Appendix E, respectively. Appendix E also contains guidance for completing the IRDA.
6. Support Documentation
All problems identified either in the narrative report or on the IRDA should be documented by the attachment of laboratory forms, raw data, or reviewer-prepared tabulations that substantiate the findings and conclusions presented in the text. (On the other hand, it is not
11

necessary to attach support documentation to substantiate compliant laboratory performance in cases where there is no problem with data usability.) It is recommended that support documentation attachments be numbered or labeled and referenced accordingly in the text of the narrative report and on the IRDA. In addition, it is helpful if the reviewer circles the specific items of concern located on these attachments.
C. Procedure
D.
Sections 2, 3 and 4 of this document specify the proce- dures for the preparation of all sections of the data validation report. As a final step in this process, it is important that a senior data reviewer check all outgoing reports for accuracy and completeness, due to the complexity of the data validation and the importance of an accurate final assessment of data quality.
Distribution
1. A. One copy of the complete four-part validation report (DQO Summary Form, Memo, Summary Tables, and Standard Worksheets) is distributed to:
- the Region I RSCC - the Region I DPO B. One copy of the Inorganic Regional Data Assess-
ment Form with memo and Support Documentation is distributed to each of the following:
- the Region I DPO (without memo); - the DPO for the laboratory that performed the analysis :
8
- the EPA HQ Quality Assurance officer; and - the designated recipient at EMSL-LV.
(Names and. addresses will be forwarded to the reviewer and periodically updated by the Region I DPO. )
2. The cognizant EPA contract manager may require the data reviewer to send a preliminary copy of the completed data summary, glossary, and sample location map to the EPA site project officer immediately upon completion of the reviewer's evaluation (but prior to typing and submission of the narrative with the rest of the sampling investigation report).
12 OBOOW~

E. Action
EPA will review and comment upon contractor-prepared data validation reports. Resubmission of data validation reports may be required in cases where the required format and procedures were not followed, or when clarifications or corrections are needed.
13

2.0 PRELIMINARY REVIEW
2.1 The Data Summarv
2 . 2
A. Objective
The purpose of the data summary is to provide a simple, condensed form of the analytical results to the user, which enables a quick evaluation and comparison of the constituents identified at the various sampling locations.
B. Requirements
Requirements have been addressed above under Section 1.5.
C. Procedure
Transcribe the results from the Form Is onto the data summary tables (for samples of data summary sheets see Appendix D, Figure 7). Do not transcribe the qualifi- cation codes used by the laboratory. The reviewer will fill in the usability qualifiers which have been determined through the validation process.
D. Action
As appropriate, information will be added to or deleted from the data summary during the course of data validation.
Usage of Qualifier Codes on the Data Summary
A. Objective
The data qualifier codes presented in Glossary A identify the degree of confidence concerning the presence (or absence) of reported analytes and identify results that are considered to be quantitatively inaccurate. These codes have been regionally standardized to insure that contractors throughout the region all employ the same set
. of simple, concise definitions that are understandable to personnel within the various EPA branches.
B. Requirements
1. Only codes defined in Glossary A are permitted to qualify data. Should it be necessary to include other codes, prior approval must be obtained through the Region I DPO.
(p04iOQG 14

2 . In general, only one qualifier code is permitted with each reported result. The foilowing hierarchy has been developed to insure that only the most important code is used in situations where more than one quality control problem is associated with an analytical result:
a.
b.
3. The
Codes relating to identification take precedence over codes related to 'quantitation. Thus , whenever a positive result is qualified with an R, the J code will not be used. Also, whenever a not-detected result is qualified with an R, the code UJ will not be used. The qualifier R should replace any numerical value that the laboratory reported.
Within each of the two categories of codes, the code that indicates a more serious problem with the data takes precedence.
above restriction on the use of multiple qualifiers for a single result is applicable only to the data summary and not to the narrative report. (The narrative should mention major, as well as minor, problems associated with individual results, using appropriate emphasis.)
C. Procedure/Action
Section 3 of this document addresses the individual situations requiring use of particular qualifier codes. A summary of qualifier codes is presented in Glossary A. Upon completion of the data validation, the reviewer should doublecheck the data summary for accuracy and completeness to insure that the appropriate qualifier codes were added according to the requirements listed herein.

7 6 0 1 3.0 INORGANIC DATA-<VALIDATION PROCEDURE
The requirements to be checked in validation are listed below: ("CCS" indicates that the contractual requirements for these items will a lso be checked by CCS; CCS requirements are not always the same as the data review criteria.)
I.
11.
111.
IV.
V.
VI.
VII.
VIII.
IX.
X.
XI.
XII.
XIII.
XIV.
Data Completeness
Holding Times (CCS checks Lab holding times only)
Calibration
- Initial (CCS) - Continuing (CCS) Blanks (CCS)
ICP Interference Check Sample (CCS)
Matrix Spike Sample Analysis (CCS)
Laboratory Duplicates Sample Analysis (CCS)
Field Duplicate Sample Analysis
Laboratory Control Sample Analysis (CCS)
Furnace Atomic Absorption Analysis (CCS)
ICP Serial Dilution Analysis (CCS)
Detection Limits (CCS)
Sample Result Verification (CCS 10%)
Overall Assessment of Data for a Case
16

I. DATA COMPLETENESS F 7 6 0 1
I1 .
Check that the data package is complete and contains all the required deliverables listed in SOW 7/87.
If any of the required data are missing, contact the laboratory to request the information and prepare a Telephone 3ecord Log. 2eview CCS results to see if a request was made for missing information and find out the expected delivery date.
EOLDING TIMES
A. Objective
The objective is to ascertain the validity of results based on the holding time of samples from time of collection to time of analysis or sample preparation, as apprcpriate.
B. Criteria
Technical requirements for sample holding times (HT) have only been established for water matrices. The holding times for soils are currently under investigation. Until the results are available, the holding times for water matrices should be applied to soil matrices. The following holding time and preservative requirements were established under 40 CFR 136 (Clean Water Act) and are found in Volume 49, Number 209 of the Federal Register, page 43260, issued October 26, 1984. Preservation refers to waters only.
METALS: 6 monthsf preserved at pH<2
MERCURY: 28 dayst preserved at pH<2
CYANIDE t 14 days2 preserved at pH>12
C. Evaluation Procedure
Actual holding times are established by comparing the sdm- pling date on the EPA Sample Traffic Report with the dates of analysis, these dates can be found in the laboratory raw data. Examine the sample records to determine if samples were properly preserved.
METALS: EIT (Days)= Analysis Date - Sampling Date MERCURY: HT (Days) = Analysis Date - Sampling Date CYANIDE: HT (Days) = Analysis Date - Sampling Date NOTE: Holding times for Cyanide are calculated based on
the date of analysis and not on distillation date., If the samples were distilled within holding times and analyzed a couple days later it may be acceptable to use the data unqualified. However,
000847 17

I11 .
if several days pass between distillation and analysis, the data may be questionable ana 'need to be qualified. Professional judgement must be used.
D. Action c 7601 I. If 40 CFR 136 criteria for holding times and preser-
vation are not met, qualify all positive results as estimated (J) and results below the Instrument Detection limit (IDL) as estimated (UJ).
2. If holding times are grossly exceeded, the reviewer must use professionai judgement to determine the reliablity of the data and the effects of additional storage on the sampie results. The reviewer may determine that non-detect data are unusable (R).
CALIBRATION
A. Objective
Compliance requirements for satisfactory instrument calibration are established to ensure that the instrument is capable of producing acceptable quantitative data. Initial calibration demonstrates that the instrument is capable of acceptable performance at the beginning of the analysis run, and continuing calibration verification docu- ments that the initial calibration is still valid.
B. Criteria
1. Initial Calibration
Instruments must be calibrated daily, and each time the instrument is set up.
a. ICP Analysis$
A blank and at least one standard must be used in establishing the analytical curve.
b. Atomic Absorption Analysis ( A A ) f
&*bkankand at least three standards, one of which must-'be at the Contract Required Detection Limit (CRDL), must be used in establishing the calibra- tion curve.
The correlation coefficient must be >0.995.. - c. Mercury Analysis .
18

A blank and at least four standards must be used in establishing the analytical curve.
The correlation coefficient must be ~ 0 . 9 9 5 . - d. Cyanide Analysis
A blank and at least three standards must be used in establishing the analytical curve.
A correlation coefficient >0.995 is required for photometric determination. -
At least one mid-point standard must be distilled before analysis.
2 . Initial and Continuing Calibration Verification
a. An EPA certified standard must be used for the Initial Calibration Verification (ICV) and must be analyzed for each wavelength used for analy- sis . -
b. Analysis results must fall within the control . limits of 90-llO%R+of the true value for all analytes except mercury and cyanided
c. Analysis results for mcrcury must fall within the control limits of 80-120%R.-
d. Analysis results for cyanide!must fall within the control limits of '85-115%R.$
e. A CCV must be analyzed every ten samples or every 2 hourslwhichever is more frequent.
f. To verify linearity near the CRDL for ICP analy- sis, the contractor must analyze a standard at 2 .
CRDL or 2 times the IDL whichever is grebithr There are no specific acceptance criteria for the standard at the present time. Professional judgement must be used in qualifying the data.
C. Evaluation Procedure
1. Verify that the instrument was calibrated daily and each time the instrument was set up using the correct number of standards and a blank.
2. Verify that a standard at the CRDL was used in the
19 000049

AA calibration curve or that a standard at the CRDL was analyzed at the beginning of the analysis run.
Verify the correlation coefficient is >0.995 for all
Check the distillation log to verify that a mid-range standard was distilled for cyanide analysis.
3 . AA, Hg, and CN analyses. -
4 .
5. Verify that an EPA certified standard was used for the ICV for all analyses.
6. Verify that all ICV and CCV recoveries fall within the required windows.
7 . Check the raw data to verify that the calibration standard values were transcribed correctly on to Form 11. Recalculate one or more of the ICV and CCV per- cent recoveries (%R) using the following equation and verify that the recalculated value agrees with the laboratory reported values on Form IIA. Due to possible rounding discrepancies, allow results to fall within 1% of the contract windows.
%R = Found X 100 True
Where,
Found = concentration (in ug/L) of each analyte measured in the analysis of the ICV or CCV solution.
True = concentration (in ug/L) of each analyte in the ICV or CCV source.
8 . Verify that a CCV was analyzed every 10 samples or every 2 hours.
9. Verify that a standard at 2xCRDL or 2xIDL, whichever is greater, was analyzed to verify linearity near the IDL for ICP analysis.
1. If the appropriate number of standards were not used for the initial calibration or if the instrument was not calibrated daily-and each time the instrument was setup, professional judgement must be used to qualify the data. It may be necessary to qualify the data as unusable (R) .
20

2. If a standard at the CRDL was not used in establish- ing the calibration curve for AA, positive results up to 2xCRDL and non-detected results may have to be estimated. Examine the recoveries of any low level standards analyzed during the analysis scheme in order to make judgements on the accuracy of the calibration curve at the low end.
3. If the correlation coefficient is cO.995 for AA, Hg, or CN, qualify results >IDL as estimated (J), and non- detected results as estimated (UJ).
4. If a mid range standard for cyanide was not distilled before analysis or did not meet the 10% criteria, use professional judgement to qualify the data. It may be necessary to estimate results if if appears the distillation procedure has d significant impact on sample results.
5. If an EPA standard was not used for the ICV, check the source of the standard used. The ICV must be from a different source than the CCV or the data is ques- tionable.
6. If the ICV or CCV %R falls outside the acceptance win- dows, use professional judgement to qualify all associated data. The following guidelines are recom- mended :
a. If the ICV or CCV %R falls outside the acceptance windows dbut within the ranges of 75-89%, or 111- 125% (CN, 70-84% or 116-130%: Hg, 65-79% or 121- 135%), qualify results >IDL as estimated (J).
b. If the ICV or CCV %R fall outside the acceptance windows but is within the range of 111-125% (CN, 116-130%: Hg, 121-135%), non-detected results are m a l i f iedr
c. If the fCV or CCV % R f i s 75%-89% (CN, 70-84%; Hg, 65-79%), qualify non-detected results as estimated- mf5f
d. If the ICV or CCV %R falls outside the range of 75-125% (CN,70-130%; Hg, 65-135%), qualify all associated results as unusable (R).
7. If the CCV was not analyzed at the required intervals, use professional judgement to qualify the data. The data may be unaffected.
21

8. If the 2xCRDL standard for ICP is not within +20% results near .the CRDL are questionable. Estimate-(J) positive results less than 3xCRDL and (UJ) non-detected results .
IV. BLANKS
The assessment of blank analysis results is to determine the existence and magnitude of contamination problems. The cri- teria for evaluation of blanks applies to any blank associated with the samples. If problems with any blank exist,(ie. prep blank, calibration blank, equip[ment blank, or trip blank) all data associated with the Case must be carefully evaluated to determine whether or not there is an inherent variability in the data for the Case, or if the problem is an isolated occurrence not
B.
C.
D.
affecting the data.
Criteria
1. No contaminants should be detected in the blanks.
2. A preparation blank must be analyzed for each matrix, for every 20 samples digested, or for each batch digested, whichever is more frequent.
3. A calibration blank (CCB) must be analyzed after every ten samples or every 2 hours, whichever is more frequent .
Evaluation Procedure
1. Review the results reported on the Blank Summary (Form 111) as well as the raw data (ICP printouts, strip charts, printer tapes, bench sheets, etc.) for all blanks and verify that the results were accurately reported .
2. Verify that the calibration blanks and prep blanks were analyzed at the proper frequency.
3. Report results >IDL for any trip blanks or equipment blanks taken with the Case.
Action
1. Action in the case of unsuitable blank results depends on the circumstances and origin of the blank. Any blank with a value below the negative IDL must be carefully evaluated to determine it's effect on the sample data. Blanks that are >2x the negative IDL indicate instrumental problems. The possibility of
22

false negatives exist I therefore the associated data must be qualified.
2. In instances where more than one blank is associated with a given sample, qualification should be based. upon a comparison with the associated blank having the highest concentration of a contaminant. The result must not be corrected by subtracting any blank value. Actionevels should be calculated that are 5 times the maximum concentration of each contaminant detected in any blank. No positive sample results should be reported unless the concentration of the analyte in the sample exceeds 5 times the amount detected in any blank.
NOTE: The reviewer should note that the blank analyses may not involve the same weights, volumes, or dilution factors as the associated samples. In particular, soil samDle results reported on Form I will not be on the same basis (units, dilutions) as the calibration blank data reported on Form I11 or the aqueous field blank. Sample weights, volumes, and dilution factors must be taken into considera- tion when applying the Sx criteria. The reviewer may find it easier to work from the raw data when applying the 5x criteria to soil sample data/calibration blank data.
Sample results should be reported as follows:
a. If an analyte is detected in the blank but not in the sample no action is taken.
b. Positive results less than the action level shall be reported with a U.
c. Positive results greater than the action level shall be reported unqualified.
4. The following are examples of applying the blank qualification guidelines. Certain circumstances may warrant deviations from these guidelines. However, DPO approval for any deviation is required.
EXAMPLE 1:
Blank Result 7 IDL 5 Action Level 35 Sample Result 22 Qualified Sample Result 22 u
23

The sample result is > IDL but < the Action Level. results less than 35 are qualified as non-detects.
Positive
EXAMPLE 2:
Blank Result 10 IDL 8 Action Level 50
70 70
Sample Result Qualified Sample Result n
The sample result is greater than the IDL and the Action Level so no qualifiers are necessary.
V. ICP INTEPERENCE CHECK SAMPLE
A. Objective
The ICP Interference Check Sample (ICs) Analysis is performed to verify the contract laboratory's interelement and background correction factors.
B. Criteria
1. An ICs must be run at the beginning and end of each sample analysis run or a minimum of twice per 8 hour working shift, whichever is more frequent.
2. Results for the ICs solution AB analysis must fall within the control limits of of the true value.
C. Evaluation Procedure
1.
2. Verify
Verify.the ICs was analyzed at the proper frequency.
3. Recalculate from the raw data one or more recoveries using the following equation and verify that their calculated value agrees with the laboratory reported values on Form IV.
ICs %R = Found Solution AB X 100 True Solution AB
Where,
Found Solution AB = concentration (in ug/L) of each analyte measured in the analysis of solution AB.
24

True Solution AB = concentration (in ug/L) of each analyte in solution AB.
NOTE: The ICs solution may be diluted to bring the levels of the interferents (Ca, Mg, Fe, Al) within the linear range of the instrument. Dilutions may not be used for quantitation of any other elements.
4. Check ICs raw data for results with an absolute value >IDL for those analytes which are not present in the ICs A solution. Results greater than twice the absolute value of the IDL indicate either a positive or negative interference and must be qualified.
D. Action
1. If the ICs was not analyzed at the proper frequency the data may be affected. Use professional judgement to qualify the data.
2. For samples with concentrations of Al, Car Mg, and Fe which are 50% or more than their respective levels in the Interference Check Sample, the following actions
. are recommended:
a. If the ICs recovery for an element is >120% and the reported sample results are non-detected, data are acceptable for use.
b. If the ICs recovery for an element is >120% and the reported sample results are >IDL, qualify the affected data as estimated (J). Results may be biased high.
c. If the ICs recovery for an element falls between 50 and 79% and reportable quantities of the analyte were detected, qualify the affected data as estimated (.J). Results may be biased low.
d. If an analyte is not detected in the sample, and the ICs recovery for that analyte falls within the range of 50-79%, the possiblity of false negatives may exist. Qualify the data for these samples as estimated (UJ) .
e. If ICs recovery results for an element are < S O % , qualify the data as unusable (R).
3 . If results >IDL are observed for elements which are not present in the EPA provided solution, the possibility of false positives exists. An evaluation
25

.
of the associated sample data for the affected elements should be made. Sample results > 2xIDL with levels of interferents that are 50% or more of the levels found in the ICs solution should be qualified as es- timated (J). Cerrain circumstances may warrant rejection of the data (R) if it is impossible to determine whether the sample result is due entirely to interferences or not.
4. If negative results with absolute values >2xIDL are observed for elements which are not present in the EPA ICs solutions, the possibility of false negatives in the samples may exist. An evaluation of associated sample data should be made. For samples with levels of interferents that are 50% or more than the levels found in the ICs solution all results for the affected analytes which are reported as non-detected should be qualified as (UJ).
5. In general, the sample data can be accepted if the concentrations of Al, Car Mg, and Fe in the samples are found to be <SO% of their respective concentrations in the ICs. However, if other elements are present in the sample at >lo mg/L, the reviewer should investigate the possibility of other inter- ference effects by using Table 2 given on page D-22 of the 7/87 SOW. These analyte concentration equiva-lents presented in the references should be considered only as estimated values, since the exact value of any analytical system is laboratory specific. Therefore, estimate the concentration produced by an interfering element. If the estimate is >2X CRDL and also greater than 10% of the reported concentration of the affected element, qualify the affected results as estimated (J).
The following are examples of estimating interferences and qualifying affected data.
EXAMPLE 1:
A positive result of 1050 ug/L was detected for Antimony in the ICs solution although there should not be any Antimony present in the solution. A review of sample concentrations indicate the levels of interferents in the samples are at least 50% of those found in the ICs solution (300,000 ug/L Aluminum and 150,000 ug/l Iron). Positive results for Antimony must be estimated (J) since they may be due to interferences from Iron or Aluminum.
26

Aluminum Result 300,000
Antimony Result 700 Qualified Antimony Result 700 J
Iron Result 150,000
EXAMPLE 2:
Samples contain 30,000 ug/L Vanadium. 22 of SOW 7/87 indicates the interelement interference factor for Vanadium on Beryllium is 0.05 mg/L Beryllium for every 100 mg/L of Vanadium. Estimating the concentration of Beryllium which is due to Vanadium yields a result of:
Table 2 on page D-
30,000 ug/L X 0.05 mg/L = 1 5 ug/L Beryllium. 100 mg/L
Vanadium Result 30,000 Reported Beryllium Result 70 Estimated Interference 15 Qualified Sample Result 20 J
The estimated concentration of Beryllium signal due to the interference of Vanadium is >2xCRDL and >lo% of the reported concentration therefore the reported value is estimated (J).
VI. MATRIX SPIKE SAMPLE ANALYSIS
A. Objective
The matrix spike sample analysis is designed to provide information about the effect of the sample matrix on the digestion and measurement methodology.
B. Criteria
1. Samples identified as field blanks cannot be used for spiked sample analysis.
2. Spike recovery (%R) must be within the limits of 75- 125%. However, spike recovery limits do not apply when sample concentration exceeds the spike concentration by a factor of 4 or more.
3. If the matrix spike 'recovery does not meet criteria, a post-digestion spike is required and reported on Form
digestion spikes are also required for all furnace analyses but recoveries are reported on the raw data.) In some cases post digestion spike data may aid in
VB for ICP, Flame, Mercury and Cyanide. (Post
27 0 0 0 Q 5'2

evaluating matrix interferences. This information must be included in the DPO report.
C. Evaluation Procedure
1. Review Form V and verify that results fall within the specified limits.
2. Check raw data and recalculate one or more %R using the following equation to verify that results were correctly reported on Form V.
%R = (SSR-SR) X 100 SA
Where,
SSR = Spiked Sample Result SR = Sample Result SA = Spike Added
3. Verify that the field blank was not used for spike analysis.
4 . Verify that a matrix spike was prepared at the proper f regency.
5 . Verify that a post-digestion spike was performed for all analytes with unacceptable pre-digestion spike recovery.
D. Action
1. If the spike recovery is >125% and the reported sample results are non-detected, the data are acceptable for use.
2. If the spike recovery is >125% or ~ 7 5 % and the reported sample levels are >IDL, qualify the data as estimated (J).
3 . If the spike recovery falls within the range of 30-74%
data for these samples as estimated (UJ). 9 and the sample results are non-detected, qualify the
4. If spike recovery results fall ~ 3 0 % and the sample results are non-detected, qualify the data as unusable (R)
5 . If the field blank was used for matrix spike analysis, all other QC data must be carefully checked and
20

professional judgement exercised when evaluating the data.
NOTE: matrix.
Any action taken applies to all samples of the same -
VII. DUPLICATE SAMPLE ANALYSIS
A. Objective
Duplicate analyses are indicators of the precision of the sample results.
B. Criteria
1.
2.
3 .
4 .
Samples identified as field blanks cannot be used for duplicate sample analysis.
A control limit of + 20% (35% for soil) for the Rela- tive Percent Difference (RPD) shall be used for sample values > 5 times the CRDL.
A control limit of + CRDL ( + 2xCRDL for soil) shall be used for sample values legs than 5 times the CRDL, including the case when only one sample value is <Sx CRDL or when one sample is above the IDL and one is non-detected.
-
A duplicate sample must be prepared and analyzed for every 20 samples, for every batch digested, or for every matrix, whichever is more frequent.
C. Evaluation Procedure
1. Review Form VI and verify that results fall within the control limits.
2. Check the raw data and recalculate one or more RPD results using the following equation to verify that
have been correctly reported on Form VI.
RPD = S-D X 100 (S+D)/2
Where,
S = Original Sample Value D = Duplicate Sample Value
29 008053
3 . Verify that the field blank was not used for dupli- e C a t .
analysis.
Verify that duplicates were prepared at the required frequency.
4 .
D. Action
1. If duplicate analysis results for a particular analyte fall outside the appropriate control windows, qualify results > IDL for that analyte in all samples of the same matrix as estimated (J).
2. If the field blank was used for duplicate analysis, all other QC data must be carefully checked and professional judgement exercised when evaluating the data.
VIII. FIELD DUPLICATES
A. Objective
Field duplicate samples may be taken and analyzed as an indication of overall precision. These analyses measure both field and lab precision; therefore, the results may have more variability than lab duplicates which measure only lab performance. It is also expected that soil duplicate results will have greater variance than watermatrices due to difficulties associated with collecting identical field samples .
B. Criteria
A control limit of +30% (50% for soil) for the RPD shall be used for sample v a h s >SxCRDL.
A control limit of +2xCRDL (4xCRDL for soil) shall be used for sample values <-~XCRDL.
C. Evaluation Procedures
Samples which are field duplicates should be identified us- ing EPA Sample Traffic Reports or sample field sheets. The reviewer should compare the results reported for each sample and calculate the Relative Percent Difference ( R P D ) , if appropriate.
30

7601 NOTE: The appropriate person should be contacted to determine whether field duplicates were taken during sampling.
D. Action
If field duplicate analysis results for a particular analyte fall outside the appropriate control windows, qualify results >IDL for that analyte in all samples of the same matrix as estimated (J).
IX. LABORATORY CONTROL SAMPLE ANALYSIS (LCS)
A.. Objective
The laboratory control sample analysis is designed to serve as a monitor of the efficiency of the digestion procedure.
B. Criteria
1. All aqueous LCS results must fall within the control limits of According to SOW 7/87 Antimony and Silver are excluded fromthis criteria. For validation purposes the 20% limit will be applied to both Antimony and Silver.
2. All solid LCS results must fall within the control limits established by the EPA. The 80-120% criteria is not applied to the soil LCS.
An LCS must be prepared and analyzed for each matrix, for each batch of samples digested, or for every twenty samples, whichever is more frequent.
3.
C. Evaluation Procedure
1. Review Form VI1 and verify that results fall within the control limits.
2. Check the raw data to verify reported results on Form VII. Recalculate one or more of the recoveries using the following equation.
LCS %R = LCS Found X 100 LCS True
Where,
31

LCS Found = concentration (in ug/L for aqueous, mg/kg for solid) of each analyte measured in the analysis of the LCS solution.
LCS True = concentration (in ug/L for aqueous, mg/kg for solid) of each analyte in the LCS source.
3. Verify that an LCS was prepared and analyzed at the proper frequency.
D. Action
1. Aqueous LCS
a. If the LCS recovery for any analyte (including Sb or Ag) falls within the range of 50-793 or >120%, qualify results >IDL as estimated (J).
b. If results are non-detected and the LCS recovery is greater than 1203, the data are acceptable for use.
c. If results are non-detected and the LCS recovery falls within the range of 50-79%, qualify the data for these samples as estimated (UJ).
If LCS recovery results fall <SO%, qualify all data as unusable (R).
d.
e. If an LCS was not analyzed at the proper frequen- cy, professional judgement must be used to qualify the data. Matrix spike recovery may also indicate digestion efficiency. Provide explanations in the memo for all actions taken.
2. Solid LCS
a. If the solid LCS recovery for any analyte falls outside the EPA control limits, qualify all results >IDL as estimated (J).
b. If the LCS results are higher than the control limits and the samples are non-detected, no qualifiers are necessary.
c. If the LCS results are lower than the control- limits, qualify all non-detected results as estimated (UJ). .Results may be biased low.
32

x.
3. If an LCS was not analyzed at the proper frequency, evaluate the affect on the sample data and qualify accordingly.
E'URNACE ATOMIC ABSORPTION ANALYSIS
A. Objective
Duplicate injections and furnace post-digestion spikes es- tablish the precision and accuracy of the individual analytical determinations.
B. Criteria
1. For sample concentrations XRDL, duplicate injections must agree within Relative Standard Deviation (RSD) , or Coeffici Variation (CV), otherwise the sample must be rerun once (two additional injections).
2. Spike recovery must be
3. If post-digestion spike recovery is not within 85- 115% and sample absorbance is > 50% of spike absor- bance, the Method of Standard Addition is required. The sample must be spiked with standards at 50, 100 and 150% of the sample absorbance.
C. Evaluation Procedure
1. Check raw data to verify that duplicate injections were performed and agree within + 20 % RSD (or CV) for sample concentrations XRDL.
-
2 . Review Furnace AA raw data to verify that the Furnace Atomic Absorption Scheme, as described in SOW, p.E-15, has been followed.
3 . Verify the percent recoveries wer calcualted correctly.
4 . Verify that all required MSA results are reported on Form VI11 and check that the correlation coefficients and sample results are calculated correctly.
D. Action
1. If duplicate injections are outside the required criteria and the sample has not been rerun once as required, qualify positve results as estimated (J).
33

1 6 0 1
2 . If the rerun sample results do not agree within + 20% RSD or CV, qualify the positive results as estimated (J).
3. If sample absorbance is <SO% of the post-digestion spike absorbance then:
a. For sample results >IDL, if the furnace post- digestion spike recovery is not within 85- U S % , qualify the sample results as estimated (J).
-
b. For non-detected results, if the furnace post- digestion spike recovery is >lo% but <85%, qualify the sample result as estimated (UJ).
c. If post-digestion spike recovery <lo%, qualify positive results and non-detected results ' as unusable (R).
4. If Method of Standard Addition (MSA) is required but has not been done, qualify the positive results as estimated (J).
5. If any of the samples run by MSA have not been spiked at the appropriate levels, qualify positive results as estimated (J).
6 . If the MSA correlation coefficient is ~ 0 . 9 9 5 , qualify the positive results as estimated (J).
XI. ICP SERIAL DILUTION ANALYSIS
A. Objective
Serial dilution analysis determines whether significant physical or chemical interferences exist due to sample matrix.
B. Criteria
1. If the analyte concentration is sufficiently high (con- centration in the original sample is minimally a factor of 50 above the IDL) the laboratory is required to report the results of a five fold dilution. Results that do not agree within 10% of the original results are flagged with "E" by the laboratory. For validation purposes, the criteria for action is 15%.
2. A serial dilution is required for each matrix analyzed.
34

3 . If the sample used f o r the serial dilution had to be diluted for any elements in order to bring the result within the linear range of the instrument, an addition- al five fold dilution is required for evaluating matrix interferences for that particular element.
C. Evaluation Procedures
1. Verify that reported results for the serial dilution meet required criteria of + 10% D.
2. Check the raw data and recalculate the %D using the following equation to verify. that the dilution analysis results agree with initial sample results reported on Form IX.
-
%D = I-S X 100 I -
Where,
I = Initial Sample Result
S = Serial Dilution Result (Instrument Reading X 5 )
3. Check the raw data for evidence of n-gative inber- ference, ie. results of the undiluted samples are significantly higher than the original sample.
D. Action
1. If the percent difference between results is >15 %, and the result of the diluted sample is greater than that of the undiluted sample qualify positive results (J) and non-detetced results as estimated (UJ). A supression due to sample matrix has resulted in the reported results being biased low.
2. If evidence of negative interference is found, use professional judgement to qualify the data. Positive results only need be estimated (J).
XII. DETECTION LIMITS
A. Objective
Instrument Detection Limits reported on Form XI are used for reporting the detection limit for all sample analyses. Any value less than the IDL is considered non-detected.
B. Criteria (g(j(J065 35

1. IDLs must be less than the CRDL for all elements.
2 . ICP or other methods may be used that do not have IDLs that are less than the CRDLs if all sample results are greater than SxIDL for that instrument.
IDLs must be multiplied by dilution factors and prep factors before being reported on Form I or the data summary tables.
3 .
C. Evaluation
1. Verify the instrument detection limits are present on Form XI for all elements and are less than the CRDLs.
2 . Verify that results for all parameters are reported down to the IDL not CRDL on Form I.
3 . Verify that any sample weights, volumes, and dilutions are taken into account when reporting the detection limit for all samples.
Verify that sample results are >SxIDL if ICP analysis results are used for As, T1, Se, or Pb.
NOTE: When the laboratory provides both ICP and GFAA results for an analyte in a sample and the concentration is >ICP IDL, the results can assist in identifying quantitation problems.
D. Action
4 .
1. If the IDL is not less than the CRDL notify the DPO that the laboratory is not meeting contractual requirements. Use the laboratory's IDL as the detection limit on the data summary tables.
2. . Change any results on the data summary tables for samples on Form I that are not reported down to the IDL or do not use proper dilution/prep factors.
.
3 . Estimate or Reject any positive results or non-detected results f o r As, T1, Se, or Pb that are analyzed by ICP but are not greater than SxIDL.
XIII. SAMPLE RESULT VERIFICATION
A. Objective
36

The objective is to ensure that the reported quantitation results are accurate.
B. Criteria
Analyte quantitation must be calculated according to the appropriate SOW.
C. Evaluation Procedure
The raw data should be examined to verify the correct calculation of sample results reported by the laboratory. Digestion and distillation logs, instrument printouts, strip charts, etc, should be compared to the reported results on Form I.
1. Examine the raw data for anomalies (ie., baseline shifts, negative absorbances, omissions, legibility, etc. ) .
2. Verify that there are no transcription or reduction errors (eg., dilutions, percent solids, sample weights).
3. Verify that results fall within the linear range of the ICP (Form XIII) and within the calibrated range for the non-ICP parameters.
4 . The following quidelines should be applied in determin- ing the minimum level of data validation required to assure the acceptability of the data package,
a. Choose at least two furnace AA parameters and check all related 'calculations and transcriptions .
b. Choose at least two ICP parameters for complete validation. If any errors are identified, then evaluate an additional two parameters. If errors are still encountered, then all remaining ICP parameters must be evaluated.
c. Data for Cyanide and Mercury must be validated 100 percent.
D. Action
1. If there are any discrepancies found, the laboratory must be contacted by the designated representative to resolve any discrepancies.
2. If a discrepancy remains unresolved, the reviewer may determine qualification of the data is warranted.
0 0 0 0 ~ 7 37

XIV. OVERALL ASSESSMENT OF DATA FOR A CASE
It is appropriate for the data reviewer to make professional judgements and express concerns and comments on the validity of the overall data for a Case. This is particularly appro- priate when there are several QC criteria out of specification. The additive nature of QC factors out of specification is difficult to assess in an objective manner. However, the reviewer has a responsiblity to inform the user concerning data quality and data limitations in order to assist that user in avoiding inappropriate use of the data, while not precluding any consideration of the data at all. The data reviewer would be greatly assisted in this endeavor if the data quality objectives were provided.
3a

GLOSBARY A
Data Qualifier Definitions
For the purposes of this document the following code letters and
associated definitions are provided.
u - The material was analyzed for, but was not detected above
the level of the associatied value. The associated value
is either the sample quantitation limit or the sample
detection limit.
J - The associated value is an estimated quantity.
R - The data are unusable. (Note: Analyte may or may not be
present) .
UJ - The material was analyzed for, b it was not detectec The
associated value is an estimate and may be inaccurate or
imprecise.

GL088ARY B 7 6 0 1
AA
Case
ccs
3
CLP
CCB
CCV
CRDL
cv
DPO
EMS L/ LV
Equipment blank
Holding Time
ICP
ICs
Atomic Absorption
A finite, usually predetermined number of samples collected in a given time period for a particular site. A Case consists of one or more Sample Delivery Groups.
contract Compliance Screening - process in which SMO inspects analytical data for contractual compliance and provides EMSL/LV, laboratories, and the Regions with their findings.
contract Laboratory Program
Continuing Calibration Blank - a deionized water sample run every ten samples designed to detect any carryover contamination.
continuing Calibration Verification - a standard run every ten samples designed to test instrument performance.
contract Required Detection Limit
coefficient of Variation
Deputy Project Officer
Environmental Monitoring System Laboratory/ Las Vegas
Equipment blanks consist of water used to decontaminate sampling equipment as a sample check for cross-contamination from inadequate decontamination.
The time from sample collection to laboratory digestion, distillation, oranalysis, whichever is appropriate.
Inductively Coupled Plasma
Interference Check Sample
QB)(b0'78

Initial Calibration The establishment of a calibration curve with the appropriate number of standards and concentration range. The calibra- tion cunre plots absorbance or emission versus concentration of standards.
ICB
ICV
LCS
MS '
MD
MSA
NPO
PE Sample
PO
Initial Calibration Blank - first blank standard run to confirm the calibration curve.
Initial Calibration Verification - first standard run to confirm the calibration curve.
Laboratory Control Standard - A standard that has gone through digestion and is designed to measure digestion efficiency. The solid is suppplied by the EPA.
Matrix Spike - introduction of a known concentration of analyte into a sample to provide information about the effect of the sample matrix on the digestion and measurement methodology.
Matrix Duplicate - a laboratory split sample to measure instnunent precision.
Method of Standard Addition
National Program Office
Performance Evaluation Sample
Project Officer
Preparation Blank Laboratory blank water which has gone through digestion or distillation and analysis with each SDG.
QA Quality Assurance - total program for assuring reliability of data.
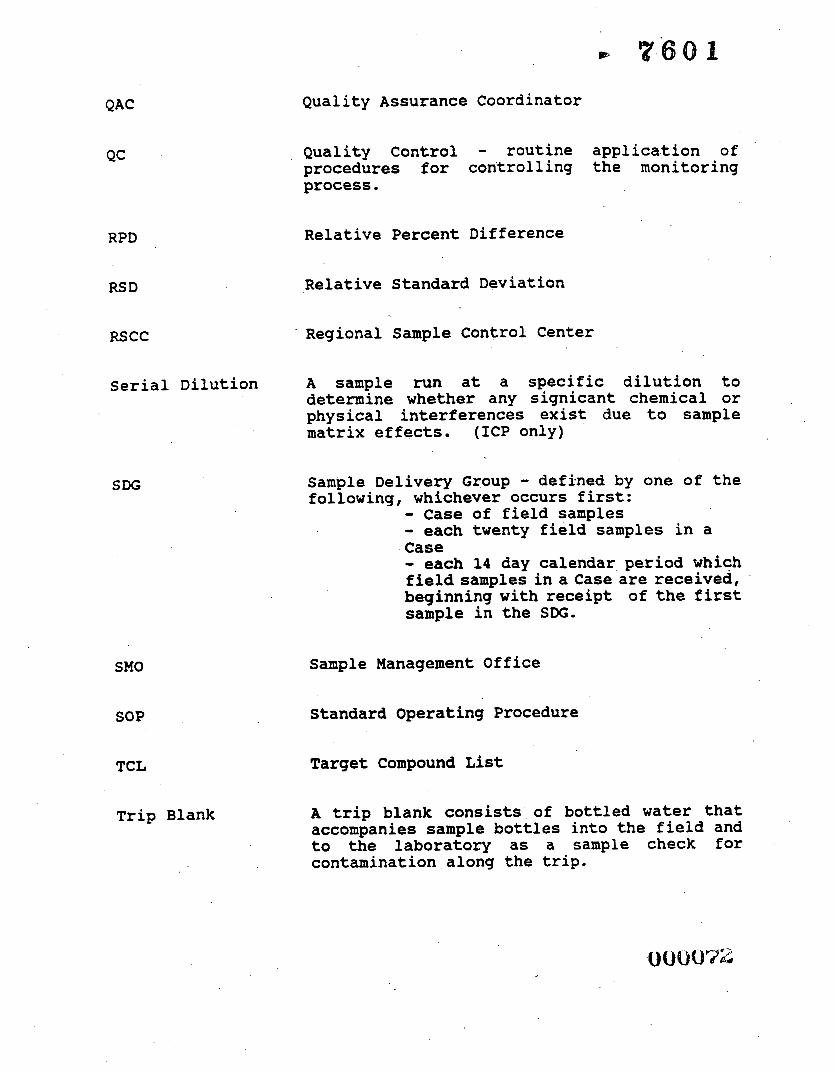
QAC
QC
RPD
RSD
RSCC
Quality Assurance Coordinator
Quality Control - routine application of procedures for controlling the monitoring process.
Relative Percent Difference
Relative Standard Deviation
. Regional Sample Control Center
Serial Dilution A sample run at a specific dilution to determine whether any signicant chemical or physical interferences exist due to sample matrix effects. (ICP only)
SDG
SMO
SOP
TCL
Trip Blank
Sample Delivery Group - defined by one of the following, whichever occurs first: - Case of field samples - each twenty field samples in a
Case - each 14 day calendar period which field samples in a Case are received, beginning with receipt of the first sample in the SDG.
Sample Management Office
Standard Operating Procedure
Target Compound List
A trip blank consists of bottled water that accompanies sample bottles into the field and to the laboratory as a sample check for contamination along the trip.

'76.01
APPENDIX A
Con t rac t Compliance Screening Procedures
f o r RAS Inorgan ic Data Packages

P 7601
STANDARD OPERATXNG PROCEDURE
FOR CONTRACT COMPLIANCE SCREENING (CCS)
OF ROUTINE ANALYTICAL SERVICES ANALYSES
OF INORGANICS DATA UNDER SOW NO. 787

*
I ntroduction
Table of Cootcats '360.1
A. Cover Page B. Data Sheets (Fonn I)
CA.
CB. D. Blanks (Fonn III)
E FA. Spiked Sample Analysis (Re-Digution/
FB. Spike Sample Analysis (Post-Digestion/
Initial and Continuing Calibration (Form IIA) CRDL Standard for AA and ICP (Form IIB)
Interference Check Sample (Form IV)
Pre-Distil!ation)(Form VA)
Post- DistillationXForm VB)
G.
H. L J. Serial Dilution (Form IX) KA. KB.
Duplicate Sample Analysis (Form VI) Laboratory Control Sample (Fonn Vn) Method of Standard Addition (Form VIII)
Mercury Holding T h e (Form X) Cyanide Holding Erne (Form X)
L. M.
Instrument Detection Limit (Form XI) Interelement Correction Factors (Form XII A & B)
N. R RawDaa T. TmfficReporb
Linear Range Analysis (Form xm)
. Appendix
2

lntraduct ion
Tlte following is the Standud Operating Procedure (SOP) under which Contract Compliance Screening (CCS) screens routine inorganic dam (RAS) under SOW 787.
CCS asesscs the deliverable$ in terms of completeness .nd technical compliance. Discrepancies are reported under the relevant screening criteria u hted in the Table of Contents. The screening nsdk are summarized On a summary form. The problems are described in detail in the comments section of Worksheets A and B; Worksheet A for ICp data, and Worksheet B for AA, mercury and cyanide data. Each problem is pnaeded by the code for the relevant criterion. If there is more than one problem under t single code,
line of the comments section across from the corresponding sample.
sequential numbering is used to differentiate between problems (Le., B a c h action, the affected sampks arc identified by placing the
, B3... etc.) For on the bottom
The summary form consists of 8 m a t h that lhk the sample in the kf t margin, and the criteria in the top row. Each box in the ma& represents a sample and 8 criterion. An action code in a box means that there is a problem or an ambiguity in a sample for the related criterion. More than one action code may apply to a single box. 'The action codes are explained at the bottom of the summary page.
R = a requirement or deliverable is incomplete or defective and must be resubmitted.
S = a deliverable is missing and must be submitted.
N - a deliverable is technically noncompliant.
E - an ambiguity exists that requires an explanation in order that a decision am be made.
Comments listed with 'No Action' on Worksheet A or B do not appear on the summary sheet, but need to be addressed in order to avoid future complications.
To ensure better understanding of terms used throughout this SOP, some of the terms are defined as foilows
o o
A c8sc may coiljitt of one or more Sample Delivery Group(s).
A Sample Delivery Group (SDG) is defined by the following, whichever is most frequent - - - All samples must initially be run undiluted. When an analyte concentration exceeds the calibrated or linear range, appropriate dilution and reanalysis of the prepared sample b required. The dilution should be minimal and should not dilute the sample below the instrument detection limit. An analytical sample is defined as any cuvette in the auto sampler, excluding standardization, ICV, ICE, CCV and CCB. The ICs, CRI, Linear Range Standard, La, Analytical Spikes (post digest/post distillation spikes) 8nd preparation blanks are all considered analytical samples.
each case of Field Samples received, OR each 20 Field Samples Within I as, OR each 14 calendar day period during which Field Samples in a case are received.
o
o
3

A. Corer Page
1. P m
8.
b.
Check to see that the Cover Page iS present.
Ensure that all required information is filled in:
(I) Laboratory name, laboratory code, contract no., case Y, SI)G e, SAS (where applicable), SOW e, .nd EPA sample a u m k n in alphanumeric order.
(2) All -le m in data package corresponding with Form I and Tnffs Report
(3) Eamn that the SDG number has &en properly assigned,
(4)
(5)
Check to see that the Cover Page is in EPA format.
Lob managen signature and date.
Statement concerning interelement and background correctjom.
C.
2. Action & If the Cover Page b not present, it must be submitted. (S)
b. If' the Cover Page b not properly completed, it must be resubmitted (R). IF the SDG number k incorrectly assigned the cover page as well as dl affected forms and raw data must be resubmitted (R).
C. If the Covet Page format is different from that specified ia Exhibit B, it must be resubmitted (R).
B. F o ~ I - Dah Shett
1.
L Check to see that each sample corresponding to the list on the Cover Page and the Traffic Reports.
Check to see that all required information is filed in:
the data package bas 1 Fom I
b.
. 1) EPA sample * 8nd Laboratory Sample ID Y must-be the maw as they lppear on the Cover Page. Laboratory m e , lab cobc, case u, SDG #, SAS #, md laboratory receipt date must b present
2) Spot check the results versus the raw data.
3) Ensure that the correct number of significant figures and the proper rounding rules for reporting results on Form I have been followed 2 sig. fig. must be reported if the result < 10 a d 3 sig. fig. if the result L IO. For Hg report results 5 follows 0.2 ug/L, 0.2 U; betwan 0.2 and 10 ug/L, one decimal; above 10 ug/L, whole numben.
008077 4

4) Units must be UG/L for w t e s md NG/KG (dry wt) for solids.
5 ) Solid samples require I value for % solids (reported to one decimal place). Water am pi^ must have 3- reported for % solids.
6) Ensure that soil results reported to the instrument detection limit are corrected for 96 solids.
7) Descriptions of coloration, clarity, texture and artifacts in tam- ple are required before and after m p l e digwtion/dbtillation. For water samples report color and clarity, for soil $ampla report color, texture and utifacts, as recommended in SOW 787, B- 16.
C. Ensure that any required data flap resulting from requirements for Forms V - IX (N, M, *, S, +, W, and E) have been entered on Fom I as appropriate.
d. Ensure that values are reported properly. Form I includes fHlds for three types of result qualifiers. These qualifiers must be completed as followc
0 C (concentration) qualifiers. Enter 'k if the reported nlue it less than CRDL but grater than IDL. If the W y t e was anal- for but not detected, 8 .U" must be entered. Sample must not be diluted below the detection limit of the inttnrment The laboratory must use the lowest dilution factor necesmry to bring each analyte within the valid linear range and report the highest valid value for each anaIyte.
0 Q (Quality Control) qualirien. Specified entries and their meanings art as follows
E - Tbe reported value is estimated because of the pnsewx of interfennce(s).
M - Duplicate injection precision not met for GFM.
N - Spike sample recovery not withi0 control limits.
S- The reported value was determined by the method of standard additions (MSA).
W - Post digestioa spike for furnace AA analysis is out of control limits.
- Duplicate analysis not within control limits.
+ - Correlation coefficient for the MSA iS less than 0.995. -
3

, 0 M (Method) qurlifien - Specified entries rod their meanings
8 f C 8S fOllOWS
P - ICP
A - RameAA
- Manual Cold Vapor AA
AV - Automated Cold Vapor AA
AS - Semi-Automated Spectrophotometric
C - Manual Spectrophotometric
T - Titrimetric
NR - If the analyte is not required to be analyzaj
e. All dilutions not required by the SOW (and affecting IDL) must be noted on an analyte by analyte basis in the comment section.
f. Ensure that the resulk reported pertain to the analyses requested. If cyanide analysis is not requested Form I should state NR, under the method column.
Check to see that any analyte value reported by my method that has its IDL > CRDL is at least Sx IDL.
8.
2. Action a. A missing Form I must be submitted. (S)
b.,c.,d.,e. An iacornplete Form I must be resubmitted. a) ’
If tRnscription errors, improper flagging or incorrect units ue found, Form X must be resubmitted (R).
If a sample i s diluted below the IDL the sample mt be reanalyzed wing the appropriate dilution factor and the data submitted (S).
If a required analysis was not reported, results must be submitted (S) under CCS criterion R, as well as CCS criterion A, B, K.
f.
g. If an anaIyte was determined by a method for which IDL > CRDL, samples with analyte results below Sx IDL should be marked noncompliant (N) under criterion L.
b
0 080’7 9 6

Appendix B
Table 1
Codes for kbelllng R.v Data
Sample Duplicate Hatrix Spike Serial Dilution Analytical Spike Instrument CdliSration Standards Initial Calibration Verifications Initial Calibration Blank Continuing Calibration Verificatiom Continuing Calibration Blanks Interference Check Samples:
Solution A
Solution M CRDL Standard for M W L Standard for ICP Laboratory Control Sanpler:
Aqueous (Vatcr) Solid (Soii/Sedimecr)
Preparation Blaak Linear Range Analysis Standard
Sample Dilutions
zxxxx IRXXXXD XXXXXXS
xxxxxxA STD1, STD2. ... c t c . ICV1, ICV2, ... c t c .
ICE CCV1, CCV2,...ctc. CCB1, CCB2, ... ctc.
.' XEmXL
ICSA ICSAB .
CRA CRI
Lcsv LCSS
P3 LPS -
3~ - 3 fold - 1:2 - (one part sample and tu0 parts dilutant)
D
. . 4
7/8 7

CA. Form IIA - Inltlal and Coatlaalng Callbratiom
1. Screenine P r a
a. Ensure that dl required information on Form I1 has been complettxt Laboratory name, iab code, Case cc, SDG cc, SAS 52, Unia (ug/L), Initial & Continuing Calibration sources and Analytid Methods used.
b. Check the Form IIA'r vcnus the raw dam to verity that n s u i k for all calibrations bracketing relevant sample in the c8sc have been rearbed.
c. Verify that 2-point (for IO), (-point PIUS blank (for Hg) and 3-point plus blank (for AA m d cyanide) calibrations have been performed. If the instrument i s not capable of performing the required calibration the standards must be w immediately after the instrument calibration sequence. The results must agree within 2 5% of the true value (exception' CRDL calibration standard).
d. Instruments must be calibrated daily or once every 24 hours and each time the instrument is set up. The instrument calibration date and time must be included in the raw data.
e. Spot check the calibration results versus the raw data and ensure proper rounding of results was followed.
f. Ensure that the %R calculations are correct and are within the control limits (90-1 1096 for ail metals, except 80-120% for Hg and 85-1 15% for CN). Ensure that the %R*s are calculated from the results reported on Form IIA. Higher precision or unrounded values cannot be used to determine %R.
8- Verify that the proper calibration standards have been used, and that the same continuing calibration standard was wtd throughout the analysis run for I cme of samples received. Verify that the reported true values for ICVs md ccvt are correct using EPA true value or values submitted by the laboratories.
h. Verify that the ICV has been nm immediately after instrument calibration and it within the control limits (90-1 1096)
i. Verify that the 10% continuing calibration frequency requirement has been met. No more than ten analytical samplu may be nm between the ICV, fujt CCV or subsequent CCVs (this includu the ICs, LCS, CRI, Linear Range, analytical spikes and preparation blanks.) Ensure that every analytical sample is between two sets of ICVflCB3 or CCV/CCB*s that have met 111 calibration requirements.
j. Verify that a CCV has been performed every 2 hours or at a 10% frequency whichever is more frequent.
k. Five full MSA's may be performed between consecutive CCV/CCB (whether single or duplicate injections were used). CCV/CCB valuet may also be determined by MSA if the instrument's mode cannot be changed while MSA iS being performed.
1. Ensure that for all AA (except for Hg) and cyanide analyses one calibration standard k at CRDL. 000081
.7

2. Action a. If any required informatioo is missing from 8 Form 11, the form must
be resubmitted. (R)
b. If ray calibration verification pertinent to the a m p l e has not ban reported, a Form 11 with the appropriate data must be submitted (S)
If the instrument dibratioo does not meet the required criterin (2- point (for ICP), 4 point plus blank (for Hg), 3-poht plus blank (for AA and cyanide), or 25% criteria) mark dl related Saahplu noncompliant (N).
If calibration raw data are not present, they must be submitted (S) under CCS criterion CA.
c.
'
d.
e,f. If the %R for the calibration result (rounded to the nearest whole number using EPA rounding rules) b outside the control limits, the instrument must be recalibrated. the previous ten samples reanalyzed for the afftxted d y t e s and the data submitted (S); If the %R calculations are incorrect, a comcted form must be resubmitted (R).
8. if improper calibration staadards have been used, mark the associated samples as noncompliant (N). If the calibration sources have not been identified, Form I1 must be resubmitted (R) with the required information.
h. If the ICV is not run immediately after instrument calibration and/or b not within the control limits mark all affected samples noncompliant (N).
i,j,k. If the 10% continuing calibration frequency requirement has not been met, or if the 2 bow CCV has been violated, mark the p w samples (to previous compliant CCV or I c y ) at noncompliant (N).
I, If one of the calibration standards for all AA (except Hg) and Cyanide analyses is not at CRDL, ail samples will be considered noncompliant (N).
a
. .

CB. Form IIB - CRDL Strrmdard for AA and ICP *. 7 6 0 1 1.
a. Ensure that dI required information on Form IIB has been completed.
b. Verify that I standard at the CRDL has been rnalyzed for each analyte by AA (except Hg). Verify that a standard I t ZX CRDL or 2x IDL, whichever is greater, has baa analyLed for each analyte by ICP but not for AI, Ba, Ca, Fe, Mg, Na or K.
c. Ensure that a CRDL standard has been performed at the beginning and end of each ICP mn (but not before the ICV/lCB or after the finai CCV/CCB at the end of the ICP nm).
d. Verify that the 8 hour CRDL requirement was satisfied for ICP analysh
2. Action a. If any required information is missing from a Form IIB, the form must
be resubmitted (R). A missing Form IIB must be submitted (S).
b. If the m e values of the CRDL standard are not at the appropriate lev& the analysis for all samples must be marked noncompliant (N).
C. If the CRDL standard for ICP has been run before the ICVflCB or after the final CCV/CCB the analysis for all samples must be marked noncompliant (N).
6 If the CRDL standard is not reanalyzed within 8 hours for ICP analysis, mark all samples in the run as noncompliant (N). If analysis time are not provided, the laboratory must Lubmit them (S) under CCS
. criterion R
9

D. Form 111 - Blanks
a. Ensure that dl required.information on Form 111 has been completed.
b. Ensure that all values for all required blanks were reported on Form 111.
C. Spot check the results Venus the raw data.
d. All blank results must be reported, positive, negative or zero.
e. The values for the preparation blank must be recorded in UG/L for water samples and MG/KG for soil sampl-. The values of ICB/CCB must be recorded in UG/L.
f. Ensure that the proper concentration flag ‘V is applied for an absolute value below IDL, .B. for an absolute value greater than the IDL but. below the CFtDL.
8. Ensure that the blank va lue are within control limits.
h. Check the raw data to verify that 8 calibration blank hat ban analyzed immediately after each calibration verification, at the beginning and after the last analytical sample, every 2 hours, and at 10% frequency.
1. Enssun that a preparation blank. has been analyzed for each batch of samples (up to 20). For Hg the preparation blank is the same as the calibration blank, in accordance with the mercury method. It must be labelled for both uses in the raw data.
2. Action a. If Form X is incomplete, it must be resubmitted (R).
b. If required blanks are not documented, a Form III with the appropriate data must be submitted (S).
c. If the absolute value of the blank (ICBJCCB) results exceeds the CRDL for an element, mark the preceding samples (to the previous compliant ICB/CCB) as non-compliant (N). The instrument must be recalibrated and the samples re-analyzed for the affected analyte. If an element is determined on an instrument whose IDL exacds the CRDL, mark the associated samples ss noncompliant (N) if the calibration blank is greater than the IDL.
d. If the 2 hour or 10% frequency has not been met, mark the preceding samples (up to the last compliant ICB/CCB) as noncompliant (N).
egg. If the absolute value for any analyte concentration in the prep. blank i s above the CRDL, the lowest concentration of that analyte in the associated samples must be lox the blank concentration. Otherwise, all samples must be redigested and reanalyzed for that analyte and the data submitted (S).
I O

1. If results in improperly trPnscribed or the units arc must be resubmitted (R).
h,i. If' raw data are needed, code this as submit (S) under CCS criterion R.

E. Form i V - Ioterleresce Check Sample p" 1 6 0 1
a. Check to see that all information m u i r e d on Form IV has been completed, including IC5 source and ICP ID number.
b. Verify that an ICs analysis run has been performed at the beginning, (but not before the ICV and ICB), and end of' each ICP run (but not after the final CCV/CCB).
c. Ensure that all ICs results are documented on Form fv. The analysk with the lowest dilution factor within the hear range for all ekmentr must be reponed.
d. If the ICs was Contractor prepared, venfy that it contains all ekments at the level specified in Table 2 (SOW 787 E-8) and that a mean md standard deviation are calculated for each analyte based upon at least 5 measuremen k.
e. Spot check the ICs results v e n a the raw data. Easure that the %R calculations are correct and are within the control limits (80-120) except for AI, Ca, Fe, Mg. Recoveries must be calculated versus the 'true' value if EPA solutions are used or a mean value when I Contmctor prepared solution is used.
f. Ensure that the %Rs arc calculated from the values reported on Form IV. Higher precision or unrounded values arc not permitted to be used to determine %R
g. Verify that the 8 hour ICs requirement was satisfied.
1.
b.
C.
6
e.
f.
If' any information on Form IY hat not b a n completed, it must be resubmitted (R).
If the IC5 is run before the ICV/ICB or after the f i i CCV/CCB matk all samples in the run as noncompliant (N). If IC5 raw data have not b a n submitted for both the beginning and end of an ICP run, then the data must be submitted (S) under CCS criterion R
If any required ICs value has not been documented .on 8 Form IV, it must be submitted (S).
If Form IV lacks the true values for 1CP elements, except for those not contained in an EPA solution, it must be resubmitted (R).
If any ICs recovery (except for 'hterf'erentf such as Al, Ca, Mg and Fe) is outside the control limit, mark all samples in that ICP run as noncompliant (N). Results for all elements must be within the linear- range or a diluted value must be submitted (S) from the diluted ICs,
. .
If the %Rs are calculated from value other than those reported on Form IV, the form must be resubmitted (R).
12

g. If the ICs as noncompliant (N). If analysis times for ICP are not provided, the laboratory must submit (S) them under CCS criterion R.
not reanalyzed within 8 hours, mark all samples in the run
13

FA. Form VA - Spiked k p l e Andyrlr (Prc-Dlgestiom/Pre-Distillrlioa) --
I. Screeninn Pnxxdu re B S s s a a. Ensure that ail information required on Form VA has been completed.
b. Verify that I t least one spiked sample aodysis tuu been performed on each group of samples of a similar matrix typc (Le., water, soil) and concentration (i-e., low, medium), or for each Sample Delivery Group (SDG), whichever k more frequent If two methods (ICP, GFAA) arc used for an element, spike sample must be run lad reported for tach method. The units for reporting spike sample results will be identical to those used for reporting sample results in Form I (i.e., UG/L for aqueous and MG/KG dry weight bash for solids).
Spike concentrations should conform to those in Table 3 (SOW 787 E- 10). Results must be in consistent units; IDL is the minimum reportable level.
c. Ensure that %Rs are reported for every spike performed and spot check the results versus the raw data and %R calculations. In calculating %R, use sample result (SRW for values < IDL. If' the spike is performed on the sample that is used for the duplicate analysis ensure that the %Rs are calculated versus the results designated as the 'original' sample. The duplicate results or the average of the duplicate and sample results cannot be used. Ensure that the %Rs are calculated from the values reported on Form VA. Higher precision or unrounded values cannot be used to determine %Rs. %R must be reported, whether it K negative, positive, or zero.
d. Under 'control limit %R', 75-12F must be entered if the spike added (SA) value was greater than or equal to one-fourth of the sample result value. Results outside the control limits must be flagged with W. This does not apply when SR (sample resuIt) > 4 x SA (spike added). .
e. If then ls more than one spike (per matrix, level, and method) and only one requires the 'W flag, all samples of that matrix and level done by the same method, must be flagged.
An identified field blank cannot be used for matrix spike analysis. Except when it is the only sample of that concentration and matrix for that SDG.
f.
g. Check the traffic reports to see if a specific sample is requested for the spike analysis.
2. Action a. A Form VA missing any required information must be resubmitted (R).
b. If matrix spikes have not been performed at the required frequency, the data must be submitted (S). If required matrix spikes have not been documented on Form VA, they must be submitted (S). If spike concentrations do not conform to those in Table 3, the spike analyses (for affected elements) must be redone at the appropriate levels and submitted (S). If inconsistent units have been used, Form VA must be corrected and resubmitted (R).
UUUOt58 14

'3601 C. If the method of' crlculating the %R b iocomct, Fonn ViA must be
corrected and resubmitted (R). If the %Rs are alculated from values other than thore reported on Form VA, the form must be resubmitted (R).
d,e. If a %R requires an 'W fIag on Form VA lad does not have it, Form VA must be resubmitted (R); Form I must a b be resubmitted (R) rn appropriate.
f. ' If an identified field blank has been used for the matrix spike analysis, a matrix spike analysis on 8 field sample must be submitted (S). (Except when the field blank is the only aqueous sampk in a case of soil samples.)
g. If the sample designated to be d for the spike analysis has not been used then the proper sample must be spiked and the results submitted 6).

1. %reeninn Procedure
a Ensure that 111 required in fomt ion on Form VB has been completed.
b. For flame AA, ICP, Hg, and CN analyses, when the pn-digestion/pn- distillation spike recovery falls outside the control limits and the sample result does not exceed 4x the spike added, (i.e. an rnalyte that has ban flagged OW), a past-digestion/gortdhtillation spike must be performed for those elements that do not meet the specifred criteria (except Ag). The uaspiked aliquot of the sample must be tpikedat ZX CRDL or 2r the indigenous level, whichever is greater. The units for reporting spike sample results wiil be UG/L.
C. Spot check the results versus raw data and check %R calculations.
d. Ensure that the proper reporting and calculation methodologies m followed.
2. Action a. If Form VB is missing any required information it must be resubmitted
(R).
b. If a post digest ion/pt distillation spike has not been done as required then the analysis must be performed and the data submitted (S). If the sample has been incorrectly spiked then the analysis must be redone u the appropriate spike level and the data submitted (S).
c,d If the results are improperly reported or calculated Form VB must be resubmitted (R).
16

G. Form V I - Duplicate !hrnplc Analysis
1. &reeninn P m
a. Ensure that all information required on FORI VI has been completed.
b. Verify that at least one duplicate sample analysis has been performed on each group of samples of a similar matrix type (Le., water, soil) and concentration (i.e., low, medium). for each SDG, whichever is most frequent. If two methods (ICP, GFAA) 8re used for an ekment, duplicate samples must be run and reported for each method. Results must be in consistent unitt; IDL is the minimum reportable level. The sampk urd duplicate results cannot be averaged for reporting values on Form L Duplicate analyses ue required for 96 soolids values and for all analyte results. Check for appropriate units (UG/L for water and MG/KG dry weight for soil).
C. Spot check the results versus raw data and the RPD calculations.
6 If both sample and duplicate values are 2 Sx CRDL a control Limit of 220% RPD is applied. If either the sample or duplicate results are below Sx CRDL a control limit of KRDL is applied. 'Ihc m L value must be entered under 'control limit' to applicable analyta. If both sample values are < LDL, the RPD is not to be calculated md 'NC must be entered under the method column. Values outside the control limits must be flagged with .+.. It there is more than one duplicate sample (per matrix, level, and method), and only one is outside the control limits, all mnples of that matrix and level, done by the -e method, must be flagged
e. The RPD valuw must be calculated from the values reported on Form VI. Higher precision or unrounded values cannot be used to determine the RPD.
f. Duplicate sample analysis may not be performed on an identified field blank, except when it is the only sample of that concentration and matrix for that SDG.
g. Check traffic repom to see if a specific sample is to be used for the dupliate analysk.
a. If m y required information is missing from Form VI, it must be resubmitted (R).
b. If duplicate analyses have not been performed at the required frequency, these analyses must be performed, and the data must be submitted (S).
If required duplicate analyses were performed, but were not docu- mented on Form VI, these data must be submitted (S).
If inconsistent units w e n used, Form VI must be corrected and re- submitted (R).
I7

C. If the RPD calculations are incorrect, Form VI must be resubrriitted (R). 7601
d,e. If the incorrect control limits have b a o applied or the K R D L control limit is not entered when required, or if the flagging d e s have been applied iacomctly Form VI must be corrected and resubmitted (R).
If the arulytes have not been correctly flagged on Fom I, the Form 1's must be resubmitted (R) under criterion B.
f. If an identified field blank has been used for the duplicate analysis, a duplicate analysk on 8 field sample must be submitted (S).
g. If the sample designated to be used for the duplicate aaaiysk has not b a n wed then the proper sample must be used for the duplicate analysis and the results submitted (S).
18

H. Form VI1 - Laboratory Cootrol Sample l ~ b - , 7601
1. greeninn Pracedurg
a. Verify that rll information required on Fonn VI1 has been completed. Ensure that the proper reporting methodology has been followed.
b. Verify that 8t least one Fonn VII, with aqueous and/or solid laboratory control samples, has been submitted for each group of rque~us and/or solid samples in each SDG or each batch of samples digested. An aqueous LCS is not required for Hg and CN malysb. If an lnalyte is determined by more than one method I separate LCS must be analyzecl by each method.
C. Spot check results versus raw data and %R calculations.
d. Ensure that the salid and aqueous LCS results are within specified control limits (80-12096 for the aqueous LCS and within the specified concentration windows for the solid La). If either aqueous or solid LCS is out of control the analysis must be terminated, the problem corrected, and the samples associated with that LCS redigested and reandyzed.
2. Actioq
a. If any required information is missing from Form Vn, it must be resubmitted (R).
If the required number of LCS analyses has not ban performed, these analyses must be performed and the data must be submitted (S). If a required LCS analysis has not been documented on a Form ViI, it must be submitted (S).
If any aqueous or solid LCS results are outside the control limits (80- 120% for aqueous or concentration window for solids) (except Ag and Sb in the aqueous LCS), mark all related samples as noncompliant (N).
b.
c,d.
19

1. Form VI11 - Method of St8od8rd Additloo rod Furnace Atomic Abrorptioa (AA) gC A O 8 l V S i S
IBe, % - x e o a.
b.
C.
d.
B Ensure that Form VI11 has been completely and correctly filled in and results flagged as appropriate on Form 1's.
Determine which elements have b a n analyzed by Furnace AA. Find the raw data and verify that the proper analytical sequence has been followed. Full MSA must be performed within the antex t of a rtgplar analytical run, Le., 3-point calibration plus blank between consecutive ICV/ICE md CCV/CCB with no more than five full MSA's. During full MSA, single injections for blanks md standards are permissible. If duplicate injections ue used during MSA, their average value must.& used to plot the MSA c u m .
If sample concentrations are gnater than the CRDL, ensure that the duplicate readings agree to within 20% relative standard deviation (RSD). If they do not agree within 20% RSD after one rerun, the result on Form I must be flagged with an 'M".
Review the analytical spike recoveries and sample and spike absorbance (or concentration) to ensure that the MSA decision tree (Figure 1: SOW 787 E-15) has been followed. If the spiked sample requires dilution, the unspiked sample must be rerun at the same dilution factor. Analytical spikes an required on the LCS and prep blank. MSA is not to be performed on the LCS or preparation blank, regardless of spike recovery resulk. If MSA is performed twice on one sample as required by the MSA decision tree and both h4SAs have I cornlation coefficient < 0.995, ensure that the result reported on Form I for that analyte was from the MSA with the best cornlation coefficient An analytical spike iS not required on the predigestion spike sample when the spike sample ncovery mntrol limit or when SR > 4x SA.
within the 7596-12596
A quick check for MSA.
%R for analytkal spikes
< 40% - Dilute (5 to lox) sample and rerun once. If stil l < 40% the mutts must be flagged with an 'F.
Sample absorbance or concentration is < 50% of the spike, the sampk must be quantitated from the curve and report down to the IDL. If the spike recovery b le# than 85% or greater than 115%. the results must be flagged with a 'OT.
Sample absorbance or concentration is > 50% of the -
spike and the spike recovery k between 85% and 11596, the results must be quantitated from the curve and report down to the IDL.
20

(3) Sample abwrbance or concentration b > 50% of the spike and rpike recovery is greater than 1 IS% or less than 8536, the sample must be quantitated by MSA.
e. %R must be dcu la t ed using sample result, SRIO for vaiues Values between IDL and CRDL must be used in calculating the analytical spike recovery.
tDL.
If MSA's have been performed ensure that all M A results have k e n reported correctly on Form MI and in the raw data. Recalculate several linear regressions. Ensure that the curve is plotted with concentration added (x-axis) vs. absorbance (y-axis) and that the y intercept, slope, and correlation coefficient are reported on Form Ym or in the raw data as required. Also make sure all flags (S, +, w) are entered on Form l's as appropriate.
f. If the preparation blank analytical spike recovery iS out of control (85- 1 lS%), the spiking solution must be verified by respiking and rerunning the preparation blank once. If the preparation blaak analytical spike recovery is still out of control, the problem must be corrected and reanalysis of all analytical samples associated with that blank is required.
2. Action a If Form VIII is not present, it must be submitted (S). If the proper
data flags (E, S, +, W and M) have not been written on Form I, then Form I must be resubmitted (R). An incomplete or incorrectly submitted Form VIII must be resubmitted (R).
b. If the proper analytical sequence has not been followed, mark the affected samples as noncompliant (N).
C. If the 96 RSD between a sample and its duplicate exceeds 20% and the sample has not been rerun, mark the sample as noncompliant (N).
d. If the proper decision tree process has not been followed for a sample, mark it as noncompliant (N). Examples are: (1) noacontract specified dilution of a sample before the fkst analysis, or (2) spiking at > 2 x CRDL, then diluting the spiked sample to bring the spike to 2 x CRDL or (3) rerunning a sample instead of diluting or performing MSA. If the spiked sample was not run at the same dirution factor as the unspiked sample, it is non-compliant (N).
e. If the %R is improperly calculated, the calculation must be corrected and the data must be resubmitted (R). If MSA is required, the analyses must be performed and the data submitted (S). If the slope, y-intercept and correlation coefficient are not present in the raw data they must be submitted (S).
f. If the preparation blank analytical spike recovery b out of control and it was rerun but remained out of control mark all affected samples as noncompliant (N).
21

Serial Dilation (Form I X --ICP Ooly) 7601 1. Screeninn P r d u q
a.
b.
C.
d.
e.
f.
g-
Verify &at Form Ix has been submitted for each required serial dilution md that all information required on Form IX has been completed.
Ensure that at least one serial dilution has been performed on each group of samples of a similar matrix type (Le., water, soil) and concentration (Le., low, medium), for each SDG, whichever is most frequent If no samples in the case contain analytes at least ten times (lox) the IDL in the original (undiluted) analysis, then serial dilution is not required (NR). The initial sample value must be entered on Form IX and (NR) entered under the method column if the original sample is below IOx IDL.
Check to see that a 5-fold dilution that does'not agree within 10% of the initial value has been flagged 'E' for that analyte on Form IX and all associated Form Is. If there is more than one serial dilution per SDG, but at least one is not within the 10% limit for a specific analyte, flag all samples of the same matrix and concentration with 'E" flags for that analyte.
Ensure that identified field blanks have not been used for serial dilution analysis.
A Sx dilution is required (one part of sample mixed with four parts distilled water).
Spot check the results on Form IX against the raw data and recalculate the % Difference for a few elements.
Ensure that the proper concentration flags have been reported on Form Ix
a. If Form IX is' not present, it must be submitted (S). An incomplete * Form IX must be resubmitted (R).
b. If no, or too few serial dilution analyses have been performed (provided that analyte concentrations are sufficiently high), these data must be submitted (S).
c. If 'F flags are required, but are not entered on Form IX, the form must be resubmitted (R). The affected Form Is must also be re- submitted (R) under CCS criterion 8.
d. If an identified field blank has been used for serial dilution analysis, an analysis on a field sample must be 'submitted (S).
If a dilution factor other than 5x is used, the analysis is noncompliant e. (N).
OO~OB9C-il
22

' 7 6 0 1 f. If the results on Form IX do not cornspond to the raw data, or the %
. Difference for any element is incorrect, the form must be resubmitted (R).
If Form IX is improperly completed it must be resubmitted (R). 8.
23

KA,KB. Holding Tires - Form X
1. Screeninn Procedue
Cyanide (CN) - 14 days
Mercury (Hg) - 26 days
Other metals - 6 months
a. Ensure that Form X has been submitted and completed properly.
b. For CCS purposes, the holding time is defined as the number of days from the date of sample receipt at the laboratory to the date of sample preparation (digestion or distillation). Compare thee two dates for each analyte and sample to see if' hoiding times have been exceeded. Holding time - prep date - laboratory receipt date.
C. Ensure that the holding time has been propedy calculated. The dates on Form X must correspond to the dates on the distillation (or digestion) log and the Traffic Reports.
2. Action a. If Form X is not present, it must be submitted (S).
b. If information to determine holding times is not contained in the data package, it must be submitted (S). If the holding time for an analyte in a sample has been exceeded, mark that sample as noncompliant (N) and report the number of days in excess on the CCS summary sheet.
C. If the holding time calculations on Form X are incorrect, Form X must be resubmitted (R).
24

L. Fom XI - lutruaemt Dthtiom Limits
1.
a. Verify that at least one Form XI has been submitted.
b. An IDL must be reported for each wavelength used h the sample analysis (no IDL is required for CN). Verify that the IDL are not greater than the CRDL for each anaiyte. If an rnalyte has been determined by an instrument whose IDL exceeds the CRDL for that clement, check to see that the concentration in the sample exceeds the CRDL by at least a factor of 5.
c. Verify that the IDL's reported are for the current quarter, (Le. no more than 3 months old). If multiple instruments are used for the analysis of an analyte within an SDG, the highest IDL for the instrument must be used for reporting concentration values fot that SDG.
d. Verify that all information is recorded on Form XI including Instrument LD.
2. Action
a. If a required Form XI is missing it must be submitted (S).
b. If an IDL is not reported for an analyte it must be submitted (S). If the IDL for an analyte exceeds the CRDL, mark all samples noncompliant (N) and notify the laboratories Project Officer (P.O.). (Except when the sample result is greater than 5x3 the IDL).
C. If the case is submitted using out of date IDL's, the new IDL's must be submitted (S) and all affected Forms I-IX resubmitted (R). If the analyte has been determined by more than one instrument and the highest IDL is not reported then all affected Forms I-IX must be resubmitted (R).
d. An incomplete or ambiguous Form XI (unclear as to which IDL corresponds to which instrument) must be resubmitted (R).
,
2s

1.
Verify that ill required information k recorded on Forms XII A & B.
b. Verify that 8 current Form WI has been submitted with every case package. Ensure that correction factors for Al, Ca, Fe and Mg have been determined. Also ensure that the date Of the correction facton do not ex& the ICP analysis date or pncede the analysis date by more than 12 months.
2. Action a. An incomplete form must be resubmitted (R).
b. If interelement correction factors have not been determined for AI, Ca, Fe and Mg mark all samples noncompliant (N). If a Form XI1 is missing, it must be submitted (S), under criterion M.
26

1.
a Ensure that dl required information b recordsd on Form XIIL
b. Verify that a current Fonn Xm has been submitted for each ICP instrument used in determining analyte results. Ensure that the date of ICP analysis does not exceed the Linear Range determination by more than 3 months.
C. Make sun that all the results obtained from each ICP instrument for each analyte and wavelength fall below its established hear range for that instmment. For AA, CN and Hg the linear range of the instrument is the value of the highest standard used to calibrate that instrument.
2. Action
a. If Form XIII is improperly completed or incomplete it must be resubmitted (R).
b. A missing Form Wn must be submitted (S). If the linear range(t) are out of date then the current linear ranges must be submitted (S).
C. If any value obtained from an instrument falls above its established linear range of that inst,rument the sample should be marked as noncompliant (N).

R RswDat8
1.
8. Verify that ksibk raw dm (ICP, Flame AA, Hn, CN, Digation tnd Distillation L.ogs, and 96 solids) including instrrunent radoots md indication of pH 2 or > 1 2 , ~ applicable, have been submitted to support all sample analyses m d QC operations reported in the cltc.
Ensure that the raw dala are properly labelled using EPA Sample numbers and codes and conform strictly to the contmct requirements (See Table 1: SOW 787 B-8).
b.
C. Ensure that the taw data 8re in the correct order (ICP, Flame A& Furnace AA, Hg, CN, digestion and Distillation Logs, and 96 solids).
d. Verify that proper background correction and multiple injec- tion/exposure requirements have been fulfilled. The Cover Page state- ment on background comction applies only to ICP.
e. Ensure that the time and date of each analysis has been given and the run sequence is clear and follows the contract requirements.
f. Ensure that no QA/QC samples are improperly run. If the fmt run of a QA/QC sample is outside of its specified control limits, the analysis must be terminatcd, the problem(s) corrected, the instrument recalibrated, and all affected samples reanalyzed.
8. Ensure that any crossouts made to the raw data are initialed and dated by lab penonnei.
2. Action a. If the raw data for any sample or QC operation are missing they must
be submitted (S). If the data are illegible they must be resubmitted (R).
b. If the raw data are not properly labelled or do not strictly conform to the contract requirements, the data msut be resubmitted (R).
C. If the raw data are not in the correct order, note it on the worksheet as a 'No Action' item. If the problem pemists, report it to the laboratory's Project Off-.
d. If background corrections have not been applied to Furnace AA, ICP,
noncompliant (N). If duplicate injections/exposures for Furnace ICP or AA (except M A ) have not been performed, mark the affected samples as noncompliant (N).
, or Flame AA measurements below 350 nm, mark all samples as
e. If time and dates of &ch analys& are not given in the raw data, the data must be resubmitted (R). If the raw data is not clear (Le. too many crossouts, inconsistency between actual raw data and summuy sheets, ambiguous explanations, etc ...) the data must be resubmitted (R).
28

f. If QA/QC tunples M =run cwcpu4 the fht 8aalysb was outside of specified umrol limits for that QA/QC sample the mdytial samples usociated with that puticrrht QA/QC sample must be marked noncompliant (N) under tbe QA/QC criterion it pertains to.
.
g. If crussouts in the n w data are not initialed md dated, the n w dam must be resubmitted (R) with the appropriate initials and dates.
, ’
29

. . . . T. &pie Traffic Reports 16011
a. Verify that all samples Listed on tbe Cover Page, and having a Fonn I, also have a T d f g Report copy in the &a package.
b. Ensure that the Traffic Report photocopy is legible as to case number, sample number, sample type, required analysis, receipt date and signature. The Traffic Reports shall be arranged in increasing EPA sample number order, considering both alpha and numeric designations.
c. Check to see that all analyse requested on the Traffic Report have - been carried out. (Note: If "rltend' is entered on the Traffic report a 'ditsolved' metal analysis is not automatically requested. The specific analysis requested must be under the proper column in section "C U S ANALYSW of the traffic report).
d. Check to see if' any of the samples are labeled as a field blank or a rinsate.
2. Action
a If a Traffic Report photocopy irS d i n g , it must be submitted (S). If there is a Traffic Report photocopy but no Form I or raw data, the problem should be coded as explain (E).
b. If the Traffic Report photocopy is illegible, it must be resubmitted (R).
C. If requested analyses have not been performed, the data for that analysis and all required forms must be submitted (S).
d. If an identified field blank or rinsate has been used for the duplicate, spike or serial dilution analysis (except if the sample is the only sample of that concentration and matrix in that SDG) the analysis must be submitted (S) on an appropriate sample, under the proper criterion.
30

Appemdlr 1 6 0 1 .
si

A p p e n d i x A
" U (D 4 Q
el u H
z < (P
a 0 z U
a 0 L
* a < t z 3 n
(D
z U
2 W
W
a u n
W
u 2 < H
A
a z 0 0
c u 4
a c 2 0 u
" a U A z U c 4 0
- m w A a r < m
I
W el 4 U
" 0 W > c) U u W
U c < 0
a
" z 0 W
t a
.. 9:
. - a :
I I I C 4 u)
S .I i --- I m I = y I 1 --- I
m i " g I
I , A . I n o : f Z I 0 ) -
. . - I l l I l l I l l
- 1 - 1 - 1 - I l l I l l I l l I l l I l l
- * - a - * - I l l 1 1 1 1 1 1 I l l
1 1 1 I l l
I l l 1 1 1

. .
3 z
01 W W
2 4 (D
a 0 I w
K
0 Y
tn 2 w I Y
W
e 0 .)
W
0 2
-- w
a r
d
0 0
c 0 < K
c z 0 0
- * 0 W
m
f w p: 0 n
i U 0 W K
- W E f 3
I I I
I
I
I I I
I
I
I I
I
I I.) i.: I U
I d
t o
: a I &
I
i
I
I
I
I
I I I
I
I I I I
I
I
I
I
I I
I
I
I
I I I I I
I I
I
I I
I I
I
- I I I I I I I I I I I I I I I I
I
I I I
I I I I I I I I
I I
. I I I
I
I
--ooo 1 I I I I I I I
I I I I I I I I I I I I I I
I I I
' I I I I I I 1
I - 1
I I I
I I
- 1 - 0 0 . I I
I I
I
I
I
I
I
I
I
I I I
I
- 1 o--. I
I I
I
I
I I
I
I
I I
I
I
I
I
I I I I I I
- 1
I
i I I
I
I I I
I
I I
I I :, I I I
I
I
I
1
I 1
I
I
I
I
I
I
!
- I ---. I
I I : I I I
I
I
I
I I
I
I
I I I I I
I I
' I I I I
I
I
I I
I !

7601
0 I n
K
0 L
tB I n 2 w U
V
I --- I ----- 4 --a. I I I I
I 1 I I I
I I I
I I I I I
I I I
I I I I I
I I I
I I I
I I I
I I I I I
I I I
I I I
I I I
I I I I I I I 1 I I
I I I I I I I I I
I 1 I I I I
I I I
I I I I I
I 1 I
I
I
I --- I
I W I C l a I O I ---
I
I
I
I I
I
I
I
I I I I I I I I I
* I
I I I I
I
I
I
I
I
t
I I I
I I I
I .I I I I
I I I I
I I I I I I I I I * I I I I I I I I
--e--
-----
I I I
I I I
I
I
I
I I I I I I I I 1 I
I I I I
I
I I I I
I
I I I I I
I I I
I I I
I I I I I I
I I I
I I I I I I I I 1 I I I- I I I I I I
----- ---e-
-----
I I
I
I
I I I
I I
I
I I
I
I
I
I I
I 'I I I
I I
I
I I
I
I
I
8
I I I
I
I
I
I
I
I I I
I I
I
I I I
1 I I
-----
- I ---. I
I
I I
I I .
I I I I
I I 4 I I I I
I I
I
I
I
- 1
I I
I
I I I
I
! I I
I
I
I I
I I
I
I
I I I
I I I I
I
I
I
I I
I I
I
I I I
I
I I I I I
- I ----- 1 ---. I I I I I I I I
I I I I I
I I I I
I I
I I I
I I
I I I
I I I
I I
I I I I I
I
I I I
I I ' I
I I I
I I I
I I I I I
I
I *
- 1 c:
- 1
I
I I I
I
I
I I
I
I
I I I I
I
I
I I
I I I
I
I
I I I I I I I
I I
t
I I
I
I
I
I
I I I
I I I I
I I I
I I I
I I I I I
I
I
I I I I
I I I

. . . . .
Appendix C
Contract Required Detect ion Limit (1#2)
(ug/L) Ana 1 y t e
200 60 10
200
5 5000
10 50 25
100 5
5000 15 0.2 GO
5000 5 10 - -
5000 10 50 20 10
AlMlinum Anthony Arsenic aarium Beryllium Cadmitrm Calcium Chroaium Cobalt Copper Iron Le ad Hagnesiua Hanganc sc He rcury Nickel Potassium Seleniuz S i l v e r Sodium T h a l l i = Vanadiuc 2 inc Cyanide
, $
c - 1

. . . . . , f
Appendix D
a2 3e
0 . 5 0.5
Cd 1 .o Co Cr cu .I7
Ni Pb V 2n
0.5
..* . Ca Fe Hg
0 .5 0 . 3 0.5 1.0 1.0 0 . 5 1.0
500 200 500
E- 8 7 / E 7

TABU 3 . SPIKING LNns(') FOR SPIKE SAWU ANALYSIS
€or ICP/M For fLrnacc M
Element Vater Soil Water Soil
TABU 3 . SPIKING LNns") FOR SPIKE SAWU ANALYSIS - F..- v r m # * a
Aluainuan Antimony Arsenic Barium Se ry 11 ium Cadsium Calciurc
Coba 1 t Copper I ron Lead Xagncsfum Xirnganes e Mercury Nickel ,Do cas s i u n Selenitup Silver Sodium Thallium Vanad i*m 2 inc Cyanide
-. Chtociun
2 000 so0
- 2,000 2 * 000
so so
2 90 so0 2 so
1.000 500
so0
500
2,000 so
2.000 so0 500
so0 2 * 000 2 * 000
so so
200 300 250
so0
500
500
2.000 so
2,000 S O 0 500
* '
100 .
5
20
10
so
100 . 60
S
20
1
10
so
1oc . NOTE: Elements without spike levels and not designated w i t h an asrerisk, must be spiked at appropriate levels.
'The levels shoLn indicate concentrations in the final digestate of the spiked sample (200 01 final volwt).
'Spiking level reported is for both vacer and soil/sediment matrices. t No s?ike required.
E- 10 - ._-
716 i

, ..
\ ANALYSES WITHIN
CALLBRATION RANGE
A p p e n d i x F
. DILUTE SAMPLE NO
7 AND SPIKE J I
SAMPLE ABSORBANCE SPIKE RECOVERY . GREATER THAN 50% . No CREATERTHAN
. OF SPIKE ( S A N D . ABSORBANCE.. LESS THAN 11%
NO
, ,YES
SPIKE RECOVERY
LESS THAN 115% C Z E A T E ~ THAN (2% AND
YES QUA h' 1 I T .i i E
C A L I 6 R A T 1 3 ' ~ .

1 6 0 1
fab Nape: Contract No.: 68-01-
Lnb Code: Case No.: SAS No.:
Rill Sample Analysis Price in Contract: $
- -
SDG No./First Sample in SDC: Sample Receipt Date: (Lowest EPA Sample Number (rn/DD/YY) in first shipment of samples received under SDG)
Last Sample in SDG: Sample Receipt Date: (Highest EPA Sample Number ( m/ W Y Y 1 in last shipment of
samples received under SDG)
EPA Sample Numbers in the SDG (listed in alphanumeric order):
1
2
3
L
5
6
7
8
9
10
11
12
13
14
15
16
17
18
19
20
Note: There are a maximum of 20 f i e l d samples i n an SDG.
_- - Attach Traffic Reports to this form i n alphanumeric order
( i . e . , the order listed on this form). ~ ~ O ~ I - ~
Sample Custodian Da tc

. . r . 1
Appendix H r 1 6 0 1
SUGGJSTED INSIXUMEHT RUN SEQUENCES (sOW787)
'Ihe following suggested run sequences are based upon a 20 sample S f f i (Sample Delivery Group). The example Sample IDS and respective concentmiom are listed below. Alto note the abbreviations key supplied for raw data. - MZZ00I
Mzz002
MZZ003
MZZ004
MZZOOS
MZZ006
MZZ007
MZZ008
MZZ009
MZZO I O .
MZZOl1
MZZOl2
MZZO 13
MZZO14
MZZO 15
MfZO16
MZZO I 7
MZZOl8
MZZ019
MZZOZO
ILW
ILW
ILW
ILW
ILW
I M W
I M W
IMW
I M W
IMW
ILS
ILS
ILS
ILS
ILS
IMS
IMS
IMS
JMS
IMS
Abbreviations Key
ILW - Inorganic Low Water
IMW = Inorganic Medium Water
ILS - inorganic Low Soil
IMS - Inorganic Medium Soil
XXXXXX = Sample
XXXXXXD = Duplicate
XXXXXXS = Matrix Spike (Predigest./Predktill)
XXXXXXL = Serial Dilution
XXXXXXA = Analytical Spike (Postdigest./Postdktill)
I

ICP (Duplicate Exposures Required)
1) Blank
2) Stdl
3) Std2
4) 1Cva
5 ) I C B ~
7) ICSAB~
8) CRIF
6) ICSAb
9 ) PB1 (ILW)
IO) PB2 (IMW)
11) PB3 (U)
12) PB4 (IMS)
13) LCSW
14) Lcss
IS) MZZ001
16) CCVIa
17) CCBla
18) MZZOOlD
19) M22001S
20) MZZ002
21) MZZ003
22) MZZ004
23) MZZOOS
24) MZZOOSL
25) MZZOO6
26) MZZ006D
27) MZZ006S
28) CCV2a
29) CCB2a
30) MZZ007
* 31) -MZZ008
32) MZZ009
33) MZZO10
34) MZZOIOL
35) MZZO11
36) MZZOIID
37) MZZOllS
38) MZZO12
39) MZZO13
40) CCV3a
41) CCB3a
42) MZZO14
43) MZZO15
44) MZZOlSL
45) MZZO16
MZZO 16D
MZZO 16s
MZZO 1 7
MzZO18
MZZO 19
MZZ0020
CCV4a
CCB4a
MZZO2OL
ICSAb
I C S A B ~
CRIF
C C n a
CCBSa
a An lCV/CCV and ICB/CCB must be performed at 10% frequency or every 2 hours, whichever is more frequent.
b me initial and final analyses of the ICSA and ICSAB solutions must be performed within 8 hours of each other.
-
c The.initial and final analyses of the CRI standards must be performed within 8 hours of each other.
2

Blank
Std 1
Std2
Std3 (CRA)
ICV
ICB
PBI (ILW)
PBlA (ILW)
PB2 (IMW)
PB2A (IMW)
PB3 (ILS)
PB3A (I=)
PB4 (IMS)
PB4A (IMS)
L a w
LCSWA
ccv 1
CCB I
LCSS
LCSSA
MZZOOI
MZZOO I A
MZZOOID
MZZOOI DA
MZZOOIS
MZZOOISA
O” ’ 5601
FURNACE A A (Duplicate Io jectioo Required)
MZZ002
MZZOO2A
c c v 2
CCB2
MZZ003
MZZ003A
MZZ004
MZZ004A
MZZOOS
MZZOO SA
MZZOO6
MZZ006A
MZZ006D
MZZ006DA
c c v 3
CCB3
MZZ006S
MZZ006SA
MZZOO7
MZZ007A
MZZ008
MZZ008A
MZZOO9
MZZ009A
MZZO IO
MZ2010A
53) ccv4 79) MZZ017
54) CCB4 80) MZZO17A
55) MZZOl1 81) MZZ0018
Sa) MZZOIIA 82) MZZO18A
57) MZZOIID 83) MZZO19
58) MZZOIIDA 84) MZZ019A
MZZO 1 1 S
MZZOI ISA
MZZO 12
MZZO 12A
MZZO 13
MZZO 1 3A
c c v 5
CCBS
MZZO 14
MZZ014A
MZZO 1 5
MZZO 1 SA
MZZO I6
MZZ016A
MZZO 16D
MZZO 16DA
MZZ016S
MZZO 16SA
CCV6
CCB6
85) MZZO2O
86) MZZOZOA
87) MZZOOl+O*
88) MZZOO1+10*
89) MZZOO I +20*
90) MZZOO 1 +30*
91) CCV7
92) CCB7
%SA single injection

I. I .
I) Blank
2) Stdl
3) Std2
4) Std3 (CRA)
5 ) ICV
6) ICB
7) PBI (ILW)
8) PB2 (ILW)
9) PB3 (ILS)
JO) PB4 (IMS)
1 1 ) LCSW
12) L c s s
13) MZZOOI
14) MZZOOID
IS) MZZOOIS
16) MZZOO2
17) CCVl
18) CCBI
19) MZZOO3
22) MZZ006
23) MZZ006D
24) M Z Z ~ ~ ~ S
25) MZZO7
FLAME (Single Exposure Required)
26) MU008
27) MZZ009
28) MZZOIO
29) CCV2
30) CCB2
31) MZZOII
32) MZZOIID
33) MZZOIIS
34) MZZOJZ
35) MZZOJ3
36) MZZO14
37) MZZOlS
38) MZZOJ6
39) MZZO16D
40) MZZO16S
41) CCV3
42) CCB3
43) MZZO17
44) MZZOl8
45) MU019
46) MZZO2O
47) ccv4 48) CCB4 _-
(Pool%? 4

S

CONTRA= COMPLIANCE SCREENING c’
INORGANIC DEFECT STATEMENIS LISTING
Prepared for
I Analytical Operations Branch -
Hazardous Site Erduation Didsion
US EPA Office’of Emergency and Remedial Response
Vtrr 4 Company
under
Contract No. 68-01-7235
Dnft Version Januaq 1989

Conttnft
CCS Error StatementJ for F o m 1 through 14
General an'd Header Criteria for all F o m
Criterion A. - Cover Page.
Criterion B. - Form 1
Criterion CA. - Form 2A
Criterion CB. - Form 2B
Criterion D. - Form 3
Criterion E. - Form 4
Criterion FA. - Form'5A
Criterion FB. - Form 5B
Criterion G. - Form 6
Criterion H. - Form 7 '
Criterion I. - Form 8
Criterion J. - Form 9
Criteria KA and KB. - Form 1 and Form 14
Criterion L. - Form 10
Criterion M. - Form I 1
Criterion N. - Form 1, Form 12, and Form 14
Criterion R. - Form 13
Criterion R. - Form 14
3) '9801 4
5
6
7
8
9
10
11
12
13
14'
Criterion R. - Raw Data
Criterion T. - Traffic Reports
2
15
16
17
18
19
20
-21
22
23
24

The error statements and SOW references described in thh document arc used for'all notification of defects identiCied during CCS screening. Each statement k smctured as follows:
Square brackets ( ] enclose the iist of possible i t em that may be associated with part of a defect statement E.g., (tlope/y-intercept/oonelation cafficient/x-intercept (concentration)] [&/are] mksing. Only applicabte items should be included for the report statement.
notification of noncompliance is based. Parentheses ( ) enclose the page reference to the Statement of Work on which
( ) enclose the element with which the defect is associated. For example, statement R14:
( ) MSA (data/slope/y-intercept] [is/=] missing. (E14-17). could be reported as Pb MSA slope is missing. (E14-17).
The following pages fist the enor statements to be used for each type of defect, organized by the CCS criterion under which they should be reported. Note that the compliance of sample- associated blanks, spikes, and duplicates is partially assessed on the basis of their own associated QC criteria.
c
3

1. [Contirct N 0 . W Code/cW No./SAS Na/SDG NO.) h/tn -8 hcosrect on Form . (B12). 1 6 0 1 2 Lab code incorrect on Form . (B12).
3. [Case No./SAS No.] L hconoiPtent on Forms 4. EPA forma! L not followed for Form . (A4).
5. Form tuff= not correctly increment4 for records corresponding to Form
. (B13).
. (HS).
4

Cdtedon A. Lavet rage. 4
1. 2 3. 4.
5. 6.
7.
8.
SOW No. is missing or incomCt (B14). EPA Sample No. it [nking/iLICorrect/not in dphsnumeric order& (B14). &' [Question one/Question two] is not uuwcred (B14). Question Three it (answered incorrectly/not left btank] (B14). Lab manager's signat- it not present. (Bl4). Spike suffu (S) i s [mitcing/assoc2ited with an incorrect sample]. (B14). Duplicate suffm (D) is [missing/asso&atcd with an incorrect sample]. (B14). Cover page K missing. (B14).
-
6 Q 1 **B**
*'Be*

Crlterioo
1. , 2
3. 4. 5. 6. 7.
8.
9.
B. F o ~ 1.
EPA Sample No. (m.kshg/incornct). @IS).
Lab Sample ID. it i n c o d n t with the cover page. (B14).
Level is (missing/incomct). (B12).
Date received is (a&sing/inwnsistent with the traffic report). @IS).
* 7601 Matfir is (lnissinglincomct). (BIS).
% Sotids is ( m S n g / i n c o ~ o t with the raw data). (BIS). Concentration units m (&ing/inconsistent with the Sample Matrix)- (BIS). [Color/cwity @eforr /~~rytcxnue /a fac~] arc (improperly entered/missing]. (B 16). ( } Concentration 'a [missing/iiwmhent with the raw data). @IS).
data). (B15). 10. ( ) Concentration flag in Form I column C is [ missingfincons'ktent with the raw
1 1. ( ) Form I 12. ( ) Form I .IW qualifier is (rnis~ing/inconect). (B15). 13. ( ) Reported amcentntion it not to the required significant figures. 015).
14. ( ) Concentration is not corrected for % solids. (BS). 15. Form I d g . (BS).
qualifier k [m&sing/inconect]. @lS, C1, D48, D69).
6

1.
2. 3.
4.
5.
6.
7.
8.
9.
Continuing calibration source h d&g- (B16.17). ( ~ t $ t calibration trub value is [mit.inn/inadtent with the mora W 7 ) . ( ) Initial calibration found value is [miaing/inconsktent with the source value).
. 7 6 Q 1 -
( ~ 1 7 ) . Initial calibration %R it (&ing/incorrect/not reported to one decimat plaa). (B17). ( ) Continuing calibration true value is (missing/inconsittent with the source value). (B 17). ( ) Continuing calibration found value it [missing/inconect/not reported to two decimal places). (B17). ( ) Continuing calibration %R 3 [missing/incomct/not reported to one decimal place]. (B18). ( ) M column method b (miSring/iicom~t). (B18).
10. ( ) (Initial calibration/conhuhg calibration] %R k outside the specified control
11. The same continuing calibration standard was not used throughout for ( ). (€5). limits. (€5).
12. Form 2A is missing. (BS).
7

3. ( ) CRDL standard source for (AA/ICP) h [mhhg/not 8t the m L / n o t rpll at two times the IDL when IDL is greater than the CRDL/not run 8t two times h CRDL when the CRDL is greater than the IDL). (B18.U).
4. ( ) CRDL standard (0 analyzed in the middle of the run is [not reported/not reported in the Final Found section of the Form). (B19).
5. ( ) [CRX/CRA) is missing when more than one wavelength h used. (Bl9). 6. ( ) CRDL standard for AA true value is not reported to one decimal place. (B18). 7. ( ) CRDL standard for AA found value is not reported to two decimal pIaces. (B18). 8. ( ) CRDL standard for ICP [initial foundlfd found] h not reported to two
decimal places. (B19). 9. ( ) %R for [AA/IcP]$ [mking/incorrect/not reported to one decimal place.
IO. Form 2B it missing. (BS).
.
(B 18.19).
8

b -. Crltcrlon LI. rorm J.
t
- g 2'601 1. Prepantion blank matrix b [mbing/reported incorrectly& (B19). 2. Reparation coaccnmtion units are [a&sing/inmarbtent with the matrix); . 19). 3. ( ) [initial calibration bhk/aqueous preparation blanlr/continuhg calibration blank]
is [missing/hconsbtent with the raw data/not in og/L/not reported to one decimal Place). ( B m
4. ( rbsolote value of [iniU/continuhgJ catibmtion blank exceeds the (mL/CRDL). ( W C I 1.
5. ( ) column C qualifier is [missing/incomct]. (B20). 6. ( ) M qualifier i s [m;Stins/iocOmct). (B20).
7. ( ) Sample value is below 10 times CRDL and is reported incorrectly because the preparation blank vaiue it below the negative CRDL. (E7).
8. ( ) Sample value h lets than 10 times the prepadon blank value and the preparation blank value exceeds the CRDL. 0.
9. Form 3 is W g . (BS).
*
.
9

1.
2.
3. 4.
5.
6.
7 .
8.
ICP ID No. i s missing. 0). ( ) m e d u e s for [solution A/solution AB] u e [miainn/bco¬ reported to the nearest whole number). (B21). ICs SO- ID (or Lot number) is &ig. (B21).
( ) (Iaitial/final found] (SoI/A/SoL AB] values are [mkshg/hconthtent with the raw data/not reported to the nearest whole number for solution A/not reported to one decimal place for solution ABI. (B21). ( ) (Negative/ztro] found d u e for [solution A/solution AB] i s [missing/incorrect/inconsistent with the raw data). (a2l). ( ) Found valuu for (solution A/solution AB] are mkshg for the wavelength used. (B21). ( ) %R is [missing/incorrect/not reported to one decimal place] for (initial found value/final found value). (B21). Form 4 is missing. (B6).
- w 2 '601
10
000128
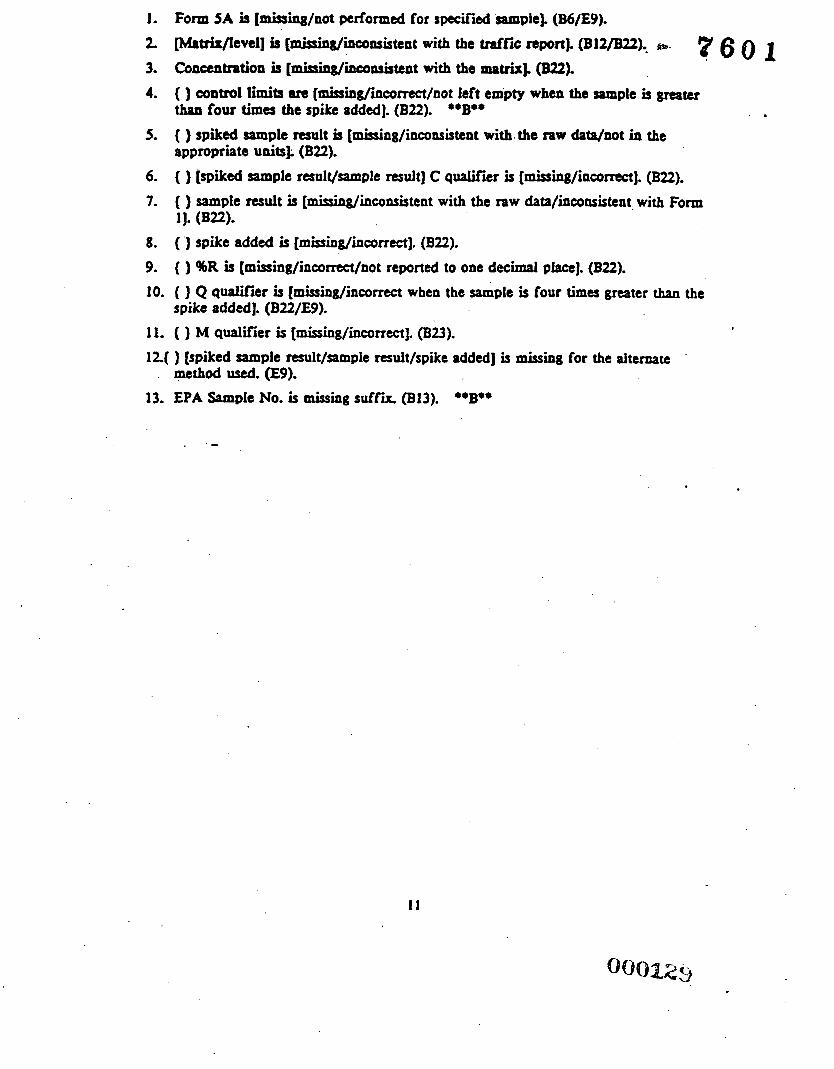
1. Fonn SA is [&sihg/not performed for specified sample). (B6/E9). 2 ~tr ix / leve l ] i s [miainn/inconsistcnt with the traffic reportE (B12/B22), ,w-
3. Cancentration is [missiq/inconsjstent with the matrix). (B22). 4. ( ) control Emits are (hing/inconect/aot left empty when the sample b greater
than four times the spike added]. (822).
5. [ ) spiked sample result is [mitsing/inconsisteot with the raw data/not in the appropriate units). (B22).
6. ( ) [spiked sample result/siitmple result] C qualirk is (&ing/incomct). (B22).
7. ( ) sample result iS [missing/hconsistent with the raw data/inconsistcnt\ with Form 11. (B22).
8. ( ) spike added is (mhshg/inconect). (B22). 9. ( ) %R is [mking/incomct/not reported to one decimal plaa]. (B22).
7 6 0 1
*OB**
10. ( ) Q qualifer is (missing/jnconect when the sample is four times greater than the
11. ( ) M qualifier is (misting/hconectJ. 023). spike added]. (B22/E9).
0
lZ( ) [spiked sample result/sampIe rcsuit/spike added] is missing for the alternate
13. EPA Sample No. k missing suffs (B13).
method d. (E9). *OB**

1. Form 5B it mlaing. (B6). *OB**
2. ~trix/Level) is (tnissing/inconsistent with the traffic report). (SUDU). **Boo
3. ( ) [control limit/%R/Q field] P reported when it should be bfonlc (B23). **B*F’ 4. [ ) Sample d t k (mbhg/mcoatktent with Form l/not rWuired/nOt reported to
two decimal places/not in ug/LJ. (823). **Bo*
6 0 1
5. ( ) spiked sample result i s [missing/incontittent with the raw dawnot reported to two decimal placdnot reported in og/L]. (Sa). **B**
6. { ) spikt rdded is (missing except for Ag/inconect/aot reported in ug/L/not reported to one decimal plact/not added at the greater of two times CRDL or twice the sample value). (B23/E9). *OB**
7. ( ) %R is (&ing/incorrect/not calculated to one decimal placdnot reponed when negative/not reported when zero]. (B23). **Bo*
8. ( ) Q qoalifier is not left bhak. (B23). .*Bo*
9. ( ) M qualiler k (missing/inconect]. (B24). *OB**
10. EPA Sample No. is missing an A suffix. (B8). **BO*
12

1.
5.
6.
Conantration units are [missing /inconsistent with the matrix]. (B24). EPA Sample No is milaing the D suffix. (B13).
( ) control limit it [&me incorrect/not corrected for original sample weighvnot corrected for 96 tolidsjnot left empty when sample or duplicate i s greater than five times CRDL). (B2437,Ell). **Bo*
7. ( ) sample value is [&ing/hconsktent with Form l/inconsistent with the raw data]. (B24).
8. { ) Duplicate value is [&ing/hconsistent with the raw data), (B24). 9. [C,M] q&ier b [&ing/hcorrtct]. (B24.25). 10. { ) Q qualifier is [mistmg/incorrect]. (B24.25). 11. { ) RPD iS fa&shg/~namcct/not reported to one decimal place). (B24.25).
**B**

- - - 2. [Solid/Aqueou] LCS Source ID (or Lot number) it (B25).
3. ( ) [Aqueous/Solid] true value k [misJing/hcomct]. (B25). W L 76 .01 4. ( ) Aqueous found value i s [&ing/hconsktent with the mw data/not reported to
two decimal placesJ. @25,26/E12). 5. ( ) Solid found value k [rnissing/outside the control limib/inconsktent with the raw
data/not reported to one decimal place]. (B25,26/E12). 6. ( ) Aqueous %R is [mhsing/inconect/not reported to one decimal place/outside
control limits]. (B25.26). 7. ( ) Solid %R is [misshg/incorrect/not reported to one decimal place]. (B25.26).
**B**
8. ( ) C qualifier is (missing/incorrect]. (BZS).
14

\
2
,3.
. 4.
5. 6.
7. 8. 9.
760l 1. Form 8 is W g . (B6L P A Sample No./Amlyte/dilution factor] i s [&ing/not in rlpbapumcrk order/incorrect/inconsbtent With the &data). (826). \ Added [concentration/absorbana?] h (&hg/inconsktent with the raw &&E (B26.27). Final concentration is (mising/hcoasistent with the matrix/inconsistent with the raw data] for €PA Sample No. (827). MSA was hconectly done on the Lcs, (E14).
Fiial concentration is [missing/not reported to one decimal/not reponed as an absolute value/is not reported as less than the IDL) for EPA Sample No. (B27). R value is [mksinglnot consistent with the raw data] for EPA Sample No. (B27). M A was no& reported as required (E14-17) for €PA No. Q qualifier is [mking/incorrect). (E14- 17).
\
c

. 1.
2 3. 4.
5.
6. 7.
8.
Form 9 milning. (B6). ~tr ix /IAvel ] is (dsshg /inconsistent with the baffic report& (BZ).. pb
( ) Initial sample result is (missing/inconsistent with Form 1].@28). Lv 6 0
’** -
( ) serial dilution result b [&ing/hconsistent with the raw data/not multiplied by 51. (B28). ( ) % difference is (misSing/incomct]. 028).
( ) [Initial Sample/SerhI dilution] result C qualifier is (missing/iaconect]. (B28). { ) Q qualifier is (missing/incorrectk (B29).
( ) M qualifier is [mhing/incomctk (B29). .*B**
16

17

Criterion L. Form 10.
1. Form 10 is missing. (B6). 2. Date k missing. 330). 3. (ICP/Ffame/Furnaa] ID Number is missing. (B30). 4. ( ) Wavelength is (misshg/not reported to two decimal places). (B30).
T.60 li
5. 6. 7. 8. Instrument ( ) IDLS were determined more than three months before the
9.
( } Background code is [mitSiOg/inc~nect]. (B30). ( ) IDL is [missing/not reported to one decimal place). (BU)).
( ) M qualirer is [misshg/iOcomct]. (B30).
date of analysh. (Ef4). Sample values arc invalid because the IDL exceeds the CRDL and reported values are less than 5x IDL. (A2).
18 0 0 01 3. G

1. Form 11 is (missing/not reported as required]. (B6). 2 Date is missing. (B30). 3. ICP IDNO. iS mining. (B31). 7 3'601 4.
5.
6. Instrument ( ) correction factor(s) [was/were] determined more than one
( ) Wavelength is (missing/aot reported to two decimal places). (B31). (Al/Ca/Fe/Mg) correction factor is (rnissing/not reported when [zero/aegative]. (B31).
year from date of analysis. (E16).
19

Lnrcnom N. perm a, r a m AL, anu rucm A*.
1.
3. Data is [rnhhg/hranct]. (B32). 4. ( ) Integration time [&hg/not h seconds/greater thaa five spacesl. (B32). 3. ( ) Concentration is [&ing/not in og/L]. (832). 6. ( ) M qualifier is (reported improperiy/missing (NR)]. (B32).
Form 12 i0 missin& (B32).
2. ICP ID No. i s missing. (BE). 7 6 0 1
7. Instrument ( ) hear rang&) [was/were] determined more than three months
8.
before the date of analysis. (€16). ( ) Concentration reported on Form 1 was obtained from a value exceeding the (linear/calibation] range. (A3, BU).
20 000138
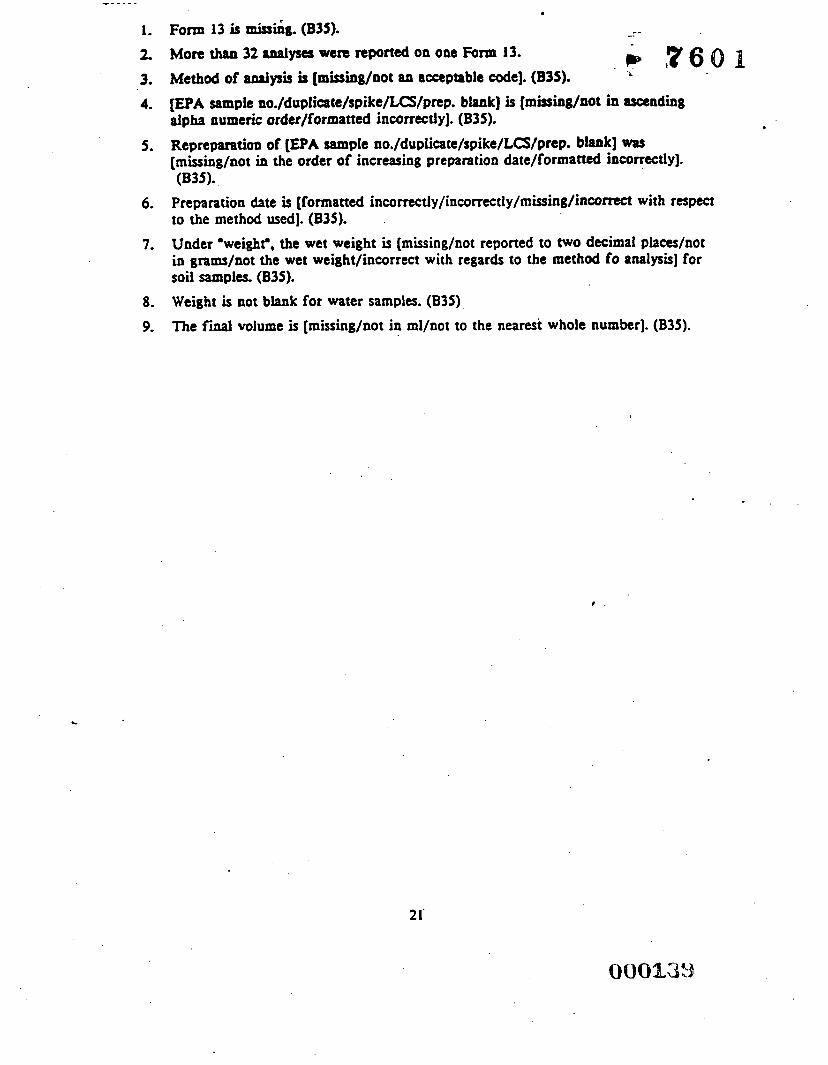
- -_ - -
I. z 3. 4.
5.
6.
7 .
8. 9.
-- Form 1 3 i s miss&. (B3S). e
6 X S - 0 P More than 32 analyses were reported on one Form 13. Method of 8.m.lytiS h (misshg/not an acceptable code). (B35). 'L
[EPA sample no./duplicate/spike//p~p. blank] is [mhshg/not in asanding alpha numeric order/formatted incorrectly). (B35). Repreparation of. (EPA sampIe no./duplicate/rpike/LCS/prep. blank) was [missing/not in the order of increasing preparation date/formatted incorrectly]. (B35). .
Preparation date is [formatted incomctly/inconectly/mi#ing/incomct with respect to the method used]. (B35). Under 'weighr, the wet weight is [missing/not reported to two decimal places/not in grarns/not the wet weight/incorrect with regards to the method fo analysK] for soil samples. (B35). Weight is not blank for water samples. (B35) The final volume is [mitsing/not in ml/not to the nearest whole number]. (B35).
21

1.
2
3. 4.
5.
6.
7.
8.
9.
'fhe following [field sample/QC sample (Le. the calibration standards, ICVs, CCVs,
digestion spikes, post digdon spikes, analytical spikes) MSA addition], associated . with the SDG, (wat/wtn) not reported for the following (Adytes/Method] on Form 14. (B36). More than 32 analpit wen reported on one Form 14. (B36).
I ~ S , CCBS, CRAs, CRh, I-, L W , LCSS, PBs, duplicate, Serial dilution~, pm-.
P= 2 6 0 1 -i -
Instrument ID number it [missing/greater than 12 spaces/not uniquely identifying the instrument used to produce the data]. (B36). Method code is [mhsing/greater than two characters]. (B36). ["Start Date"fEnd Date"@ [missing/formatted incorrectly/not when the analysis was [done/ended]. (B36). Sample No. is not [formatted properly/in temporal order]. (B36). Dilution factor is [&hg/not to two decimal places/incorrcctly including the inherent preparation dilution). (B37). Time is [not in the correct format/m&ing]. (B7) (B37).
10. Percent recovery for the furnace analytical spike(s) [is/are] [mking/incorrect]. (B37).
1 1 . Data missing for ( ). (B37). 12. Instrument calibration is not [performed/performed with proper number of
standards] for ( ). (E3). 13. Instrument calibration was not performed within 24 hours of analysis for ( ). (E3). 14. The two hour calibration time limit for is violated for ( ). (U). 15. The 10% calibration frequency is violated for ( ). (ES, E6, E14, E15). 16. [ICS/CRI) [-/were] not analyzed twice within the 8 hour working shift for ( ).
17. The MSA tree was not followed correctly for ( ). (E14). ( E 6 m.
. 18. [ICS/CRI/Icv] waf not performed after calibration for ( ). (E6). 19. [ICB/CCB) was not performed after [ICV/CCV] for ( ). (E6). 20. [lCS/CRI/Ccv] was not performed at the end of the run for ( ). (E6). 21. Preparation blank analytical spike recovery is out of SOW specified range for ( ).
(E17). 22. Sample was not run initially undiluted for ( ). (A3).
23. Serial dilution was not performed at Sx dilution for ( ). (E12).
2 2 .

Criterion R. Raw Data . *' . V 6 4 1 1. [ I C P / F u ~ ~ e / € i g / C N l n w data an missing. (87).
2 SDG package is not numbered sequentially. (B4). 3. ( ) Raw data is [ilIegible/deleted but not tigned/unclearJ. (B7). 4. SDG package not submitted with singte-sided pages. (B3). 5. 6. 7.
8. 9.
SDG package forms an not in increasing EPA sample alphanumeric order. (BS). ( ) Instrument readouts as strip chatts/tapes/or hard copies are necettary. (B6). ( ) Raw data are submitted out of order. (B6). ( ) Raw data are not labelled with (EPA sample number appropriate codes). (B7). ( ) Data for (calibration [standards/source/solution preparation date/blanks]/sample [volume/weight/duplicate/spikes/serial diIution/analytical spike/%R/CV/)/instrument uted/background correction used/] are missing. (B7 ).
10. ( ) MSA [data/slope/y-intercept] [is/are] missing. (E14-17). 11. ( ) Integration times are missing for AA analyses. (B7). 12. Digestion lo&) [is missing[sample/preparation blank/LCS/date/volume/weight
used). (B9). 13. Aqueous pH iS [less than Z/greater than 12/mking). (B9). 14. ( ) Value is not reported uncorrected in the raw data. (A3).
15. Duplicate exposures are missing for ICP. (Dl). 16. ( ) Furnace element did not have double injections (except M A ) . (E14). 17. [ICP/Furnace/name/HG/CN] standard curve is incomplete. (E4).
18. [ICP/Furnace/Rame/HG/CN] standard at tho CRDL is missing for ( ). (€4). . 19. EPA specified [ICP/Furnace/Fiame/Hg/CN] method was not used for ( ). (At).
20. Furnace spike was added incorrectly for ( ). (E10). 21. Percent solids data are [missing/incorrect]. (B15, El 1). 22. The MSA tree was not followed correctly for ( ). (E14). 23. Post digest spiking volume exceeded 10% of the sample volume. (E16). 24. Standardization solution concentrations are missing. (B7). 25. Instrument was not calibrated (daily/when it was set-up]. (E3).
23

2. SDG Group No. it [missing/hpmperly assigned) on traffic report (B4).
[Lab manager*$ signaturelreceipt date/sample condition on receipt] is missing on the traffic report. (B4). [Matrix spike/dupiicate/serial dilution] was run on a field blank. (E9Jl912).
3. SDG firnal sample is missing on traffic report (Bb). -(s % - X.6 0 P - - 4.
5.
24

APPENDIX C
Completed Data Validation Reports

FIGURE 6 1 6 0 1
DO0 SUMMARY FORM
8ITt C I A
OOO DEMONSTRATTON L O U T W
. SITE I N F O R M A M
$6,000

November 16, 1988
Dennis Gaqne . Regional Sample Control Custodian U.S. Environmental Protection Agency 90 Canal Street Boston, Massachusetts 02114
Re: TID No. 01-8809-15 Case 9164, SDG235 XYZ Laboratories ABC Site, Lexington, MA Metals: lO/aqueous
Dear Mr. Gagne:
A validation was performed on the inorganic analytical data from 10 aqueous samples collected by LMO at the ABC site. The data were evaluated based on the following parameters:
* 0 data completeness * 0 holding times
0 . calibration verification 0- laboratory and field blank analyses 0: ICP interference check sample results 0- matrix spike recoveries
* 0 laboratory and field duplicates 0. laboratory control sample results 02 furnace atomic absorption results
* 0 serial dilution results * 0 - detection limit results * 0 sample results
All criteria were met for this parameter.
Table I summarizes the validation recommendations which were based on the followins information:

Mr. Dennis Gagne Page 2
7601.
November 16, 1988
Calibration Verification
The 2xCRDL standard for Cadmium had a recovery of 65%. Results near the CRDL may be biased low. Estimate (J) positive results less than 3xCRDL and non-detected results (UJ).
Blanks
Element Maximum Conc./Units Action Level Antimony 53.4 ug/l 267 ug/l Copper 12.1 ug/l 60.5 ug/ l 2 inc 6.0 ug/l 30 ug/l
Value > IDL and c Action Level = Report value U Value > IDL and > Action Level = Report.value unqualified
ICP Interference Check Sample
Positive results were observed f o r Antimony in I C s A solution although there is no Antimony present in the solution. The positive results may be due to an interference from Iron. significant levels of Iron are present in the samples. It is recommended to estimate all positive results for Antimony.
Matrix SDike Recoveries
TR%s MAE2 3 6 MAE236
Analvte Silver Lead
Percent Recoverv 72 60
Positive and non-detected results shall be estimated for both Silver and Lead.
Laboratorv Duplicates
Laboratory duplicates did not meet required criteria for Copper. Estimate (J) positive results only.
Post-diaestion S D i k e s
The following samples analyzed by graphite furnace had low post digestion spike recoveries:

Mr. Dennis Gagne Page 3
p. 7601
November 16, 1988
Element SamDles Affected
Selenium Lead Thallium
MAE237, MAE247 MAE2 4 6 All except MAE240 and MAE247
All affected samples are non-detected and shall be estimated (UJ)
s e r i a l Dilution Analysis
Serial dilution results did not meet required criteria f o r Calcium. Estimate (J) all positive results.
No other problems were encountered with this case. e
Very truly yours,
ROY F. WESTON, INC.
Karol-Anne 0 Leary Data Reviewer
Joseph D. Mastone Team Manager ESAT Region I
KAO/kao En1 osures cc. D. Szaro

ABC Site Name Case 9164
Table I. Recommendation Summary
Aluminum
Antimony A'
Arsenic
Barium
Berylium
Cadmium J'
Calcium Js
Chromium
Cobalt
Copper A', J3
-
Magnesium
Manganese
Mercury
Nickel
. Potassium
Se 1 en ium
Silver J2
Sodium
Thall ium J'
Vanadium
2 inc A' Iron
Lead J* Cyanide
A' - Accept data, raise the sample detection limit(s) due to blank contamination.
J' - Estimate (UJ) non-detetced results due to poor linearity near the CRDL. Detection limit is biased low.
J2 - Estimate (J) positive values and detection limits (UJ) due to low matrix spike recoveries. These estimated results would be minimum values.
J 3 - Estimate (J) all positive values due to poor duplicate
precision.
J' - Estimate (UJ) non-detected results due to low matrix spike recoveries fo r Se (MAE237 and MAE247), and T1 (all except MAE240 and MAE247).
Js - Estimate (J) positive results due to a supression Estimated observed through the serial dilution analysis. results represent minimum values. 000148

m 0 m 0 m n ! 0 o m ~ 0 ~ 0 0 Nyo, 0 - 0 Y I N , 0 0 ' 8 0
In m YI
o o o o m m o o o e - 0 o r N N 0
In
0 m 1 6 0 1
I
: : 3 : : :
.-. N
0 ' ) 0
: 8 ? : : : 2-8
I
d
E .
I . I 7
.. W c
8 -
P . i Y . e

REGION I Data Review Worksheets
Site Name ABC SLte Reference Number 01-8809-15
REGION I REVIEW OF INORGANIC CONTRACT LABORATORY DATA PACKAGE
The hardcopied (laboratory name) xyz LrzbU&Ub&&55 data package received at Region I has been reviewed and the quality assurance and performance data summarized. The data review included:
Case No. 9164 SAS No. Sampling Date(s) 0 3 / ? 4 / b 5 - 0 3 / 1 7 / 8 8 SDG. No. MAE235 Matrix A Q U ~ O U A Shipping Date ( s ) 031 18/88 No. of Samples 10 Date Rec'd by Lab 03/19/88
Traffic Report NOS:
Trip Blank No.: Equipment Blank No.: Field Dup Nos:
MAE235 - U A E Z I O , MAE245 - MAE247, MAE258
sow NO. 7/87 requires that specific'analytical work be done and that associated reports be provided by the laboratory to the Regions, EMSL- LV, and SMO. The general criteria used to determine the performance were based on an examination of:
-Data Completeness -Field Duplicates -Holding Times -Calibrations -Furnace AA Results -Blanks -ICP Serial Dilution Results -1CP Interference Check Results -Matrix Spike Recoveries -Sample Quantitation -Laboratory Duplicates
-Lab Control Sample Results
-Detection Limit Results
Overall Comments: The data packaqe w r ~ 4 cumpee& and ,the c o p i e s wene oA quod @UZLi . tU.
De-finitions and Qualifiers:
A - Acceptable data. J - Approximate data due to quality control criteria. R - Reject data due to quality control criteria. u - Analyte not detected.
Reviewer: Kame-Anne 0' Leanu Date: I I / I 5 / 8 8

REGION I Data Review Worksheets * 7 6 0 1
11. HOLDING TIMES complete t a b l e for a l l samples and circle t h e f r a c t i o n s which are n o t wi th in c r i t e r i a .
I I PH i ACTION I I I I
I HG I DATE
1-1 I I I
I
I
I I
I I
I I I I
I I
I I I
I
I
I
I
1
I I I- I- I-
I I I- I- I- I- I I I I- I- I- I- I I I 1-1- I- I-
I I I - I ,-. I I I 1 I I-I.-~I I
I I
I I
I I
I I
I I I
I I I I
METALS - MERCURY - 28 DAYS FROM SAMPLE COLLECTION CYANIDE - 1 4 DAYS FROM SAMPLE COLLECTION
180 DAYS FROM SAMPLE COLLECTION
ACTION: 1. If ho ld ing times a r e exceeded a l l p o s i t i v e r e s u l t s are
e s t imated (J) and non-detects a r e es t imated ( U J ) .
If ho ld ing times a r e g r o s s l y exceeded, t h e reviewer may determine t h a t non-detects a r e unusable ( R ) .
2 .

K E G I O N I Data Review worksheets c 7601 1x1 A. INSTRUHENT CALIBRATION (Section 1)
1. Recovery Criteria
List the analytes which did not meet the percent recovery (%R) criteria for Initial or Continuing Calibration.
&CTION SAMPLES AFFECTEQ DATE I CV/CCV& ANALYTE 3.B
ACTIONS:
I f any analyte does not meet the %R criteria follow the actions stated below:
For Pos it i v e Results :
Metals 90-llOaR Mercury 80-1201R Cyanide 85-1151R
Estimate f J )
75-89%R, 111-1250R 65-792R, 121-135%R 70-842R, 116-1300R
For Non-detected Results:
Estimate WJ1.
Metals 90-12598 Mercury 80-135SR Cyanide 85-l3O%R
75-89aR 65-798R 70-841R
Reject f R )
$eject f R )
<75%R, >125%R <65%R, >135%R <70%R, >130%R

REGION 1 Data Review Worksheets
111 8 . INSTRUMENT CALIBRATION (Section 2)
z . Analytical Sequence
A .
8.
C.
D.
E.
If No,
The
p+. 1 6 0 1
Did the laboratory se the proper nimber of standards f o r calibration as described in the SOW? Yes or No
Were calibrations performed at t h e beginning of each analysis? Yes o r No
Were calibration standards analyzed at the be- ginning of sample analysis and at a minimum fre- quency of ten percent or every two hours during analysis, whichever is more frequent? Yes or No
Were the correlation coefficients for the Cali- bration curves f o r AA, Hg, and CN 2 0.9953 Yes or No
Was a standard at 2xCRDL analyzed for all ICP analyses? Yes or No
data may be affected. Use professional judgement to determine Discuss +
a.,j actions below and list the samples affected. severity of the effect and qual.ify t h e data accordingly.

760.1 REGION I Data Review Worksheet'
Iv A. BLANX ANALYBIB RESULTS (Sections 1-3)
dist the blank contamination in Sections 1 & 2 below. A separate worksheet should be used f o r soil and water blanks.
1. Laboratory Blanks MATRIX : AqUeOa-4
DATE ICB/CCBg WALYTE CONC. /UNITS
4 / 1 3 / 8 8 I CB
411 3 f 88
4//3/kk
Aqueoud
Auueou
2. Equipment/Trip Blanks
DATE EOUIP BL&
Sb
cu
Zn
5 3 . 4
1 2 . 1
6 . 0
ANALYTE CONC./UNITS
3. Frequency Requirements
A. Was a preparation blank analyzed for each matrix, for every 20 samples and for each digestion batch? @or NO
8. Was a calibration blank nm every 10 samples or every 2 hours whichever is more frequent?
If No,
The data may be affected. Use professional judgement to determine Discuss the severity of the effect and qualify the data accordingly.
any actions below, and list the samples affected.

R E G I O N I Data Review Worksheets 2 9 0 1
I V 8. BLANK ANALYBIS RESULTS (Section 4)
. Blank Actions
The Action Levels for any analyte is equal to five times the highest concentration of that element's contamination in any blank. The action level for samples which have been concentrated or diluted should be multiplied by the concentration/dilution factor. NO positive sample result should be reported unless the concentration of the analyte in the sample exceeds the Action Level (AL). Specific actions are as follows:
1. When the concentration is greater than the IDL, but less than the Action Level, report the sample concentration detected with a u.
2 . When the sample concentration is greater than the Action Level, report the sample concentration unqualified.
MATRIX: AQUW
ELEMENT MAX. C0NC.L UNITS
AL/ UNITS
MATRIX:
ELEMENT MAX. CONC.'/ A 2 UNITS UNITS
. S b . 5 3 . 4 267 uq/L
cu It .? 6Q5 us/L
Zn % 6.0 22A.L U L
NOTE: order to compare them with the sample results.
Blanks analyzed during a soil case must be converted to mg/kg in
Conc. in ug/L X Volume diluted to l200mlI X X l O O O m X a = mg/kg
Yultiplying this result by 5 to arrive at the action level gives a final result in mg/kg which can then be compared to sample results.
Weight digested (lgram ) lOOOml lkg lOOOug

REGION f Data .Review Worksheets
c 7601. v A. ICP INTERFERENCE CHECX SAMPLE (Sections 1 b 2)
. Recovery Criteria
List any elements in the ICs AB solution which did not meet the criteria for %R.
DATE ELEMENT %R ACTION
ACTIONS:
If an element does blow:
not meet
Positive Sample Results Non-detected Sample Results
2. Frequency Requirements
the
SAMPLES AFFECTED
%R criteria , follow the actions stated
R R
PERCENT RECOVERX 50-79% >1209
J UJ
Were Interference QC samples run at the beginning and end of each sample analysis run or a minimum of twice per 8 hour working shift, whichever is more frequent?
3 A
Yes or No
If no,
The data may be affected. Use professional judgement to determine Discuss the severity of the effect and qualify the data accordingly.
any actions below and list the samples affected.
kee acccpXabLe.

REGION I Data Review Worksheets
* 7601
v B. ICP INTERFERENCE CHECX BAMPLE (Section 3)
Report the concentration of any elements detected in the ICS A solution > 2xIDL that should not be present.
ELEMENT
Sb
CONC. DETECTED IN THE ICs
5 0 us/[
Estimate affected affected
SAMPLE AFFECTED
MAE235
'4E2 3 8
MAE240
CONC. OF INTERFERENTS - IN THE ICs
A L CA FE MG 5 0 6 0 0 9 ~ l l d o D D ~
----
the concentration procaced ly the interfering element in all samples. See guidelines for examples. List the samples by interferences below:
ELEMENT SAMPLE ' SAMPLE INTERFERENT ESTIMATED AFFECTED CONC. CONC . INTERF .
(ug/L) AL CA FE MG (ug/L) Sb t o - - ~P2eoO- .A.
4CTIONS :
1. In general, the sample data can be accepted without qualification if the sample concentrations of Al, Ca, Fe, and Mg are less than 50% of their respective levels in the I C s solution.
2 . Estimate (J) positive results for affected elements for samples with levels of interferents 502 or more of that in the ICs solution.
3. Reject (R) positive results if the reported concentration is due entirely to the interfering element.
4 . Estimate (UJ) non-detected results for which false negatives are suspect.
Give explanations for any actions taken below: E s M e (JI P O A ~ V ~ . t ~ l L e b Xok antimanu.

R E G I O N I Data Review Worksheets P= % 6 0 1
VI. XATRIX SPIKE
- A I MAE236
1. Recovery Criteria
List the percent recoveries f o r - - - ' * - & - - - * ' - . -
MATRIX: Aqueoud
oriaryres wnicn d i d not neet the required criteria.
S - amount of spike added SSR - spikes sample result S R - sample result
SR I
Analyte SSR I
S i e V U L Lead
36 ' 4 . 0 u 16 I 4 . 1 I
Matrix Spike Actions apply to all
S %R Action I I
50 20
' 7 2
I I I I I I
samples of the same matrix.
ACTIONS:
1. If the sample concentration exceeds the spike concentration by a factor o f 4 or more, no action is taken.
2 . ~f any analyte does not meet the %R criteria stated below:
follow the actions
PERCENT RECOVERY <30% 30% -7 4 a >125%
' o s i t i v e Sample Results lon-detected Results
J A
J J R UJ
! . Frequency C r i t e r i a
A. Was a matrix spike prepared at the required fre- quency? @,or No Was a post digestion spike analyzed for elements that d i d not meet required c r i t e r i a for matrix spike recovery? @?or NO
B.
eeparate worksheet should be used for each matrix spike pair.

R E Q I O N 1 Data Review Worksheets
7 6 0 l i VII. LABORATORY DUPLICATE8
.ist the concentrations of any analyte not meeting the criteria f o r duplicate precision. For Soil duplicates, calculate the CRDL in mg/kg using the sample weight, volume and percent solids data for the sample. Indicate what criteria was used to evaluate precision by circling either the RPD or CRDL for each element.
.
MATRIX: Aoueou
Flernent CRDt Samble PuDlicate& BPQ Actioq water soil MAE236 MAE236 I
Aluminum 60.5 5 4 . 7 Antimony 3 7 u 37 u
Beryllium I 2.ou
I 4 . 3 u
I 20300
' I
Arsenic - -I- 3 . 0 ~ 3 . 0 ~ Barium
' J8.3
Cadmium I 5 . 0 ~ ' 3 3 4 0 0 3 3 5 0 0 I 4 . 0 ~ I 4 . 0 ~
coba 1 t copper Iron Lead Magnesium
:kel Pot ass ium- Selenium silver Sodium
Vanadium- Zinc Cyanide
I
6 2 . 9
7
I 2 3 . 2
146 I
P r c u r y 0 . 2 u
l- Thallium - 1-10-
Laboratory Duplicate Actions should be applied to all other samples of the same matrix type.
ACTIONS :
1. Estimate (J) pos i t ive results f o r elements which have an RPD >202 for waters and >352 for soils.
2 . If sample results are less than 5 x the CRDL, estimate (J) positive results and (UJ) nondetected results for elements whose absolute difference is XRDX,, (2xCRDL for soils). If both samples are non- detected, the RPD is not calculated (NC).

REGION I Data Review Worksheets
VIXI. FIELD DUPLICATE8 - n o t app&cabte
d lst the concentrations of all analytes in the field duplicate pair. For soil duplicates, calculate the CRDL i n mg/kg using the sample weight, volume and percent solids data for the sample. Indicate what criteria was used to evalute the precision by circling either the RPD or CRDL f o r each element.
MATRIX:
Element SamDle g DuDlicatea IpJ Action CRD& water soil ug/L W k g I
- 1-60- I i I I I 1
i I I I I I I I I - I I I I 1 I I 1 I I I I 1 I I I I I I I I ! !- !
I-
I
I Aluminum-I 200-1 Antimony Arsenic 10- Barium Beryl1 ium- Cadmium Calcium Chromium- Coba 1 t Copper
I-
Iran -- --. I- I-
I I- I
Lead I- 5 I I 5 0 0 0 ; I I Magnesium-
1 I I I- 1 Manganese-l-lS-
I I I- I Y -cury 0.2-1 ! 40- 1 1. .kel I-
Potassium !TOO ,
I I 1 -
----- I I I I 1-1
I- -I I 2yanide I lo-, I
7ield Duplicate Actions should be applied to all other samples of the ;ame matrix type.
ACTIONS :
1. Estimate (J) positive results for f o r waters and >SO% for soils.
elements which have
?. If sample results are less than 5x the CRDL, estimate
an
(J) results and (UJ) nondetected results f o r elements whose difference is >2xCRDL, (4xCRDL for soils). If both samples detected, the RPD is not calculated (NC).
RPD >30%
positive absolute are non-

REGION I Data Review Worksheets
fx. LABORATORY CONTROL SAXPLB - & acccptabte m- w o n Auueous K S
L i s t any u3s recoveries not w i t h i n the 80-120? c r i t e r i a and the samples a f f e c t e d .
DATE ELEMENT ACTfON SAMPLES AFFECTEQ
2 . Solid LCS
L i s t any analytes that were not w i t h i n the control windows s e t by the EPA f o r the s o l i d LCS sample. The 80-120? c r i t e r i a is not used to evaluate sol id LCS r e s u l t s .
ELEMENT LCS CONC. CONTROL WINDOWS ACTIOY SAMPLES AFFECTED
ACTIONS :
&OUEOUS LCS percent R ecovew
<soI zk223 2.WB P o s i t i v e Results R Non-detected Results R
J UJ
J A
SOLID LCS <EPA Control Windows >EPA Control Windows
P o s i t i v e Results J Non-detected Results UJ
3 Frequency Criteria
A. Was an LCS analyzed for every matrix, every digestion b a t c h , and every 2 0 samples?
J A

REGION I Data Review Worksheets
It: A. PURNACB ATOMIC ABElORPTION ANALYBIB
.. Duplicate Precision
Duplicate injections and one-point analytical spikes were per- formed for.all samples: duplicate injections agreed within & 202 0
Duplicate injections and/or spikes were not performed for the following samples/elernents:
-------- Duplicate injections did not agree within 2 202 for samples/ elements :
Digestion Spike Recoveries
Spike recoveries met the 85-115% recovery criteria for all samples.
spike recoveries did not meet the 05-1152 criteria but did not require MSA for the following samples/elements: Se - MAE237. MAE247 Pb M A f 2 4 6 T t - dee ~~IJW~U U C Q U ~ MAE240. MAE247
MSA was used to quantitate analytical results when con- tractuall required. ju Correlation coefficients 20.995, accept results.
Correlation coefficients ~ 0 . 9 9 5 for sample numbers/elements:
Method of Standard Addition (MSA) was not performed as re= quired for samples/elements:
2 . P o s t
--_-----
ACTIONS:
1. Estimate (J) positive results if duplicate injections are outside + 20 Z RSD or CV.
2. If the sample absorbance is <SO% of post digestion spike absorbance the following actions should be applied:
PERCENT RECOVERX <.101 um!A& >llsI
P o s i t i v e Sample Results J or R
3. Estimate (J) sample results if
4. Estimate (J) sample results if
Non-detected Results R J UJ
J A
MSA was required and not performed.
correlation coefficient was <0.995. ,/
I/’ 0002~Z

REGION I Data Reviev Worksheets
XI. INDUCTIVELY COUPLED PLASM ( I C P ) SERIAL DILUTION ANALY818
Serial Dilutions were perfonned f o r each matrix and results of the diluted sample analysis agreed within ten percent of the original undiluted analysis.
Serial Dilutions were not performed f o r the following:
/ Serial Dilutions were performed, but analytical results did not agree within 10% for analyte concentrations greater than sox the IDL before,dilution.
Report all results below that do not meet the required laboratory criteria for ICP serial dilution analysis.
MATRIX: Aoueou
ELEMENT IDL SOXIDL SAMPLE RESULT
SERIAL DI LUTI ON
%D ACTION
I
Barium- 1 8 . 8 i 10 u I i z I 125 u
I I I I I I
I I 1 1 I b i x I 10_29oO
I I 1 I ' m I I I I , I I I ' m I I I
1 I I P-ryllium
I d l I 4050 I 33400 I 41000 I I 22.8 J(+) hiurn-
I Ca 1 c ium- I I Chromium_
I I 24.2 Cobalt-
Xron Lead Magnesium' k l I 4050 I 1980 Manganese' 6 I Nickel- Potassium' 95 I 4750 I ' 1810 1 Silver-
I 1360 I 68000 18900 I Sodium- Vanadium- 2 inc 1 3.0 I 150 I 39.6
I I I I I I I I I I
I 97000 1 I 4 . 9 Copper- 1 1 0 I % I
I l 4 1-1
I N I I I
Actions apply to all samples of the same matrix.
ACTIONS:
1. Estimate (J) positive results if %D >15.

REOION I Data Review Worksheets * '$601
XIf. DETECTION LIMIT RESULTS
Instrument Detection Limits
/ Instrument Detection Limit results were present and found to be less than the Contract Required Detection Limits.
ID- were not included in the data package on Form XI.
IDU were present, but the criteria was not met for the following elements:
2. Reporting Requirements
If No,
Were sample results on Form I the IDL not the CRDL for all analytes?
Were sample results that were analyzed by ICP for Se, T1, As, or Pb at least 5 x IDL. Were sample weights, volumes, and dilutions taken into account when reporting detection limits on Form I.
reported down to @or NO
@or No
@)or NO
The reported results may be inaccurate. Make the necessary changes e , the data summary tables and request that the laboratory resubmit the corrected data

R E G I O N f Data Review Worksheets
X I X f SAMPLE QUANTITADION
1 Sample results fall within the linear range for ICP and within the calibrated range for all other parameters.
Sample results were beyond the linear range/ calibration range of the instrument for the following samples/elements:
In the space below, please show a minimum of one sample calculation per method:
- Magnediwn - Red& ikom inhXhwnent - I . 9 8 4 mg/L = 1980 uglL
L
FURNACE - I n s h e r t t philttoLLt i n ug/L. Phep dado4 = 1
CYANIDS
For soil samples, the following equation may be necessary to convert raw data values (usually reported i n ug/t) to actual sample con- centrations (mg/kg) :
The lab is required to use 1 gram sample (wet weight) to 200 ml.
Wet weight concentration =
digest conc. in ua X 200~14 X 1L X l O O O c r m X l m u =
In addition the sample results are converted to dry weight using the percent solids calculations:
L 1 g m 1000 ml 1kg lO0Oug kg
Wet weiaht conc. X 100 = final concentration, dry weight (mg/kg) %solids

I'
APPENDIX D
Figures

FIGURE 1
Region I Data Validation
Roles and Responsibilities

FIGURE 1 7 6 0 1 MTn URLIDRTION - ROLES RND RESPONSIBILITIES


FIGURE 2
Overview of the Data Review Process

FIGURE 2 1 6 0 1 OVERVIEW OF THE W T G REVIEW PROCESS
V ~
y y Y ,+,

v
I

FIGURE 3
Ino rgan ic Traf f i c Report


i C

FIGURE 4
Chain of Custody Form

v) Y
4 f a w
' I i
I

FIGURE 5
Contract Laboratory Program
Telephone Record Log

. .- I . . . . ... . 7 6 0 1
FIGURE 5
Contract tab oratory Pr Ogt am RECIONAL/LABORATORY COMMUNICATION SYSTEM
Telephone Record Log
Date of Call:
Laboratory Name:
Lab Contact:
Region: Regional Contact:
Call Snitiated 8y: - Laboratory - Region
In reference to data fw the following sample numbeds):
~-
C#immary of Questiodhucr Discussed:
~-
Summary of Resolution:
Od)cB%’s9 Signature Oatt
Distributim: (1) Lab Copy, (2) Region Copy, (3) SMO Copy

FIGURE 6
DQO Summary Form

FIGURE 6 - 7 6 0 1 DQO SUMMARY FORM
LITE
. SITE INFORMATKW
It. BUOCLT REQUIREMENTS
aDoD - StNF
~ O m A c 1 0 1 ) P R I M CONTRACTOR s t MANAOEA OATS

FIGURE 7
Data Summary T a b l e s

n n v - w C 2
W
L s m ..
FIGURE 7
I
- 0 m f - W - m 0
N m d 0 0 0
U 0 0 - 0 0
m 0 0 u o
m U O d 0 0 O N U d O o w o w o o o m U
0
3 r n m m X m L 4 v)
c
r
? ' i n

o n C
, I
o n
3 0 W - < 1 ) m v 4 0 n w
n
a s
L 2 m ..
( 0 m c r m
H v) P - 0 v)
n~
E n < - P L
0 m
v)
c m m t - E
FIGURE 7 c
u
H I
e L - n m m 1: m
e
f Y)
- L 4 I m
I I . I 1 I I I I I I I I I 1 I I I I * I I I
I I *
I I 1 1 . I
I I I . . I I I
I I I I
7 6 0 1 n rn P
v) 0 c,
2 4 m ..

FIGURE 8
Standard Worksheets

7601 REGION I Data Review Worksheets
Site Name Reference Number
REGION I REVIEW O F INORGANIC CONTRACT LABORATORY DATA PACKAGE
The hardcopied (laboratory name) data package received at Region I has been reviewed and the quality assurance and performance data summarized. The data review included:
Case No. S D G . No. No. of Samples
Case No. S D G . No. No. of Samples
SAS No. Sampling Date(s) Matrix Shipping Date (s)
Date- Rec'd by -Lab
Traffic Report Nos:
Trip Blank No.: Equipment Blank No.: Field Dup Nos:
SOW No. associated reports be provided by the laboratory to the Regions, LV, and SMO. based on an examination of:
requires that specific analytical work be done and that EMSL-
The general criteria used to determine the performance were
-Data Completeness -Field Duplicates -Holding Times -Calibrations -Furnace AA Results -Blanks -IcP Serial Dilution Results -1cP Interference Check Results -Matrix Spike Recoveries -Sample Quantitation -Laboratory Duplicates
-Lab Control Sample Results
-Detection Limit Results
Overall Comments:
Definitions and Qualifiers:
A - Acceptable data. J - Approximate data due to quality control criteria. R - Reject data due to quality control criteria. U - Analyte not detected.
Reviewer: Date:

REGION I Data Review Worksheets
I. DATA COMPLETENESS
MISSING INFORMATION DATE LAB CONTACTED
- 7601
DATE REC'D

R E G I O N I Data Review Worksheets
PH I
I I I I I I I I I I I I I I I I I I I I I I I i I I I I I 1 1 8 I I I 1 I
I I 1 I I I I I I
CYANIDE OTHERS I
DATE I ' DATE I ANALYSIS ANALYSIS
7 6 0 %
I - 1 I I ~
II. ROLDINQ TIMES
, i i I I
Complete t a b l e for a l l samples and c i r c l e the analysis date for samples not w i t h i n c r i t e r i a .
7 I I HG
I SAMPLE I DATE ' I DATE I ID I SAMPLED ANAL LYSIS . I I I I I I I I I I I I I I I I I I I I I I I I I I I
I i-- I I - - I I I I - - I I I 1 I
I I 1 I I I I I I I I I I I I 1 I I I I I I
ACTION ' I I
i - i I I I I
METALS - 180 DAYS FROM SAMPLE COLLECTION MERCURY - 28 DAYS FROM SAMPLE COLLECTION CYANIDE - 14 DAYS FROM SAMPLE COLLECTION
ACTION: 1. If holding times are exceeded a l l p o s i t i v e results
estimated ( J ) and non-detects are estimated (UJ) . are
2. If holding times are grossly exceeded, the reviewer may determine that non-detects are unusable (R).

REGION I Data Review worksheets 7 6 8 1
I11 A. INSTRUMENT CALIBRATION ( S e c t i o n 1)
Recovery C r i t e r i a
List the a n a l y t e s which d i d not meet t h e percent recovery f o r I n i t i a l o r Continuing C a l i b r a t i o n .
( % R ) c r i t e r i a
- DATE I CV/CCV# ANALYTE ACTION SAMPLES AFFECTED
ACTIONS :
I f any a n a l y t e does not meet the %R c r i t e r i a f o l l o w the a c t i o n s s t a t e d below:
For P o s i t i v e R e s u l t s :
AcceDt Estimate fJ) R e j e c t f R )
Metals 9 0 - l l O 3 R 7 5 - 8 9 % R , l l 1 - 1 2 5 % R <75%R, > 1 2 S % R Mercury 8 0 - 1 2 0 % R 6 5 - 7 9 % R , 1 2 1 - 1 3 5 % R <65%R, > 1 3 5 % R Cyanide 8 5 - 1 1 5 % R 7 0 - 8 4 % R , 1 1 6 - 1 3 0 % R < 7 0 % R , >130%R
For Non-detected R e s u l t s :
AcceDt Estimate fUJ) R e j e c t fR)-
Metals 9 0 - 1 2 5 % R Mercury 8 0 - 1 3 5 % R Cyanide 85-130%R
7 5 - 8 9 % R 6 5 - 7 9 % R 7 0 - 8 4 % R
<75%R, >125%R < 6 5 % R , >135%R <70%R, >130%R

REGION I Data Review Worksheets
I11 B. INSTRUMENT CALIBRATION (Section 2)
2. Analytical Sequence
A.
B.
C.
D.
E.
If No,
The
a
Did the laboratory use the proper number of- standards for calibration as described in the SOW? Yes or No
Were calibrations performed at the beginning of each analysis? Yes o r No
Were calibration standards analyzed at the be- ginning of sample analysis and at a minimum fre- quency of ten percent or every two hours during analysis, whichever is more frequent? Yes or No
Were the correlation coefficients for the cali- bration curves for AA, Hg, and CN 1: 0.995? Yes or No
Was a standard at 2xCRDL analyzed for all ICP analyses? Yes or No
data may be affected. Use professional judgement to determine le severity of the effect and qualify the data accordingly. Discuss ny actions below and list the samples affected.

REGION I Data Review Worksheet 7 6 0 1
IV A. BLANK ANALYSIS RESULTS (Sections 1-3)
List the blank contamination in Sections 1 & 2 below. A separate worksheet should be used for soil and water blanks,
1. Laboratory Blanks
DATE ICB/CCB% PREP BL
2. Equipment/Trip Blanks
DATE EOUIP BL#
-
3. Frequency Requirements
ANALYTE
&NALYTE
MATRIX:
CONC. /UNITS
CONC./UNITS
A. Was a preparation blank analyzed for each matrix, for every 20 samples and for each digestion batch?
8. Was a calibration blank run every 10 samples or every 2 hours whichever is more frequent?
Yes or No
Yes o r No
If No,
The data may be affected. Use professional judgement to determine the severity of the effect and qualify the data accordingly. Discuss any actions below, and list the samples affected.

REOIOLS I Data Review Worksheets 1 6 0 11 I V B . BLANK ANALYSIS RESULTS (Section 4)
4. .Blank Actions
The Action Levels for any analyte is equal to five times the highest concentration of that element's contamination in any blank. The action level for samples which have been concentrated or diluted should be multiplied by the concentration/dilution factor. NO positive sample result should be reported unless the concentration of the analyte in the sample exceeds the Action Level (AL). Specific actions are as follows:
1. When the concentration is greater than the IDL, but less than the Action Level, report the sample concentration detected with a U.
2. When the sample concentration is greater than the Action Level, report the sample concentration unqualified.
MATRIX:
ELEMENT MAX. CONC./ AL/ UNITS UNITS
ELEMENT
MATRIX:
MAX. CONC./ AL/ UNITS UNITS
NOTE: order to compare them with the sample results.
Blanks analyzed during a s o i l case must be converted to mg/kg in
Conc. in ug/L X Volume diluted to (200mlI X X lOOOum X Ims = mg/kg Weight digested (lgram ) lOOOml lkg lOOOug
Multiplying this result by 5 to arrive at the action level gives a final result in mg/kg which can then be compared to sample results.

REGION I Data Review Worksheets 7 6 0 1
V A. ICP INTERFERENCE CHECK SAMPLE (Sections 1 & 2)
Recovery Criteria
List any elements in the I C s AB solution which did not meet the criteria for %R.
DATE ELEMENT %R ACTION SAMPLES AFFECTED
ACTIONS :
T € an element does not meet the %R criteria follow the actions stated low:
PERCENT RECOVERY <SO% 50-79% >120%
Positive Sample Results Non-detected Sample Results
R J R UJ
J A
2. Frequency Requirements
Were Interference QC samples run at the beginning and end of each sample analysis run or a minimum of twice per 8 hour working shift, whichever is more frequent? Yes or No
If no,
The data may be affected, Use professional judgement to determine the severity of the effect and qualify the data accordingly. Discuss any actions below and list the samples affected.

REQION I Data Review Worksheets 7601
V B. ICP INTERFERENCE CHECK 8MPLE (Section 3)
Report the concentration of any elements detected in the I C s A solution > 2xIDL that should not be present.
ELEMENT CONC. DETECTED IN THE ICs
CONC. OF INTERFERENTS
AL CA FE MG IN THE I C s
Estimate the concentration produced by the interfering element in all affected samples. See guidelines for examples. List the samples affected by interferences below:
SAMPLE ELEMENT AFFECTED AFFECTED
SAMPLE CONC . (ug/L)
SAMPLE INTERFERENT ESTIMATED CONC INTERF .
AL CA FE MG (w/ L)
ACTIONS :
1.
2.
3 .
4 .
In general, the sample data can be accepted without qualification if the sample concentrations of Al, Ca, Fe, and Mg are less than 50% of their respective levels in the ICs solution.
Estimate (J) positive results for affected elements for samples with levels of interferents 50% or more of that in the I C s solution.
Reject (R) positive results if the reported concentration is due entirely to the interfering element.
Estimate (UJ) non-detected results for which false negatives are suspect.
Give explanations for any actions taken below:

REGION I Data Review Worksheets
V I . MATRIX SPIKE
'TR 4 MATRIX:
1. Recovery Criteria
List the percent recoveries for analytes which did not meet the required criteria.
S - amount of spike added SSR - spikes sample result SR - sample result
Ana 1 yt e SSR SR S %R I I I I
I I I I I
I I I I I I I I I I I I I I 1 I I I I I
I I
i 1
I I I
I I 1
Action I
I
I I I I
Matrix Spike Actions apply to all Samples of the same matrix.
ACTIONS :
1. If the sample concentration exceeds the spike concentration by a factor of 4 or more, no action is taken.
2. If any analyte does not meet the %R criteria follow the actions stated below:
PERCENT RECOVERY
Positive Sample Results Non-detected Results
<3Q%
J R
30%-74%
J UJ
>125%
J A
2. Frequency Criteria
A. Was a matrix spike prepared at the required fre- quency? Yes or No
B. Was a post digestion spike analyzed for elements that did not meet required criteria for matrix spike recovery? Yes or No
f separate worksheet should be used for each matrix spike pair.

R E G I O N I Data Review Worksheets 7601 VII. LABORATORY DUPLICATES
LlSt the concentrations of any analyte not meeting the criteria f o r duplicate precision. For soil duplicates, calculate the CRDL in mg/kg using the sample weight, volume and percent solids data for the sample. Indicate what criteria was used to evaluate precision by circling either the RPD o r CRDL f o r each element.
MATRIX:
Element CRDh S a m l e il water soil ug/L mg/W
I I I
I I
I Aluminum-I 200-1 Antimony 60- Arsenic Barium
Cadmium 5 Ca 1 c ium Chromium , lo-,
I-
1-10- I I Beryllium- 1- 200- / 5 I
I- -I
I- l5000:I I I I I I I
I I I Cobalt I -50-
Copper I -25- I i
I I Iron ' 100 i I- Lead I -5- I
i Magnesium-' 5000-' I
Manganese-l-15-l I- I * rcury 0.2- . xkel -40-
Selenium 5- Silver -10- Sodium - 5000- Thallium- Vanadium- Zinc Cyanide
Potassium-- 5000-
puplicatefl RPD Action
I I I I I I I I I I I I I I I 1 1 I I I I I I I
1 I I I
I I I I i I I
~- I
I I I I I I I
I I I
I I I I I I
I
I
I-
Laboratory Duplicate Actions should be applied to all other samples of the same matrix type.
ACTIONS :
1. Estimate (J) positive results for elements which have an RPD >20% for waters and >35% for soils.
2. If sample results are less than 5 x the CRDL, estimate (J) positive results for elements whose absolute difference is XRDL, (2xCRDL for soils). If both samples are non-detected, the RPD is not calculated (NC)

REGION I Data Review Worksheets
VIII. FIELD DUPLICATES
'9601
List the concentrations of all analytes in the field duplicate pair. For soil duplicates, calculate the CRDL in mg/kg using the sample weight, volume and percent solids data for the sample. Indicate what criteria was used to evalute the precision by circling either the RPD or CRDL for each element.
Cobalt Copper Iron Lead Magnesium- Pnganese-
--cury- Nickel Pot ass ium- Selenium- Silver Sodium- Thallium- Vanadium- Zinc Cyanide
Element - CRDL SamDle & water s o i l ug/L mg/W
I
I I
I I I 1 I I I I I I I I I I I I I I
I Aluminum-' 200 - i Antimony Arsenic I 10- Barium
-I Beryllium-
Calcium - Chromium ! lo-,
I- I -60- I I
I- 2OO-l 5 I
IT550:l I I Cadmium l- 5
I
I
MATRIX:
puDlicate& RPD Action
I I I I I 1 I I I I I I I I I I I I
~
I I I I I I I I
I I I I I I I I I I 1 I
- 1 - 1 ~ ~
I I I I I I
I I I I
Field Duplicate Actions should be applied to all other samples of the same matrix type.
ACTIONS :
1. Estimate (J) positive results for elements which have an RPD >30% for waters and >50% for soils.
2. If sample results are less than 5x the CRDL, estimate (J) positive results and (UJ) nondetected results for elements whose absolute difference is >2xCRDL, (4xCRDL for soils). If both samples are non- detected, the RPD is not calculated (NC).

R E G I O N I Data Review Worksheets 7 6.0 1 IX. LABORATORY CONTROL SAHPLE
Aaueous LCS
List any LCS recoveries not within the 800120% criteria and the samples affected.
- DATE ELEMENT ACTION SAMPLES AFFECTED
2. Solid LCS
List any analytes that were not within the control windows set by the EPA for the solid LCS sample. The 80-120% criteria is not used to evaluate solid LCS resu'lts.
ELEMENT LCS CONC. CONTROL WINDOWS ACTION SAMPLES AFFECTED
ACTIONS :
AOUEOUS LCS Percent Recoverv
<50% 51-798
Positive Results R J Non-detected Results R UJ
SOLID LLS <EPA Control Windows
Positive Results J Non-detected Results UJ
3. Frequency Criteria
>1208
J A
>EPA Control Windows
J A
A. Was an LCS analyzed for every matrix, every digestion batch, and every 20 samples? Yes or No

REGION I Data Review Worksheets
X A. FURNACE ATOMIC ABSORPTION ANALYSIS
Duplicate Precision
- - - - - - - - Duplicate injections and one-point analytical spikes were per- formed for all samples: duplicate injections agreed within & 20%.
-------- Duplicate injections and/or spikes were not performed for the following samples/elements:
-------- Duplicate injections did not agree.within & 20% for samples/ elements :
2. Post Digestion Spike Recoveries
-------- Spike recoveries met the 850115% recovery criteria for a l l samples.
-------- Spike recoveries did not meet the 85-115% criteria but did not require MSA for the following samples/elements:
-------- MSA was used to quantitate analytical results when con- tractually required.
Correlation coefficients 20.995, accept results. Correlation coefficients C0.995 for sample
numbers/elements:
_------- Method of Standard Addition quired for samples/elements:
ACTIONS :
(MSA) was not performed as re-
1. Estimate (J) positive results if duplicate injections are outside - + 20 % RSD or CV.
2 . If the sample absorbance is <SO% of post digestion spike absorbance the following actions should be applied:
PERCENT RECOVERY <lot 11%-848 >115#
J or R J R UJ
Positive Sample Results Non-detected Results
J . A
3 .
4 .
Estimate (J) sample results if MSA was required and not performed.
Estimate (J) sample results if correlation coefficient was ~0.995.

7 6 0 1 REGION I Data Review Worksheets
XI. INDUCTIVELY COUPLED P W M A (ICP) SERIAL DILUTION ANALYSIS
Serial Dilutions were performed for each matrix and results of the diluted sample analysis agreed within ten percent of the original undiluted analysis.
Serial Dilutions were not performed for the following:
Serial Dilutions were performed, but analytical results did not agree within 10% for analyte concentrations greater than SOX the IDL before dilution.
Report all results below that do not meet the required laboratory criteria for ICP serial dilution analysis.
MATRIX:
ELEMENT IDL 5OxIDL
Aluminum Barium-
ryllium cddmium- Ca 1 c ium- Chromium-
Iron Lead Magnesium Manganese Nickel- Potassium Silver- Sodium- Vanadium- - Zinc
SAMPLE RESULT
SERIAL DILUTION
%D ACTION
I I I I I I I I I I I I i I I 1 I I I
Actions apply to all samples of the same matrix.
ACTIONS :
1. Estimate (J) positive results if %D >is.

REGION I Data Review Worksheets
X I I . DETECTION LIHIT RESULTS
Instrument Detection Limits
Instrument Detection Limit results were present and found to be less than the Contract Required Detection Limits.
IDLs were not included in the data package on Form XI.
IDLS were present, but the criteria was not met for the following elements:
2. Reporting Requirements
Were sample results on Form I the IDL not the CRDL for all analytes?
reported down to Yes or No
Were sample results that were analyzed by ICP f o r Se, T1, A s , or Pb at least 5 x IDL. Yes or No
Were sample weights, volumes, and dilutions taken into account when reporting detection limits on Form I. Yes or No
If No,
The reported results may be inaccurate. Make the necessary changes un the data summary tables and request that the laboratory resubmit the corrected data.

R E G I O N I Data Review Worksheets ? 6 0 B XIII. SAMPLE QUANTITATION
Sample results fall within the linear range for ICP and within the calibrated range for all other parameters.
Sample results were beyond the linear range/ calibration range of the instrument for the following samples/elements:
In the space below, please show a minimum of one sample calculation per method:
- ICP
FURNACE
MERCURY
CYANIDE
For soil samples, the following equation may be necessary to convert raw data values (usually reported in ug/L) to actual sample con- centrations (mg/kg) :
The lab is required to use 1 gram sample (wet weight) to 200 ml.
Wet weight concentration =
digest conc. in UQ X 200ml X 1L X JOOOum X lmu = = L 1 g m 1000 ml lkg lO0Oug kg
In addition the sample results are converted to dry weight using the percent solids calculations:
Wet weiuht conc. X 100 = final concentration, dry weight (mg/kg) %solids
0002W

FIGURE 9
Inorganic Regional Data Assessment Form

FIGURE 9 Regio lgSOl '
lNORCANlC REGIONAL DATA ASSESShlENT
CASE NO. SITE LABORATORY NO. OF SAMPLES/
S D G * REVIEWER (IF NOT ESD) sow* REVIEWER'S NAME
DPO: ACTION FYI COMPLETION DATE
MATRIX
P A T A ASSESSM ENT SUMMARY
ICP A A Hs CYANIDE
I. HOLDING TIMES
2. CALIBRATIONS
3. BLANKS
4. ICs
5. L c s
6. DUPLICATE ANALYSIS
7. MATRIX SPIKE
- 8. MSA
9. SERIALDILUTION
10. SAMPLE VERIFICATION
I t . OTHER QC
- -
12. OVERALL ASSESSMENT - 0 = Data had no probtems/or qualified due to minor problem. M - Data qualiried due to major probtems. Z - Data unacceptable. X = Problems, but do not affect data.
AREAS OF CONCERN.
NOTABLE PERFORMANCE

APPENDIX E
Completed Inorganic Regional
Data Assessment Form (IRDA) and
Guidance fo r Completing t h e ORDA
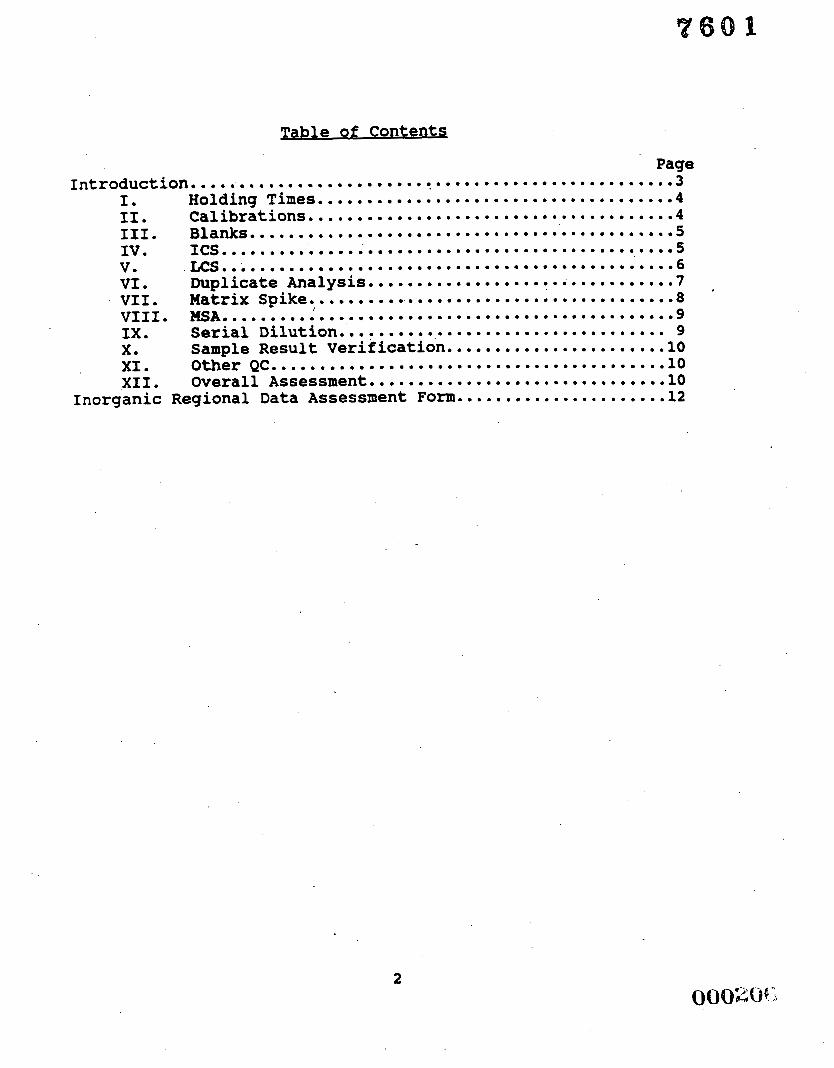
Table of Conten ts
Page ~ntroduction......................~.~o~~..~~~~~.~~~o~o........3
I. Holding Times .............................,.....4 11. Calibrations........~....~~..~~~~..~~~~~~~~~......4 111. Blanks . . . . . . . . . . . . . . ~ . ~ . . ~ ~ . . . . ~ ~ . . . . ~ . ~ ~ . . . . . . a . . S
VI. Duplicate Analysis . . . . . . . . . . . . . . . . . . . . . . . . . . . . . . . . 7 VII. Matrix Spike ...............~.~.....00.00.0.~0.....8
IX. Serial Dilution .................................. 9 X. Sample Result Verification ........~e~.~..~~~~.~..10 XI. Other QC .....................o.~...e....~~.......10 XII. Overall Assessment ...........~....o.~...s..~~....10
Inorganic Regional Data Assessment F o ~ . . ....................12
IV . I C s ............................. o..-.*.*..**......s
V. ICs.... ...................................... . . * . . 6
VIII. MSA..........’.............o.e.....................9
2

Guidelines for Evaluating Validation Memo8 aad Completing the Inorganic Regional Data Assessment Form
Introduction
This document is designed to offer guidance in evaluating validation memos and completing the Inorganic Regional Data Assessment (IRDA) Form.
The document is designed to define and clarify the areas evaluated and the resulting actions forthe Inorganic Regional Data Assessment Form. The procedure must be performed by a qualified data reviewer, since technical expertise is utilized in completing the form. An IRDA Form must be completed for each data package reviewed and validated f o r Region I.
3

I b BOLDINO T- 7 6 0 1 A. Deiinition or Explanation
The holding time of the sample can be defined as the time from sample collection to the time of analysis or sample preparation, as appropriate.
B. Actions
If all the sample holding time criteria were met, the category will be qualified with "Ow, data had no problems/or qualified due to minor problems.
If the sample holding times were exceeded and all the positive results and detection limits are estimated, the Inorganic Regional Data Assessment Form (IRDA) will be qualified with data had no problems/or qualified due to minor problems.
If the holding times were grossly exceeded and all the positive results are estimated and non-detected results
data qualified due to major problems.
If the holding times were grossly exceeded and all positive and non-detected results are rejected, the IRDA form will be qualified with "Z", data unacceptable.
are rejected, the IRDA form will be qualified with W1 I
If. CALIBRATIONS
A. Definition or Explanation
Calibrations refer to the instrument's initial and continuing calibrations and demonstrate the instru- ment's ability to produce.acceptable quantitative data.
B e Actions
If all the calibration criteria are within specifications, and met the frequency requirements the IRDA form will be qualified with "'ow, data had no problems/or qualified due to minor problems.
If the %R for the ICV or CCV is between 75-89 or 111-125, (or the respective ranges for CN and Hg) and the positive results have been estimated, the IRDA form will be qualified with "Mw, data qualified due to major problems.
If the %R is outside the 750125% limits, (or the respective ranges for CN and Hg) and the positive results and non-detected results are rejected, the IRDA will be qualified with "Zn, data unacceptable.
If other problems related to Calibrations exist that do

not affect the data (eg. standard8 were not nm at the proper frequency) , the IRDA will be qualified with "Xm, problems but do not affect data.
A. Dofinition or Bxplanatioa
The blanks consist of preparation blanks, calibration blanks, and equipment or trip blanks. The blanks are reviewed to determine the existence and magnitude of contamination problems. The problem8 associated with one blank apply to all the associated samples. Blanks are reported per matrix, and for each digestion batch.
B. Aations
If no contamination is present, and the proper number of blanks were analyzed, the IRDA form will require data had no problems/or qualified due to minor problems.
If low levels of contaminants are present, and the detection limit is raised, the IRDA form will be qualified with nXw, problems, but do not affect the data.
If contaminants were found in the laboratory blanks at levels greater than the CRDL, the associated samples must be reanalyzed or redigested depending on the source of contamination. If the samples are not reanalyzed, the IRDA qualifier will be " Z W , data unacceptable.
If high levels of contaminants are detected in the equipment blanks, the IRDA shall be qualified with "Ma, data qualified due to major problems.
If blanks were not analyzed at the proper frequency but do not affect the data, the IRDA will be qualified with "Xn, problems but do not affect the data.
A. Dafinition or Ihplaaatioa
The ICP Interference Check Sample is analyzed at the beginning and end of each sample analysis run to verify the contract laboratory's interelement and background correction factors.
5

2'601
V.
If all the recoveries for the ICs meet criteria and an ICs was analyzed at the proper frequency, the IRDA qualifier will be "On, data had no problems/or qualified due to minor problems.
If the ICs recovery does not meet criteria but the levels of interferents in the samples are not 501 o r more of those found in the ICs' solution, the qualifier will be I1X", problems, but do not affect the data.
If ICs recoveries are 50-791 or >1201, and levels of interferents are 50% or more of that found in the ICs solution, the IRDA will be qualified with "On, data had no problems or qualified due to minor problems.
If results >2x IDL are detected for elements not present in the EPA solution and the samples have levels ofinter- ferents that are 50% or more of those found in the ICs solution, the IRDA qualifier will be IW, data qualified due to major problems.
If sample results are rejected due to major inter- ferences, the IRDA form will be qualified with I r Z n , data unacceptable.
If the ICs recovery falls <50 0 , the IRDA qualifier will be n Z n , data unacceptable.
If the ICs was not analyzed at the proper frequency but the data are not affected, qualify the IRDA with rXw, problems, but do not affect the data.
4 L SAMP
A.
BO
Definition or Explanation
The laboratory control sample analysis is designed to serve as a monitor of the efficiency of the digestion procedure. Reported results may be biased either h i g h or low for elements with ICS recoveries outside required criteria.
If the aqueous U S recovery falls within the range of 50-150%, or the solid LCS falls within the control windows and LCSs were analyzed at the required frequency, the IRDA qualifier will be data had no problems or qualified due to minor problems.
If the aqueous LCS recovery >150b, or soil LCS results

are > control windows and results are >IDL, the IRDA qualifier will be "M", data qualified due to major problems . If the aqueous LCS recovery >150%, or soil LCS results are.> control windows and results are non-detected, the IRDA qualifier will be "XW, problems but do not affect the data.
If the aqueous LCS recovery is ~ 5 0 % or the solid LCs falls below the control windows the qualifier should be wZ', data unacceptable.
If an LCS was not analyzed at the proper frequency but the data are not affected, the qualifier shall be "X", problems, but do not affect data.
VI . DUPLICATE ANALYSIS
A. Description or Explanation
Duplicate analyses are indicators of the precision of the sample results. Laboratory duplicates give an indication of the precison of the laboratory analysis. Field duplicates are indicators of field precision as well as laboratory precision. Laboratory duplicates are required per matrix and per digestion batch. Qualifiers apply to all samples of a similar matrix.
B. Action8
If samples have an RPD for lab or field duplicates that <SO% for waters, <75 % for soils and were analyzed at
data had no problems/or qualified due to minor problems. the required frequency, the IRDA qualifier will be I
For samples that are 4xCRDL , if the difference between the results is 2 2xCRDL for laboratory duplicates or f 4xCRDL for field duplicates and were analyzed at the required frequency, the IRDA qualifier will be "On, data had no problems or qualified due to minor problems.
If the RPD is >50b for waters and 75 % for soils, for either laboratory or field duplicates for samples that are >5xCRDL, the qualifier should be "M", data qualified due to major problems.
If the absolute difference between samples is > 52xCRDL for laboratory duplicates and >& 4xcRDL for field duplicates for samples less than SxCRDL, the qualifier

I
7 6 0 a
VI1 .
should be " M N , data qualified due to major problems.
If duplicates were not analyzed at the proper frequency but the data are not affected, qualify the IRDA with llXn, problems, but do not affect the data.
MATRIX 8 P I m
A. Definit ion or Explaaation
The matrix spike sample analysis is designed to provide information about the effect of the sample matrix on the digestion and measurement methodology. A matrix spike is required for each matrix analyzed and qualifiers apply to all samples of similar matrix.
B. If all the matrix spike recoveries are within the specified criteria, and were anlayzed at the required frequency, the IRDA form will be qualified with "On, data had no problems/or qualified due to minor problems.
If the matrix spike recovery is >125% and the reported results are non-detected, the qualifier should be I1XN problems, but do not affect the data. I
If the matrix spike recovery is between 50-150%, and the results are >IDL, the qualifier shall be "ON, data had no problems/or qualified due to minor problems.
If the matrix spike recovery is >1509 and positive results are estimated, qualify the IRDA with "MW, data qualified due to major problems.
If the matrix spike recovery is between 30% and 501, for non-detected results or <50k for results >IDL, the qualifier shall be data qualified due to major problems . If the spike recovery results fall below 30% and the sample results are non-detected, the IRDA form should be qualified with "Z*, data unacceptable.
If a matrix spike was not analyzed at the proper frequency, or a post-digestion spike was not analyzed as required, but the data are not affected, qualify the IRDA with "X", problems, but do not affect the data.
a

VIII. HETEOD OF BTANDARD ADDITION (XSN
1x0
A. Description or Explanation
The Method of Standard Addition ( M A ) is required when the furnace post digestion spike recovery is not within 85-115%, and the sample absorbance is >50b of spike absorbance. This section of the IRDA is used to qualify problems with post-digestion spike recovery as well as M A S
If duplicate injections were performed as required and the 3RSD or CV <40, qualify the IRDA With 'IOn, data had no problems/or qualified due to minor problems.
If the %RSD or cV >40, qualify the IRDA with I 'Mn, data qualified due to major problems.
If post digestion spike recoveries were within 75-1252 and were analyzed for every sample, the IRDA will be qualified with @@ON, data had no problems/or qualified due to minor problems.
If post digestion spike recoveries were >125% but samples were non-detected, qualify the IRDA with NXn, problems but do not affect the data.
If post digestion spike recoveries 11-75%, (or >125% for positive results) the IRDA qualifer will be "MW, data qualified due to major problems.
If post digestion spike recoveries were <lo%, qualify the IRDA with I@Z" , data unacceptable.
If W A S were performed as required and the correlation coefficient is >0.995, the IRDA form will be qualified with @ION, data had no problems/or qualified due to minor problems . If the correlation coefficient is ~ 0 . 9 9 5 for both MSA analyses, the form shall be flagged with WW, data qualified due to major problems.
SERIAL DILUTION
A. Description or Explanation
Serial dilution analysis determines whether significant physical o r chemical interferences exist due to sample
9

X.
X I 0
matrix.
B. Action8
If the %D is < 3 0 % , the IRDA shall be flagged with nom, data had no problems/or qualified due to minor problems.
If the %D is > 3 0 % , the IRDA shall be flagged with nXr, data qualified due to major problems.
If a serial dilution was not performed as required, the IRDA form shall be flagged with "X", problems, but do not affect the data.
SAMPLE RESULT W R I P I C A F I O N
A. Description o r Explanation
The objective is to ensure that the reported quantitation results are accurate.
If transcription, calculation, linear range, or raw instrument data discrepancies are found and are resolved after contacting the laboratory, the IRDA form shall be qualified with I1Ow, data had no problems/or qualified due to minor problems.
If transcription, calculation, linear range, or raw instrument data discrepancies cannot be resolved, qualify the form with "M", data qualified due to major problems.
OTHER
A. Description or Explanation
Other problems with quality control parameters pertaining to the Case may be qualified using professional judge- ment. (ie. detection limits, post digestion spikes, etc.)
XI1 0 OVERALL ASSE88XENT
A. Description or Explanation
The data reviewer makes professional judgements and expresses concerns and comments on the validity of the overall data package for a Case. The additive nature of

, 7681 QC parameters out of specification is difficult to 1 in an objective manner. The data quality objectivea aid in making the decision of the overall validity 01 data .
? B. Aotions i
If there are no significant problems associated with th\ Case, the IRDA will be qualified with "Ow, data had no. problems/or qualified due to minor problems.
If there were small problems with the data package or contractual violations but the data could be utilized, qualify the form with "XW, problems, but do not affect the data.
If there was a significant problem which interfered with use of the data, the category will be qualified, "Z", data unacceptable.
'%,, '. '\
11


![Hyper 360—Towards a Unified Tool Set Supporting …...gLink, Viar 360, Sprawly, Viond, Omnivirt, and 3DVista Pro [17]-[25]) quickly reveals that so far none of these tools supports](https://static.documents.pub/doc/80x56/5ec96c3cd73aa012b17e6a62/hyper-360atowards-a-unified-tool-set-supporting-glink-viar-360-sprawly.jpg)


![Maurer–CartanForms and the Structure ofLie …olver/mf_/psa.pdfLie pseudo-groups appear in many fundamental physical and geometrical contexts, includ ing gauge symmetries, [6], Hamiltonian](https://static.documents.pub/doc/80x56/5f08e31f7e708231d4243433/maureracartanforms-and-the-structure-oflie-olvermfpsapdf-lie-pseudo-groups.jpg)


