Volume 12 Issue 3 2010 Third Quarter C ALIFORNIA S TATE U NIVERSITY , B AKERSFIELD S CHOOL OF B USINESS AND P UBLIC A DMINISTRATION K ERN E CONOMIC J OURNAL KERN ECONOMIC JOURNAL is a quarterly publication of California State University, Bakersfield. Its purpose is to track local trends and analyze regional, national, and global issues that affect the economic well-being of Kern County. The journal provides useful information and data that can help the community make informed economic decisions. Award of Merit from the California Association for Local Economic Development www .csub.edu/kej/ presents: Kern Economic Journal (quarterly) The CUSB Economic Report (weekly) Business Education Center (weekly)
Transcript
Volume 12 Issue 3
2010 Third Quar ter
C A L I F O R N I A S T A T E U N I V E R S I T Y , B A K E R S F I E L D S C H O O L O F B U S I N E S S A N D P U B L I C A D M I N I S T R A T I O N
K E R N E C O N O M I C J O U R N A L
KERN ECONOMIC JOURNAL is a quarterly publication of California State University, Bakersfield. Its purpose is to track local trends and analyze regional, national, and global issues that affect the economic well-being of Kern County. The journal provides useful information and data that can help the community make informed economic decisions.
Award of Merit from the California Association for Local Economic Development
www .csub.edu/kej/
presents:
Kern Economic Journal (quarterly) The CUSB Economic Report (weekly) Business Education Center (weekly)
Editorial Board Brent Dezember, President, StructureCast - Honorary Advisor Abbas Grammy, Professor of Economics, CSUB - Publisher and Managing Editor Mark Evans, Professor of Economics and Associate Dean of School of Business and Public Administration, CSUB - Co-Publisher and Editor Sylvia O'Brien, O'Brien Images Production and Design - Design Editor Don David, Information Technology Consultant - Web Services, CSUB - Website Manager Contact Information
Abbas Grammy [email protected], 661-654-2466 Mark Evans [email protected], 661-654-2157 To become a sponsor, please contact the Managing Editor for sponsorship form and benefits.
KERN ECONOMIC JOURNAL is a quarterly publication (February, May, August, November) of California State University, Bakersfield. Its purpose is to track local trends and analyze regional, national, and global issues that affect the economic well-being of Kern County. The journal provides useful information and data that can help the community make informed economic decisions. Sources of funding for the journal include university contributions and sponsorship and subscription fees. Editorial and analytical articles on important local, regional, national, and international issues and trends are invited for consideration of publication in the journal. Articles (not exceeding 800 words in length) must be submitted to the Managing Editor in hard or electronic copy. Individual authors are responsible for the views and research results.
We wish to gratefully acknowledge the Journal sponsors:
We wish to gratefully acknowledge the Journal sponsors:
INSIDE THIS ISSUE:
Cover photo: Grand Opening of CSUB Small Business Development Center taken by Jennifer Baldwin, CSUB Public Relations Office Economy at a Glance! ........................................................................................ 2 Opinion Surveys Kern Business Outlook Brightens ............................................................................ 3 Bakersfield Consumer Confidence Inching Upward .................................................. 4 Tracking Kern’s Economy Economy ................................................................................................................ 6 Labor Market ........................................................................................................ 6 Housing Market ..................................................................................................... 8 Stock Market ....................................................................................................... 10 Inflation ................................................................................................................ 11 Commodity Prices .................................................................................................. 12
1
CSUB Announces New Partnership with Small Business Development Center October 15, 2010
CSUB is taking an active leadership role in local economic development, becoming the host institution of the Small Business Development Center that serves Kern, Inyo and Mono counties. The announcement was made during a news conference and grand opening event held today at the center located in University Square, 2000 K St., in downtown Bakersfield. The center is one of five full-service centers and two satel-lites within the UC Merced SBDC Regional Network in Central California. "This will help us meet our mission of community engagement," said Mark Evans, Associate Dean of the School of Business and Public Administration at CSUB. "In the past, we have not had sufficient resources to institutionalize our commitment to regional economic development. We could sit on boards and committees but we couldn't bring re-sources to the table. We are excited about our increased capacity to assist small businesses, which are the engines of economic opportunity." A generous gift of $50,000 from Wells Fargo enabled CSUB to move forward with opening the center. The CSUB SBDC is one of 35 Small Business Development Centers throughout the state of California, and part of a larger national network established by the U.S. Small Business Administration (SBA). It provides free consulting and workshops to new and existing small businesses looking to start up and expand their operations. Specifically, the CSUB SBDC will offer a multitude of opportunities for local small businesses, including: • Assistance with business plans, financial plans, and market research • Help with human resource issues and employee manuals
(Continued on page 13)
2
EC O N O M Y A T A GL A N C E! A B B A S P . G R A M M Y P R O F E S S O R O F E C O N O M I C S , C S U B
National Economy
T he Gross Domestic Product (GDP) increased at an annual rate of 2.0 percent, according to
"advance" estimates released by the Bureau of Eco-nomic Analysis. This modest growth, which fol-lowed a slow expansion of 1.7 percent in the previ-ous quarter, is the fifth straight quarter of positive growth. While the economy continues to recover from a deep recession, faster growth is needed to create jobs and reduce unemployment. This quar-ter’s increase in the GDP primarily reflected posi-tive contributions from personal consumption ex-penditures and business investment. These positive effects were partly offset by negative contributions from residential investment. The Index of Leading Economic Indicators – a measure of future economic activity – ascended 1.7 points to reach 110.2. Relative to four quarters ago, the index was up 7.5 points. The upward trend of this index provides no indication of a relapse into another downturn in the next three to six months. However, an unexpected 5.6 points drop in the Uni-versity of Michigan’s Consumer Sentiment Index indicates that households are still worried about keeping jobs and cautious about spending income. The rate of unemployment fell only one-tenth of one percent from 9.7 to 9.6 percent. In the meantime, the cost of living increased at an annual rate of 1.5 percent; the cost of producing ascended 0.7 percent; and the cost of employment rose 1.6 percent. State Economy
In California, the unemployment rate remained un-changed at 12.4 percent. The state’s labor force shrunk by 74,100 and total employment declined by 61,700. However, 12,300 fewer workers were un-employed. Nonfarm industries were responsible for reducing 42,600 jobs, of which the 14,500 jobs were lost in the goods-producing industries and 28,100 jobs were eliminated in the services-providing in-dustries.
Within the goods-producing industries, manufactur-ing cut 3,650 jobs and construction slashed 11,300 jobs. A wide range of services-providing industries reduced employment: transportation and utilities, wholesale trade, real estate and rental and leasing, educational services, arts, entertainment and recrea-tion, federal and local government agencies. Mean-while, several industries added jobs: mining and logging, retail trade, finance and insurance, profes-sional and business services, accommodation and food services, and state government. County Economy
In Kern County, households continued to become less pessimistic about employment and financial conditions of their families and relatives as the Ba-kersfield Consumer Sentiment Index gained 4 points to reach 82. Likewise, businesses turned more opti-mistic about their employment and financial condi-tions as the Kern County Business Outlook Index rose 10 points to reach 120. The county’s economy expanded at an annual rate of 0.8 percent. Kern’s economy generated $15.42 billion in personal income, $28 million more than the previous quarter. Personal income per worker increased by $70 to reach $40,770. Labor market conditions improved in the third quar-ter of this year. Total employment increased by 2,100, which consisted of 8,600 more farm jobs and 500 more informal jobs, but 7,000 fewer nonfarm jobs. While private enterprises added 200 paid po-sitions, government agencies cut 7,200 jobs. A wide range of nonfarm industries added jobs this quarter: oil and gas extraction, residential logging, manufacturing, construction, transportation, ware-housing and utilities, leisure and hospitality, and Department of Defense. In contrast, several indus-tries reduced employment: wholesale trade, retail trade, professional and business services, finance and insurance, educational services, federal govern-
(Continued on page 13)
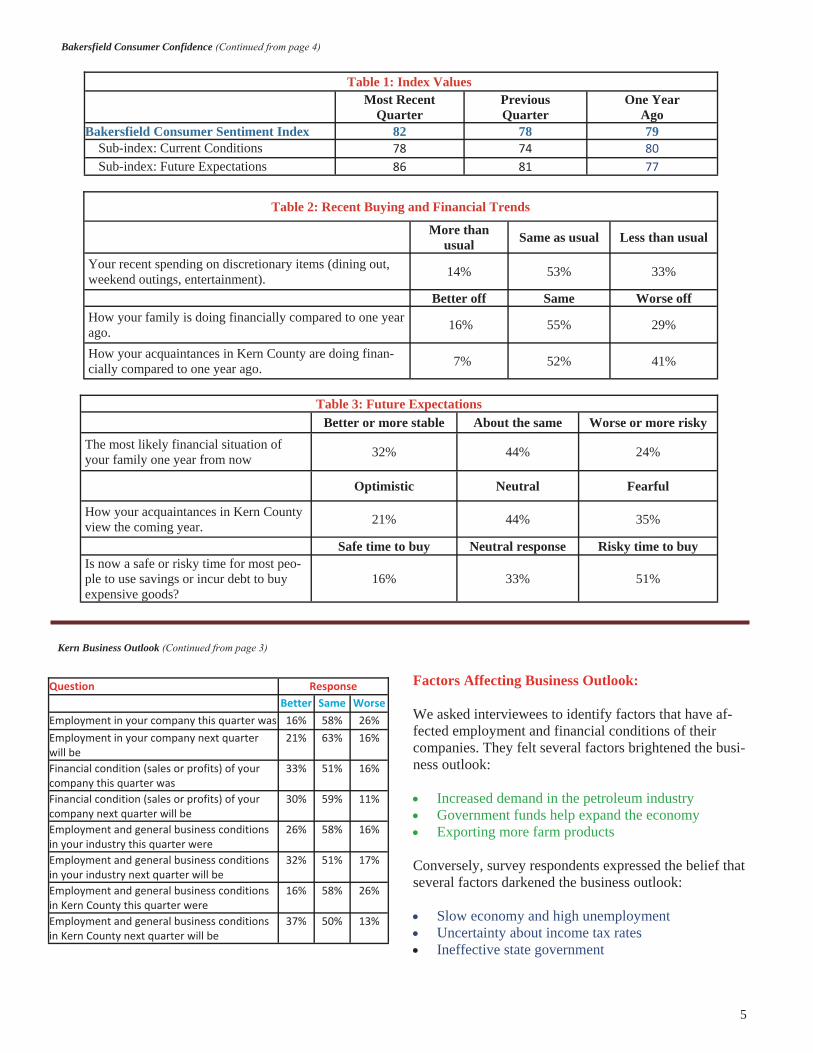
K ern County business managers became more opti-mistic about their employment and business condi-
tions. In the third quarter (July through September) of 2010, the Business Outlook Index gained 10 points. The index ascended to 120 from 110 in the previous quarter. Relative to one year ago, the index was up 11 points.
Kern County’s Business Outlook Index is compiled from telephone surveys administered to a random sample of local business managers listed in various telephone di-rectories. Index values above 100 indicate optimism, while values below 100 suggest pessimism. The intent of the survey is to help business managers make more in-formed decisions given local economic trends. Survey results also enable investors to assess the potential for local economic growth based on the degree of business confidence. To make an in-depth analysis of business confidence, we disaggregated the Business Outlook Index into two indi-ces relating to recent and future business perceptions. Survey respondents expressed confidence in current business conditions. The Current Conditions Index rose to 102 from 100. However, the Future Condition Index dropped to 116 from 120.
Employment Outlook: Fifty-eight percent of interviewees reported that the number of jobs in their companies stayed constant this quarter. However, 16 percent said more jobs were avail-able in their companies and 26 percent reported reduced employment. Likewise, 63 percent perceived that the number of jobs would stay constant next quarter, whereas 21 percent expected their companies to hire more workers. The re-maining 16 percent anticipated a smaller workforce. Financial Outlook: Fifty-one percent of survey respondents reported that the financial conditions (sales and profits) of their compa-nies were constant this quarter, whereas 33 percent indi-cated increased sales and profits and 16 percent stated reduced sales and profits. Similarly, 59 percent expected financial conditions of their companies would remain constant next quarter. However, 30 percent anticipated increased sales and profits and 11 percent predicted reduced sales and prof-its. Industry Outlook: Fifty-eight percent of survey respondents perceived that the employment and general business conditions of their industries remained the same as the previous quarter, while 26 percent felt these conditions improved and 16 percent indicated crumbling business conditions. Fifty-one percent anticipated that the employment and general business conditions of their industries would stay unchanged next quarter. Yet, 32 percent expected pro-gress and 17 percent felt otherwise. Economic Outlook: When asked about Kern County’s economy, 58 percent of interviewees perceived no change this quarter. Never-theless, 16 percent felt conditions improved and 26 per-cent said conditions worsened. Likewise, 50 percent felt that economic conditions would remain unchanged next quarter. However, 37 per-cent anticipated the economy would get better and 13 percent said conditions are likely to get worse.
(Continued on page 5)
KE RN BU S I N E S S OU T L O O K BR I G H T E N S A B B A S P . G R A M M Y P R O F E S S O R O F E C O N O M I C S , C S U B
Current Quarter
Previous Quarter
Four Quarters
Ago
Business Outlook Index 120 110 109
Current Conditions Index 102 100 107
Future Conditions Index 116 120 111
3
4
B akersfield’s Index of Consumer Sentiment inched upward from 78 in the second quarter to 82 in the
third quarter of 2010. This was the second consecutive modest increase after bottoming out at 66 in the first quarter. Nationally, the University of Michigan’s con-sumer sentiment index inched downward from 74 to 68. Although the Bakersfield Consumer Sentiment Index is conceptually similar to the University of Michigan’s na-tional index of consumer sentiment, their magnitudes cannot be directly compared. They have different base years and are tabulated from different questions using different formulas. Their relative performance is similar in that both the national and local indexes remain in their “bottom ten percent” of readings since CSUB began tabulating the local index in 1999. CSUB compiles the Consumer Sentiment Index from telephone interviews of a random sample of households. The index is constructed to help local businesses com-pare national and local trends and to provide insight into whether a Bakersfield company’s sales trajectory reflects industry trends or shifts in market share. The gain in confidence influenced household decisions to buy big-ticket items. Four percent of survey respondents said they purchased ex-pensive items in the past thirty days including home furniture, appliances, electronics, and computers. Analysis of individual survey questions provides a closer look at household spending behavior. Fourteen percent of households said that they spent more than usual on discretionary items such as dining out and entertainment. In contrast, 53 percent spent the same amount and 37 per-cent budgeted less money than usual for these items. The Consumer Sentiment Index is disaggregated into sub-indexes reflecting financial outcomes over the previous 12 months and expectations for the coming year. The
increase in the composite index resulted from small in-creases in both sub-indexes. The sub-index measuring recent financial trends in-creased from 74 in the second quarter to 78 in the third quarter. The increase was attributable to a three percent increase in the percentage of households reporting their situation had improved (increase from 13 to 16 percent) and a one percent decline in the percentage reporting their acquaintances in Kern County became worse off in the past 12 months (decrease from 42 to 41 percent). The sub-index reflecting expectations for the coming year increased from 81 to 86. The increase was partly attributable to a four percent decline in the percentage reporting their acquaintances in Kern County will be worse off in the next 12 months (decrease from 39 to 35 percent). It was also attributable to less bearish attitudes toward borrowing or drawing down savings for con-sumer purchases. The percent who thought this is a safe time to borrow or draw down savings increased from 12 to 16 percent, while the percent who indicated this is a risky time to borrow or draw down savings decreased from 54 to 51 percent.
(Continued on page 5)
BA K E R S F I E L D CO N S U M E R CO N F I D E N C E IN C H I N G UP WA R D M A R K E V A N S A S S O C I A T E D E A N , S C H O O L O F B U S I N E S S & P U B L I C A D M I N I S T R A T I O N P R O F E S S O R A N D C H A I R O F E C O N O M I C S , C S U B
Factors Affecting Business Outlook: We asked interviewees to identify factors that have af-fected employment and financial conditions of their companies. They felt several factors brightened the busi-ness outlook: • Increased demand in the petroleum industry • Government funds help expand the economy • Exporting more farm products Conversely, survey respondents expressed the belief that several factors darkened the business outlook: • Slow economy and high unemployment • Uncertainty about income tax rates • Ineffective state government
Kern Business Outlook (Continued from page 3)
Table 2: Recent Buying and Financial Trends
More than usual Same as usual Less than usual
Your recent spending on discretionary items (dining out, weekend outings, entertainment). 14% 53% 33%
Better off Same Worse off How your family is doing financially compared to one year ago. 16% 55% 29%
How your acquaintances in Kern County are doing finan-cially compared to one year ago. 7% 52% 41%
Table 3: Future Expectations Better or more stable About the same Worse or more risky
The most likely financial situation of your family one year from now 32% 44% 24%
Optimistic Neutral Fearful
How your acquaintances in Kern County view the coming year. 21% 44% 35%
Safe time to buy Neutral response Risky time to buy Is now a safe or risky time for most peo-ple to use savings or incur debt to buy expensive goods?
16% 33% 51%
Bakersfield Consumer Confidence (Continued from page 4)
Most Recent Quarter
Previous Quarter
One Year Ago
Bakersfield Consumer Sentiment Index 82 78 79 Sub-index: Current Conditions 78 74 80 Sub-index: Future Expectations 86 81 77
Table 1: Index Values
5
Question Response Better Same Worse Employment in your company this quarter was 16% 58% 26% Employment in your company next quarter will be
21% 63% 16%
Financial condition (sales or profits) of your company this quarter was
33% 51% 16%
Financial condition (sales or profits) of your company next quarter will be
30% 59% 11%
Employment and general business conditions in your industry this quarter were
26% 58% 16%
Employment and general business conditions in your industry next quarter will be
32% 51% 17%
Employment and general business conditions in Kern County this quarter were
16% 58% 26%
Employment and general business conditions in Kern County next quarter will be
37% 50% 13%
Economy Personal Income - Kern County’s total personal income (in constant 1996 dollars and adjusted for seasonal varia-tions) increased $28 million from $15.24 billion in the second quarter to $15.42 billion in the third quarter of 2010. Several factors contributed to this increase, in-cluding rising employment, falling unemployment, and greater business profits. These positive contributions were largely offset by declining housing sales and prices and loss of residential property to foreclosure. Compared with four quarters ago, this quarter’s total personal in-come was $25 million higher.
Growth of Personal Income - The gain of $28 million of personal income translated into a slow annualized growth rate of 0.8 percent in the third quarter of 2010. Kern’s econ-omy grew 3.1 percent in the previous quarter and 1.2 per-cent four quarters ago.
Personal Income Per Worker - Personal income per worker increased $70 from $40,700 in the second quarter to $40,770 in the third quarter of 2010. Similarly, per-sonal income per worker was $370 more than that of four quarters ago.
Labor Market We adjust published data in three ways. Firstly, we aver-aged monthly data to calculate quarterly data. Secondly, we recalculated quarterly data to take into account work-ers employed in the “informal” market (i.e., self-employed labor and those who work outside their county of residence). Finally, we adjusted quarterly data for the effects of seasonal variations. Labor Force - The civilian labor force decreased from 378,310 in the second quarter to 378,210 in the third quarter of 2010. Compared with four quarters ago, 3,190 fewer workers were available for work.
Employment - In the third quarter of 2010, Kern County’s economy gained 2,100 jobs as total employ-ment increased from 319,710 to 321,810. However, the county employed 7,390 fewer workers this quarter rela-tive to the third quarter of last year.
(Continued on page 7)
TR A C K I N G KE RN’S EC O N O M Y 1 2 0 1 0 T H I R D Q U A R T E R A B B A S P . G R A M M Y P R O F E S S O R O F E C O N O M I C S , C S U B
Unemployment - The number of jobless workers de-creased by 2,200 as unemployment dropped from 58,600 in the second quarter to 56,400 in the third quarter of 2010. Nonetheless, 3,600 more workers were unem-ployed this quarter than four quarters ago.
Unemployment Rate The rate of unemployment de-clined from 15.5 in the second quarter to 14.9 in the third quarter of 2010. Relative to four quarters ago, however, this quarter’s unemployment rate was 1.1 percent higher.
The rate of unemployment varied considerably across cities. Among cities shown below, the unemployment rate ranged between 9.0 percent in Ridgecrest and 38.3 percent in Arvin. In Bakersfield, the rate of unemploy-ment was 11.0 percent.
Farm Employment - In the third quarter of 2010, Kern County employed 8,600 more farm workers. Farm em-ployment increased from 38,900 to 47,500. Yet, the farming industry hired 11,400 fewer workers this quarter than four quarters ago.
Nonfarm Employment - Nonfarm industries employed 7,000 fewer workers this quarter. The number of non-farm jobs decreased from 242,100 in the second quarter to 235,100 in the third quarter of 2010. Similarly, non-farm industries employed 2,600 fewer workers this quar-ter than four quarters ago. A wide range of industries added jobs this quarter: oil and gas extraction, residential logging, manufacturing, construction, transportation, warehousing and utilities, leisure and hospitality, and Department of Defense. In contrast, several industries reduced employment: whole-sale trade, retail trade, professional and business ser-vices, finance and insurance, educational services, fed-eral government (excluding Department of Defense), state government education, local government education, and city and county government agencies.
Tracking (Continued from page 6)
(Continued on page 8)
Unemployment Rate of Cities Location Unemployment
Rate (%) Location Unemployment
Rate (%) Ridgecrest 9.0 Mojave 17.3 Tehachapi 9.9 Lake Isabella 18.3 Bakersfield 11.0 Shafter 26.8 California City 12.3 Lamont 26.9 Rosamond 12.9 Wasco 28.6 Frazier Park 13.7 McFarland 27.8 Taft 15.2 Delano 37.1 Oildale 16.3 Arvin 38.3
Note: City-level data are not adjusted for seasonality and “informal” market workers.
7
Informal Employment - Informal employment is the difference between total employment and industry em-ployment. It accounts for self-employed workers and those who work outside their county of residence. In the third quarter of 2010, the number of informal workers increased by 500 from 38,710 to 39,210. The informal labor market offered 1,600 more jobs this quarter relative to the third quarter of last year.
Private-sector Employment - Nonfarm employment is comprised of private-sector employment and public-sector employment. In the third quarter of 2010, private companies added 200 jobs as their employment in-creased from 178,300 to 178,500. However, the private sector offered 1,600 fewer jobs this quarter than four quarters ago.
Public-sector Employment - The public sector consists of federal, state, and local government agencies. The local government labor market includes county and city agencies and public education. In the third quarter of 2010, employment in government agencies declined by 7,200 from 63,800 to 56,600. Likewise, the public sector employed 1,000 fewer workers this quarter relative to four quarters ago.
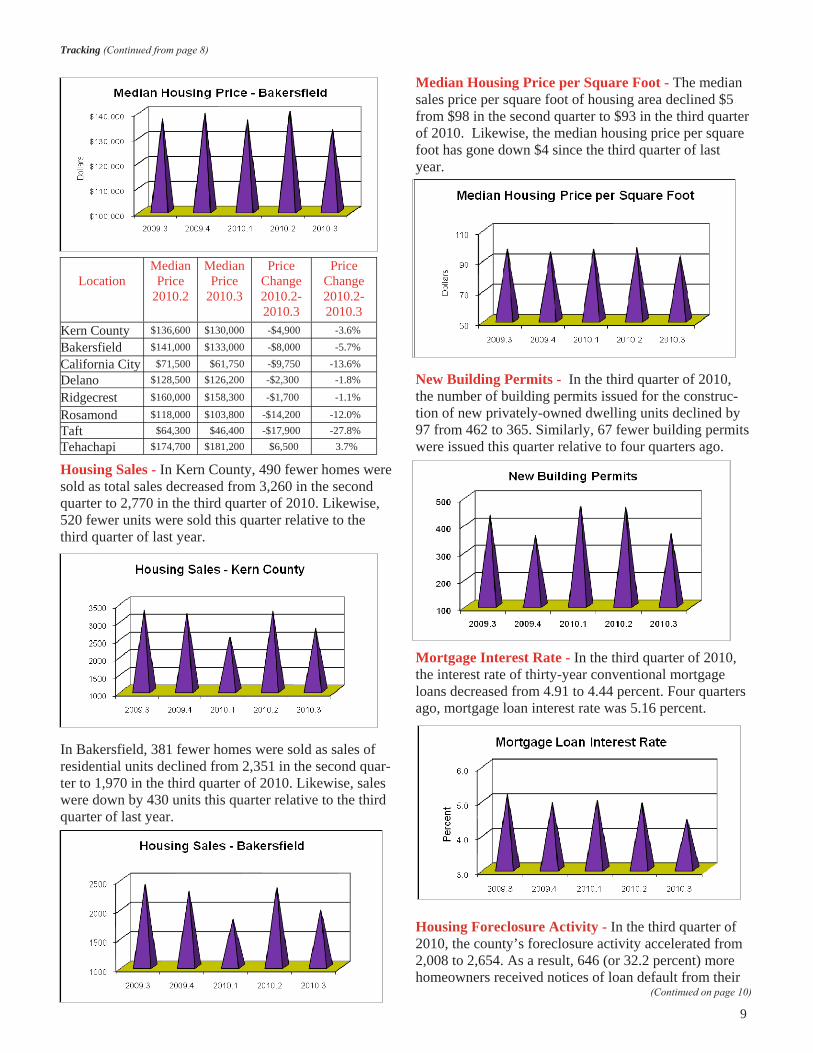
Housing Market Housing Price - In the third quarter of 2010, Kern County’s housing market conditions deteriorated. The median sales price for all residential units depreciated $4,900 (or 3.6 percent) from $136,600 to $131,700. Similarly, the county’s median housing price was $300 (or 0.2 percent) lower than that of four quarters ago.
In Bakersfield, the median housing price depreciated $8,000 (or 5.7 percent) from $141,000 to $133,000. Likewise, the city’s median housing price was $4,200 (or 3.1 percent) lower than that of four quarters ago. Housing price changes varied across the county. Among selected locations shown below, the median sales price depreciated in Bakersfield, California City, Delano, Ridgecrest, Rosamond, and Taft. Only in Tehachapi, the median housing price appreciated.
Tracking (Continued from page 7)
(Continued on page 9)
8
Housing Sales - In Kern County, 490 fewer homes were sold as total sales decreased from 3,260 in the second quarter to 2,770 in the third quarter of 2010. Likewise, 520 fewer units were sold this quarter relative to the third quarter of last year.
In Bakersfield, 381 fewer homes were sold as sales of residential units declined from 2,351 in the second quar-ter to 1,970 in the third quarter of 2010. Likewise, sales were down by 430 units this quarter relative to the third quarter of last year.
Median Housing Price per Square Foot - The median sales price per square foot of housing area declined $5 from $98 in the second quarter to $93 in the third quarter of 2010. Likewise, the median housing price per square foot has gone down $4 since the third quarter of last year.
New Building Permits - In the third quarter of 2010, the number of building permits issued for the construc-tion of new privately-owned dwelling units declined by 97 from 462 to 365. Similarly, 67 fewer building permits were issued this quarter relative to four quarters ago.
Mortgage Interest Rate - In the third quarter of 2010, the interest rate of thirty-year conventional mortgage loans decreased from 4.91 to 4.44 percent. Four quarters ago, mortgage loan interest rate was 5.16 percent.
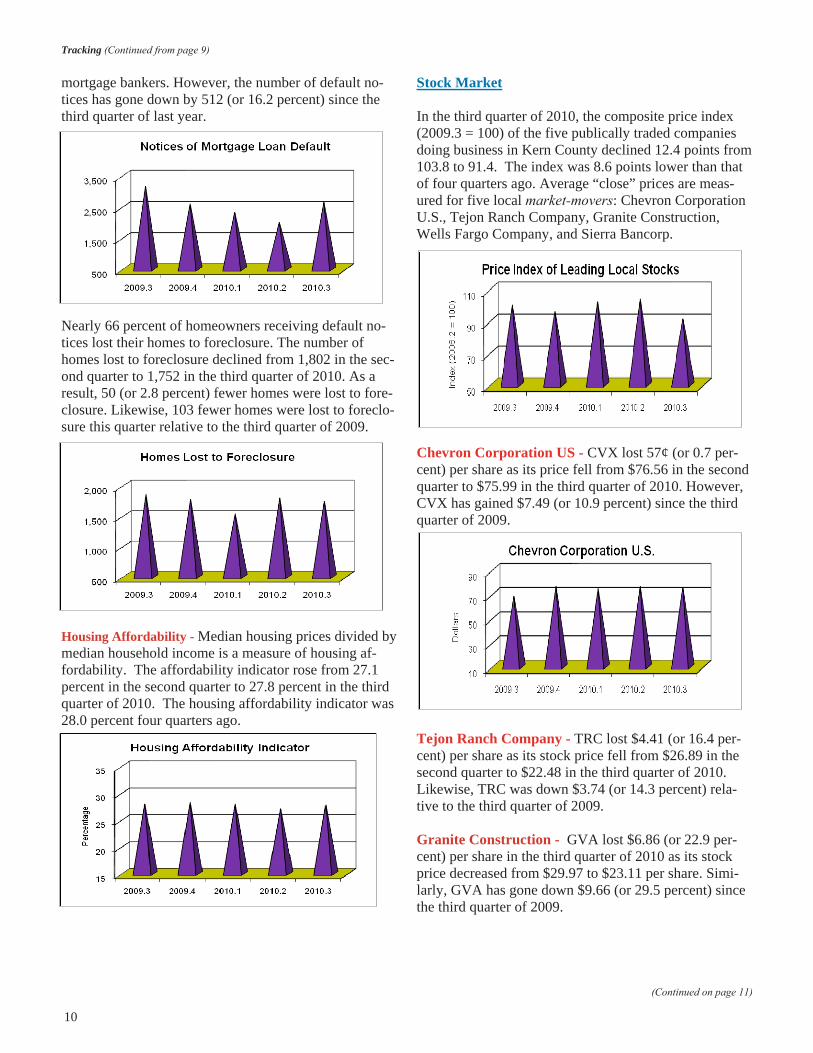
Housing Foreclosure Activity - In the third quarter of 2010, the county’s foreclosure activity accelerated from 2,008 to 2,654. As a result, 646 (or 32.2 percent) more homeowners received notices of loan default from their
mortgage bankers. However, the number of default no-tices has gone down by 512 (or 16.2 percent) since the third quarter of last year.
Nearly 66 percent of homeowners receiving default no-tices lost their homes to foreclosure. The number of homes lost to foreclosure declined from 1,802 in the sec-ond quarter to 1,752 in the third quarter of 2010. As a result, 50 (or 2.8 percent) fewer homes were lost to fore-closure. Likewise, 103 fewer homes were lost to foreclo-sure this quarter relative to the third quarter of 2009.
Housing Affordability - Median housing prices divided by median household income is a measure of housing af-fordability. The affordability indicator rose from 27.1 percent in the second quarter to 27.8 percent in the third quarter of 2010. The housing affordability indicator was 28.0 percent four quarters ago.
Stock Market In the third quarter of 2010, the composite price index (2009.3 = 100) of the five publically traded companies doing business in Kern County declined 12.4 points from 103.8 to 91.4. The index was 8.6 points lower than that of four quarters ago. Average “close” prices are meas-ured for five local market-movers: Chevron Corporation U.S., Tejon Ranch Company, Granite Construction, Wells Fargo Company, and Sierra Bancorp.
Chevron Corporation US - CVX lost 57¢ (or 0.7 per-cent) per share as its price fell from $76.56 in the second quarter to $75.99 in the third quarter of 2010. However, CVX has gained $7.49 (or 10.9 percent) since the third quarter of 2009.
Tejon Ranch Company - TRC lost $4.41 (or 16.4 per-cent) per share as its stock price fell from $26.89 in the second quarter to $22.48 in the third quarter of 2010. Likewise, TRC was down $3.74 (or 14.3 percent) rela-tive to the third quarter of 2009. Granite Construction - GVA lost $6.86 (or 22.9 per-cent) per share in the third quarter of 2010 as its stock price decreased from $29.97 to $23.11 per share. Simi-larly, GVA has gone down $9.66 (or 29.5 percent) since the third quarter of 2009.
Tracking (Continued from page 9)
(Continued on page 11)
10
Wells Fargo Company - WFC lost $4.30 (or 14.2 percent) per share as its stock price fell from $30.38 in the second quarter to $26.08 in the third quarter of 2010. Relative to four quarters ago, WFC was down 41¢ (or 1.5 percent) per share.
Sierra Bancorp - BSRR lost 91¢ (or 7.2 percent) per share as its price declined from $12.67 in the second quarter to $11.76 in the third quarter of 2010. Similarly, BSRR has gone down $1.12 (or 8.7 percent) since the third quarter of 2009.
Inflation Cost of Living - The Consumer Price Index for all ur-ban areas (1982-84 = 100) inclined from 217.2 in the second quarter to 218.0 in the third quarter of 2010. As a result, inflation for the cost of living accelerated at an annual rate of 1.5 percent. The cost of living inflation rate was -0.7 percent last quarter and 3.6 percent four quarters ago.
Cost of Producing - The Producer Price Index for all commodities (1996 =100) climbed from 182.3 in the sec-ond quarter to 184.6 in the third quarter of 2010. The inflation rate for the cost of producing accelerated at a slow annualized rate of 0.7 percent. The cost of produc-ing inflation rate was 5.0 percent last quarter and 6.7 per-cent four quarters ago.
Cost of Employment - The Cost of Employment Index (December 2005 = 100) increased from 112.4 in the sec-ond quarter to 112.8 in the third quarter of 2010. The cost of employment inclined at an annual rate of 1.6 per-cent, 0.4 percent lower than that of the previous quarter, but 0.1 percent higher that of four quarters ago.
Tracking (Continued from page 10)
(Continued on page 12)
11
Commodity Prices Price of Oil - The average price of San Joaquin Valley heavy crude oil decreased 35¢ (or 0.5 percent) per barrel from $70.14 in the second quarter to $69.79 in the third quarter of 2010. However, the average price of crude oil was up $9.61 (or 16.0 percent) per barrel relative to the third quarter of 2009.
Price of Gasoline - In the Bakersfield metropolitan area, the average retail price of regular unleaded gasoline fell 13¢ (or 4.3 percent) per gallon from $3.04 in the second quarter to $2.91 in the third quarter of 2010. Compared with the third quarter of last year, the average gasoline price was down 17¢ (or 5.5 percent).
Price of Milk - The average price of California’s Class III milk increased $1.75 (or 13.1 percent) per cwt from $13.31 in the second quarter to $15.06 in the third quar-ter of 2010. Likewise, the unit price of milk has gone up $3.97 (or 35.8 percent) since the third quarter of 2009.
Farm Prices - In the third quarter of 2010, the national Index of Prices Received by Farmers for all farm prod-ucts (1990-92 = 100) climbed 7 points to arrive at 146. Likewise, the index was 17 points higher than that of four quarters ago.
The national Index of Prices Paid by Farmers for com-modities, services, interest, taxes, wages, and rents dropped 1 point to reach 182. However, the index value was 6 points higher than that of four quarters ago.
We measure the Index of Farm Price Parity as the ratio Index of Prices Received to the Index of Prices Paid. In the third quarter of 2010, the gap between prices paid and prices received narrowed to 80 from 76. Likewise, the gap between prices farmers paid and prices farmers received narrowed 4 points since the third quarter of 2009.
Tracking (Continued from page 11)
12
ment (excluding Department of Defense), state gov-ernment education, local government education, and city and county government agencies. When adjusted for seasonal variations, the rate of unemployment declined from 15.5 to 14.9 percent. Still below the county average, the rate of unem-ployment averaged 11.0 percent in Bakersfield, 12.3 percent in California City, 9.0 percent in Ridgecrest, and 9.9 percent in Tehachapi. In the third quarter of 2010, housing market conditions deteriorated. The county’s median sales price for all resi-dential units depreciated $4,900 (or 3.6 percent) from $136,600 to $131,700. In Bakersfield, the median hous-ing price plunged $8,000 (or 5.7 percent) from $141,000 to $133,000. In addition, the number of housing units sold decreased from 3,260 to 2,770 in Kern County and from 2,351 to 1,970 in Bakersfield. The number of building permits issued for the construc-tion of new privately-owned dwelling units declined from 462 to 365. The housing affordability indicator im-proved from 27.1 to 27.8 percent. The county’s foreclo-
sure activity had mixed results. While, 646 more home-owners received notices of loan default, 50 fewer homes were lost to foreclosure. In commodity markets, the average price of San Joaquin Valley heavy crude oil went down 35¢ per barrel from $70.14 to $69.79. In the Bakersfield metropolitan area, the average retail price of regular unleaded gasoline per gallon fell 13¢ per gallon from $3.04 to $2.91. The unit price of California’s Class III milk edged up $1.75 from $13.31 to $15.06. The index of prices farmers received for their outputs rose 7 point to reach 146, while the in-dex of prices farmers paid for their inputs declined 1 point to arrive at 182. As a result, the parity between out put prices farmers received and input prices farmers paid narrowed 4 points to reach 80. The composite price index (2009.3=100) of the top five locally traded stocks declined 12.4 points from 103.8 to 91.4. In the third quarter of this year, the average stock prices declined for Chevron Corporation U.S., Tejon Ranch Company, Wells Fargo Company, Granite Con-struction, and Sierra Bancorp.
At a Glance (Continued from page 2)
13
• Assistance with marketing and advertising, including websites and social media • Help with small business loan applications The partnership will also have several positive benefits for CSUB: • Help CSUB meet its vision to have greater community engagement • Deepen academic programs in the School of Business and Public Administration by offering authentic experiences
to faculty and students to assist real-life businesses • Enhance networking, internship and work experience for CSUB students, strengthening their competiveness in the
job market Background: UC Merced provides regional guidance to the SBDCs within the 15-county area of Central California. CSUB joins two other CSUs, Fresno State and Monterey Bay, in hosting a full-service SBDC within the UC Merced Regional Network. SBDCs must fund 50 percent of their annual operating budget through community support and in-kind services while the SBA will fund the other 50 percent. UC Merced is offering office space in University Square free of charge for two years, after which CSUB may consider moving the center to its campus at 9001 Stockdale Highway. SBDC staff will report to CSUB's School of Business and Public Administration. John Pryor is getting the Center off the ground as interim director. The school hopes to hire a permanent director by the end of 2010.
SBDC (Continued from page 1)
California State University, Bakersfield
School of Business and Public Administration
Enterprise College: Economics for Future LeadersEnterprise College: Economics for Future LeadersEnterprise College: Economics for Future Leaders
● High school juniors with GPA of 3.0 of better ● College credit for The Economic Way of Thinking ● High school credit for the senior year economics course