This may be the author’s version of a work that was submitted/accepted for publication in the following source: Cheng, Hongfei, Hou, Xinjuan, Liu, Qinfu, Li, Xiaoguang, & Frost, Ray (2015) New insights into the molecular structure of kaolinite - methanol intercala- tion complexes. Applied Clay Science, 109 - 110, pp. 55-63. This file was downloaded from: https://eprints.qut.edu.au/84514/ c Consult author(s) regarding copyright matters This work is covered by copyright. Unless the document is being made available under a Creative Commons Licence, you must assume that re-use is limited to personal use and that permission from the copyright owner must be obtained for all other uses. If the docu- ment is available under a Creative Commons License (or other specified license) then refer to the Licence for details of permitted re-use. It is a condition of access that users recog- nise and abide by the legal requirements associated with these rights. If you believe that this work infringes copyright please provide details by email to [email protected]License: Creative Commons: Attribution-Noncommercial-No Derivative Works 2.5 Notice: Please note that this document may not be the Version of Record (i.e. published version) of the work. Author manuscript versions (as Sub- mitted for peer review or as Accepted for publication after peer review) can be identified by an absence of publisher branding and/or typeset appear- ance. If there is any doubt, please refer to the published source. https://doi.org/10.1016/j.clay.2015.03.010
Transcript
This may be the author’s version of a work that was submitted/acceptedfor publication in the following source:
Cheng, Hongfei, Hou, Xinjuan, Liu, Qinfu, Li, Xiaoguang, & Frost, Ray(2015)New insights into the molecular structure of kaolinite - methanol intercala-tion complexes.Applied Clay Science, 109 - 110, pp. 55-63.
This file was downloaded from: https://eprints.qut.edu.au/84514/
This work is covered by copyright. Unless the document is being made available under aCreative Commons Licence, you must assume that re-use is limited to personal use andthat permission from the copyright owner must be obtained for all other uses. If the docu-ment is available under a Creative Commons License (or other specified license) then referto the Licence for details of permitted re-use. It is a condition of access that users recog-nise and abide by the legal requirements associated with these rights. If you believe thatthis work infringes copyright please provide details by email to [email protected]
Notice: Please note that this document may not be the Version of Record(i.e. published version) of the work. Author manuscript versions (as Sub-mitted for peer review or as Accepted for publication after peer review) canbe identified by an absence of publisher branding and/or typeset appear-ance. If there is any doubt, please refer to the published source.
New insights into the molecular structure of kaolinite-methanol intercalation complexes
Hongfei Cheng a,b, Xinjuan Hou c, Qinfu Liu b•, Xiaoguang Li b, Ray L. Frost d,* a State Key Laboratory of Coal Resources and Safe Mining, China University of Mining & Technology, Beijing 100083, P.R.
China b School of Geoscience and Surveying Engineering, China University of Mining & Technology, Beijing 100083, P.R. China c Institute of Process Engineering , Chinese Academy of Sciences, Beijing 100080,P.R.China
d School of Chemistry, Physics and Mechanical Engineering, Science and Engineering Faculty, Queensland University of
Technology, 2 George Street, GPO Box 2434, Brisbane, Queensland 4001, Australia
New insights into the molecular structure of kaolinite-methanol intercalation complexes
Hongfei Cheng a,c, Xinjuan Hou b, Qinfu Liu a•, Xiaoguang Li a, Ray L. Frost d,* a School of Geoscience and Surveying Engineering, China University of Mining & Technology, Beijing 100083, P.R. China b Institute of Process Engineering , Chinese Academy of Sciences, Beijing 100080,P.R.China c State Key Laboratory of Coal Resources and Safe Mining, China University of Mining & Technology, Beijing 100083, P.R. China d School of Chemistry, Physics and Mechanical Engineering, Science and Engineering Faculty, Queensland University of Technology, 2 George Street,
GPO Box 2434, Brisbane, Queensland 4001, Australia
Abstract A series of kaolinite-methanol complexes with different basal spacings were synthesized using guest
displacement reactions of the intercalation precursors kaolinite-N-methyformamide (Kaol-NMF), kaolinite-urea (Kaol-U),
or kaolinite-dimethylsulfoxide (Kaol-DMSO), with methanol (Me). The interaction of methanol with kaolinite was
examined using X-ray diffraction (XRD), infrared spectroscopy (IR), and nuclear magnetic resonance (NMR). Kaolinite
(Kaol) initially intercalated with N-methyformamide (NMF), urea (U), or dimethylsulfoxide (DMSO) before subsequent
reaction with Me formed final kaolinite-methanol (Kaol-Me) complexes characterized by basal spacing ranging between
8.6 Å and 9.6 Å, depending on the pre-intercalated reagent. Based on a comparative analysis of the three Kaol-Me
displacement intercalation complexes, three types of Me intercalation products were suggested to have been present in
the interlayer space of Kaol: (1) molecules grafted onto a kaolinite octahedral sheet in the form of a methoxy group
(Al-O-C bond); (2) mobile Me and/or water molecules kept in the interlayer space via hydrogen bonds that could be
partially removed during drying; and (3) a mixture of types 1 and 2, with the methoxy group (Al-O-C bond) grafted onto
the Kaol sheet and mobile Me and/or water molecules coexisted in the system after the displacement reaction by Me.
Various structural models that reflected four possible complexes of Kaol-Me were constructed for use in a
complimentary computational study. Results from the calculation of the methanol kaolinite interaction indicate that the
hydroxyl oxygen atom of methanol plays the dominant role in the stabilization and localization of the molecule
intercalated in the interlayer space, and that water existing in the intercalated Kaol layer is inevitable.
Keywords kaolinite, methanol, intercalation complex, structural model
Intercalation complexes of Kaol with DMSO and NMF were prepared using the method described by Tunney and
Detellier (1993, 1996). Kaol-DMSO intercalation complex as the precursor was prepared by adding 50 g Kaol into a
closed container that contained 90 ml DMSO and 10 ml deionized water, and Kaol-NMF intercalation complex was
prepared by adding 50 g Kaol into a closed container that contained 90 ml NMF and 10 ml deionized water. The mixture
was stirred with the magnetic stirrer at 60 °C for 12 h, and then the suspension was separated by centrifugation with ethyl
alcohol. The intercalation complex of Kaol with urea was prepared using the method by Frost et al.(2000). Kaol-U
intercalation complex as the intermediate was prepared by adding 50 g Kaol into a closed container that 100 ml urea
saturated solution. The mixture was stirred with the magnetic stirrer at 60 °C for 12 h, and then the suspension was
separated by centrifugation with ethyl alcohol. The Kaol-DMSO, Kaol-NMF and Kaol-U intercalates were used as
precursors for further intercalation with Me. Me was added to the pre-intercalation complexes (Kaol-DMSO, Kaol-NMF
and Kaol-U) and the reaction mixtures were stirred for ten days replacing the Me with fresh Me each day. The resulting
materials are noted Kaol-DMSO-Me, Kaol-NMF-Me, and Kaol-U-Me derived respectively from the Kaol-DMSO,
Kaol-NMF and Kaol-U pre-intercalation complexes reacted with Me. Following these steps, the reaction products were
centrifuged and then allowed to dry at room temperature before subsequent XRD, FTIR, and NMR analysis.
2.3.Characterization
X-ray diffraction (XRD). The XRD patterns of the prepared samples were collected using a Rigaku D/max 2500 PC
powder X-ray diffraction meter with Cu Ka radiation of 1.540596 Å and a scanning rate of 2°/min in the 2θ range of
1.0-45°, while operating at 40 kV and 150 mA.
Infrared spectroscopy. Fourier-transform infrared spectroscopy (FTIR) was performed using a Thermofisher Nicolet
6700 spectrometer. The samples were prepared as potassium bromide (KBr) pellets (ca. 2% by mass in KBr). The FTIR
spectra of prepared samples were recorded between 400 and 4000 cm-1.
6
Solid state magic-angle spinning (MAS) nuclear magnetic resonance (NMR) measurement. Solid-state 1H NMR
spectra were recorded using a Bruker MSL400 spectrometer with a Larmor frequency of 61.42 MHz. A quadrupole echo
pulse sequence was used, with a 90° pulse width of 2.5 µs and a 15 µs pulse interval between the two pulses. Solid-state
13C CP (cross-polarization)/MAS (magic-angle-spinning) NMR measurements were performed using Bruker ASX400
(magnetic field of 9.4 T) and ASX200 (4.7 T) spectrometers with Larmor frequencies of 100.63 and 50.33 MHz,
respectively. The sample spin rate was 5 kHz. 2000 data points were recorded over a spectral width of 500 ppm.
Transients were acquired using a recycle delay of 1 s until a sufficient signal-to-noise ratio had been achieved (ranging
from -250 to 250 ppm).
2.4.Computational Details
The primitive unit cell of Kaol was optimized using the generalized gradient approximation (GGA) for the
exchange-correlation potential (PW91) (Perdew et al., 1996). This approach is appropriate for the relatively weak
interactions present in the models studied (Martorell et al., 2010). The resulting primitive unit cell is characterized by the
parameters a = 10.384Å, b = 18.013 Å, c=7.434 Å, and α=91.7°, β=105.3°, γ = 89.8°. Based on this primitive unit cell, a
series of (2×2×1) supercells were built with the basal spacing of layers set to 8.6 Å, 8.8 Å, or 9.6 Å.
Four structural models that reflect four possible models of Kaol-Me complexes were constructed for use in the
computational study. The first model represents Kaol intercalated by one Me molecule (Kaol-Me). The second model
represents Kaol intercalated by one Me and one water molecule simultaneously (Kaol-Me-W). The third model
represents Kaol with one grafted methoxy group (Kaol-gMeO). The forth model represents Kaol with one grafted
methoxy group as well as one intercalated water (Kaol-gMeO-W). In order to investigate the intercalation mechanism of
Me into a pure Kaol layer, a simulated annealing algorithm was used to perform canonical Monte Carlo (MC)
simulations with one Me and one water molecule as adsorbates on the layer of pure Kaol. The d(001) values were 8.6 Å,
7
8.8 Å, and 9.6 Å. For Kaol-gMeO and Kaol-Me-W, MC simulation was firstly performed with one Me or both one Me
and one water molecule as adsorbate. The adsorption behavior was modeled using the Universal force field (Rappe et al.,
1992). The number of cycles was 3 and the step of one cycle was 106, a representative piece of the interface devoid of
any arbitrary boundary effects. Based on the preferential adsorption models of Me and water in the layer of Kaol
predicted by the MC calculation, GGA-PW91 was used to further optimize the structure and predict the interaction
energy between the Me and the Kaol complex with greater accuracy. Results from an earlier DFT study suggested that
the Al surface of Kaol exhibits two types of hydroxyl groups: one with the –OH group oriented perpendicular to the
surface (-OHv), and the other with the –OH group oriented parallel to the surface (OHl). In the model of Kaol-gMeO and
Kaol-gMeO-W, these two positions of Me grafting, –OHv and –OHl respectively, were considered. The GGA-PW91
calculations were performed using a double numerical plus polarization function (DNP) as the basis set and a DFT-D
correction. In all of the calculations, the heavy atoms of Kaol were frozen, while the hydrogen of Kaol, and the Me and
water molecules were fully relaxed.
3. Results and discussion
3.1.XRD results
The XRD patterns collected for both original Kaol and the intercalation complexes are shown in Fig. 1. The pattern
measured for the original Kaol displays a typical and well-ordered layer structure with a basal spacing (d001) of 7.2 Å.
This value matches well with the standard ICDD reference pattern 14-0164 (kaolinite, Al2Si2O5(OH)4). It is expected that
during the filling of capillaries used for X-ray diffraction studies, both Kaol and intercalated phases will align along the
c-axis due to their plate-like particle shapes (White et al., 2011). The intercalation of Kaol with DMSO, NMF, or U
expands the structure along the c-axis, resulting in the dominant (001) reflection appearing at 11.2, 10.7, and 10.9 Å
respectively, in agreement with previous XRD investigations on Kaol intercalation complexes (Lapides and Yariv, 2009;
Li et al., 2009; Mako et al., 2009; Rutkai et al., 2009; Tonle et al., 2009; Hirsemann et al., 2011; Cheng et al., 2012b;
8
Matusik et al., 2012a;Caglar et al., 2013). When Kaol-DMSO was used as an intermediate, a reflection at 11.2 Å was
observed, indicative of the DMSO intercalation into the interlamellar spaces of Kaol (Elbokl and Detellier, 2009). The
intercalation of Me into the interlamellar spaces of Kaol-DMSO was clearly observed by a shift of the (001) reflection to
the lower angles 2θ=9.14° (d(001)=9.6 Å) upon displacement. A recent investigation by Matusik et al. (Matusik et al.,
2012a) reported that Kaol-DMSO-Me sample was dried at 110 °C the reflection with d=11.2 Å disappeared and a broad
reflection with maximum at 9.5 Å was observed. These authors (Matusik et al., 2012a) also reported that the chemical
formula of Kaol-DMSO intercalation complex was calculated to be Al2Si2O5(OH)3.20(OCH3)0.80 on the basis of CHNS
analysis. Based on this formula, results showed that about 1/3 of the inner surface OH groups were replaced by methoxy
groups, in agreement with previous reports (Tunney and Detellier, 1996). This observation suggests the formation of a
Kaol-Me intercalation complex. Upon direct intercalation of NMF into the interlamellar spacing of Kaol, a very strong
peak with the distance of 10.7 Å is observed at 8.23(2θ), and corresponds to the newly formed diffraction plane. The
other d(001) and d(002) diffraction peaks of Kaol are positioned at 12.37(2θ) and 24.87(2θ) with the distances of 7.2 and 3.6
Å, respectively, in agreement with previous data reported in the literature (Komori et al., 1999; Caglar, 2012). After the
treatment of Kaol-NMF with Me, the basal spacing decreased to 8.6 Å. This is in opposition to research completed by
Komori and Sugahara (1998), which reported that when Kaol-NMF was treated with Me, the d-spacing slightly increased
to 11.1 Å, with this value obtained only when the sample was stored under wet conditions with Me. These opposing
results indicate that the resulting Kaol-Me made from Kaol-NMF as the starting material is inherently unstable. In the
case of Kaol initially intercalated by U, the observed 10.9 Å d-value corresponds to a 3.7 Å expansion as compared to
original Kaol. This value is indicative of a flattened monolayer arrangement of U molecules intercalated into the
interlamellar space (Letaief et al., 2006). Upon the intercalation of Me, the 10.9 Å d (001) peak characteristic of Kaol-U
was fully replaced by a new peak at 8.8 Å. This decrease in d-value indicates a different organization of Me in the
interlamellar space of Kaol as compared to final complexes made using DMSO or NMF as intermediate intercalates.
9
After treatment of the pre-intercalate Kaol complexes with Me, the pre-intercalate reagents (DMSO, NMF, and U) were
removed from the interlayer space of Kaol through a concerted replacement by Me. In summary, the d(001) value were
9.6 Å for Kaol-DMSO-Me, 8.6 Å for Kaol-NMF-Me, and 8.8 Å for Kaol-U-Me, compared with recorded values in this
case of 11.2 Å for the starting material (Kaol-DMSO), 10.7 Å for Kaol-NMF, and 10.9 Å for Kaol-U. These correspond
to interlamellar distances of 2.4 Å, 1.4 Å, and 1.6 Å, respectively, with these values obtained by subtracting a clay layer
thickness of 7.2 Å from the observed d(001) values for Kaol. These values are indicative of the various arrangements of
Me molecules between Kaol layers. During the process of intercalation, a fraction of the organic cations is intercalated
while another fraction is covalently linked to the aluminol surfaces. The relationship between Kaol-Me complexes
(Kaol-DMSO-Me 9.6 Å phase, Kaol-NMF-Me 8.6 Å phase, and Kaol-U-Me 8.8 Å phase) and pre-intercalation
complexes (Kaol-DMSO, Kaol-NMF, and Kaol-U) is thought to be related to Me molecules having different angles
between Kaol layers.
It has been reported that an increase of structural disorder led to an obvious weakening of reflections 11l and 02l (2θ
between 17 and 27°), which were replaced by a broad peak indicative of scattering with weak modulations (Hinckley,
1963; Frost et al., 1998a, 1998b). This disorder is due to the intercalation molecules breaking the hydrogen bonding
between adjacent Kaol layers. The intercalation of molecules into Kaol causes the expansion of the Kaol layers in the c
direction, and results in significant changes to the Kaol surface properties. For example, intercalation can cause an
increase in surface areas and provide more surface hydroxyl, which are now more readily available for chemical
reactions. When the Kaol was first intercalated with DMSO, NMF, or U and then reacted with Me, a new product was
formed which is characterized by a basal spacing ranging between 8.6 Å and 9.6 Å, depending on the pre-intercalated
reagent. Tunney and Detellier (1996) reported that water is formed as a byproduct during the reaction and the intercalated
guest species (DMSO or NMF) are expelled during the course of reaction. However, the work of Matusik et al (2012b)
was the only investigation to propose that two types of Me molecule arrangements existed in the interlayer space in the
10
wet state: (1) molecules grafted to an octahedral sheet in the form of a methoxy group (Al-O-C bond); and (2) mobile Me
and/or water molecules kept in the interlayer space via hydrogen bonds that can be partially removed during drying.
3.2.Infrared spectroscopy
IR analysis of Kaol intercalation complexes is useful for understanding the mechanism of the intercalation reaction
and the structural arrangement of intercalated molecules in the interlayer of Kaol (Ledoux and White, 1964; Frost et al.,
1998b, 2000a, 2000b). The IR spectra for the original Kaol, Kaol-DMSO, Kaol-NMF, Kaol-U, Kaol-DMSO-Me,
Kaol-NMF-Me, and Kaol-U-Me was present in Fig.2. Ledoux and White (1964) reported that the unit cell of Kaol shows
the existence of four hydroxyl groups. One hydroxyl group, termed the inner hydroxyl, lies in the ab plane and points
toward the apical oxygen, the bridging atom between the siloxane and gibbsite-like surface. These inner hydroxyls refer
to the OH groups in the plane common to the octahedral and tetrahedral sheets and to OH groups at 4.4 Å, all having
their dipoles directed towards an empty octahedral site. The other three hydroxyl groups, termed the inner surface
hydroxyl groups, lie at angles between 65° and 73° to the ab plane, point away from the surface, and hydrogen bond to
the oxygens of the next adjacent siloxane layer. Inner surface hydroxyls refer to OH groups located at the surface of the
octahedral sheets opposite the tetrahedral oxygen molecules of the adjacent Kaol layer and having their OH dipole
normal or nearly normal to the (001) plane. In terms of spectroscopy, these hydroxyls function as in-phase and
out-of-phase vibrations. Four distinct bands are observed in the infrared spectrum of the original Kaol at 3621, 3650,
3668, and 3696 cm-1. The three higher frequency bands (3696, 3668, and 3650 cm-1) are assigned to OH stretching modes
of the three inner surface hydroxyl groups. The band at 3621 cm-1 is attributed to the stretching frequency of the inner
hydroxyl groups of Kaol that are aligned parallel to the direction of the (001) layers and towards the unoccupied
octahedral hole. After DMSO intercalation, the bands observed at 3538 and 3503 cm-1 are assigned to the stretching
frequency of coupled inner-surface hydroxyl groups that are perpendicular to the (001) plane and hydrogen-bonded to
11
DMSO molecules in the interlamellar space. Duer et al. (1992) reported that the bands at 3662, 3538, and 3503 cm-1 can
be attributed to the formation of moderately strong hydrogen bonds between some of the inner surface hydroxyls facing
the interlayer space of Kaol and the sulfonyl oxygen. After displacement of DMSO by Me, the disappearance of the two
bands at 3538 and 3503 cm-1 and the appearance of two bands at 3600 and 3550 cm-1 were observed. However, it is
worth noting that the band 3550 cm-1 is due to the formation of hydrogen bonds between some of the inner surface
hydroxyls and intercalated Me molecules. Upon intercalation of NMF molecules, bands were observed at 3678 and 3419
cm-1, and are assigned to hydrogen-bonded OH stretching and NH stretching, respectively. The band at 3419 cm-1
originates from the formation of hydrogen bonds between NMF and the inner surface hydroxyl groups of Kaol (Caglar et
al. 2013). After displacement intercalation of Kaol-NMF with Me, the above two bands are no longer observed, and a
band at 3550 cm-1 is detected. These changes indicate that the hydrogen bonding pattern varied based on Me treatment. In
the case of Kaol-U, new bands at 3410 and 3380 cm-1 are assigned to the asymmetric and symmetric NH2 stretching
frequencies, and the band observed at 3503 cm-1 are correlated with the H bonding between the NH2 groups and the O in
the tetrahedral sheet. As a result of displacement intercalation by Me, the characteristic bands at 3410 and 3380 cm-1 for
Kaol-U disappeared and the band assigned to hydrogen bonded OH stretching was detected at 3550 cm-1. The appearance
of the new band indicates the formation of characteristic hydrogen bonding between Me and Kaol. Based on a
comparative analysis of the three Kaol-Me displacement intercalation complexes Kaol-DMSO-Me, Kaol-NMF-Me, and
Kaol-U-Me, three types of Me molecule arrangements are suggested to be present in the interlayer space of Kaol: (1)
molecules grafted to an octahedral sheet in the form of methoxy groups (Al-O-C bond); (2) mobile Me and/or water
molecules kept in the interlayer space via hydrogen bonds that can be removed partially during drying; and (3) a
combination of cases 1 and 2, with both methoxy groups (Al-O-C bond) grafted in and mobile Me and/or water
molecules coexisting in the system after the displacement reaction by Me. The intensity of the inner surface hydroxyl
bands decrease significantly upon intercalation, indicating the insertion of intercalating molecules into the layers. At the
12
same time, the inner hydroxyl bands are broader after the displacement reaction, indicating a disturbance of the inner
hydroxyl group.
The presence of a band at 1658 cm-1 for Kaol and its complexes suggests that co-intercalated water molecules are
present to some extent (Fig.2). In case of Kaol-DMSO-Me, the observed band at 1631 cm-1 indicates that water molecules
were also adsorbed on the surface in addition to being co-intercalated. Furthermore, the bands in this region provide
information regarding any perturbations to Kaol lattice vibrations (1150-1000 cm-1) and any changes in the Al-O-H
bending modes of Kaol (900-980 cm-1). The two most intense vibrations of Kaol at 1039 and 1009 cm-1 remain relatively
unaffected, and are assigned to the in-plane Si-O-Si stretching vibrations of Kaol. By comparing these bands of Kaol and
its intercalation complexes, appearances and/or shifts of several bands are observed. The variations in wavenumber in
this region are complex because the lattice modes and the intercalated molecule also have some influence in this region
of the spectra (Suarez and Garcia-Romero, 2006). The intercalation reaction destroys the inherent hydrogen bonds in
Kaol and presents new bonds (Mellouk et al., 2009). Upon intercalation of NMF, a band is observed at 1682 cm-1 and is
attributed to the carbonyl stretching vibration. After reaction with Me, the intensity of this band almost disappears and a
broad band around 1658 cm-1 appears. Because it is known that most NMF molecules had been deintercalated, the band
at 1658 cm-1 was assigned to water bending vibrations, indicating that some amount of water is present in the Kaol-Me
(Komori et al., 2000). A band is also observed at 1537 cm-1, and is attributed to the NH2 bending mode. For Kaol-NMF
intercalation complex, the N-H in-plane bending vibration is observed at 1422 cm-1, and the symmetric deformation band
of the CH3 group is observed at 1381 cm-1. It has been proposed that this shift of the CH3 group bands for NMF is due to
the effects on the interlayer environment (Horváth et al., 2010). The bending vibrational band of the C-H unit in NMF
was seen to shift to 1381 cm-1 as a result of hydrogen-bonding with inner surface OH groups in the intercalation complex.
Upon intercalation of U molecules, the bands observed at 1631 and 1583 cm-1 were assigned to stretching modes of the
free and hydrogen bonded C=O group, respectively. Following the reaction with Me, a band is observed at 1658 cm-1,
13
and is assigned to water bending modes within the interlayers of Kaol (Liu et al., 2009). The fact that this band is
observed suggests that there are water molecules in the structure of intercalated Kaol, and that this complex is different
than the interlayer structure of Kaol alone. It is important to note that the spectra in this region not only provides
information about the nature of the inserted molecule, but also displays the characteristic bands of OH deformation. The
bands in the region of 1150-980 cm-1 provide information regarding any perturbations to Kaol lattice vibrations as well as
any changes in the Al-O-H bending modes of Kaol. The Kaol intercalation caused significant changes to the relative
intensities of the bands at 742 and 784 cm-1, which are typical of the OH translational vibrations. It was observed that the
intensity of the OH translational vibrational band (784 cm-1) decreased when the Kaol reacted with methanol. The bands
at 912 and 943 cm-1 have been attributed to OH bending vibrations. By comparing the original Kaol spectra to that of its
intercalation complexes, it was found that an increase in the intensity of the band at 646 cm-1 coincided with a decrease in
intensity for the band at 692 cm-1. It was reported that two strong bands at 998 and 1031 cm-1 were assigned to the
Si-O-Si in-plane vibrations, and the band occurring at 1124 cm-1 is the Si-O stretching mode (Frost, 1995).
Understanding these variations in wavenumber is complex because the lattice modes and the intercalated molecules also
have some influence on this region of the spectra (Suarez and Garcia-Romero, 2006). Based on these results, it is
proposed that the hydrogen atoms of the methyl group form hydrogen bonds with the oxygen atoms of the Si sheet for
the grafted Kaol with a spacing layer of 8.6 Å and 8.8 Å.
3.3.Solid-state 13C NMR analysis
The 13C MAS NMR spectra of Kaol and its intercalation complexes are shown in Fig. 3. No 13C signal was observed
in the spectrum of the native Kaol (not show). Two signals observed for Kaol-DMSO at 44.1 and 44.3 ppm were
attributed to the methyl group located parallel to the sheet and the methyl group keyed into the ditrigonal hole of the
silicate sheet. According to the report by Thompson (1985), the two equally intense methyl carbon resonances at 43.7 and
14
42.5 were due to nonequivalent chemical environments. This conclusion was reached because in the liquid state the two
methyl carbons are chemically equivalent. When Kaol is intercalated by DMSO the two methyl groups are held in
chemically nonequivalent position, paralleling the explanation for the two Si resonances observed in untreated Kaol. The
13C NMR spectrum of Kaol-DMSO contained two resonances at 43.1 and 44.2 ppm (Duer et al. 1992). These were
assigned to two nonequivalent 13C atoms in the same DMSO molecule: one methyl group is thought to be keyed into the
ditrigonal holes in the silicate sheet, and the other being approximately parallel to the sheet (Duer et al., 1992). An
explanation given by Thompson (1985) proposed that the two methylene carbons could be nonequivalent due to a small
difference in the C-S bond lengths, as is found in solid DMSO. However, the static 13C study of solid DMSO detected
only a single resonance at 40 ppm. Therefore, the doublet observed in the spectrum of Kaol-DMSO complex probably
does not arise from small differences in the C-S bond lengths, but rather can be assigned to two 13C resonances from two
different DMSO sites within the unit cell. For the intercalation complex Kaol-NMF, the signal at 27.2 pm can be
unambiguously attributed to the methylene carbons of the intercalated NMF molecule, while the signal at 164.5 ppm is
assigned to carbons of the carbonyl groups for the NMF molecule in the interlayer of Kaol. Xie and Hayashi (1999a,
1999b) reported that the peaks observed at 164.2 and 26.9 ppm were due to the carbonyl and methyl groups, respectively,
of the interlayer guest molecules. The author of this paper also reported that the residual NMF in the sample has chemical
shift values of 165.2 and 27.3 ppm, which are different than the values of the intercalated NMF. In the case of Kaol-U,
one signal at 162.7 ppm is observed for the carbonyl carbon of the intercalated urea molecule (Cai et al., 2006).
Upon displacement intercalation by Me, the spectrum of Kaol-DMSO-Me no longer shows the resonances
corresponding to Kaol-DMSO. A signal at 51.3 ppm, attributed to the methyl carbon of the intercalated Me molecule
(Letaief and Detellier, 2009), is the only signal observed. This result indicates that DMSO was completely replaced by
Me during the reaction process. Similarly, the disappearance of all signals for Kaol-NMF after displacement by Me
indicates that the intercalated Me is rigidly fixed in the interlamellar space of Kaol.
15
3.4.Solid-state 1H NMR analysis
1H MAS NMR studies have proven very useful for chemical structural studies of intercalated Kaol. 1H MAS NMR
spectra of Kaol and its intercalation complexes was shown in Fig. 4. Kaol has an intense peak at 4.9 ppm which is due to
the host hydroxyl protons (Xie and Hayashi, 1999a). The 1H MAS NMR spectrum of Kaol-DMSO shows a peak at 1.3
ppm with a shoulder at 3.0 ppm ascribed to the methyl 1H and the hydroxyl group for Kaol. The spectrum of Kaol-NMF
sample has a sharp central peak at 2.7 ppm caused by the methyl 1H, the peak at 4.5 ppm is attributed to the hydroxyl
group of Kaol and the signals observed at 8.1 ppm due to the HCO protons respectively of the intercalated NMF
molecules. It was previously reported that the chemical shifts observed for the amide proton in neat NMF liquid are 7.87
and 7.65 ppm, whereas the corresponding value in Kaol-NMF is observed at 8.1 ppm (Xie and Hayashi, 1999a). The 1H
isotropic chemical shift values may serve as a practical tool for analyzing hydrogen bonds, where hydrogen bonds cause
a high-frequency shift in the 1H resonance (Xie and Hayashi, 1999a). The obvious increase in the chemical shift upon
intercalation can be seen as evidence of the formation of a hydrogen bond between the amide proton and the adjacent
silica sheet of Kaol host at room temperature, as was also suggested by the crystal structure data. The spectra collected
for Kaol-U has a similar central peak at 1.4 ppm attributed to the NH protons, and a second peak at 5.8 ppm showing
evidence of the hydroxyl group of Kaol. After displacement intercalation by Me, the sample Kaol-DMSO-Me has two
peaks located at 1.4 and 3.1 ppm, which are ascribed to the methyl protons and the hydroxyl group for Kaol, respectively.
The spectrum collected for Kaol-NMF-Me sample has a peak at 1.3 ppm due to the methyl protons and a shoulder at 3.5
ppm due to the hydroxyl group for Kaol. The Kaol-U-Me sample spectrum shows signals at 1.5 due to the methyl protons,
and 5.0 ppm due to the hydroxyl group of the intercalated Kaol.
The 1H MAS NMR data for Kaol proton signals in the literature occur at a rather broad range of chemical shifts.
Wang et al. (2002) assigned signals at 2.4-3.0 ppm to the inner surface hydroxyls for Kaol. Similarly, Fitzgerald et al.
16
(1996, 1997) reported that the signal due to the pyrophyllite mineral showed a peak at 2.4 ppm, and is assigned to OH
groups in the gibbsite like AlOH layer. On the contrary, Hunger et al. (1991) reported that the 1H NMR data on Kaol
proton signals were observed at higher chemical shifts, e.g. 4.0±0.2 ppm, 5.0±0.2 ppm and 5-6 ppm. These results would
indicate that the sharper peak observed in the Kaol spectrum at 4.9 ppm could stem from the inner surface hydroxyl
proton Al-OH-Al on the exposed aluminum hydroxide basal surface of Kaol. It can be observed a broad peak at ~1.4 ppm
with a shoulder at 1.0 ppm, which might be due to the signal of mobile methanol molecules in the interlayer of Kaol.
Therefore, the signal at 4.9 ppm for the 1H NMR spectrum of Kaol should be attributed to the chemical shifts of the inner
surface hydroxyls for Kaol.
4. Computational simulations
4.1.Interaction Energies
The interaction energy (IE) of the first reaction is defined as the energy difference between the reactants Kaol and
Me and the product Kaol-Me (as shown in interaction (1) of Table 1), while for the second reaction it is defined as the
energy difference between the reactants pure Kaol, Me, and water, and the product Kaol-Me-W (as shown in interaction
(2) of Table 1). For the process of Me grafting in Kaol and the movement of formed H2O out of Kaol layer (as shown in
interaction (3) of Table 1), the IE is defined as the energy difference between the reactant Kaol and Me, and the products
grafted Kaol and isolated H2O. For the process of Me grafting in Kaol and the formed H2O remaining in Kaol layer (as
shown in interaction (4) of Table 1), the IE is defined as the energy difference between the reactants Kaol and Me, and
the products grafted Kaol and H2O within the layer. The four intercalation modes calculated based on the above criteria
with layer spacing of 8.6 Å are depicted in Figs. 5-6, while the corresponding information for Kaol complexes with layer
spacing of 8.86 and 9.6 Å are shown in supporting information.
As shown in Table 1, the IEs of the four possible reactions are ordered interaction (4) > interaction (2) > interaction
17
(3) > interaction (1), specifically; the likelihoods of the models for intercalating Me into Kaol layers are in the order
Kaol-gMeO-W > Kaol-Me-W > Kaol-gMeO > Kaol-Me. These results mean that the water existing in Kaol layer is
inevitably producing the reaction between Me and Kaol. The IR band observed at 1658 cm-1 is evidence of water bending
modes within the interlayers of Kaol. Comparing the IE of the same intercalate model with different basal spacing, it was
found that with an increase of the d(001) values, the corresponding IEs of the same reaction decreased. After comparing
these four interactions, it was noticed that the existence of H2O can dramatically increase the IE of intercalated molecules
with Kaol, specifically; water molecules can promote Me intercalation into Kaol layers. For Kaol with a spacing layer of
9.650 Å, it is almost impossible for intercalation to occur without the presence of H2O. In interactions (3) and (4), the
reaction of Me with Kaol has two possible modes: Me reacting with the –OH group oriented perpendicularly to the
surface (-OHv), or Me reacting with –OH group oriented parallel to the surface (OHl). The formation energy of the Kaol
complex in which –OCH3 substituted –OHv was seen to be much stronger than the corresponding complex where –OCH3
substituted –OHl. The –OCH3 perpendicular to the surface leads the methoxy group to make more easily formed
hydrogen bonds with the nearby surrounding atoms.
4.2.Structure
The hydrogen bonds formed between Me molecule and the surface of Kaol layers with layer spacing at 8.6 Å, 8.8 Å, and
9.6 Å are shown in Fig. 5. Me intercalated into Kaol layer through two types of interactions: (a) the interaction of the
hydroxyl oxygen atom with the surface hydroxyl groups of the octahedral Al sheet, and (b) the interaction of the methyl
group and the hydroxyl H atom of the tetrahedral Si sheet with the opposite layer. To provide a better illustration, three
figures with different views are presented for each Kaol layer in Figs. 5-6. As the distance of hydrogen bonding indicates,
the hydroxyl oxygen atom of Me molecule plays a dominant role in the stabilization and the localization of the molecule
in the interlayer space. As our infrared spectra of intercalated Kaol indicated, the band at 3550 cm-1 is due to the
formation of hydrogen bonds between some of the inner surface hydroxyls and the intercalated Me molecules. In the case
18
of Me intercalation in Kaol with a d(001) value of 8.6 Å, the hydroxyl oxygen atom forms hydrogen bonds with two
nearby upright –OH groups in the octahedral Al sheet, with the O-H⋅⋅⋅OMe distances measured at 1.632 Å and 1.688 Å,
with angles of 99.0° and 110.2°, respectively. The hydroxyl oxygen atom also forms a hydrogen bond with one lying –
OH group with an O-H⋅⋅⋅OMe distance of 2.372 Å and angle of 101.7°. As for the interaction of Me with the silicon-oxide
layer, the H atom of hydroxyl forms two hydrogen bonds with the nearby oxygens of the tetrahedral silicate with
OMe-H⋅⋅⋅O distances measured at 1.624 Å and 2.493 Å, and the angles 105.6° and 161.4°. One C-H bond in the methyl of
Me is almost vertical to the silicon-oxide layer, the hydrogen atom in this position forms hydrogen bonds with nearby
oxygens of the tetrahedral silicate, with the CMe-H⋅⋅⋅O distances of 2.524 Å, 2.642 Å, and 2.372 Å, and angles of 111.2°,
106.5°, and 101.7°, respectively. Meanwhile, the other two H atoms of the methyl groups also form hydrogen bonds with
nearby oxygens of the tetrahedral silicate with the CMe-H⋅⋅⋅O distances of 2.709 Å, 2.532 Å, and 2.383 Å, and angles of
102.2°, 92.5°, and 114.0°, respectively. These measurements make it obvious that the oxygen atom in the silicate layer is
involved in weak hydrogen bonding with Me molecule.
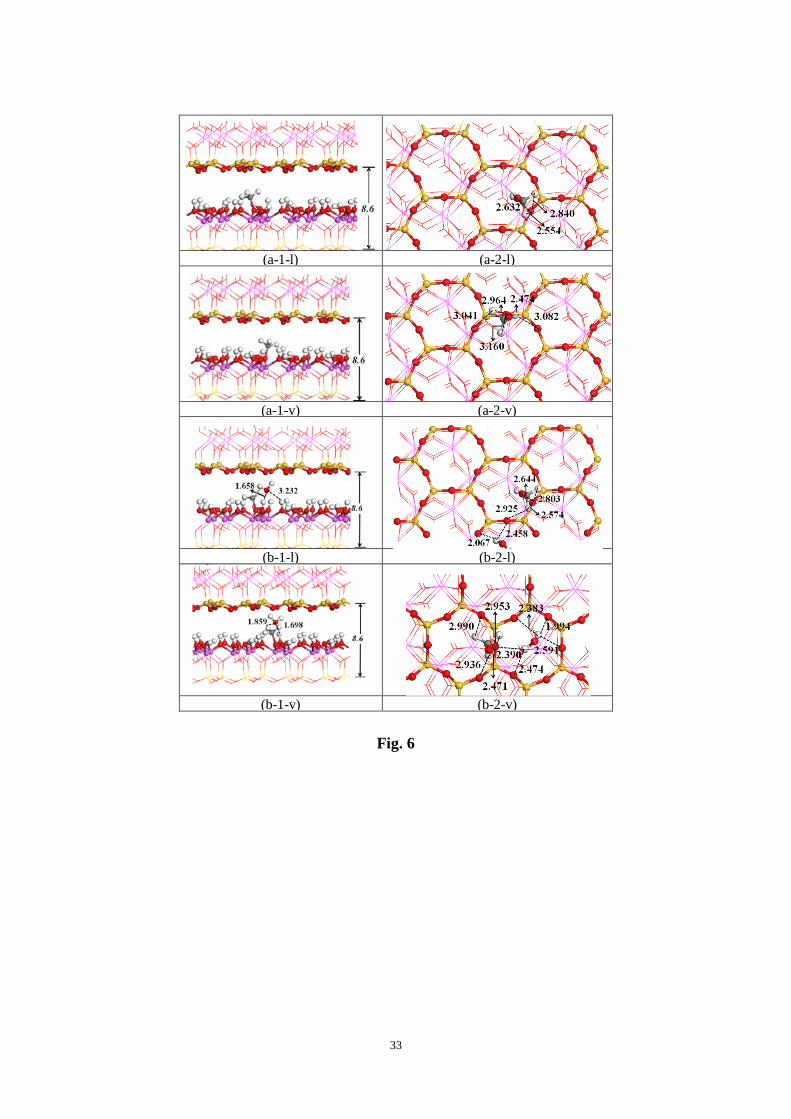
The interactions between intercalated Me and Kaol layer, as well as water molecules and Kaol layer, are shown in
Fig. 6. For all types of intercalated Kaol, hydrogen bonds formed between the hydrogen atoms of the methyl and
hydroxyl groups and the oxygen atoms of the Si sheet. Hydrogen bonds also formed between the hydrogen atoms of
water molecules and the oxygen atoms of the Si sheet. Meanwhile, oxygen atoms in the water and Me molecules formed
hydrogen bonds with the hydrogen atoms in the Al sheet. However, there is no observed hydrogen bonding between the
water and Me molecules. For the grafted Kaol with layers spaced at 8.6 Å and 8.8 Å, the hydrogen atoms of the methyl
group form hydrogen bonds with the oxygen atom of the Si sheet. For the grafted Kaol with a spacing layer of 9.6 Å, no
hydrogen bond was observed to form between the methyl group and the opposite Si sheet. It was noticed that throughout
the variety of d-values in Kaol, the oxygen of water forms hydrogen bonds with H atoms of the surface hydroxyl groups
of the octahedral Al sheet, while the hydrogen atoms of water form hydrogen bonds with the oxygen atom of the
19
tetrahedral Si sheet. The grafted methoxy group forms weak hydrogen bonds with the oxygen atom of the tetrahedral Si
sheet in Kaol with the d-values at 8.6 and 8.8 Å. In Kaol with layer spacing of 9.6 Å, there are no hydrogen bonds
formed between the grafted methoxy group and the opposite Si sheet.
5. Conclusions
The intercalation of Kaol with DMSO, NMF, and U expands the structure along the c-axis resulting in the dominant
(001) reflection appearing at 11.2, 10.7, and 10.9 Å, respectively. After treatment of the pre-intercalate Kaol complexes
with Me, the pre-intercalate reagents (DMSO, NMF, and U) were removed from the interlayer space of Kaol through a
concerted replacement by Me. The (001) reflection is 9.6 Å for Kaol-DMSO-Me, 8.6 Å for Kaol-NMF-Me, and 8.8 Å for
Kaol-U-Me, compared with a recorded value dependent on the starting material, 11.2 Å in the case of Kaol-DMSO, 10.7
Å for Kaol-NMF, and 10.9 Å for Kaol-U. These values are indicative of the various arrangements of Me molecules
between Kaol layers. The relationship between Kaol-Me complexes (Kaol-DMSO-Me 9.6 Å phase, Kaol-NMF-Me 8.6 Å
phase, and Kaol-U-Me 8.8 Å phase) and pre-intercalation complexes (Kaol-DMSO, Kaol-NMF, and Kaol-U) is thought
to be related to the differing angles of Me molecules intercalated between the Kaol layers.
The Me intercalated into Kaol layers through two types of interactions – (a) the interaction of the hydroxyl oxygen
atom with the surface hydroxyl groups of the octahedral Al sheet, and (b) the interaction of the methyl group and
hydroxyl H atoms of the tetrahedral Si sheet with the opposite layer. The existence of water can dramatically increase the
IE of intercalated molecules with Kaol, specifically; water molecules can promote methanol intercalation into the Kaol
layers. It was found that with the increase of space between Kaol layers, the IE is seen to decrease. For all types of
intercalated Kaol, hydrogen bonds form between the hydrogen atoms of the methyl and hydroxyl groups with the oxygen
atoms of the Si sheet. Hydrogen bonds also form between the hydrogen atoms of water and the oxygen atoms of the Si
sheet. The Kaol-Me complexes described offer interesting possibilities for the synthesis of Kaol/polymer nanocomposites
with optimized interactions between the clay mineral and the polymer phase.
20
Acknowledgments
The authors gratefully acknowledge the financial support provided by the National Natural Science Foundation of China (No.
51034006), Beijing Nova Program (xxjh2015B***) and the Open Research Project of State Key Laboratory for Coal Resources and
Safe Mining, China University of Mining &Technology (SKLCRSM14KFB02). The calculation results described in this paper were
obtained on the Deepcomp7000 of the Supercomputing Center in the Computer Network Information Center of the Chinese Academy
of Sciences.
21
References Benazzouz, B.K. and Zaoui, A., 2012. Thermal behaviour and superheating temperature of Kaolinite from molecular
dynamics. Applied Clay Science, 58(0): 44-51. Caglar, B., 2012. Structural characterization of kaolinite-nicotinamide intercalation composite. Journal Of Molecular
Structure, 1020(0): 48-55. Caglar, B., Çırak, Ç., Tabak, A., Afsin, B. and Eren, E., 2013. Covalent grafting of pyridine-2-methanol into kaolinite
layers. Journal of Molecular Structure, 1032(0): 12-22. Cai, J., Liu, Y. and Zhang, L., 2006. Dilute solution properties of cellulose in LiOH/urea aqueous system. Journal of
Polymer Science Part B: Polymer Physics, 44(21): 3093-3101. Cheng, H., Liu, Q., Cui, X., Zhang, Q., Zhang, Z. and Frost, R.L., 2012a. Mechanism of dehydroxylation temperature
decrease and high temperature phase transition of coal-bearing strata kaolinite intercalated by potassium acetate. Journal Of Colloid And Interface Science, 376(1): 47-56.
Cheng, H., Liu, Q., Yang, J., Du, X. and Frost, R.L., 2010. Influencing factors on kaolinite-potassium acetate intercalation complexes. Applied Clay Science, 50(4): 476-480.
Cheng, H., Liu, Q., Yang, J., Ma, S. and Frost, R.L., 2012b. The thermal behavior of kaolinite intercalation complexes-A review. Thermochimica Acta, 545: 1-13.
Cheng, H., Yang, J., Frost, R., Liu, Q. and Zhang, Z., 2011. Thermal analysis and Infrared emission spectroscopic study of kaolinite–potassium acetate intercalate complex. Journal of Thermal Analysis and Calorimetry, 103(2): 507-513.
Churchman, G.J., Whitton, J.S., Claridge, G.G.C. and Theng, B.K.G., 1984. Intercalation Method Using Formamide for Differentiating Halloysite from Kaolinite. Clays and Clay Minerals, 32(4): 241-248.
Costanzo, P.M. and R. F. Giese, J., 1986. Ordered Halloysite: Dimethylsulfoxide Intercalate. Clays and Clay Minerals 34(1): 105-107.
Detellier, C. and Letaief, S., 2013. Chapter 13.2 - Kaolinite–Polymer Nanocomposites. In: B. Faïza and L. Gerhard (Editors), Developments in Clay Science. Elsevier, pp. 707-719.
Duer, M.J., Rocha, J. and Klinowski, J., 1992. Solid-state NMR studies of the molecular motion in the kaolinite: DMSO intercalate. Journal of The American Chemical Society, 114(17): 6867-6874.
Elbokl, T.A. and Detellier, C., 2009. Kaolinite-poly(methacrylamide) intercalated nanocomposite via in situ polymerization. Canadian Journal of Chemistry, 87(1): 272-279.
Fang, Q., Huang, S. and Wang, W., 2005. Intercalation of dimethyl sulphoxide in kaolinite: Molecular dynamics simulation study. Chemical Physics Letters, 411(1-3): 233-237.
Fitzgerald, J.J., Hamza, A.I., Dec, S.F. and Bronnimann, C.E., 1996. Solid-state 27Al and 29Si NMR and 1H CRAMPS studies of the thermal transformation of the 2:1 phyllosilicate pyrophyllite. Journal of Physical Chemistry, 100: 17351-17360.
Fitzgerald, J.J., Piedra, G., Dec, S.F., Seger, M. and Maciel, G.E., 1997. Dehydration studies of a high-surface-area alumina (pseudo-boehmite) using solid-state 1H and 27Al NMR. Journal of the American Chemical Society, 119: 7832-7842.
Frost, R.L., 1995. Fourier transform Raman spectroscopy of kaolinite, dickite and halloysite. Clays and clay minerals, 43(2): 191-195
Frost, R.L., Horváth, E., Makó, É. and Kristóf, J., 2004. Modification of low- and high-defect kaolinite surfaces: implications for kaolinite mineral processing. Journal of Colloid and Interface Science, 270(2): 337-346.
Frost, R.L., Horváth, E., Makó, É., Kristóf, J. and Cseh, T., 2003. The effect of mechanochemical activation upon the intercalation of a high-defect kaolinite with formamide. Journal of Colloid and Interface Science, 265(2):
22
386-395. Frost, R.L., Kristof, J., Horvath, E. and Kloprogge, J.T., 2000a. Rehydration and phase changes of potassium
acetate-intercalated halloysite at 298 K. Journal of Colloid and Interface Science, 226(2): 318-327. Frost, R.L., Kristof, J., Kloprogge, J.T. and Horvath, E., 2000b. Rehydration of Potassium Acetate-Intercalated Kaolinite
at 298 K. Langmuir, 16(12): 5402-5408. Frost, R.L., Kristof, J., Paroz, G.N. and Kloprogge, J.T., 1998a. Molecular Structure of Dimethyl Sulfoxide Intercalated
Kaolinites. Journal of Physical Chemistry B, 102(43): 8519-8532. Frost, R.L., Kristof, J. and Tran, T.H., 1998b. Kinetics of deintercalation of potassium acetate from kaolinite; a Raman
spectroscopic study. Clay Minerals, 33(4): 605-617. Gardolinski, J.E.F.C. and Lagaly, G., 2005. Grafted organic derivatives of kaolinite: II. Intercalation of primary
n-alkylamines and delamination. Clay Minerals, 40(4): 547-556. Hinckley, D.N., 1963. Variability in "crystallinity" values among the kaolin deposits of the coastal plain of georgia and
south carolina. Clays and clay minerals, 11: 229-235. Hirsemann, D., Köster, T.K.J., Wack, J., van Wüllen, L., Breu, J. and Senker, J.r., 2011. Covalent Grafting to
μ-Hydroxy-Capped Surfaces? A Kaolinite Case Study. Chemistry of Materials, 23(13): 3152-3158. Horváth, E., Kristóf, J., Frost, R., Rédey, Á., Vágvölgyi, V. and Cseh, T., 2003. Hydrazine-hydrate intercalated halloysite
under controlled-rate thermal analysis conditions. Journal of Thermal Analysis and Calorimetry, 71(3): 707-714. Horváth, E., Kristóf, J. and Frost, R.L., 2010. Vibrational Spectroscopy of Intercalated Kaolinites. Part I. Applied
Spectroscopy Reviews, 45(2): 130-147. Hunger, M., Freude, D. and Pfeifer, H., 1991. Magic-angle nuclear magnetic resonance studiesof water molecules
adsorbed on Brønstedt- and Lewis-acid sites in zeolites and amorphous silica-aluminas. Journal Of The Chemical Society, Faraday Transactions, 87: 657-662.
Jia, X., Li, Y., Zhang, B., Cheng, Q. and Zhang, S., 2008. Preparation of poly(vinyl alcohol)/kaolinite nanocomposites via in situ polymerization. Materials Research Bulletin, 43(3): 611-617.
Joussein, E., Petit, S. and Delvaux, B., 2007. Behavior of halloysite clay under formamide treatment. Applied Clay Science, 35(1-2): 17-24.
Komori, Y., Enoto, H., Takenawa, R., Hayashi, S., Sugahara, Y. and Kuroda, K., 2000. Modification of the Interlayer Surface of Kaolinite with Methoxy Groups. Langmuir, 16(12): 5506-5508.
Komori, Y. and Sugahara, Y., 1998. A kaolinite-NMF-methanol intercalation compound as a versatile intermediate for further intercalation reaction of kaolinite. Journal of Materials Research, 13(4): 930-934.
Komori, Y., Sugahara, Y. and Kuroda, K., 1999. Intercalation of alkylamines and water into kaolinite with methanol kaolinite as an intermediate. Applied Clay Science, 15(1-2): 241-252.
Kuroda, Y., Ito, K., Itabashi, K. and Kuroda, K., 2011. One-step exfoliation of kaolinites and their transformation into nanoscrolls. Langmuir, 27(5): 2028-2035.
Lapides, I. and Yariv, S., 2009. Thermo-X-ray-diffraction analysis of dimethylsulfoxide-kaolinite intercalation complexes. Journal of Thermal Analysis and Calorimetry, 97(1): 19-25.
Ledoux, R.L. and White, J.L., 1964. Infrared study of the OH group in expanded kaolinite Science, 143(3603): 244-246. Letaief, S. and Detellier, C., 2009. Functionalization of the interlayer surfaces of kaolinite by alkylammonium groups
from ionic liquids. Clays and Clay Minerals, 57(5): 638-648. Letaief, S., Elbokl, T.A. and Detellier, C., 2006. Reactivity of ionic liquids with kaolinite: Melt intersalation of ethyl
pyridinium chloride in an urea-kaolinite pre-intercalate. Journal of Colloid and Interface Science, 302(1): 254-258.
Li, Y.F., Sun, D.W., Pan, X.B. and Zhang, B., 2009. Kaolinite Intercalation Precursors. Clays and Clay Minerals, 57(6): 779-786.
23
Liu, R., Frost, R.L. and Martens, W.N., 2009. Near infrared and mid infrared investigations of adsorbed phenol on HDTMAB organoclays. Materials Chemistry and Physics, 113(2-3): 707-713.
Luca, V. and Thomson, S., 2000. Intercalation and polymerisation of aniline within a tubular aluminosilicate Journal of Materials Chemistry, 10: 2121-2126.
Mako, E., Kristof, J., Horvath, E. and Vagvolgyi, V., 2009. Kaolinite-urea complexes obtained by mechanochemical and aqueous suspension techniques--A comparative study. Journal of Colloid and Interface Science, 330(2): 367-373.
Martorell, B., Kremleva, A., Krüger, S. and Rösch, N., 2010. Density Functional Model Study of Uranyl Adsorption on the Solvated (001) Surface of Kaolinite. The Journal of Physical Chemistry C, 114(31): 13287-13294.
Matusik, J., Gaweł, A. and Bahranowski, K., 2012a. Grafting of methanol in dickite and intercalation of hexylamine. Applied Clay Science, 56(C): 63-67.
Matusik, J., Scholtzova, E. and Tunega, D., 2012b. Influence of synthesis condition on the formation of a kaolintie-methanol complex and simulation its vibrational spectra. Clays and Clay Minerals, 60(3): 227-239.
Mellouk, S., Cherifi, S., Sassi, M., Marouf-Khelifa, K., Bengueddach, A., Schott, J. and Khelifa, A., 2009. Intercalation of halloysite from Djebel Debagh (Algeria) and adsorption of copper ions. Applied Clay Science, 44(3-4): 230-236.
Nicolini, K.P., Fukamachi, C.R.B., Wypych, F. and Mangrich, A.S., 2009. Dehydrated halloysite intercalated mechanochemically with urea: Thermal behavior and structural aspects. Journal of Colloid and Interface Science, 338(2): 474-479.
Perdew, J.P., Burke, K. and Ernzerhof, M., 1996. Generalized Gradient Approximation Made Simple. Physical Review Letters, 77(18): 3865-3868.
Rappe, A.K., Casewit, C.J., Colwell, K.S., Goddard, W.A. and Skiff, W.M., 1992. UFF, a full periodic table force field for molecular mechanics and molecular dynamics simulations. Journal of the American Chemical Society, 114(25): 10024-10035.
Rutkai, G., Makó, É. and Kristóf, T., 2009. Simulation and experimental study of intercalation of urea in kaolinite. Journal of Colloid and Interface Science, 334(1): 65-69.
Spectrochimica Acta Part B-atomic SpectroscopyFrost, R.L., Kristof, J., Rintoul, L. and Kloprogge, J.T., 2000. Raman spectroscopy of urea and urea-intercalated kaolinites at 77 K. Spectrochimica Acta Part A: Molecular and Biomolecular Spectroscopy, 56(9): 1681-1691.
Suarez, M. and Garcia-Romero, E., 2006. FTIR spectroscopic study of palygorskite: Influence of the composition on the octahedral sheet. Applied Clay Science, 31(1-2): 154-163.
Thompson, J.G., 1985. Interpretation of solid State 13C and 29Si nuclear magnetic resonance spectra of kaolinite intercalates. Clays and Clay Minerals, 33(3): 173-180.
Tonle, I.K., Letaief, S., Ngameni, E. and Detellier, C., 2009. Nanohybrid materials from the grafting of imidazolium cations on the interlayer surfaces of kaolinite. Application as electrode modifier. Journal of Materials Chemistry, 19(33): 5996-6003.
Tunney, J.J. and Detellier, C., 1993. Interlamellar covalent grafting of organic units on kaolinite. Chemistry of Materials, 5(6): 747-748.
Tunney, J.J. and Detellier, C., 1996. Chemically modified kaolinite. Grafting of methoxy groups on the interlamellar aluminol surface of kaolinite. Journal Of Materials Chemistry, 6(10): 1679-1685.
Vasconcelos, I.F., Bunker, B.A. and Cygan, R.T., 2007. Molecular dynamics modeling of ion adsorption to the basal surfaces of kaolinite. Journal of Physical Chemistry C, 111(18): 6753-62.
Wang, L., Wu, D., Yuan, P., Chen, Z. and Chen, Z., 2002. 1 H MAS NMR spectra of kaolinite/formamide intercalation compound. Chinese Science Bulletin, 47(6): 504-508.
24
White, C.E., Provis, J.L., Gordon, L.E., Riley, D.P., Proffen, T. and Deventer, J.S.J.v., 2011. Effect of temperature on the local structure of kaolinite intercalated with potassium acetate. Chemistry of Materials, 23(2): 188-199.
Xie, X. and Hayashi, S., 1999a. NMR Study of Kaolinite Intercalation Compounds with Formamide and Its Derivatives. 1. Structure and Orientation of Guest Molecules. The Journal of Physical Chemistry B, 103(29): 5949-5955.
Xie, X. and Hayashi, S., 1999b. NMR Study of Kaolinite Intercalation Compounds with Formamide and Its Derivatives. 2. Dynamics of Guest Molecules. The Journal of Physical Chemistry B, 103(29): 5956-5962.
Yuan, P., Tan, D., Annabi-Bergaya, F., Yan, W., Liu, D. and Liu, Z., 2013. From platy kaolinite to aluminosilicate nanoroll via one-step delamination of kaolinite: Effect of the temperature of intercalation. Applied Clay Science, 83–84(C): 68-76.
25
LIST OF TABLES
Table 1. Interaction energies (IE, in kJ mol-1) of four models of Me and water intercalated in Kaol.a
26
Table 1. Interaction energies (IE, in kJ mol-1) of four models of Me and water intercalated in Kaol.a
a The label “l” and “v” indicate that the corresponding grafted Kaol was produced by Me reacting with –OHl and –OHv, respectively.
27
LIST OF FIGURES
Fig.1 The XRD patterns of Kaol, Kaol-DMSO, Kaol-NMF, Kaol-U, Kaol-DMSO-Me, Kaol-NMF-Me, and Kaol-U-Me
Fig.2 The infrared spectra of Kaol, Kaol-DMSO, Kaol-NMF, Kaol-U, Kaol-DMSO-Me, Kaol-NMF-Me, and Kaol-U-Me
Fig.3 13C MAS NMR spectra for Kaol, Kaol-DMSO, Kaol-NMF, Kaol-U, Kaol-DMSO-Me, Kaol-NMF-Me, and Kaol-U-Me
Fig.4 1H MAS NMR spectra for Kaol, Kaol-DMSO, Kaol-NMF, Kaol-U, Kaol-DMSO-Me, Kaol-NMF-Me, and Kaol-U-Me
Fig.5 Hydrogen bonds formed between adsorbates the surface of the Kaol layers with d-values of 8.6Å.
Fig.6 Hydrogen bonds formed between the grafted methoxy group, water and the surface of Kaol layers with d-values of 8.6Å. The label “l” and “v” indicate that the corresponding grafted Kaol was produced by the Me reacting with –OHl and –OHv, respectively.