Page 1
This is the author’s version of a work that was submitted/accepted for pub-lication in the following source:
Avery, Philip & Mahendran, Mahen(2000)Large-scale testing of steel frame structures comprising non-compact sec-tions.Engineering Structures, 22(8), pp. 920-936.
This file was downloaded from: https://eprints.qut.edu.au/64403/
c© Copyright 2000 Elsevier Science Ltd.
Notice: Changes introduced as a result of publishing processes such ascopy-editing and formatting may not be reflected in this document. For adefinitive version of this work, please refer to the published source:
https://doi.org/10.1016/S0141-0296(99)00039-5
Page 2
1
Large Scale Testing of Steel Frame Structures Comprising Non-Compact Sections
Philip Avery, PhD Research Scholar and Mahen Mahendran, Associate Professor
Physical Infrastructure Centre, School of Civil Engineering
Queensland University of Technology, Brisbane QLD. 4000, Australia
ABSTRACT
Application of “advanced analysis” methods suitable for non-linear analysis and design of steel
frame structures permits direct and accurate determination of ultimate system strengths, without
resort to simplified elastic methods of analysis and semi-empirical specification equations.
However, the application of advanced analysis methods has previously been restricted to steel
frames comprising only compact sections that are not influenced by the effects of local buckling.
A research project has been conducted with the aim of developing concentrated plasticity
methods suitable for practical advanced analysis of steel frame structures comprising non-
compact sections. A series of large scale tests were performed in order to provide experimental
results for verification of the new analytical models. Each of the test frames comprised non-
compact sections, and exhibited significant local buckling behaviour prior to failure. This paper
presents details of the test program including the test specimens, setup and instrumentation,
procedure, and results.
Keywords: Large scale testing, Steel frame structures, Non-compact sections
Abbreviated title: Large scale testing of steel frame structures
Page 3
2
INTRODUCTION
Simplified concentrated plasticity methods of analysis are usually calibrated and verified using
distributed plasticity analytical benchmark models (Kanchanalai, 1977; El-Zanaty et al., 1980;
Vogel, 1985). However, large scale frame testing is still required to verify the analytical
benchmark solutions and generate confidence that the theoretical models are indeed
representative of the behaviour of real structures. A number of large scale frame tests have been
conducted during the past ten years (Wakabayashi, 1972; Abe et al., 1983; Toma and Chen,
1992; Shanmugam et al., 1995), the majority of which have comprised only members of compact
cross-section not subject to local buckling effects.
The behaviour of individual members involving non-compact sections has been the subject of
comprehensive research and investigation during the past 30 years (Liew et al., 1989;
Shanmugam et al., 1989; Hancock et al., 1990). However, the use of individual member test
results is not particularly appropriate for the verification of a frame analysis model as individual
members fail with little or no inelastic redistribution. Furthermore, the majority of the individual
member tests reported in the literature involve non-sway (braced), pinned columns with zero or
constant bending moment. Such members do not necessarily represent the common sway frame
member subject to axial compression and a non-uniform bending moment distribution.
A large scale test program was therefore undertaken with the aim of testing steel frames
comprising non-compact sections for verification of the distributed plasticity analytical model
described by Avery and Mahendran (1998). The distributed plasticity model was subsequently
used by Avery (1998) for verification of two alternative concentrated plasticity methods for
practical advanced analysis of steel frames comprising non-compact sections. This paper
Page 4
3
contains a description of the test specimens, setup and instrumentation, procedure, and results. A
comparison of the test results with design specification predictions is also provided. A
comparison of the experimental and analytical results is presented by Avery and Mahendran
(1998).
TEST SPECIMENS
A series of four tests was conducted. Each of the four frames could be classified as a two
dimensional, single bay, single storey, large scale sway frame with full lateral restraint and rigid
joints. The reasons why this type of frame was used are discussed below.
1. Two dimensional. Many common steel frame structural systems can be idealised for the
purposes of analysis and design as simplified two-dimensional assemblages. Ultimately
three dimensional advanced analysis of frames comprising non-compact sections is a
desirable objective. However, it is practical and appropriate to first develop and verify a
model using two dimensional frames before attempting to include the additional complexity
involved in three dimensional analysis. The four test frames described in this paper were
therefore all two dimensional, although it is anticipated that future research will involve large
scale testing of three dimensional steel frame systems comprising non-compact sections
(Heldt, 1997).
2. Single bay and single storey. Due to size restrictions and resource limitations only single
bay, single storey frames could be tested without resorting to the use of small scale test
models. Frames of this type are commonly used for commercial and industrial structures,
therefore it was considered an appropriate and practical choice. Previous experimental
studies involving frames comprising compact sections (Toma and Chen, 1992; Shanmugam
Page 5
4
et al., 1995) have found that analytical models verified by comparison with single bay, single
storey test results are generally also accurate for more complex multi-bay, multi-storey
systems. This can be explained by the fact that the same principles of structural behaviour
apply to both small and large frame systems, although due to greater redundancy in large
systems there is more scope for inelastic redistribution to occur.
3. Large scale. The dimensions of each test frame were four meters between column centre
lines and three metres from the base of the columns to the top of the beam. The column
member slenderness (Lc/r) ranged from 18 to 70, representative of a range of typical
structures.
4. Sway. Sway frames are also commonly referred to in the literature as unbraced frames,
where the term ‘unbraced’ indicates an absence of bracing in the plane of the frame. The
stability of sway frames is influenced by both the P-∆ and P-δ effects (although the P-∆
effect is generally much more significant), while only the P-δ effect influences the stability
of non-sway (i.e., braced) frames. Due to resource limitations it was not possible to test a
representative series of frames including both sway and non-sway frames. Sway frames were
tested in preference to non-sway frames for two reasons. Firstly, sway frames are more
common than non-sway frames in single bay, single storey commercial and industrial steel
frame structures. Secondly, the stability of sway frames is more complex and sensitive than
non-sway frames as it involves both P-∆ and P-δ effects. It can therefore be reasonably
assumed that an analytical model verified by comparison with sway test frames would also
be appropriate for the analysis of non-sway frames.
5. Fully laterally restrained. A significant proportion of steel frames constructed in Australia
are in fact not fully laterally restrained, therefore the effects of lateral buckling and the
Page 6
5
interaction of local and lateral buckling need to be eventually considered (Alsaket, 1998).
However, before the effects of lateral buckling can be included in the advanced analysis of
frames comprising non-compact sections, it is necessary to develop a model that accounts for
the effects of local buckling. The objective of the tests and analyses was therefore to
investigate the effects of local buckling of non-compact sections on the in-plane stability and
strength of two dimensional frames. In order to achieve this objective it was necessary to
isolate the effects of local buckling by precluding lateral buckling, that is, by providing full
lateral restraint.
6. Rigid. Structural connections can be classified as either rigid with infinite moment capacity,
pinned with zero moment capacity, or semi-rigid with a finite moment capacity and a
stiffness, which can be expressed as a function of the rotation. A number of researchers
(Liew et al., 1993) have developed techniques for accounting for semi-rigid connections in
the advanced analysis of frames comprising members of compact cross-section, and there is
no reason why these techniques should not be applicable to non-compact sections also.
There was therefore little advantage to be gained by considering semi-rigid connections in
this investigation. It was preferable to focus on the effects of local buckling by only
considering the most simple fixed and pinned connection types. As previous experimental
studies (Galatanu, 1997) had demonstrated the difficulty in achieving a pinned connection in
the laboratory, rigid connections were considered to be the most appropriate for the four test
frames. The column base plate connections were made as rigid as possible by using 25 mm
base plates continuously fillet welded to the columns. Each base plate was tack welded and
bolted to the top flange of the floor girder using eight M24 structural grade bolts for each
Page 7
6
connection. The beam-column joint connections were fully welded and stiffened to prevent
panel zone effects from influencing the behaviour of the frames.
The section specimens used for the four test frames were selected in accordance with the
following criteria:
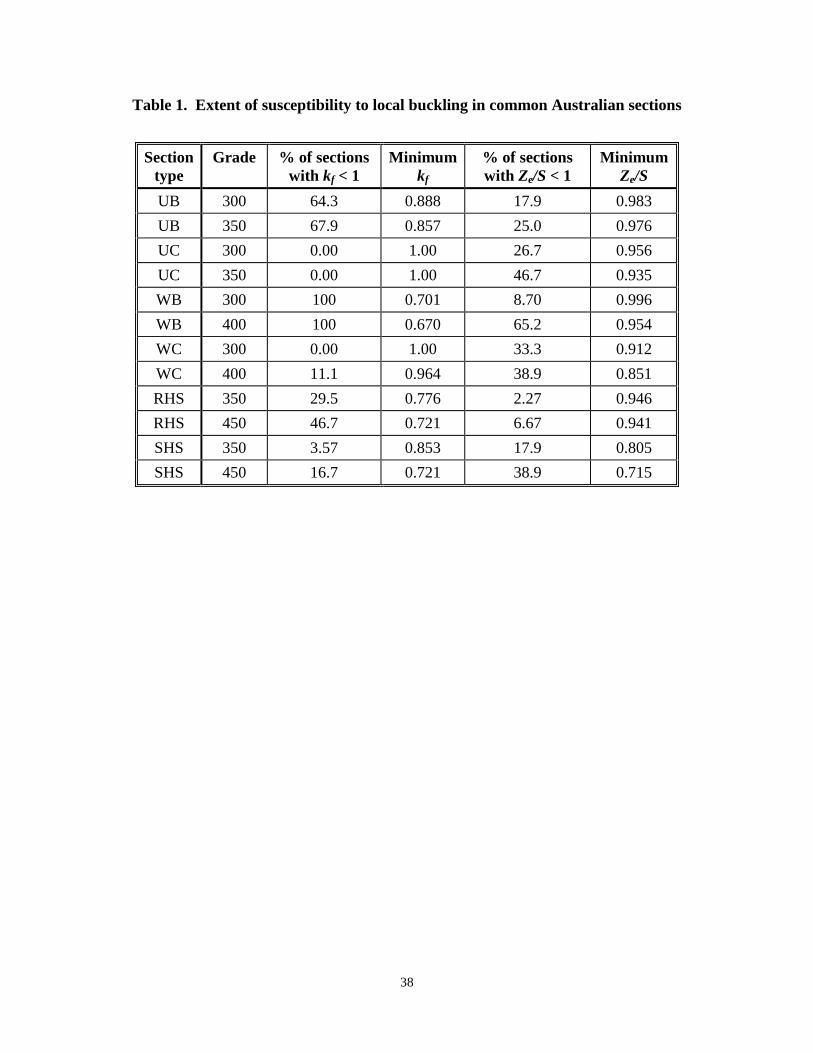
1. To represent a range of section types. The extent of susceptibility of sections commonly used
in Australia to local buckling is summarised in Table 1. The form factor (kf) is defined in
AS4100 clause 6.2.2 (SAA, 1990) as the ratio of the effective area to the gross area. It
represents the effect of local buckling on the section capacity for the case of pure axial
compression (no bending moment). Similarly, the ratio Ze/S represents the effect of local
buckling on the section capacity for the case of pure bending (no axial force).
The sections most commonly used in Australia are:
• Hot-rolled I-sections. These sections are classified as either universal columns (UC) or
universal beams (UB). Universal columns are wide flange sections suitable for members
with high axial force, while universal beams are deeper with narrower flanges and suitable
for members with high major axis bending moment. Both section types are available in
grade 300 or grade 350 steel. As shown in Table 1, a significant proportion of universal
beam sections have kf < 1 and/or Ze/S < 1, and are therefore subject to local buckling.
Local buckling is less significant in the universal column sections, although some do have
Ze/S < 1.
• Welded I-sections. These sections are classified as either welded columns (WC) or
welded beams (WB). Both section types are available in grade 300 or grade 400 steel. As
in the case of the hot-rolled sections, a significant proportion of the welded beam sections
Page 8
7
are influenced by local buckling, while most of the welded column sections are compact
(see Table 1). Welded I-sections can also be custom designed and fabricated from steel
plates.
• Cold-formed tubes. These sections are classified as rectangular hollow sections (RHS),
square hollow sections (SHS), or circular hollow sections (CHS). Rectangular and square
sections are available in grade 350 steel, and a smaller range of sections is available in
grade 450 steel. Circular sections are available in grade 250 and grade 350 steel. A
significant proportion of the rectangular and square hollow sections is non-compact as
shown in Table 1, but the circular sections are mostly compact.
• Other hot-rolled sections. A range of other hot-rolled sections is available, including
parallel flange channels, taper flange channels, equal angles, unequal angles, and taper
flange beams. The majority of these sections are available in grade 250 or 350 steel.
With the exception of a relatively small number of angle sections, these sections are
compact and therefore will not be considered in this investigation.
• Other cold-formed sections. The most common other cold-formed sections are the C and
Z sections. These sections are often manufactured using high grade thin-walled steel and
therefore a large proportion is non-compact. However, these sections are also susceptible
to other more complex behaviour such as distortional buckling and therefore will not be
considered in this investigation. Furthermore, the most common application of these
sections is for secondary members (purlins and girts) which are generally not included in
the analysis of steel frame structures.
Each section type exhibits different structural characteristics due to the different
manufacturing processes that result in different geometric imperfections, residual stresses
Page 9
8
and material properties. It was therefore considered desirable to include a range of the most
common sections in the test program. The most common sections significantly influenced by
local buckling are the universal beam sections, welded beam sections, and rectangular hollow
sections. It was therefore decided that at least one frame would be tested for each of these
three section types.
2. To represent a range of different section slenderness parameters (kf, Ze/S), column member
slendernesses (Lc/r) and vertical to horizontal load ratios (P/H). The local buckling
behaviour of non-compact sections can be classified as either elastic or inelastic. Sections
that exhibit elastic local buckling prior to yielding of the section are classified as slender by
AS4100 for the members subject to pure bending (no axial compression). Sections that
exhibit inelastic local buckling after yielding of the section has commenced are classified as
non-compact. The method used to calculate the effective section modulus depends on this
classification, indicating that the structural behaviour of slender members is different from
that of members subject to inelastic local buckling. The test specimens were therefore
selected to represent both the slender and non-compact categories, ensuring that the accuracy
of the analytical model could be verified for both elastic and inelastic local buckling.
Similarly, the interaction between local buckling and frame stability will vary, depending on
the slenderness of the column members (Lc/r) and the ratio of vertical to horizontal load
(P/H). A range of Lc/r and P/H ratios were therefore used for the four test frames.
3. To exhibit behaviour influenced by the effects of local buckling under combined axial
compression and bending (i.e., kf < 1 and Ze/S < 1). Appropriate test specimens were selected
by considering these two effective section ratios, both of which should be significantly less
than one to ensure that the test frames would exhibit behaviour significantly influenced by
Page 10
9
the effects of local buckling. Finite element analysis of each test frame using elastic buckling
and non-linear analyses was also used to ensure that local buckling would occur.
4. To fail by in-plane instability caused by a reduced stiffness due to significant yielding and
spread of plasticity effects. The yielding should be due to the combined effects of axial
compression, bending, local buckling and residual stress. Failure by pure elastic instability
(no yielding) or by formation of plastic mechanism with insignificant second-order effects
would not be suitable to verify an analytical model required to handle the more complex case
of combined yielding and second-order instability. Designing the frame so that the in-plane
moment capacity reduced for axial force effects (Mi) was significantly less than the section
capacity (Mr) and out-of-plane member capacity (Mo) ensured this failure mode. In addition,
the maximum stresses (corresponding to the design capacity) obtained from the elastic
analysis used to design the frame were required to be significantly greater than the material
yield stress. This requirement ensured that significant yielding and spread of plasticity did
occur prior to failure. Shear and bearing failures were also avoided by ensuring that the
relevant AS4100 specifications were satisfied.
5. To have a failure load within the limits of the external support frame and maximum
deflections less than the available stroke of the hydraulic jacks. The failure load of each test
frame was estimated from the design to AS4100 based on a second-order elastic analysis.
The design involved the use of nominal material properties, no capacity reduction factors,
and an allowance of 25 percent over strength due to yield stresses greater than the nominal
values and conservatism in the design calculations. This failure load was also checked by a
preliminary non-linear finite element analysis with nominal material properties,
Page 11
10
imperfections and residual stresses. The limit of the external support frame was determined
by designing it to AS4100, and checked by proof testing (using test frame 1).
The four test specimens are described below. In each case, the same section was used for both
the columns and the beam.
Test frame 1: Compact I-sections (250 UB 37.3), kf = 1, Zex/Sx = 1, grade 300 steel (nominal
yield stress = 320 MPa), bending about major axis, with full lateral restraint, P/H = 4. It was
decided that the first test frame should be used to proof test the external test frame and to test
drive the experimental apparatus and procedures. It was therefore not necessary for this frame to
exhibit local buckling. The 250 UB 37.3 section was selected, as its estimated failure load was
of a suitable magnitude to proof test the external support frame.
Test frame 2: Non-compact I-sections (310 UB 32.0), kf = 0.915, Zex/Sx = 0.983, grade 300 steel
(nominal yield stress = 320 MPa), bending about major axis, with full lateral restraint, P/H = 4.
This section was selected as it is one of the standard hot-rolled I-sections most affected by local
buckling and its estimated failure load was less than the capacity of the external support frame.
Test frame 3: Slender rectangular hollow section (200x100x4 RHS), kf = 0.801, Zey/Sy = 0.693,
grade 350 steel, bending about minor axis, with full lateral restraint, P/H = 8. The 200x100x4
RHS section satisfies the selection criteria described previously by representing a different
section type (RHS), section slenderness (smaller kf, Ze/S, slender), column slenderness (larger
Lc/r), and P/H ratio compared with test frame 2. Minor axis bending was considered appropriate
to prevent out-of-plane column buckling and to decrease the section slenderness (Zey/Sy < Zex/Sx).
Of all the RHS sections with suitable failure loads, the 200x100x4 RHS was selected because it
is the RHS most significantly influenced by local buckling.
Page 12
11
Test frame 4: Slender welded I-section (not a standard section), kf = 0.848, Zex/Sx = 0.918,
bending about major axis, with full lateral restraint, P/H = 6. In order to satisfy the first selection
criterion, the fourth test frame was required to be fabricated using welded I-sections. None of
the standard welded I-sections was small enough to have a failure load less than the capacity of
the external support frame, therefore it was necessary to custom design and fabricate a section
suitable for testing. It was also decided to design the section with a slender web (d1/tw = 122) in
order to represent a different section classification to test frames 2 and 3 which were non-
compact and slender (flanges only), respectively. The minimum plate thickness that could be
used was 3.0 mm. Various combinations of section depth, flange dimensions, and yield stress
were considered, and the section that best satisfied the selection criteria was determined. The
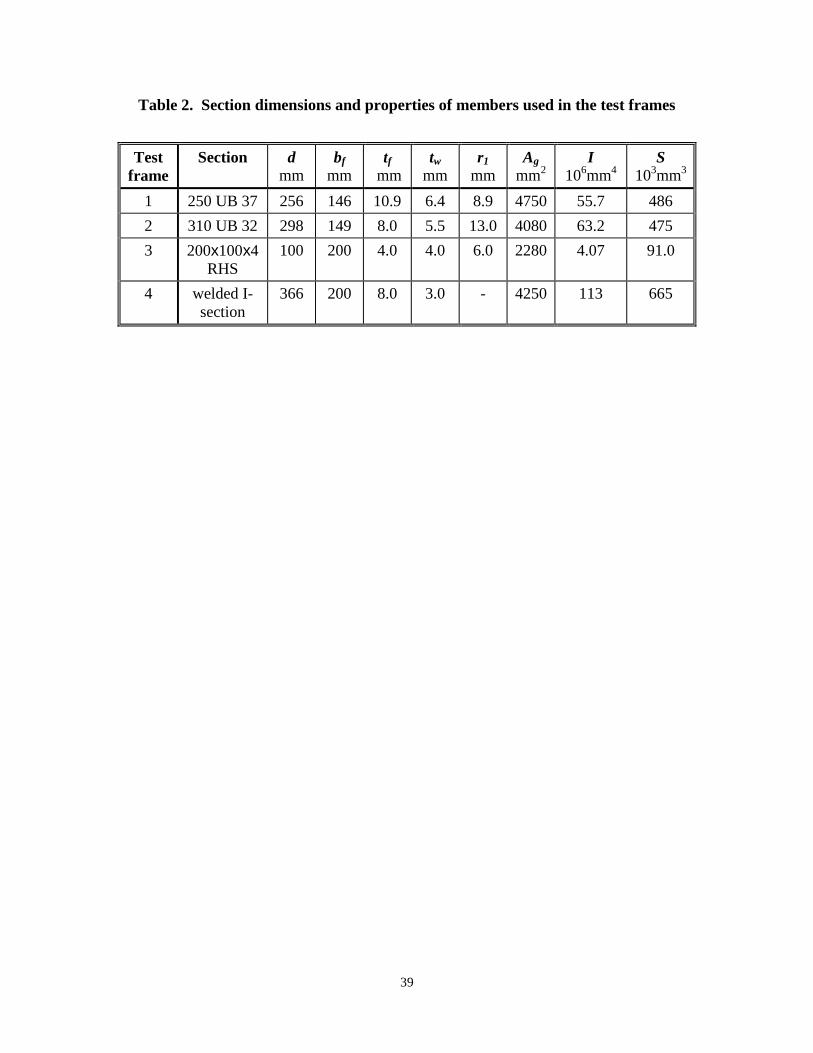
dimensions, material properties, and section properties of the sections used in test frames 1, 2, 3,
and 4 are provided in Tables 2 and 3.
TEST SETUP AND INSTRUMENTATION
The test frames were tested in a 1500 kN test rig designed and fabricated in the structural
engineering laboratory of the Queensland University of Technology. The general arrangement
of the test setup is illustrated in Figure 1. The horizontal and vertical loads applied to the
internal test frame were resisted by an external support frame, shown in Figure 2.
As shown in Figure 1, the test frames were subject to equal vertical loads (P) applied to the
columns, and a horizontal load applied to the floor girder adjacent to the base of the right hand
column. The horizontal load was applied at the base level because it was easier to fix the
position of the vertical jacks rather than require them to move laterally with the frame as it
Page 13
12
deformed. The test frame was therefore fixed to the floor girder which was free to move laterally
in-plane on greased roller bearings. A high strength steel plate was placed between the roller
bearings and the concrete floor to reduce the coefficient of friction and to prevent local crushing
of the floor due to stress concentrations under the bearings. The sway in the test frames was
induced by displacing the column bases horizontally while the beam and vertical jacks remained
stationary due to a horizontal restraint at the top of the left hand column. This configuration is
statically equivalent to applying the horizontal load at the top of the left hand column and
restraining translation at the base of each column.
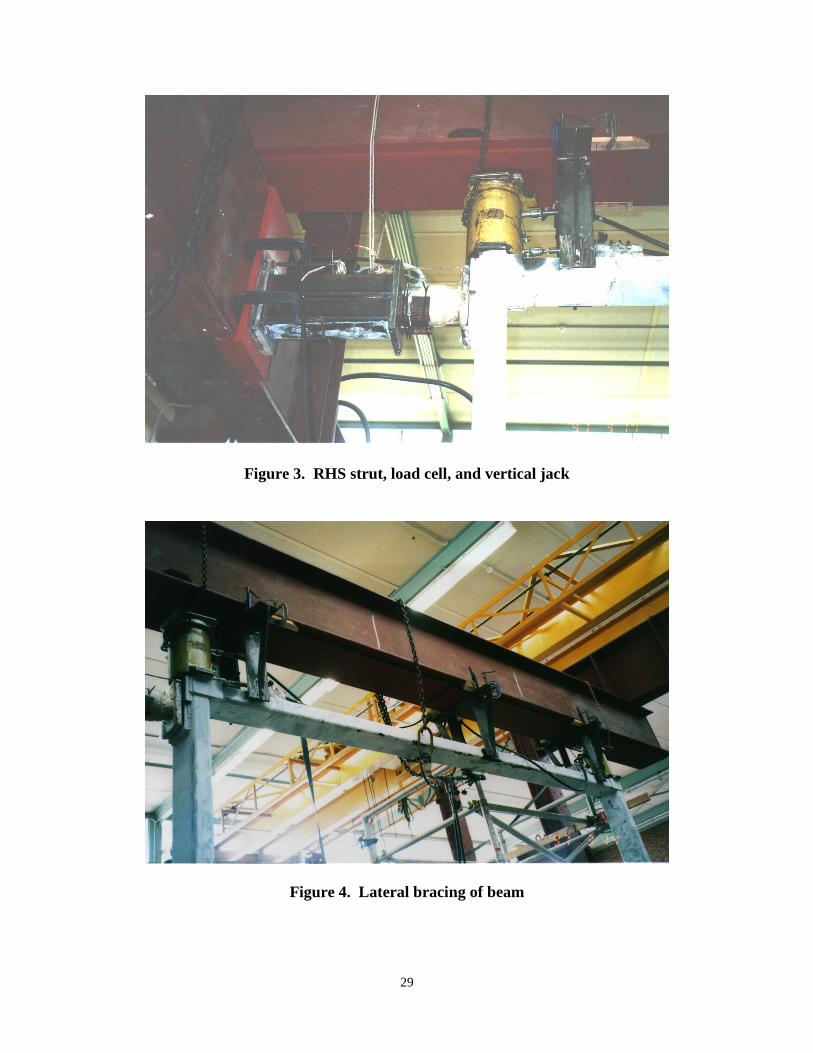
A rectangular hollow section (RHS) strut, load cell, and set of roller bearings at the top of the left
hand column (see Figures 1 and 3) provided the test frame horizontal restraint and measured the
horizontal reaction (H). This use of roller bearings prevented relative in-plane lateral
displacement between the internal test frame and the external support frame, but allowed relative
vertical deflection of the internal test frame. The load cell measured the effective horizontal load
resisted by the internal test frame, equal to the applied horizontal jack load minus the friction.
Friction was primarily due to resistance occurring in roller bearings located beneath the floor
girder.
Roller bearings, aligned perpendicular to the longitudinal axis of main girder, were placed
between the vertical jacks and the main girder of the test rig (see Figure 1). The purpose of these
bearings was to prevent any horizontal force being transferred by friction through the vertical
jacks if a small relative horizontal displacement occurred between the beam of the internal test
frame and the main girder of the external test frame. Two 25 mm thick steel plates were used to
Page 14
13
transfer the vertical jack forces into the column flanges, preventing local crushing of the column
webs.
No practical system could be devised to restrain out-of-plane displacement of the columns
without inducing undesirable in-plane restraints. Out-of-plane lateral restraints were therefore
only applied to the beam in three locations (see Figures 1 and 4) using bracing devices attached
to the main girder of the external frame. The lateral restraint was provided by bearing action
between the bracing devices and roller bearings, which were welded to the top flanges of the test
frame beam adjacent to the bracing devices. The use of roller bearings enabled the test frame to
deform in-plane with minimal frictional restraint. This arrangement prevented the critical out-of-
plane frame buckling mode involving out-of-plane translation of both columns and the beam.
However, out-of-plane column buckling modes not requiring out-of-plane displacement of the
beam could not be prevented. The frames were therefore carefully designed to ensure that these
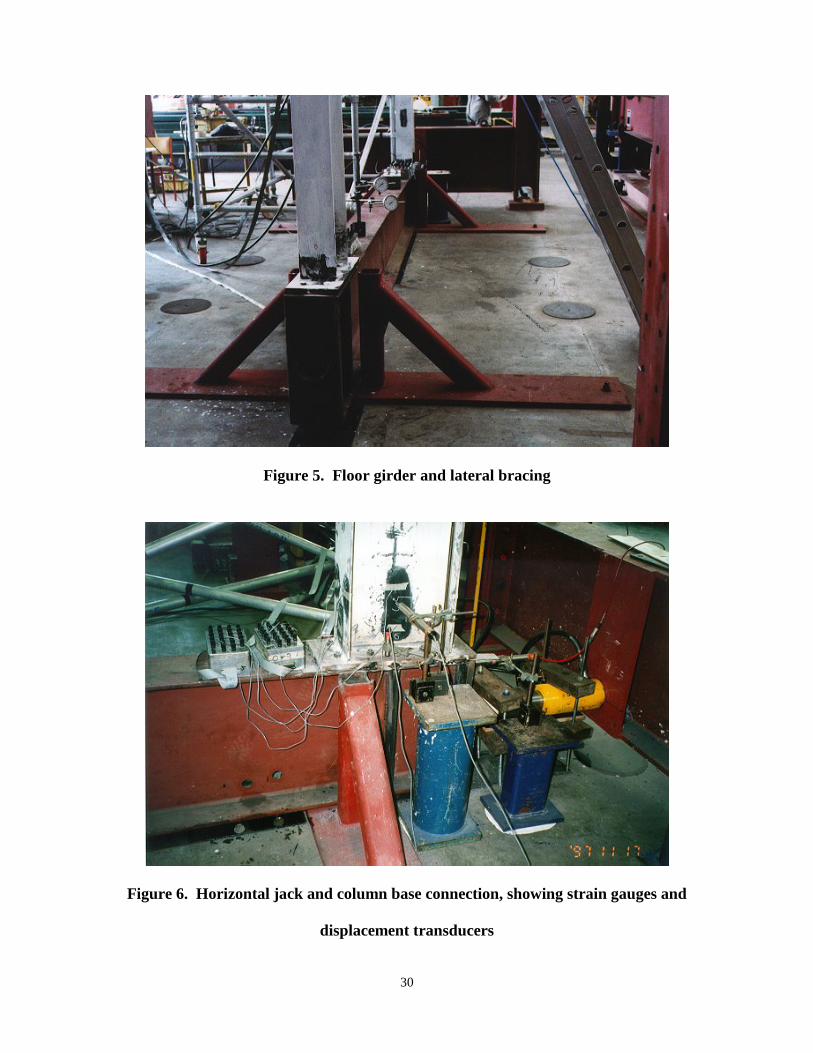
modes would not be critical. The floor girder was also laterally restrained in two locations using
bracing devices fastened to the floor (see Figures 1 and 5) to ensure that the test frame remained
plumb throughout the testing.
The vertical loads were applied by two 150 tonne displacement controlled hydraulic jacks, and
the horizontal load by one 50 tonne displacement controlled hydraulic jack (see Figures 3 and 6).
The vertical jacks were connected in parallel so they could be loaded simultaneously with a
single pump and generate equal loads. The jack loads were measured using calibrated pressure
transducers, and the horizontal reaction provided by the RHS strut was measured using a 50
tonne load cell. The loads were continuously monitored and recorded at regular intervals using a
computer data acquisition system. The ratio of the load in each vertical jack (P) to the horizontal
Page 15
14
reaction (H) was kept as constant as possible during the test (for easier comparison with
analysis).
Electrical resistance strain gauges with five mm gauge lengths were used to measure strains at
various locations in the beam and columns (see Figure 6). The most highly stressed region at the
base of the right hand column was monitored with particular interest in order to obtain the
maximum strains. Displacement transducers were used to measure the vertical and out-of-plane
horizontal deflections at the base and top of the right hand column. The horizontal in-plane
deflection at the top of the right hand column was due only to initial slack, compression of the
beam, compression of the RHS strut and deflection of the external support frame, and was
consequently very small. The relative in-plane horizontal (sway) deflection of the frame was
calculated by subtracting the in-plane horizontal deflection at the top of the right hand column
from the in-plane horizontal deflection at the base of the right hand column. This relative
deflection and the horizontal reaction (H) were used to plot an in-plane horizontal load-
deflection curve, suitable for comparison with the corresponding analytical results. Similarly,
the vertical deflection at the base of the right hand column was due only to initial slack and
transverse compression of the floor girder and was also very small. The relative vertical
deflection (axial shortening) of the column was calculated by subtracting the vertical deflection
at the base of the right hand column from the vertical deflection at the top of the right hand
column. This relative deflection and the vertical jack load (P) were used to plot a vertical load-
deflection curve, suitable for comparison with the corresponding analytical results.
Displacement transducers were also used to measure in-plane horizontal displacements of the left
hand column, the vertical deflection at the beam’s midspan and out-of-plane movements (overall
and local due to local buckling). The output from the strain gauges and displacement transducers
Page 16
15
were fed directly into the computer system, allowing the response of the frame to be closely
monitored during testing.
TEST PROCEDURE
The following procedure was used to obtain accurate and reliable results for each test frame:
1. The fabricated test frame was moved into position in the test rig and the base plates were
fastened to the top flange of the floor girder.
2. The jacks were mounted in position and connected to pumps and pressure transducers. The
jacks were aligned in order to prevent eccentricity. The vertical jacks were connected in
parallel to ensure that equal vertical loads were applied to each column.
3. The load cell and roller bearings were secured in position between the RHS strut and the
beam-column connection. The strain gauges and displacement transducers were placed in
position. The pressure transducers, displacement transducers, and strain gauges were
connected to the computer system.
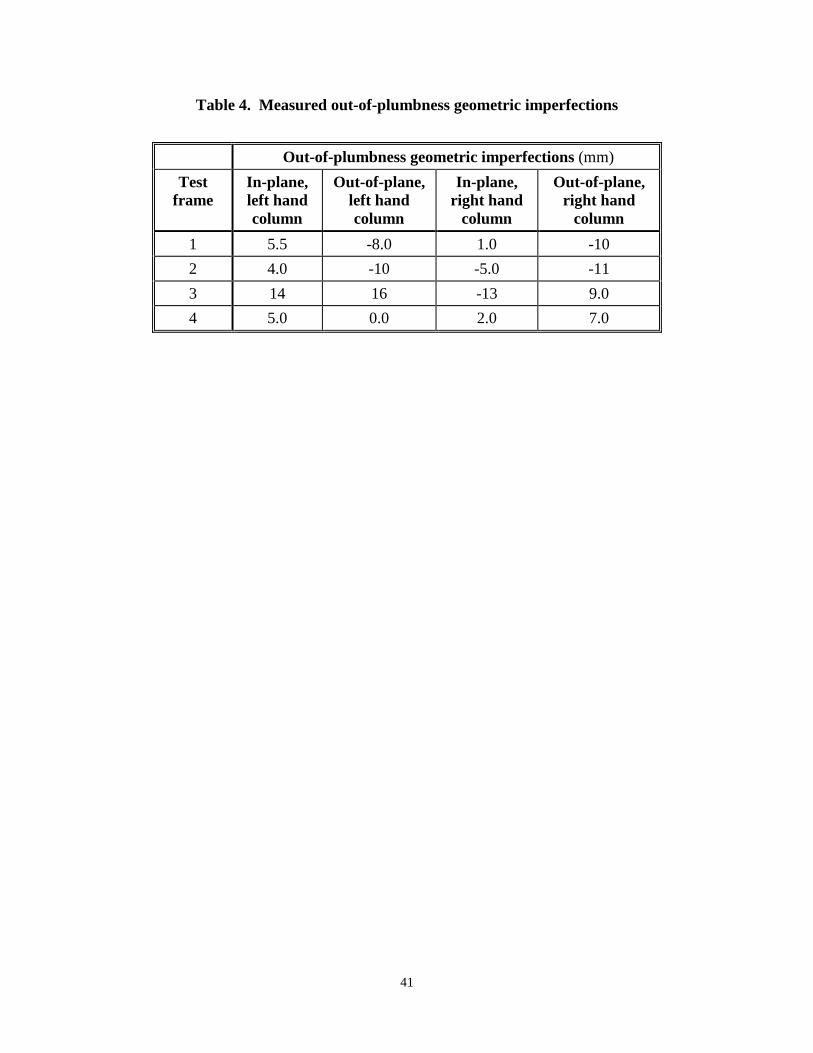
4. The out-of-plumbness imperfections of the columns (in-plane and out-of-plane) were
measured using plumb lines (see Table 4). The small out-of-straightness imperfections were
not considered significant for unbraced frames. The local plate imperfections could not be
accurately measured, therefore nominal imperfections based on fabrication tolerances were
assumed. Note that a positive in-plane imperfection indicates that the top of the column is
offset in the positive X direction with respect to the base. A positive out-of-plane
Page 17
16
imperfection indicates that the top of the column is offset in the positive Z direction with
respect to the base. The directions of the X and Z axes are shown in Figure 1.
5. A trial load of 10 percent of the expected ultimate capacity was applied and released in order
to remove slack in the system and to ensure functionality. The frame was then loaded to
failure. The computer recorded strains and deflections for each load increment. Post-failure
deflections were increased in order to observe permanent plastic deformations.
6. Material stress-strain characteristics and mean web and flange thicknesses were obtained
from tensile testing and measurement of section specimens remaining after fabrication of the
test frame. The tensile tests were conducted in accordance with the Australian Standard
AS1391 (SAA, 1991).
TEST RESULTS AND DISCUSSION
The objective of test frame 1 was to proof test the external support frame and to check for
problems with the test procedure. As this frame comprised members with compact cross-
sections the actual results obtained from this test are not of particular interest or relevance and
will not be presented or discussed in this thesis. Alsaket (1998) presents results and discussion
of test frame 1. This section will present and discuss the results of test frames 2, 3, and 4 and the
tensile test results.
Test frame 2 (non-compact hot-rolled I-section)
The vertical and horizontal loads were applied simultaneously in a ratio of approximately 4:1.
That is, the load in each vertical jack was approximately four times greater than the horizontal
Page 18
17
reaction measured by the load cell. The loads were initially applied in nine increments of
approximately 40 kN per vertical jack and a 10 kN horizontal reaction. This was followed by
eighteen smaller load increments of approximately 10 kN per vertical jack and a 2.5 kN
horizontal reaction. Smaller load increments were used to accurately trace the non-linear
response of the frame after the onset of yielding.
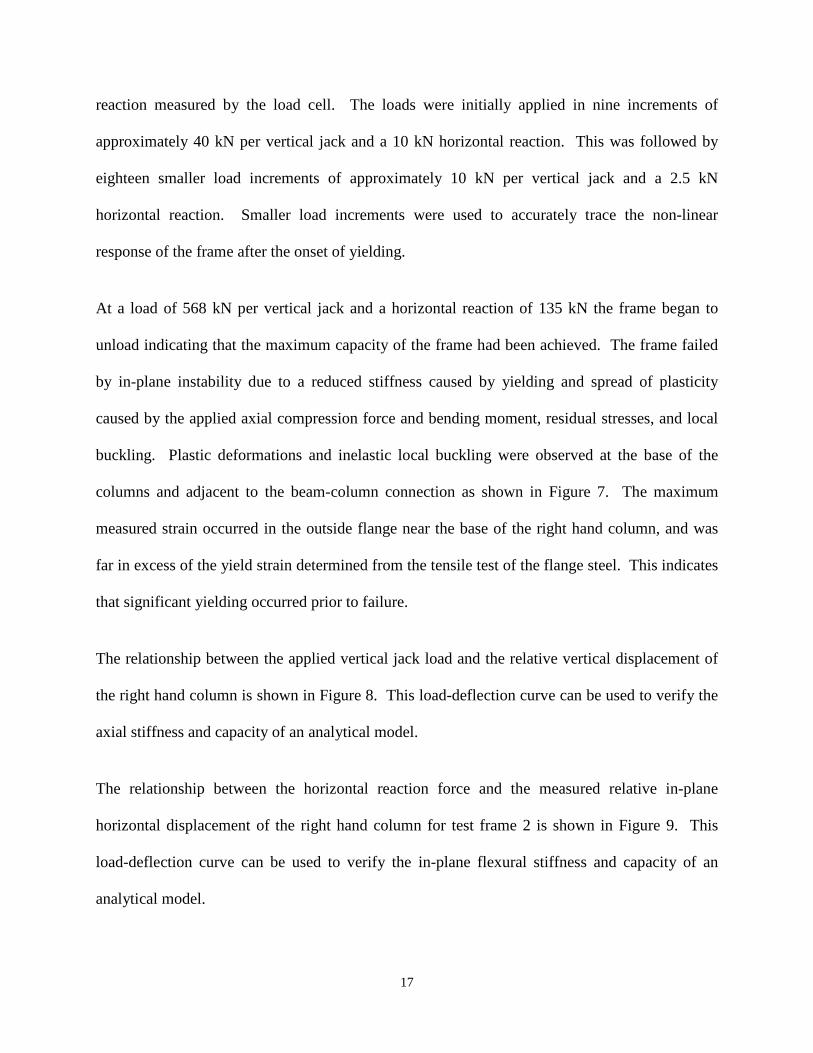
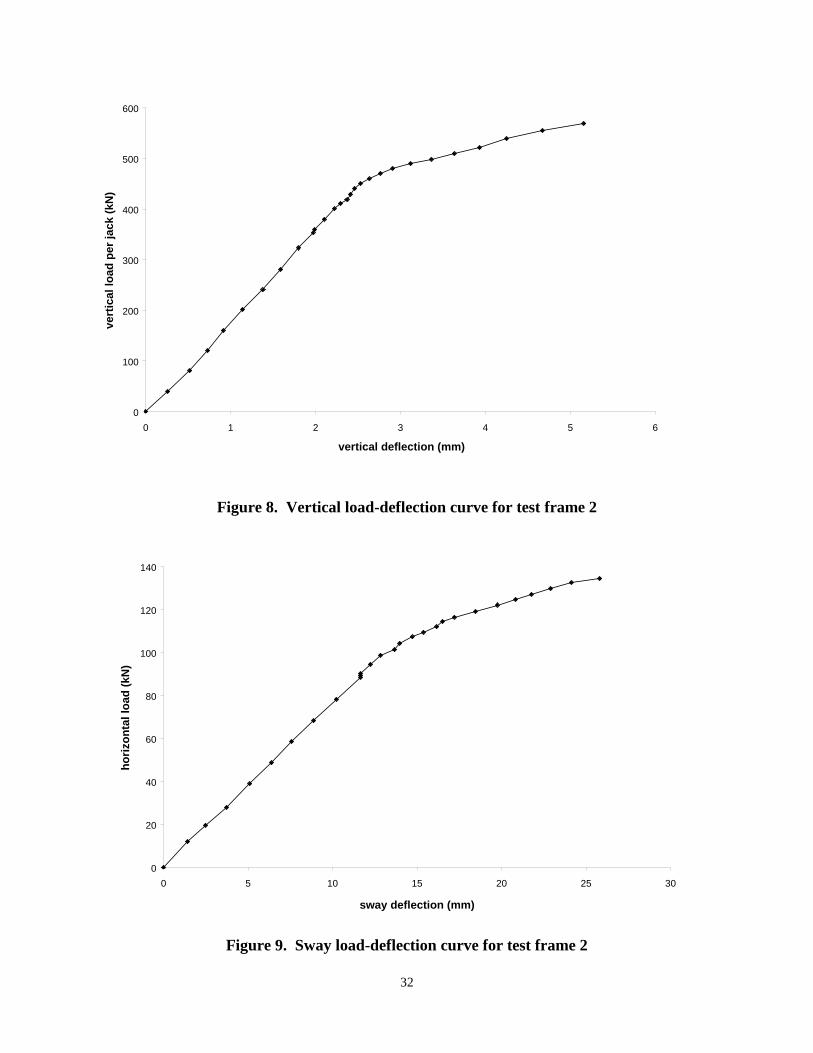
At a load of 568 kN per vertical jack and a horizontal reaction of 135 kN the frame began to
unload indicating that the maximum capacity of the frame had been achieved. The frame failed
by in-plane instability due to a reduced stiffness caused by yielding and spread of plasticity
caused by the applied axial compression force and bending moment, residual stresses, and local
buckling. Plastic deformations and inelastic local buckling were observed at the base of the
columns and adjacent to the beam-column connection as shown in Figure 7. The maximum
measured strain occurred in the outside flange near the base of the right hand column, and was
far in excess of the yield strain determined from the tensile test of the flange steel. This indicates
that significant yielding occurred prior to failure.
The relationship between the applied vertical jack load and the relative vertical displacement of
the right hand column is shown in Figure 8. This load-deflection curve can be used to verify the
axial stiffness and capacity of an analytical model.
The relationship between the horizontal reaction force and the measured relative in-plane
horizontal displacement of the right hand column for test frame 2 is shown in Figure 9. This
load-deflection curve can be used to verify the in-plane flexural stiffness and capacity of an
analytical model.
Page 19
18
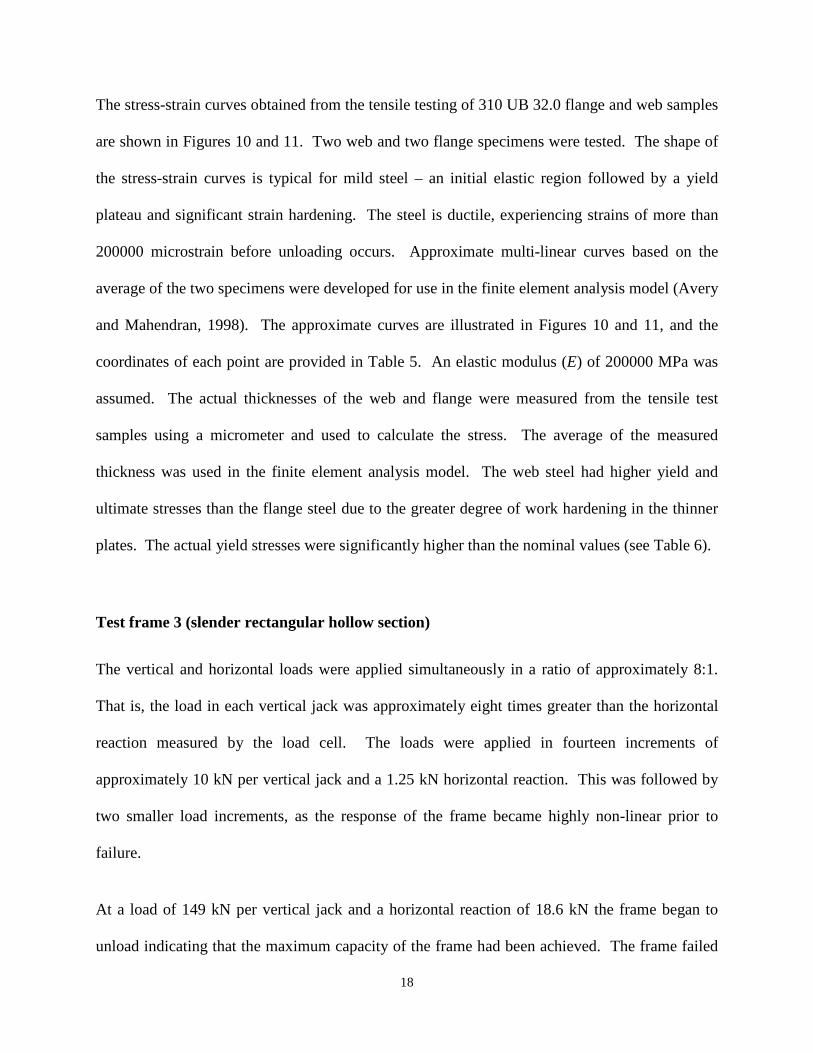
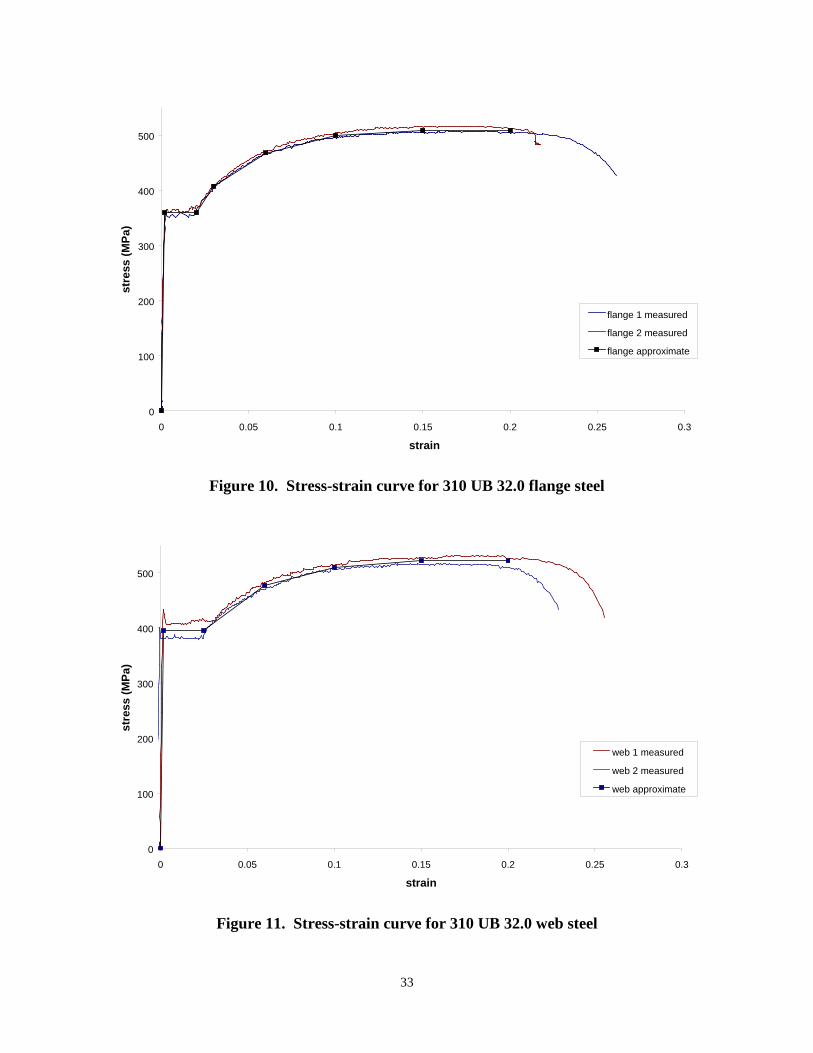
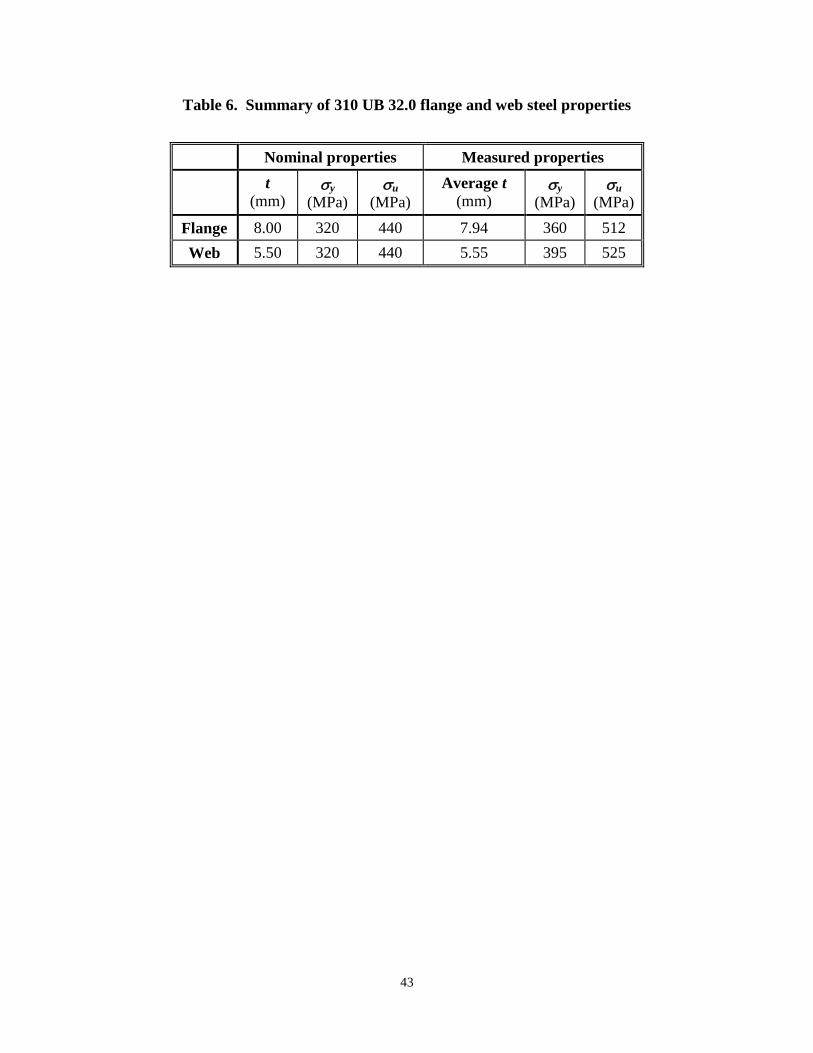
The stress-strain curves obtained from the tensile testing of 310 UB 32.0 flange and web samples
are shown in Figures 10 and 11. Two web and two flange specimens were tested. The shape of
the stress-strain curves is typical for mild steel – an initial elastic region followed by a yield
plateau and significant strain hardening. The steel is ductile, experiencing strains of more than
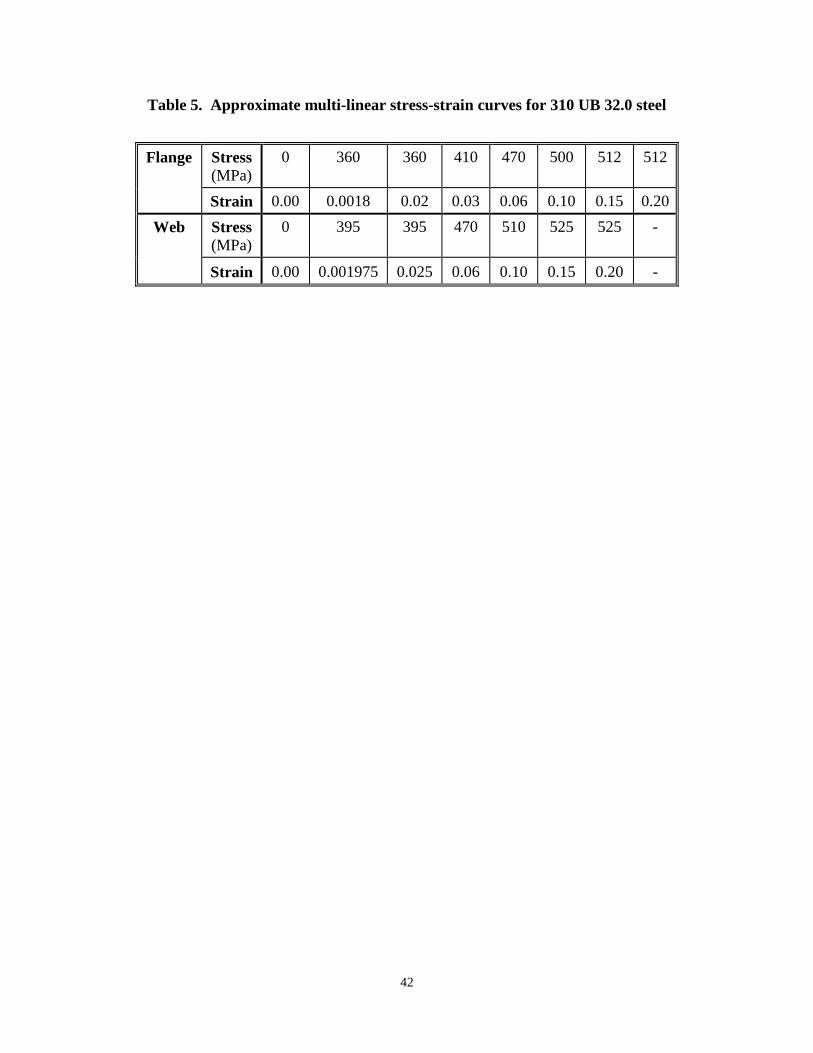
200000 microstrain before unloading occurs. Approximate multi-linear curves based on the
average of the two specimens were developed for use in the finite element analysis model (Avery
and Mahendran, 1998). The approximate curves are illustrated in Figures 10 and 11, and the
coordinates of each point are provided in Table 5. An elastic modulus (E) of 200000 MPa was
assumed. The actual thicknesses of the web and flange were measured from the tensile test
samples using a micrometer and used to calculate the stress. The average of the measured
thickness was used in the finite element analysis model. The web steel had higher yield and
ultimate stresses than the flange steel due to the greater degree of work hardening in the thinner
plates. The actual yield stresses were significantly higher than the nominal values (see Table 6).
Test frame 3 (slender rectangular hollow section)
The vertical and horizontal loads were applied simultaneously in a ratio of approximately 8:1.
That is, the load in each vertical jack was approximately eight times greater than the horizontal
reaction measured by the load cell. The loads were applied in fourteen increments of
approximately 10 kN per vertical jack and a 1.25 kN horizontal reaction. This was followed by
two smaller load increments, as the response of the frame became highly non-linear prior to
failure.
At a load of 149 kN per vertical jack and a horizontal reaction of 18.6 kN the frame began to
unload indicating that the maximum capacity of the frame had been achieved. The frame failed
Page 20
19
by in-plane instability due to a reduced stiffness caused by yielding and spread of plasticity
caused by the applied axial compression force and bending moment, residual stresses, and local
buckling. Extensive plastic local buckling deformations were observed at the base of the
columns and adjacent to the beam-column connection. The maximum measured strain occurred
in the outside flange near the base of the right hand column, and was far in excess of the yield
strain determined from the tensile test of the flange steel. This indicates that significant yielding
occurred prior to failure. Note that the term “flange” refers to the longer sides of the 200x100x4
RHS, which are perpendicular to the plane of loading and in-plane deflection.
The relationship between the applied vertical jack load and the relative vertical displacement of
the right hand column is shown in Figure 12. This load-deflection curve can be used to verify
the axial stiffness and capacity of an analytical model. Unlike test frame 2, the axial response of
the column is non-linear almost from the commencement of loading. This is due to the bowing
effect (vertical displacements caused by large bending displacements because the columns are
more slender than for test frame 2). The axial stiffness of the column reduces at a greater rate as
the vertical load increases due to increased yielding and local buckling.
The relationship between the horizontal reaction force and the relative in-plane horizontal
displacement of the right hand column in test frame 3 is shown in Figure 13. This load-
deflection curve can be used to verify the in-plane flexural stiffness and capacity of an analytical
model. The curve is non-linear due to in-plane instability (second-order effects), material
yielding, and local buckling. The in-plane horizontal response of test frame 3 is characterised by
significantly larger deflections at the base of the right hand column than test frame 2. This is due
to the greater column slenderness.
Page 21
20
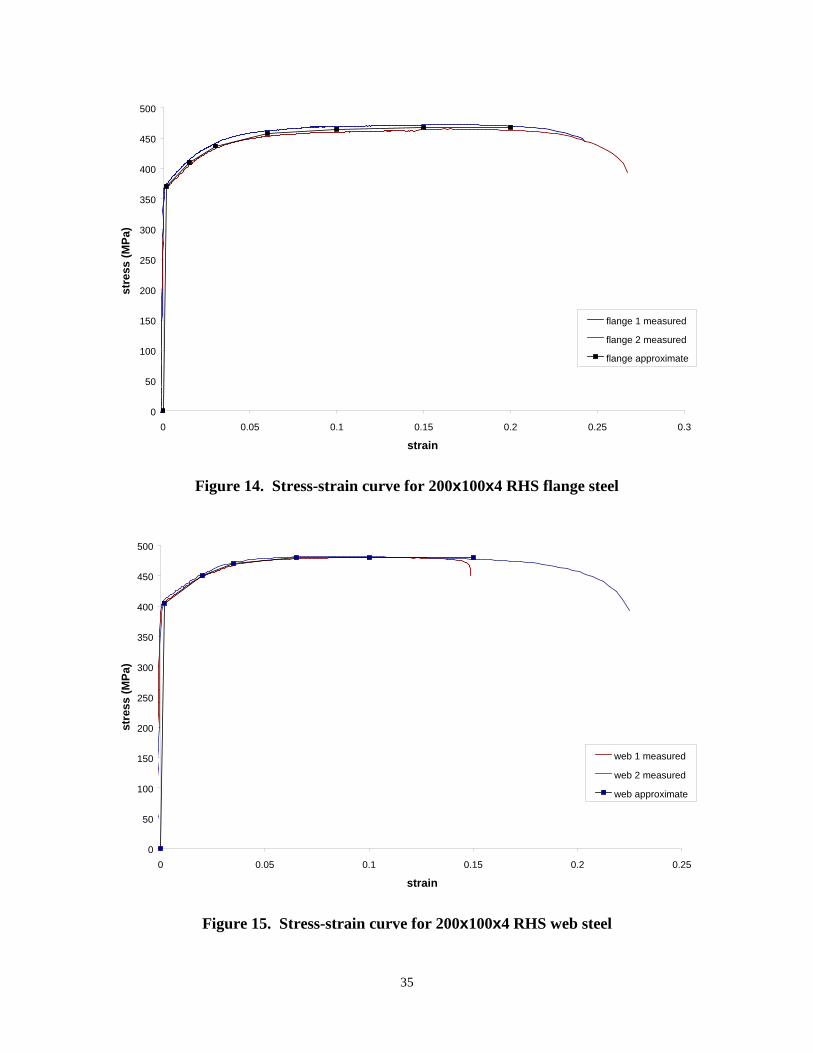
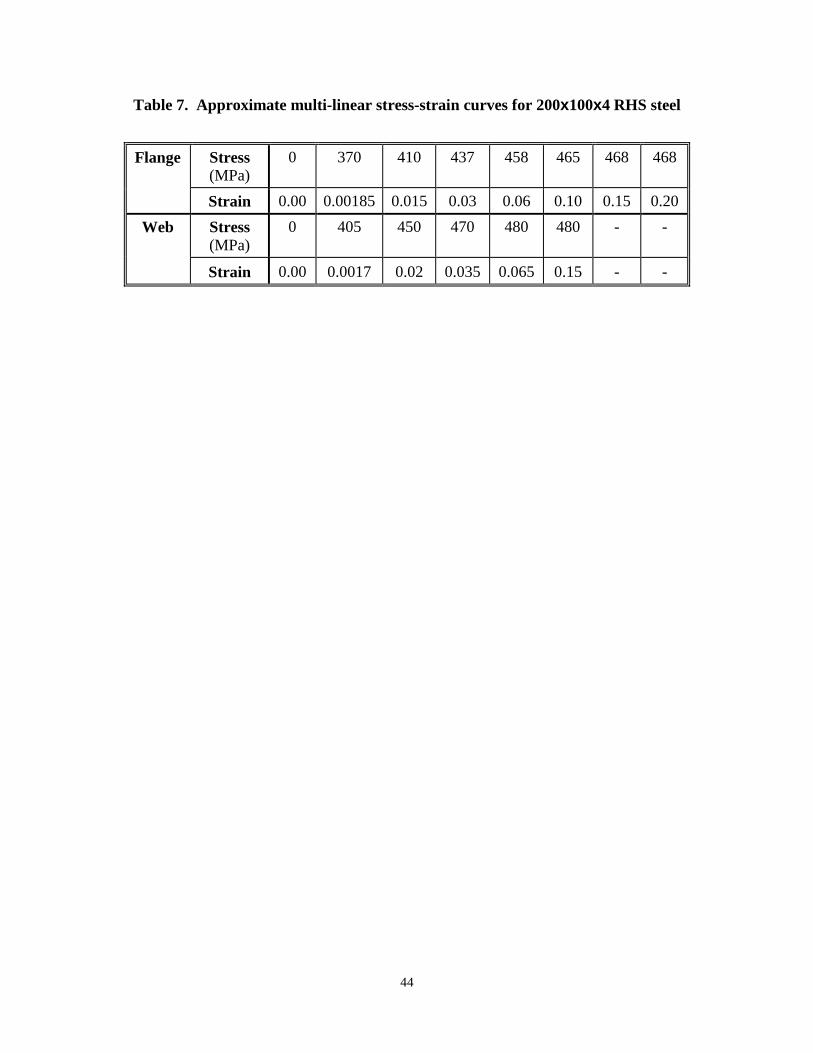
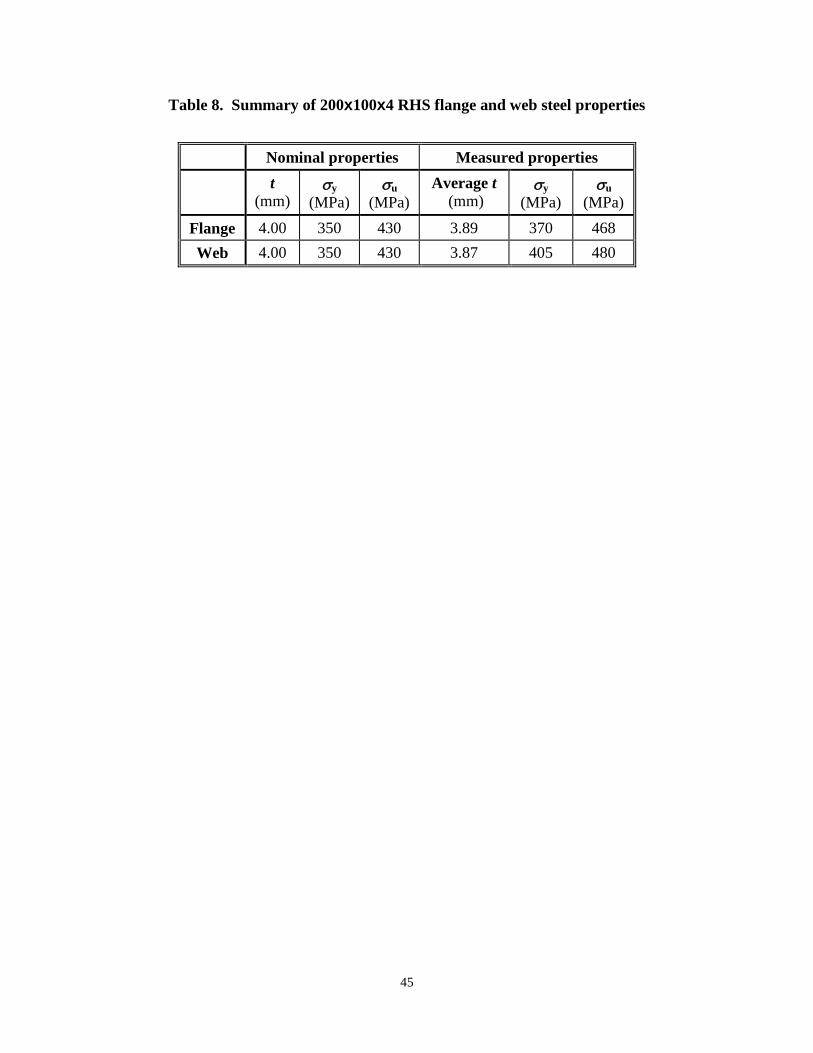
The stress-strain curves obtained from tensile testing of the 200x100x4 RHS flange and web
samples are shown in Figures 14 and 15. Unlike the hot-rolled I-section steel, strain hardening
commences immediately following the initial yield, with no plateau. Approximate multi-linear
curves based on the average of the two specimens were developed for use in the finite element
analysis model (Avery and Mahendran, 1988). The approximate curves are illustrated in Figures
14 and 15, and the coordinates of each point are provided in Table 7. A summary of the nominal
and measured values of yield stress, ultimate stress, and thickness is provided in Table 8.
Test frame 4 (slender welded I-section)
The vertical and horizontal loads were applied simultaneously in a ratio of approximately 6:1.
That is, the load in each vertical jack was approximately six times greater than the horizontal
reaction measured by the load cell. The loads were applied in eight increments of approximately
60 kN per vertical jack and 10 kN horizontal reaction, followed by three increments of 30 kN per
vertical jack and 5 kN horizontal reaction. The load sequence culminated with three smaller load
increments as the response of the frame became highly non-linear prior to failure.
At a load of 615 kN per vertical jack and a horizontal reaction of 110 kN the frame began to
unload indicating that the maximum capacity of the frame had been achieved. The frame failed
by in-plane instability due to a reduced stiffness caused by yielding and spread of plasticity
caused by the applied axial compression force and bending moment, residual stresses, and local
buckling. Plastic local buckling deformations were observed at the base of the columns and
adjacent to the beam-column connection. Although the plastic deformations were most obvious
in the flanges, web local buckling actually occurred prior to flange local buckling. The maximum
Page 22
21
measured strain occurred in the outside flange near the base of the right hand column, and was
significantly greater than the yield strain determined from the tensile test of the flange steel.
The relationship between the applied vertical jack load and the relative vertical displacement of
the right hand column for test frame 4 is shown in Figure 16. This load-deflection curve can be
used to verify the axial stiffness and capacity of an analytical model, although the measured
stiffness may be inaccurate near the ultimate load due to slippage of the top vertical displacement
transducer. As for test frame 3, the axial response of the column is non-linear almost from the
commencement of loading. This is not due to the bowing effect, because the flexural
displacements are small. Rather, it is probably due to high residual stresses caused by welding
during fabrication. These residual stresses can cause early yielding, resulting in a reduction in
the axial stiffness. The axial stiffness of the column reduces at a greater rate as the vertical load
increases due to increased yielding and local buckling.
The relationship between the horizontal reaction force and the measured relative in-plane
horizontal displacement of the right hand column for test frame 4 is shown in Figure 17. This
load-deflection curve can be used to verify the in-plane flexural stiffness and capacity of an
analytical model. The relative in-plane horizontal deflection of test frame 4 exhibits a non-linear
response to the horizontal load as early as the fourth load increment. This is probably due to
high welding residual stresses.
The stress-strain curves obtained from tensile testing of the welded I-section flange and web
samples are shown in Figures 18 and 19. Approximate multi-linear curves based on the average
of the two specimens were developed for use in the finite element analysis model (Avery and
Mahendran, 1998). The approximate curves are illustrated in Figures 18 and 19, and the
Page 23
22
coordinates of each point are provided in Table 9. A summary of the nominal and measured
values of yield stress, ultimate stress and thickness is provided in Table 10.
Comparison of test results with AS4100 design capacities
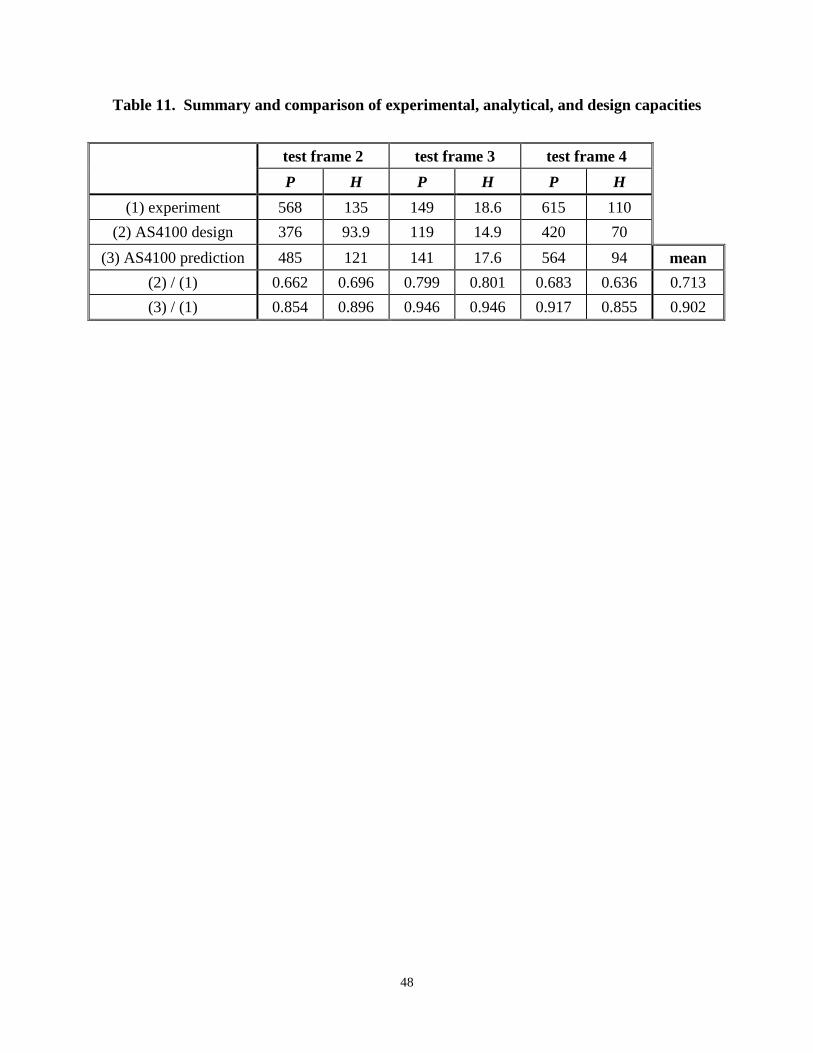
A comparison of the ultimate loads obtained from the three test frames with the corresponding
design capacities predicted by AS4100, the Australian standard for the design of steel structures
(SAA, 1990), is provided in Table 11. The “AS4100 design” capacities were obtained using
nominal yield stresses and a capacity reduction factor of 0.9, while the “AS4100 prediction”
capacities were calculated with the measured yield stresses and no capacity reduction factor.
Table 11 indicates that the design capacities were approximately 30 percent conservative, and
even the predicted capacities were conservative by an average of 10 percent. This difference can
be attributed to the use of semi-empirical specification equations for individual member capacity
checks and the simplified elastic analysis method used for the AS4100 design calculations.
Conventional design specifications such as AS4100 could be expected to be even more
conservative for structures with greater redundancy and scope for inelastic redistribution than the
three test frames.
CONCLUSIONS
This paper has described the large scale testing of steel frames comprising non-compact sections,
undertaken to validate a distributed plasticity analytical model (Avery and Mahendran, 1998).
An external support frame suitable for testing two dimensional single bay, single storey, large
scale sway frames was designed, erected, and proof tested using a test frame comprising
members of compact cross-section. Three frames with full lateral restraint and rigid joints,
Page 24
23
comprising members of non-compact cross-section subject to the effects of local buckling were
loaded to failure. The three frames were representative of a range of common section types (hot-
rolled I-sections, rectangular hollow sections and welded I-sections), member and section
slendernesses, and vertical to horizontal load ratios.
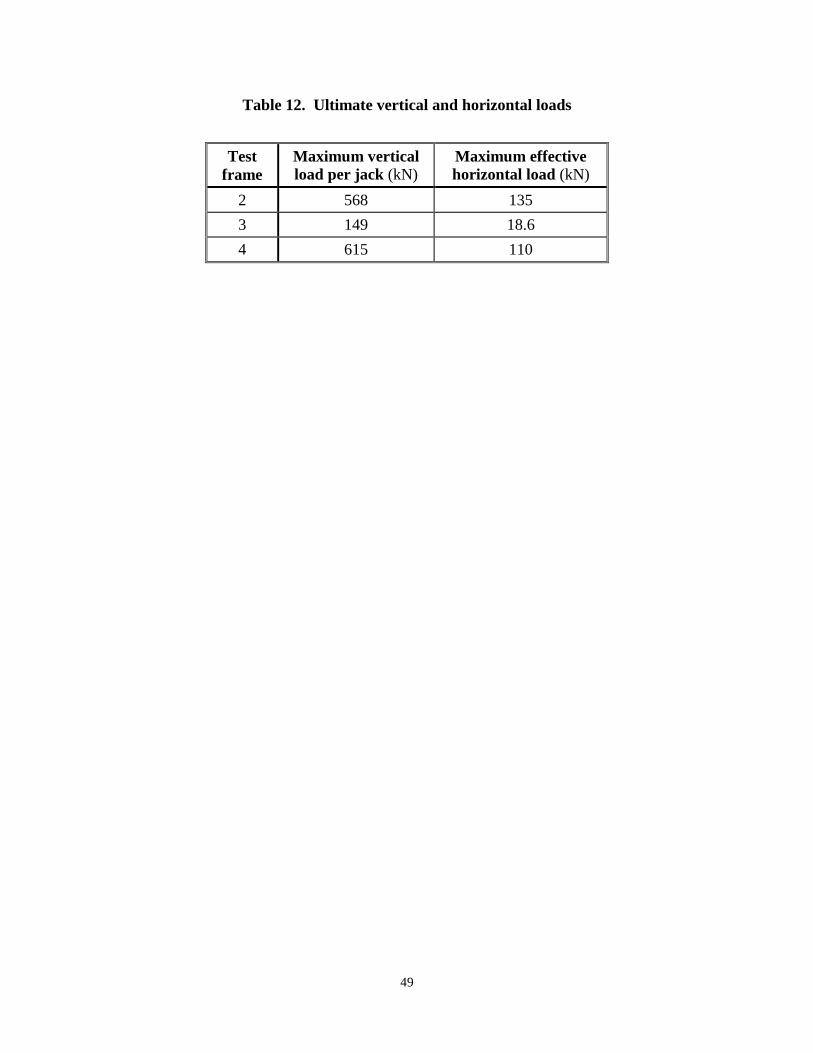
The incremental loads and forces were recorded and used to produce vertical and in-plane
horizontal load-deflection curves for each of the frames (Figures 8, 9, 12, 13, 16, and 17). These
curves and in particular the ultimate load capacities (summarised in Table 12) can be used to
verify the accuracy of analytical models for the advanced analysis of two dimensional steel
frames comprising members of non-compact cross-section.
ACKNOWLEDGEMENTS
The authors wish to thank the Queensland University of Technology (QUT) for providing
financial support through the QUT Postgraduate Research Award (QUTPRA) and the 1996
Meritorious Research Project Grants Scheme, and the Physical Infrastructure Centre and the
School of Civil Engineering at QUT for providing the necessary facilities and support to conduct
this project.
REFERENCES
Abe, K., Tagawa, K., and Sakai, M. (1983), “A study of elasto-plastic strength of gable frame
composed by H-shapes”, Transactions of the Architectural Institute of Japan, Vol. 325, pp. 25-
31.
Page 25
24
Alsaket, Y. (1998), “Benchmark solutions for steel frame structures”, ME thesis, School of Civil
Engineering, Queensland University of Technology, Brisbane, Australia.
Avery, P. (1998), “Advanced analysis of steel frames comprising non-compact sections”, PhD
thesis, School of Civil Engineering, Queensland University of Technology, Brisbane, Australia.
Avery, P. and Mahendran, M. (1998), “Distributed plasticity analysis of steel frame structures
comprising non-compact sections”, Submitted for possible publication in Engineering Structures.
ECCS (1984), “Ultimate limit state calculation of sway frames with rigid joints”, Technical
Committee 8 - Structural Stability Technical Working Group 8.2 - System, Publication No. 33.
El-Zanaty, M. H., Murray, D. W., and Bjorhovde, R. (1980), “Inelastic behaviour of multi-storey
steel frames”, Structural Engineering Report No. 83, University of Alberta, Edmonton, Alberta,
Canada.
Galatanu, A. D. (1997), “Behaviour and design of hollow flange beam compression members”,
ME thesis, School of Civil Engineering, Queensland University of Technology, Brisbane,
Australia.
Hancock, G. J., Davids, A. J., Key, P. W., Lau, S. C. W., and Rasmussen, K. J. R. (1990),
“Recent developments in the buckling and nonlinear analysis of thin-walled structural members”,
Thin-Walled Structures, Vol. 9, pp. 309-338.
Heldt, T. (1997), “The use of hollow flange beams in portal frame buildings”, PhD thesis, School
of Civil Engineering, Queensland University of Technology, Brisbane, Australia.
Page 26
25
Kanchanalai, T. (1977), “The design and behaviour of beam-columns in unbraced steel frames”,
AISI Project No. 189, Report No. 2, Civil Engineering/Structures Research Laboratory,
University of Texas at Austin, TX, USA.
Key, P. W. and Hancock, G. J. (1985), “An experimental investigation of the column behaviour
of cold formed square hollow sections”, Research report No. R493, School of Civil and Mining
Engineering, University of Sydney, Sydney, Australia.
Liew, J. Y. R., Shanmugam, N. E., and Lee, S. L. (1989), “Local buckling of thin-walled steel
box columns”, Thin-Walled Structures, Vol. 8, pp. 119-145.
Liew, J. Y. R., White, D. W., and Chen, W. F. (1993), “Limit states design of semi-rigid frames
using advanced analysis: Part 2: Analysis and Design”, Journal of Constructional Steel Research,
Vol. 26, pp. 29-57.
SAA (1990), “AS4100-1990 Steel Structures”, Standards Association of Australia, Sydney,
Australia.
SAA (1991), “AS1391-1991 Methods for tensile testing of metals”, Standards Association of
Australia, Sydney, Australia.
Shanmugam, N. E., Liew, J. Y. R., and Lee, S. L. (1989), “Thin-walled steel box columns under
biaxial loading”, Journal of Structural Engineering, ASCE, Vol. 115, No. 11, pp. 2706-2726.
Shanmugam, N. E., Yu, C. H., and Liew, J. Y. R. (1995), “Large-scale testing of steel sway
frames”, Proceedings of the International Conference on Structural Stability and Design, Sydney,
Australia.
Page 27
26
Toma, S. and Chen, W. F. (1992), “European calibration frames for second-order inelastic
analysis”, Journal of Engineering Structures, Vol. 14, No. 1, pp. 7-14.
Vogel, U. (1985), “Calibrating frames”, Stahlbau, Vol. 54, pp. 295-301.
Wakabayashi, M., Matsui, C., Minami, K., and Mitani, I. (1972), “Elastic-plastic behaviours of
full size steel frame”, Transactions of the Architectural Institute of Japan, Vol. 198, pp. 7-17.
NOTATION
Ae = effective cross-section area
Ag = gross cross-section area
bf = flange width
d = total depth of section
E = elastic modulus
H = applied horizontal load
I = second moment of area with respect to the axis of in-plane bending
kf = form factor for axial compression member = Ae/Ag
Lc = length of column member
Mi = nominal in-plane moment capacity
Mo = nominal out-of-plane moment capacity
Mr = nominal section moment capacity reduced due to axial force
Ms = nominal section moment capacity = σyZe
Ns = nominal axial compression section capacity = σyAe
P = axial force or applied vertical load
Page 28
27
r = radius of gyration with respect to the axis of in-plane bending
r1 = root radius of fillet at flange-web junction
S = plastic section modulus with respect to the axis of in-plane bending
t = plate thickness
tf = flange thickness
tw = web thickness
Z = elastic section modulus with respect to the axis of in-plane bending
Ze = effective section modulus with respect to the axis of in-plane bending
Zex, Zey = major axis and minor axis effective section moduli
∆ = relative lateral deflection between member ends due to member chord rotation
δ = deflection associated with member curvature measured from the member chord
σy = yield stress
σu = ultimate stress
Page 29
28
Load cell
Lateral restraints
Roller bearings
Floor girder
RHS strut
Beam
Left handcolumn
Right handcolumn
Lateral restraints
Vertical jack Vertical jack
Horizontal jack
Y
X
Z
Figure 1. Schematic diagram of test arrangement
Figure 2. General arrangement showing external support frame
Page 30
29
Figure 3. RHS strut, load cell, and vertical jack
Figure 4. Lateral bracing of beam
Page 31
30
Figure 5. Floor girder and lateral bracing
Figure 6. Horizontal jack and column base connection, showing strain gauges and
displacement transducers
Page 32
31
Figure 7. Local buckling at the base of the right hand column for test frame 2
Page 33
32
0
100
200
300
400
500
600
0 1 2 3 4 5 6
vertical deflection (mm)
vert
ical
load
per
jack
(kN
)
Figure 8. Vertical load-deflection curve for test frame 2
0
20
40
60
80
100
120
140
0 5 10 15 20 25 30
sway deflection (mm)
horiz
onta
l loa
d (k
N)
Figure 9. Sway load-deflection curve for test frame 2
Page 34
33
0
100
200
300
400
500
0 0.05 0.1 0.15 0.2 0.25 0.3
strain
stre
ss (M
Pa)
flange 1 measured
flange 2 measured
flange approximate
Figure 10. Stress-strain curve for 310 UB 32.0 flange steel
0
100
200
300
400
500
0 0.05 0.1 0.15 0.2 0.25 0.3
strain
stre
ss (M
Pa)
web 1 measured
web 2 measured
web approximate
Figure 11. Stress-strain curve for 310 UB 32.0 web steel
Page 35
34
0
20
40
60
80
100
120
140
160
0 0.5 1 1.5 2 2.5 3
vertical deflection (mm)
vert
ical
load
per
jack
(kN
)
Figure 12. Vertical load-deflection curve for test frame 3
0
2
4
6
8
10
12
14
16
18
20
0 10 20 30 40 50 60 70 80 90
sway deflection (mm)
horiz
onta
l loa
d (k
N)
Figure 13. Sway load-deflection curve for test frame 3
Page 36
35
0
50
100
150
200
250
300
350
400
450
500
0 0.05 0.1 0.15 0.2 0.25 0.3
strain
stre
ss (M
Pa)
flange 1 measured
flange 2 measured
flange approximate
Figure 14. Stress-strain curve for 200x100x4 RHS flange steel
0
50
100
150
200
250
300
350
400
450
500
0 0.05 0.1 0.15 0.2 0.25
strain
stre
ss (M
Pa)
web 1 measured
web 2 measured
web approximate
Figure 15. Stress-strain curve for 200x100x4 RHS web steel
Page 37
36
0
100
200
300
400
500
600
0 1 2 3 4 5 6
vertical deflection (mm)
vert
ical
load
per
jack
(kN
)
Figure 16. Vertical load-deflection curve for test frame 4
0
20
40
60
80
100
0 2 4 6 8 10 12 14 16 18
sway deflection (mm)
horiz
onta
l loa
d (k
N)
Figure 17. Sway load-deflection curve for test frame 4
Page 38
37
0
50
100
150
200
250
300
350
400
450
0 0.05 0.1 0.15 0.2 0.25 0.3 0.35 0.4
strain
stre
ss (M
Pa)
flange 1 measured
flange 2 measured
flange approximate
Figure 18. Stress-strain curve for welded I-section flange steel
0
50
100
150
200
250
300
350
400
450
0 0.05 0.1 0.15 0.2 0.25 0.3 0.35
strain
stre
ss (M
Pa)
web 1 measured
web 2 measured
web approximate
Figure 19. Stress-strain curve for welded I-section web steel
Page 39
38
Table 1. Extent of susceptibility to local buckling in common Australian sections
Section type
Grade % of sections with kf < 1
Minimum kf
% of sections with Ze/S < 1
Minimum Ze/S
UB 300 64.3 0.888 17.9 0.983 UB 350 67.9 0.857 25.0 0.976 UC 300 0.00 1.00 26.7 0.956 UC 350 0.00 1.00 46.7 0.935 WB 300 100 0.701 8.70 0.996 WB 400 100 0.670 65.2 0.954 WC 300 0.00 1.00 33.3 0.912 WC 400 11.1 0.964 38.9 0.851 RHS 350 29.5 0.776 2.27 0.946 RHS 450 46.7 0.721 6.67 0.941 SHS 350 3.57 0.853 17.9 0.805 SHS 450 16.7 0.721 38.9 0.715
Page 40
39
Table 2. Section dimensions and properties of members used in the test frames
Test frame
Section d mm
bf mm
tf mm
tw mm
r1 mm
Ag mm2
I 106mm4
S 103mm3
1 250 UB 37 256 146 10.9 6.4 8.9 4750 55.7 486 2 310 UB 32 298 149 8.0 5.5 13.0 4080 63.2 475 3 200x100x4
RHS 100 200 4.0 4.0 6.0 2280 4.07 91.0
4 welded I-section
366 200 8.0 3.0 - 4250 113 665
Page 41
40
Table 3. Effective section properties and capacities of members used in the test frames
Test frame
Section σy MPa
Compact-ness
Ze 103mm3
Ze/S kf Ns kN
Ms kNm
1 250 UB 37 320 C 486 1.00 1.00 1520 155.5 2 310 UB 32 320 N 467 0.983 0.915 1195 149.4 3 200x100x4
RHS 350 S 63.1 0.693 0.801 639.2 22.09
4 welded I-section
250 S 610 0.918 0.848 901 152.5
Page 42
41
Table 4. Measured out-of-plumbness geometric imperfections
Out-of-plumbness geometric imperfections (mm) Test
frame In-plane, left hand column
Out-of-plane, left hand column
In-plane, right hand
column
Out-of-plane, right hand
column 1 5.5 -8.0 1.0 -10 2 4.0 -10 -5.0 -11 3 14 16 -13 9.0 4 5.0 0.0 2.0 7.0
Page 43
42
Table 5. Approximate multi-linear stress-strain curves for 310 UB 32.0 steel
Flange Stress (MPa)
0 360 360 410 470 500 512 512
Strain 0.00 0.0018 0.02 0.03 0.06 0.10 0.15 0.20 Web Stress
(MPa) 0 395 395 470 510 525 525 -
Strain 0.00 0.001975 0.025 0.06 0.10 0.15 0.20 -
Page 44
43
Table 6. Summary of 310 UB 32.0 flange and web steel properties
Nominal properties Measured properties t
(mm) σy
(MPa) σu
(MPa) Average t
(mm) σy
(MPa) σu
(MPa) Flange 8.00 320 440 7.94 360 512 Web 5.50 320 440 5.55 395 525
Page 45
44
Table 7. Approximate multi-linear stress-strain curves for 200x100x4 RHS steel
Flange Stress (MPa)
0 370 410 437 458 465 468 468
Strain 0.00 0.00185 0.015 0.03 0.06 0.10 0.15 0.20 Web Stress
(MPa) 0 405 450 470 480 480 - -
Strain 0.00 0.0017 0.02 0.035 0.065 0.15 - -
Page 46
45
Table 8. Summary of 200x100x4 RHS flange and web steel properties
Nominal properties Measured properties t
(mm) σy
(MPa) σu
(MPa) Average t
(mm) σy
(MPa) σu
(MPa) Flange 4.00 350 430 3.89 370 468 Web 4.00 350 430 3.87 405 480
Page 47
46
Table 9. Approximate multi-linear stress-strain curves for welded I-section steel
Flange Stress (MPa)
0 303 303 341 390 420 433 435
Strain 0.00 0.001515 0.015 0.03 0.06 0.1 0.15 0.2 Web Stress
(MPa) 0 310 310 355 400 427 442 442
Strain 0.00 0.0017 0.02 0.035 0.065 0.1 0.15 0.2
Page 48
47
Table 10. Summary of welded I-section flange and web steel properties
Nominal properties Measured properties t
(mm) σy
(MPa) σu
(MPa) Average t
(mm) σy
(MPa) σu
(MPa) Flange 8.00 250 410 7.98 303 435 Web 3.00 250 410 3.04 310 442
Page 49
48
Table 11. Summary and comparison of experimental, analytical, and design capacities
test frame 2 test frame 3 test frame 4 P H P H P H
(1) experiment 568 135 149 18.6 615 110 (2) AS4100 design 376 93.9 119 14.9 420 70
(3) AS4100 prediction 485 121 141 17.6 564 94 mean (2) / (1) 0.662 0.696 0.799 0.801 0.683 0.636 0.713 (3) / (1) 0.854 0.896 0.946 0.946 0.917 0.855 0.902
Page 50
49
Table 12. Ultimate vertical and horizontal loads
Test frame
Maximum vertical load per jack (kN)
Maximum effective horizontal load (kN)
2 568 135 3 149 18.6 4 615 110
Page 51
50
List of Figure Titles
Figure 1. Schematic diagram of test arrangement
Figure 2. General arrangement showing external support frame
Figure 3. RHS strut, load cell, and vertical jack
Figure 4. Lateral bracing of beam
Figure 5. Floor girder and lateral bracing
Figure 6. Horizontal jack and column base connection, showing strain gauges and displacement transducers
Figure 7. Local buckling at the base of the right hand column for test frame 2
Figure 8. Vertical load-deflection curve for test frame 2
Figure 9. Sway load-deflection curve for test frame 2
Figure 10. Stress-strain curve for 310 UB 32.0 flange steel
Figure 11. Stress-strain curve for 310 UB 32.0 web steel
Figure 12. Vertical load-deflection curve for test frame 3
Figure 13. Sway load-deflection curve for test frame 3
Figure 14. Stress-strain curve for 200x100x4 RHS flange steel
Figure 15. Stress-strain curve for 200x100x4 RHS web steel
Figure 16. Vertical load-deflection curve for test frame 4
Figure 17. Sway load-deflection curve for test frame 4
Figure 18. Stress-strain curve for welded I-section flange steel
Figure 19. Stress-strain curve for welded I-section web steel