Page 1
This is the author’s version of a work that was submitted/accepted for pub-lication in the following source:
Hidallana-Gamage, Hasitha Damruwan, Thambiratnam, David, & Perera,Nimal(2015)Design guidance for blast-resistant glazing.Journal of Architectural Engineering, 21(3), 04015003.
This file was downloaded from: https://eprints.qut.edu.au/87226/
c© Copyright 2015 American Society of Civil Engineers
Notice: Changes introduced as a result of publishing processes such ascopy-editing and formatting may not be reflected in this document. For adefinitive version of this work, please refer to the published source:
https://doi.org/10.1061/(ASCE)AE.1943-5568.0000161
Page 2
1
Design Guidance for Blast Resistant Glazing 1
Hasitha D. Hidallana-Gamage1, David P. Thambiratnam
2, Nimal J. Perera
3 2
Abstract: This paper reviews current design standards and test methods for blast resistant 3
glazing design and compares a typical design outcome with that from comprehensive Finite 4
Element (FE) analysis. Design standards are conservative and limited to the design of 5
relatively smaller glazed panels. Standard test methods are expensive, create environmental 6
pollution and could only classify hazard ratings of smaller glazed panels. Design of a 7
laminated glass (LG) panel is carried out according to an existing design standard and then its 8
performance is examined using comprehensive FE modelling and analysis. FE results 9
indicate that both glass panes crack, interlayer yields with little damage and the sealant joints 10
do not fail for the designed blast load. This failure pattern satisfies some of the requirements 11
for minimal hazard rating in the design standard. It was evident that interlayer thickness and 12
material properties are important during the post-crack stage of a LG panel, but they are not 13
accounted for in the design standards. The new information generated in this paper will 14
contribute towards enhanced blast design of LG panels. 15
CE Database subject Headings: Blast loads; Structural Design; Standards and codes; Finite 16
element method; Material failures 17
Keywords: Design standards; Test methods; Laminated glass; Blast loads; Finite element 18
modeling; Interlayer properties 19
1Ph. D
. Student, Faculty of Science & Engineering, Queensland University of Technology, GPO Box 2434, 2 20
George St., Brisbane, Queensland 4001. E-mail: [email protected] 21 2Professor, Faculty of Science & Engineering, Queensland University of Technology, GPO Box 2434, 2 George 22
St., Brisbane, Queensland 4001. E-mail: [email protected] . 23 3Adjunct Professor, Faculty of Science & Engineering, Queensland University of Technology, GPO Box 2434, 24
2 George St., Brisbane, Queensland 4001. E-mail: [email protected] 25
Page 3
2
Introduction 26
Designing building facades to blast loads has become a major concern with the ever 27
increasing terrorist attacks. Glazed facades are the most preferred in buildings by the 28
engineers and architects because of their architectural features and aesthetical aspects. Most 29
of the buildings have 4-10 m high glazed facades in ground floor lobby areas without any 30
structural framework. These lower levels are the most vulnerable to blast events of which 31
more than 80-90% of blast related injuries are due to flying glazed fragments and facade 32
pieces. If building facades disintegrate, direct blast pressure entering the building can cause 33
injuries to occupants and even structural collapse. Blast resistant glazing should therefore be 34
used in buildings to minimize, if not eliminate the hazard from potential terrorist attacks. 35
Laminated glass (LG) consists of two or more glass plies permanently bonded with one or 36
more polymer interlayers. It has a superior blast resistance compared to monolithic glass and 37
hence mostly used in blast resistant glazing. The major advantage of LG is that even if the 38
glass cracks, the interlayer holds the glass fragments instead of forming free flying shards. 39
Upon fracture, annealed and heat strengthened glass produce large shards which adhere well 40
to the interlayer and thus reduce the amount of flying and falling glass shards. Use of 41
annealed or heat strengthened glass types in LG, instead of fully tempered glass, has hence 42
been recommended (Norville and Conrath 2001). Polyvinyl butyral (PVB) is commonly used 43
as the interlayer material in LG glass, but some stiffer interlayer materials such as ionoplast is 44
also used in practice (Ledbetter et al. 2006). LG panels are fixed to the window frames using 45
structural sealant joints where silicone and rubber are the common sealant materials. 46
This paper reviews the latest design standards and documents used in blast resistant glazing 47
design such as American Society for Testing and Materials (ASTM) F 2248-09 (ASTM 48
2010a), Unified Facilities Criteria (UFC) 4-010-01 (DoD 2013), UFC 3-340-02 (DoD 2008), 49
Page 4
3
UK Glazing Hazard Guide (1997) and Protective Design Center - Technical Report (PDC-50
TR) 10-02 (2012). Standard test methods such as ASTM F 1642-04 (ASTM 2010b), ISO 51
16933 (ISO 2007a) and ISO 16934 (ISO 2007b) are also reviewed in the paper. Shortcomings 52
and limitations in those design standards and test methods are briefly discussed. Authors have 53
developed and validated a rigorous numerical procedure with using LS-DYNA (Hallquist 54
2006) finite element (FE) code to study the blast response of LG panels. This paper extends 55
their previous research work to apply their modeling techniques to analyze LG panels under 56
blast loads. The comprehensive information provided through such analysis will not only 57
enhance the understanding on the blast response of LG panels, but also facilitate their design. 58
Design of a LG panel is first carried out according to ASTM F 2248-09 (ASTM 2010a) and 59
its performance is examined using a FE model. Results from FE analysis are used to examine 60
the failure of glass, interlayer and sealant joints. FE predictions are used to examine whether 61
the LG panel has achieved the desired level of protection according to ASTM F 2248-09 62
(ASTM 2010a). Energy absorption of different components is studied and the importance of 63
the interlayer properties is highlighted, as they are not accounted for in the current design 64
standards. In practice, engineers do blast testing to check their designs that they had carried 65
out according to design standards. Modeling techniques presented in this paper could be used 66
to complement and supplement existing design standards for the design of LG panels, where 67
applicable, and also as a solution when they are not applicable, reducing costs, risks and 68
environmental pollution involved with blast testing. 69
Design standards for blast resistant glazing 70
ASTM F 2248-09 (ASTM 2010a), UFC 4-010-01 (DoD 2013), UFC 3-340-02 (DoD 2008), 71
UK Glazing Hazard Guide (1997) and PDC-TR 10-02 (2012) are the latest standards and 72
Page 5
4
documents used in blast resistant glazing design. Existing design standards and their 73
limitations are reviewed below. 74
ASTM F 2248-09, 2010 75
ASTM F 2248-09 (ASTM 2010a) provides a framework to design blast resistant glazing 76
using either single LG or insulated glass fabricated with LG. This standard recommends 77
using either annealed or heat strengthened glass types for the glass panes than using fully 78
tempered glass which has shown a poor post-blast performance during blast testing. Even 79
though different interlayer materials are used in practice, the information provided in ASTM 80
F 2248-09 (ASTM 2010a) applies only to LG fabricated with PVB interlayer. For a given 81
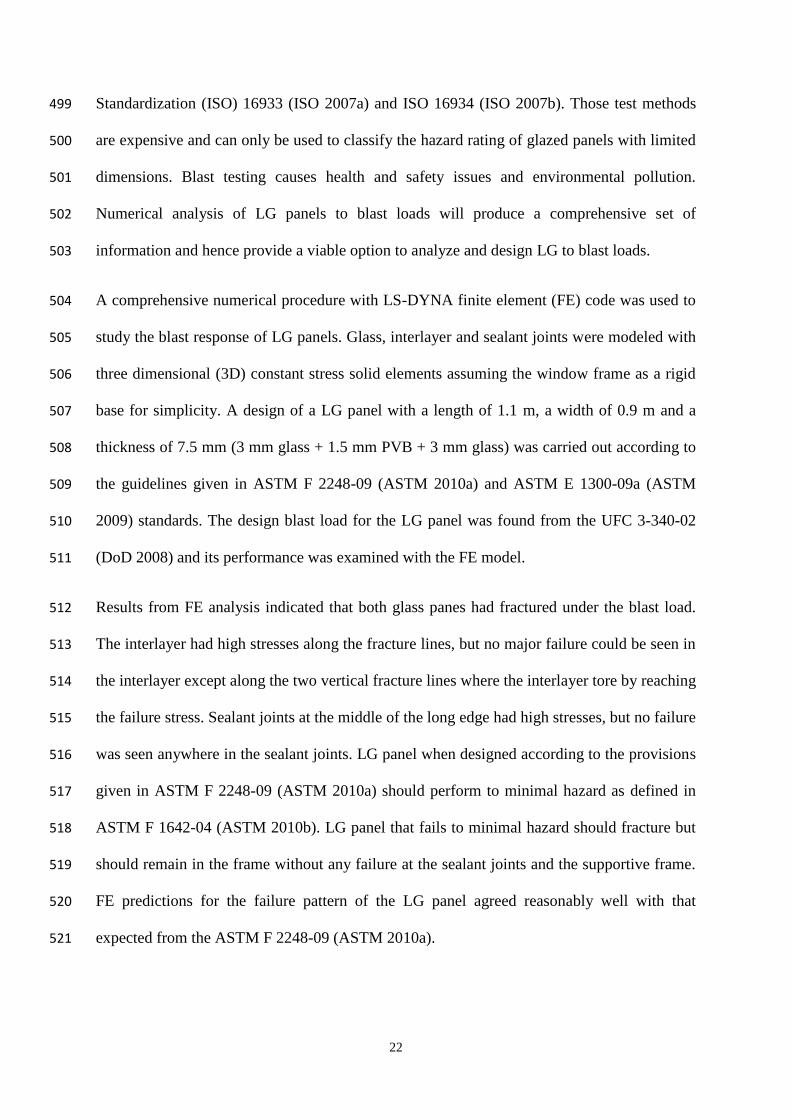
charge weight and standoff distance, the 3-second duration equivalent design load should be 82
selected from the chart shown in Fig. 1, which is given in this standard. This chart was 83
developed using the results from a number of blast tests conducted on LG panels for 84
hemispherical charge weights at ground level. 85
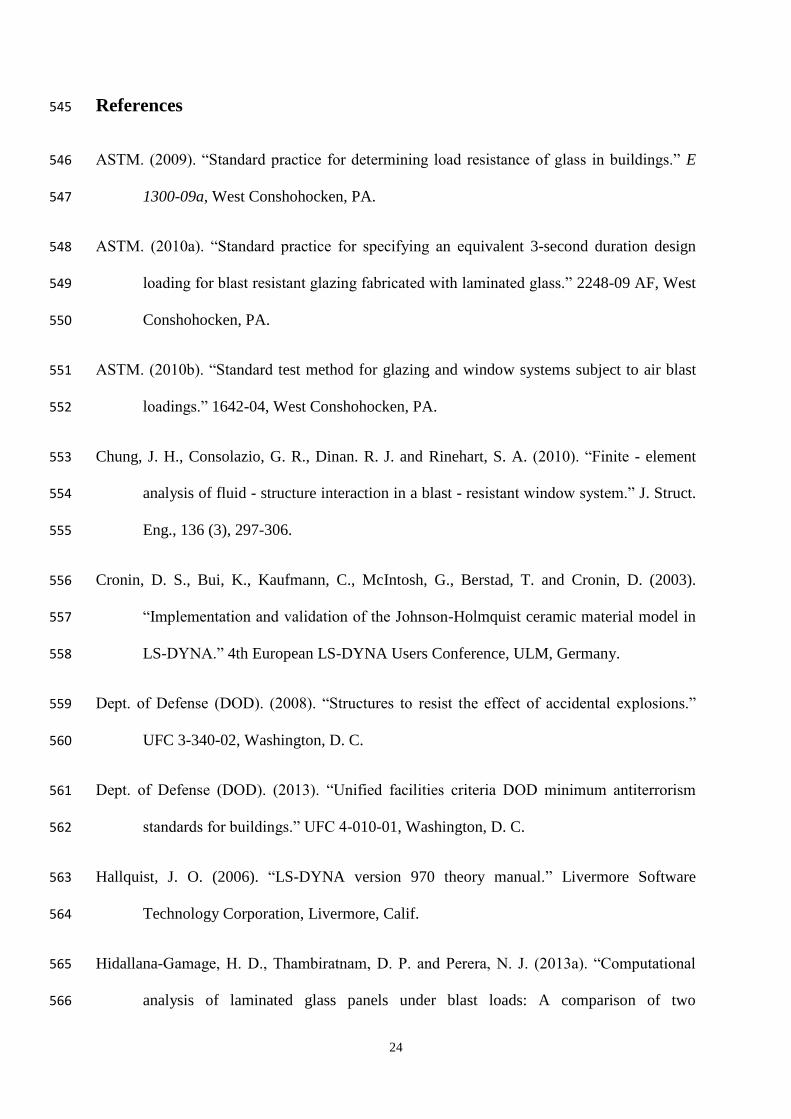
After determining the 3-second duration equivalent design load, a relevant chart as shown in 86
Fig. 2 should be selected from ASTM E 1300-09a (ASTM 2009) to obtain the thickness of 87
the LG. ASTM F 2248-09 (ASTM 2010a) recommends using either structural silicone sealant 88
or adhesive glazing tape to fix glazing to the supporting frame. The width (bite) of the 89
structural silicone sealant bed should be at least equal to or greater than 10 mm or the 90
nominal thickness of the glass panes, while less than twice the nominal thickness of glass 91
panes to which it adheres. The minimum thickness of the structural silicone sealant bed 92
should be 5 mm. The glazing tape should be within two to four times the thickness of the 93
glass pane. 94
Framing members are designed to withstand a load twice the load resistance of the attached 95
glazing, and edge deflection of the glazing should be less than L/60 (L denotes the length of 96
Page 6
5
the supported edge). Framing system supporting the glazing should be attached mechanically 97
to the structural framing system using fasteners that should be designed to resist uniform load 98
acting on the glazing. The design load of the fasteners should be two times the magnitude of 99
the load resistance of the glazing if the maximum air blast pressure is greater than one half 100
the magnitude of the load resistance of glazing. On the other hand, the fasteners should be 101
designed to a load equal to the load resistance of the glazing if the maximum air blast 102
pressure is less than one half the magnitude of the load resistance of glazing. The guidelines 103
given in ASTM F 2248-09 (ASTM 2010a) ensure that blast resistant glazing fails by tearing 104
of the interlayer rather than a failure at the supports. Blast resistant glazing designed with this 105
standard performs to minimal hazard as defined in ASTM F 1642-04 (ASTM 2010b). When a 106
LG panel fails under a minimal hazard, it is expected to fracture but it should remain in the 107
frame without any failure at the sealant joints and the supportive frame. Design guidelines in 108
ASTM F 2248-09 (ASTM 2010a) have been explained in detail by Norville and Conrath 109
(2006). 110
However, ASTM F 2248-09 (ASTM 2010a) has some limitations when designing blast 111
resistant glazing and these are explained in the paper. The chart shown in Fig. 1 can be used 112
to calculate the 3-second duration design loads only for charge weights in the range of 4.5-113
910 kg TNT, and for standoff distances in the range of 6-120 m. The design charts available 114
in ASTM E 1300-09a (ASTM 2009) were developed only for LG panels having PVB as the 115
interlayer material without accounting for the thickness of the interlayer. This standard 116
therefore does not account the effects due to the variations of the thickness of the interlayer 117
and also the effects of different interlayer materials with varied material properties for the 118
blast response of LG panels. The charts available in ASTM E 1300-09a (ASTM 2009) could 119
only be used to design LG panels having a maximum length of about 5 m and width of about 120
Page 7
6
4 m. A conservative design approach based on static analysis is used to design window 121
frames, fasteners and other supporting elements. 122
Unified Facilities Criteria (UFC) Standards 123
Department of Defense (DOD), United States has developed Unified Facilities Criteria (UFC) 124
standards which are applicable for designing blast resistant windows. The latest versions of 125
two of the UFC standards: UFC 4-010-01 (DoD 2013) and UFC 3-340-02 (DoD 2008) are 126
reviewed below. The former describes an approach of designing blast resistant windows 127
basically with LG, while the later provides a design approach with monolithic fully tempered 128
glass. 129
UFC 4-010-01, 2013 130
The latest version of UFC 4-010-01 (DoD 2013) published in October 2013, supersedes its 131
previous versions published in 2003, 2007 and 2012. UFC 4-010-01 (DoD 2013) defines 132
different levels of protections known as below at standard, very low, low, medium and high, 133
which correspond to high hazard, low hazard, very low hazard, minimal hazard and no hazard 134
respectively according glazing hazard ratings defined in ASTM F 1642-04 (ASTM 2010b). 135
Two baseline explosives (explosive weights I and II) are defined in the standard and their 136
magnitudes are not mentioned publically due to security reasons. 137
Department of Defense (DOD) buildings are divided into different categories, where 138
minimum and conventional construction standoff distances are given for each building 139
category (refer Table B-1 in UFC 4-010-01). Conventional construction standoff distance 140
implies the minimum standoff distance required by a DOD building to achieve either very 141
low or low level of protections without any measures for blast resistance. Buildings must at 142
least satisfy the minimum standoff distance requirement and those that do not meet 143
Page 8
7
conventional construction standoff distances or that required a higher level of protection 144
should be designed for the potential blast threat at the available standoff distance. 145
According to UFC 4-010-01 (DoD 2013), windows and skylights in the buildings that 146
required blast resistance must be fabricated with LG, and they could be designed for the 147
credible blast load by dynamic analysis, testing or the approach given in ASTM F 2248-09 148
(ASTM 2010a). Dynamic analysis could be conducted using computer programs as described 149
in PDC-TR 10-02 (2012). Blast testing should be conducted according to ASTM F 1642-04 150
(ASTM 2010b), and they are described in the paper later. The design approach given in 151
ASTM F 2248-09 (ASTM 2010a) ensures a medium level of protection according to UFC 4-152
010-01 (DoD 2013) (minimal hazard according to ASTM F 1642-04) and was described 153
earlier in the paper. Minimum interlayer thickness should be 0.76 mm and the design of glass 154
pane thickness, structural sealant joints, frames and fasteners are carried out according to 155
ASTM F 2248-09 (ASTM 2010a). 156
Addition to LG, polycarbonate windows could also be used in blast resistant windows where 157
the frame bite (width of structural sealant joints) should be no less than 1.5 times the 158
polycarbonate thickness. Design should be carried out using 1 for both load and strength 159
reduction factors for all methods of analysis referenced in UFC 4-010-01 (DoD 2013). 160
UFC 3-340-02, 2008 161
UFC 3-340-02 (DoD 2008) provides a framework to design glazed facades with monolithic 162
fully tempered glass to blast loads. The blast load is treated as a triangular load and a 163
simplified single degree of freedom (SDOF) model is used to simulate the dynamic response 164
of the glass panels. The glass panels are analyzed based on large deflection plate theory since 165
the panel deflections are large compared to thickness of the panel. The maximum allowable 166
principal tensile stress of glazing is used as 16000 psi (110 Mpa) in the standard. Design 167
Page 9
8
deflection is the center deflection which corresponds to maximum principal tensile stress at 168
any point in the glass panel. 169
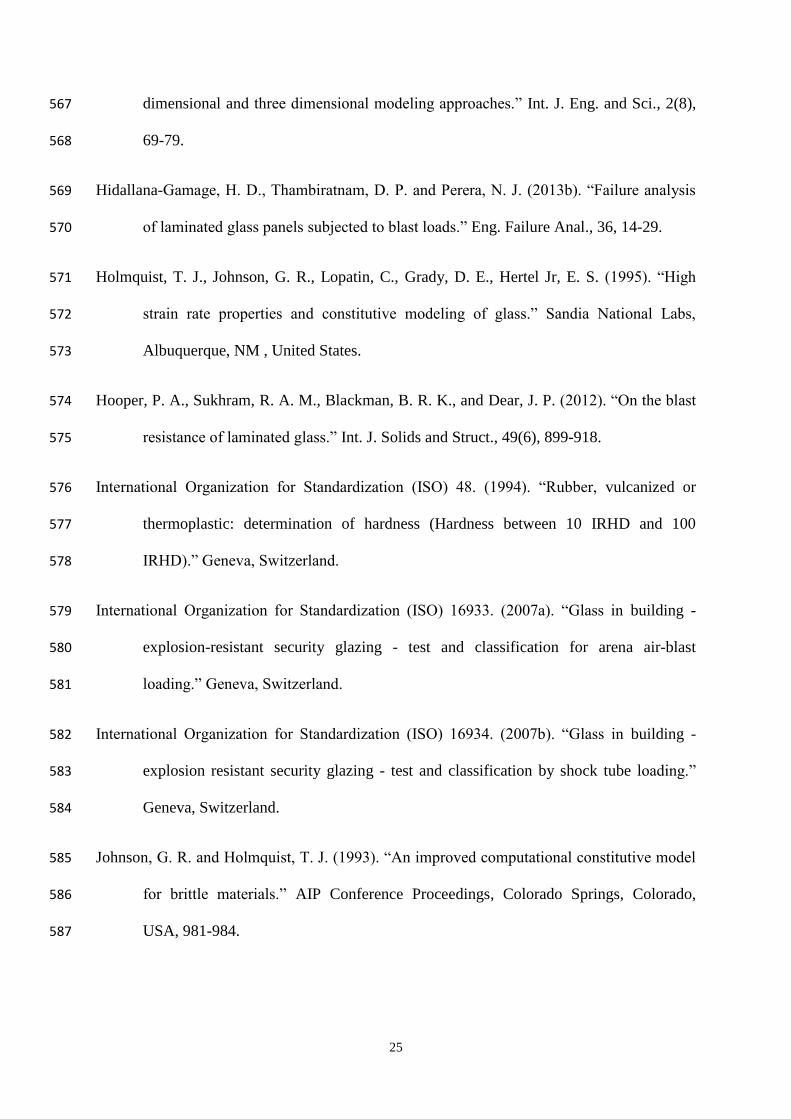
UFC 3-340-02 (DoD 2008) provides several charts as in Fig. 3 to determine the required 170
glass pane thickness for a given blast overpressure and positive load duration. The charts 171
were developed for fully tempered glass panels having different aspect ratios between 1 to 4 172
and glass thicknesses of 1/4” (6.35 mm), 5/16” (7.94 mm), 3/8” (9.53 mm), 1/2” (12.7 mm), 173
5/8” (15.88 mm) and 3/4” (19.05 mm). In addition to charts, set of formulae is given in the 174
standard to design blast resistant glazing. Framing members should be designed for the load 175
transferred from the glass panel and static design blast load applied to all exposed members. 176
Relative displacement of the framing members is limited to the smaller of 1/264th
of its span 177
and 1/8” (3.18 mm). Maximum stresses in the framing members and fasteners are limited to 178
fm/1.65 and fm/2 respectively where, fm is the yield strength of the frame material. 179
The limitations in the UFC 3-340-02 (DoD 2008) standard are briefly described below. This 180
standard uses a simplified SDOF analysis method to study the blast response of glazed panels 181
by accounting for the positive phase of the blast load only. The design charts developed in 182
this standard are applicable for monolithic fully tempered glass only. The maximum length 183
and width of the glass panels that could be designed with UFC 3-340-02 (DOD 2008) are 184
limited to about 3 and 1.5 m respectively. However, it could be noted that the generalized 185
analyse and design method given in this standard can be applied for the design of LG or any 186
glazing type with different sizes, if the corresponding load-resistance curve is determined 187
from an analytical or experimental study. 188
UK Glazing Hazard Guide, 1997 189
UK Glazing Hazard Guide (1997) provides a more realistic approach for designing glazed 190
facades with LG panels by accounting for their both pre-crack and post-crack behavior under 191
Page 10
9
blast loads. This guide idealizes a LG panel as a SDOF system and undertakes a time-history 192
analysis for a given blast threat. Pre-crack resistance function is derived based on large 193
deflection plate theory by considering the dynamic breaking strength of glass. The dynamic 194
breaking strengths used in the design are 80 MPa for annealed glass and 200 MPa for fully 195
tempered glass. The post-crack resistance function is derived considering the membrane 196
action of PVB interlayer, but neglecting the stiffness of cracked glass panes. Based on the 197
extensive blast tests conducted for common window sizes used in the UK (about 1.25 m × 198
1.55 m), it has been shown that about 200 mm central deflection will cause the limit of 199
tearing in PVB interlayer. 200
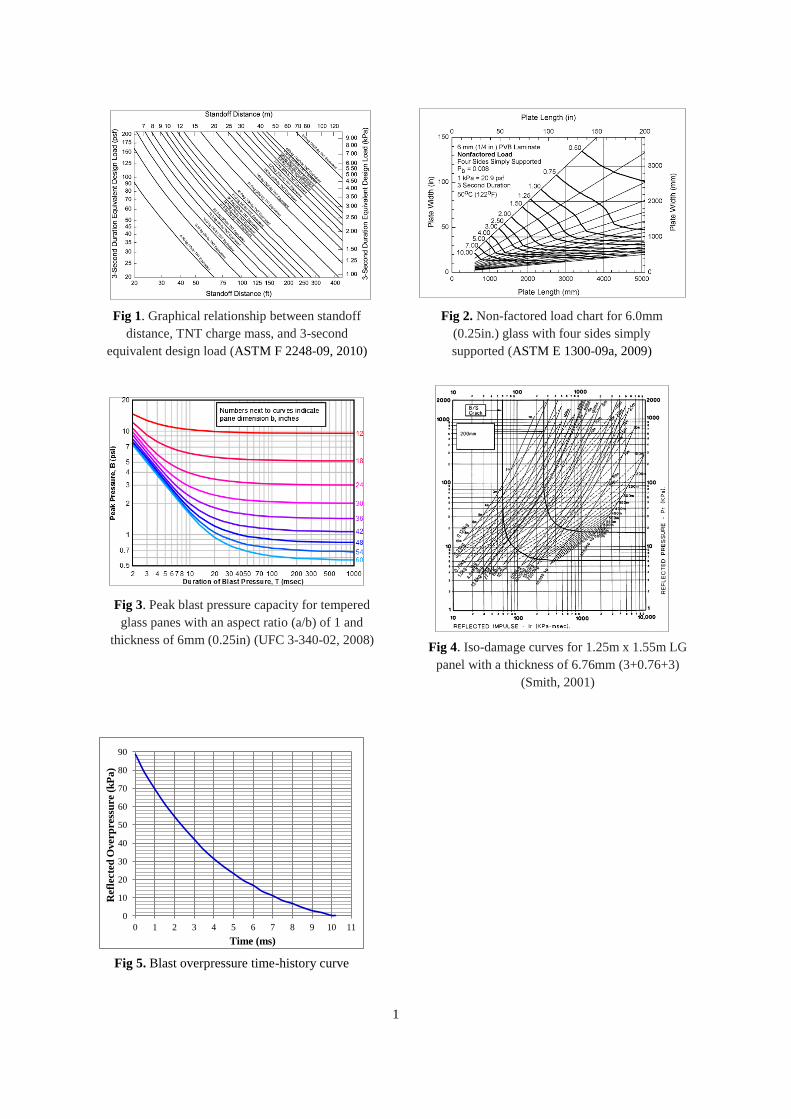
UK Glazing Hazard Guide (1997) provides set of diagrams called Pressure-Impulse diagrams 201
(P-I diagrams) for common window sizes used in the UK which could be used to evaluate 202
their performance under a given blast loading. Fig. 4 shows the P-I Diagram for a typical LG 203
panel (Smith 2001). Each contour line in the diagram connects P-I pairs giving same 204
deflection and stress, and those are called iso-damage lines. The lower contour line represents 205
the P-I pairs causing initial crack of the glass pane while the upper contour line represents P-I 206
pairs causing tearing of the PVB interlayer. Known blast threats can be marked on the P-I 207
diagram of a selected LG panel to estimate its performance under the blast threat. The panel 208
edges should be securely held in robust frames by using structural silicone sealant with a 209
width (bite) of about 35 mm. Support reactions can be obtained based on equivalent SDOF 210
factors for two-way spanning simply supported panes with a uniform load. 211
This guide has some limitations as briefly described below. It is restricted to military use 212
giving limited access to the external users. The authors could not find a copy of this 213
document and hence limited information is given in the paper. UK Glazing Hazard Guide 214
(1997) is limited to a few window sizes used in the UK and therefore has a limited 215
application in designing blast resistant glazing in real buildings. 216
Page 11
10
Protective Design Center - Technical Report (PDC-TR) 10-02 217
Protective Design Center - Technical Report (PDC-TR 10-02 (2012) presents engineering 218
guidelines and cost effective solutions for the design of window systems to reduce their 219
fragment hazards from blast loads. This report describes two design approaches known as 220
static and dynamic approach that could be used to design single glazing units or insulated 221
glazing units fabricated with LG to blast loads. The static design approach is the same 222
approach presented in ASTM F 2248-09 (ASTM 2010a), which is used in conjunction with 223
ASTM E 1300-09a (ASTM 2009) to select an appropriate glass type and a thickness. This 224
approach was described earlier in the paper and is also described in detail in PDC-TR 10-02 225
(2012) with some worked examples. 226
Dynamic analysis and design of blast resistant glazing could be carried out by using the 227
available FE codes or the computer programs recognized by the blast community. The 228
authors prefer the use of FE codes when analyzing and designing glazing under blast loads 229
and their approach is described later. However, PDC-TR 10-02 (2012) provides some useful 230
information on computer programs and their applications to design window systems under 231
blast loads. SBEDS-W and WinGARD are two such computer programs where SBEDS-W is 232
available from the Protective Design Center (PDC) and WinGARD is available from the 233
Whole Building Design Guide (WBDG). These programs are based on SDOF analysis where 234
their approach is an iterative process of selecting initial glazing or member size and then 235
repeating the analysis until the window system is found to have an acceptable response. The 236
dynamic design procedure based on SBEDS-W computer program is described in detail in 237
PDC-TR 10-02 (2012). 238
Computer programs used in blast resistant glazing design have some limitations as described 239
below. One of the major limitations is that the design outcome will be much conservative as 240
Page 12
11
it is based on simplified SDOF analysis. On the other hand, a comprehensive knowledge and 241
an understanding about the computer program are required to achieve feasible and safe 242
design. However, these programs generate the output results in numbers unlike in the FE 243
codes where it is possible to observe the predicted response and the failure pattern. 244
Standard test methods for blast resistant glazing 245
Standard test methods provide guideline to classify the hazard rating of glazed panels 246
depending on their performance under blast loads. These test methods can be classified into 247
two types as arena air blast test and shock tube test. An arena air blast test is carried out in an 248
open environment and is expensive compared to the shock tube test, but it tests several test 249
panels simultaneously. A shock tube test is carried out in a closed tube and is not a realistic 250
test, but is capable of reproducing the same shock repeatedly. ASTM and ISO standards are 251
available for both test types and they are explained below. 252
ASTM F 1642-04, 2010 253
ASTM F 1642-04 (ASTM 2010b) test method provides a structured procedure to test and rate 254
all glazing, glazing systems, and glazing retrofit systems including, but not limited to, those 255
fabricated from glass, plastic, glass-clad plastics, LG, glass/plastic glazing materials, and 256
film-backed glass. The hazard rating of a glazing system is determined based on the severity 257
of fragments generated during the blast testing. The severity of fragments is determined by 258
considering the number, size and location of fragments observed after the test. A fragment is 259
defined as any particle having a united dimension of 2.5 cm or greater which is calculated by 260
adding its width, length and thickness. 261
ASTM F 1642-04 (ASTM 2010b) provides six rating criteria known as no break, no hazard, 262
minimal hazard, very low hazard, low hazard and high hazard, and those are explained in the 263
Page 13
12
standard. Testing can be conducted using either arena air blast or shock tube test types from 264
which the blast load is obtained. This standard requires at least three test specimens 265
representative of a glazing or glazing system to be tested at a given blast load and an 266
additional specimen should be used for pre-test measurements. Pressure transducers are used 267
to record the blast pressure on the test panel during the testing. 268
International Organization for Standardization (ISO 16933 and ISO 16934) 269
International Organization for standardization (ISO) provides two standard test methods that 270
could be used to test and classify the performance of glazing systems under blast loads. They 271
are ISO 16933 (ISO 2007a) and ISO 16934 (ISO 2007b) where the former is based on arena 272
air blast test while the latter is based on shock tube test. ISO 16933 (ISO 2007a) covers broad 273
range of blast parameters incorporating 7 standard blasts simulating vehicle bombs and 7 274
standard blasts simulating smaller hand-carried satchel bombs. On the other hand, ISO 16934 275
(ISO 2007b) applies for blast waves generated in shock tube facility, simulating the reflected 276
pressures and impulses generated from high-explosive detonations of approximately 30-2500 277
kg TNT at standoff distances from about 35-50 m. Both standards provide a structured 278
procedure to test security glazing including, those fabricated from glass, plastic glazing sheet 279
materials, glass-clad plastics, LG, insulated glass, glass/plastic glazing materials, and film-280
backed glass. 281
Minimum of three test specimens, each (1100 ± 5 mm) x (900 ± 5 mm) should be tested at a 282
given level of air blast for the purpose of classification according to these standards. Test 283
specimens should be clamped to the test frame using rubber strips 4 ± 0.5 mm thick, 50 ± 5 284
mm wide and of hardness 50 ± 10 IRHD in accordance with ISO 48 (ISO 1994). However, 285
non-standard test specimens could only be tested, but not classified according to these 286
standards. They provide 6 hazard ratings: A-F (no break, no hazard, minimum hazard, very 287
Page 14
13
low hazard, low hazard and high hazard) based upon the severity of fragments and hazard 288
effects, evidenced by distribution of fragments and damage to the witness panel occurred 289
during the blast test. These hazard ratings are described in detail in both standards and are 290
similar to those given in ASTM F 1642-04 (ASTM 2010b). 291
Limitations in the test methods 292
The major limitation in these test methods is the high cost involved with blast testing. Most 293
of the universities and government organizations do not have sufficient funds and space to 294
conduct blast testing. As described above, all these standards require at least three specimens 295
to be tested under a given blast load, as repetitive testing is required to accurately predict the 296
behavior and the failure of a glazed panel under a blast load. On the other hand, these test 297
methods are valid for small test specimens with standard dimensions and large glazed panels 298
used in most buildings could not be classified according to the above standards. Health and 299
safety issues and environmental pollution are some other negative effects of blast testing. 300
Most of the design standards provide useful information to design blast resistant glazing 301
using LG windows. However, current design standards and test methods have some 302
limitations and they were briefly discussed above. This emphasizes the need for a new 303
analytical procedure for the design of glazing to blast loads. Numerical analysis with FE 304
codes is a feasible method that has been used to investigate the behavior of LG panels under 305
blast loads (Chung et al. 2010; Weggel and Zapata 2008; Weggel et al. 2007; Seica et al. 306
2011). This approach is presented below. 307
Finite element modeling of LG 308
LG panels are thin structures where the thickness is small compared to the in-plane 309
dimensions and could be modeled with either two dimensional (2D) shell elements or three 310
Page 15
14
dimensional (3D) solid elements. Non-linear dynamic analyses have been conducted using 311
FE codes having explicit capabilities such as LS-DYNA, ABAQUS, ANSYS and 312
EUROPLEXUX to study the blast response of LG panels. However, most of the research was 313
unable to account for the post-crack load carrying capacity of LG as well as the effects of 314
structural sealant joints. The authors have developed a rigorous and a reliable procedure to 315
study the blast response of LG by overcoming those limitations. These modeling techniques 316
were described in detail in their previous research work (Hidallana-Gamage et al. 2013a, b) 317
and are briefly described in this paper. 318
Modeling techniques 319
In the present study, LG panels are modeled with 3D constant stress solid elements using LS-320
DYNA FE code (Hallquist 2006) incorporating material model 110 321
(MAT_HOLMQUIST_CERAMICS) for glass and material model 24 322
(MAT_PIECEWISE_LINEAR_PLASTICITY) for PVB interlayer and structural sealant 323
joints. Material model 110 was developed based on Johnson-Holmquist (JH-2) material 324
model which has been widely used to model brittle materials such as concrete, ceramic, glass 325
and rock subjected to high pressures, large strains and high strain rates. The JH-2 material 326
model was developed with a set of mathematical equations and they are explained in detail in 327
the literature (Cronin et al. 2003; Johnson and Holmquist 1993; Holmquist et al. 1995). 328
Polymeric interlayers such as PVB show viscoelastic behavior under loads with long 329
durations where their shear modulus changes with the time. However, change in the shear 330
modulus of PVB is negligible under short duration loads (about 100 ms) and hence PVB 331
could be analyzed as an elastic-plastic material under blast loads (Larcher et al. 2012; 332
Hidallana-Gamage et al. 2013a, b; Wei and Dharani 2006; Wei et al. 2006). The behavior of 333
structural sealant joints could also be treated as elastic-plastic under blast loads. Both PVB 334
Page 16
15
and structural sealant joints are modeled with material model 24, which is widely used to 335
model polymeric materials with elastic-plastic properties. These material models can account 336
the high strain rate effects and the authors have confirmed the validity of these material 337
models to analyze the behavior of LG under blast loads (Hidallana-Gamage et al., 2013a, b). 338
Failure analysis of materials 339
Different failure theories are used in practice to predict the failure of engineering materials. 340
For brittle materials such as glass the 1st principal stress (σ11) is usually used to examine the 341
failure. Glass is considered to have failed if the σ11 exceeds the dynamic breaking strength of 342
glass (Tb) which should be about 80 Mpa for annealed glass under blast loads (Hooper et al. 343
2012; Seica et al. 2011). However, glass is not a homogeneous material and could break at a 344
lower strength than the expected theoretical values due to the presence of surface flaws and 345
micro cracks (Netherton and Stewart 2009). Both PVB and structural sealant materials show 346
ductile behavior where the von mises stress (σv) is used to examine the failure. In the present 347
study, they are considered to have failed if σv > failure stress of the material. The authors 348
have described these failure theories and their application to the FE modeling in detail in their 349
previous research work (Hidallana-Gamage et al. 2013b). 350
Comparison of results 351
ASTM F 2248-09 (ASTM 2010a) provides adequate provisions to design a complete façade 352
system including window glazing, sealant joints, window frame, fasteners and other 353
supportive elements. It is also referred in some of the other design standards and reports such 354
as UFC 4-010-01 (DoD 2013) and PDC-TR 10-02 (2012). This paper therefore considers the 355
design guidelines given in ASTM F 2248-09 (ASTM 2010a). Design of a LG panel with a 356
length of 1.1 m, a width of 0.9 m and a thickness of 7.5 mm (3 mm glass + 1.5 mm PVB + 3 357
mm glass) is carried out according to the guidelines given in ASTM F 2248-09 (ASTM 358
Page 17
16
2010a) and ASTM E 1300-09a (ASTM 2009) standards. Then the performance and the 359
failure pattern of the LG panel are examined under the design blast load using the results 360
from FE analysis, and the results are discussed. 361
Design based on ASTM F 2248-09 362
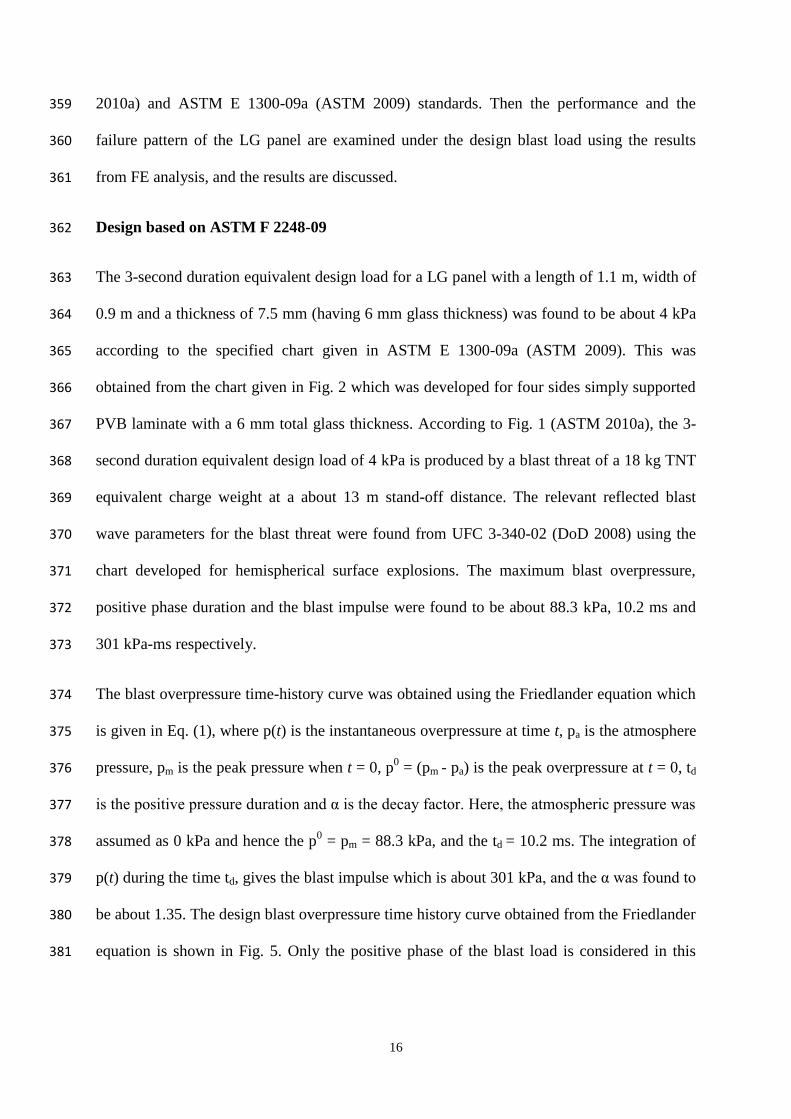
The 3-second duration equivalent design load for a LG panel with a length of 1.1 m, width of 363
0.9 m and a thickness of 7.5 mm (having 6 mm glass thickness) was found to be about 4 kPa 364
according to the specified chart given in ASTM E 1300-09a (ASTM 2009). This was 365
obtained from the chart given in Fig. 2 which was developed for four sides simply supported 366
PVB laminate with a 6 mm total glass thickness. According to Fig. 1 (ASTM 2010a), the 3-367
second duration equivalent design load of 4 kPa is produced by a blast threat of a 18 kg TNT 368
equivalent charge weight at a about 13 m stand-off distance. The relevant reflected blast 369
wave parameters for the blast threat were found from UFC 3-340-02 (DoD 2008) using the 370
chart developed for hemispherical surface explosions. The maximum blast overpressure, 371
positive phase duration and the blast impulse were found to be about 88.3 kPa, 10.2 ms and 372
301 kPa-ms respectively. 373
The blast overpressure time-history curve was obtained using the Friedlander equation which 374
is given in Eq. (1), where p(t) is the instantaneous overpressure at time t, pa is the atmosphere 375
pressure, pm is the peak pressure when t = 0, p0 = (pm - pa) is the peak overpressure at t = 0, td 376
is the positive pressure duration and α is the decay factor. Here, the atmospheric pressure was 377
assumed as 0 kPa and hence the p0 = pm = 88.3 kPa, and the td = 10.2 ms. The integration of 378
p(t) during the time td, gives the blast impulse which is about 301 kPa, and the α was found to 379
be about 1.35. The design blast overpressure time history curve obtained from the Friedlander 380
equation is shown in Fig. 5. Only the positive phase of the blast load is considered in this 381
Page 18
17
study whereas the negative phase will have a more influence on flexible structures such as 382
cable net facades (Teich et al. 2011). 383
According to ASTM F 2248-09 (ASTM 2010a), LG panel should be fixed to the frame using 384
structural sealant joints having a minimum thickness of 5 mm and a width (bite) of 10-12 385
mm. In the present study, it is assumed that the LG panel is fixed to the frame using structural 386
sealant joints having a thickness of 5 mm and a width of 10 mm. 387
FE modeling 388
FE modeling was conducted using LS-DYNA FE code incorporating 3D constant stress solid 389
elements as was explained earlier. One-quarter of the panel was analyzed using symmetry, 390
assuming that the blast load is uniformly distributed over the entire front glass pane. Glass, 391
interlayer and sealant joints were accounted for in the FE model, assuming that the sealant 392
joints are fixed to a rigid base neglecting the deformations in the frame for simplicity. This 393
could be a conservative approach as the flexible window frames will reduce the stresses in 394
glazed panels by absorbing some energy (Weggel and Zapata 2008). A 3D view and a 395
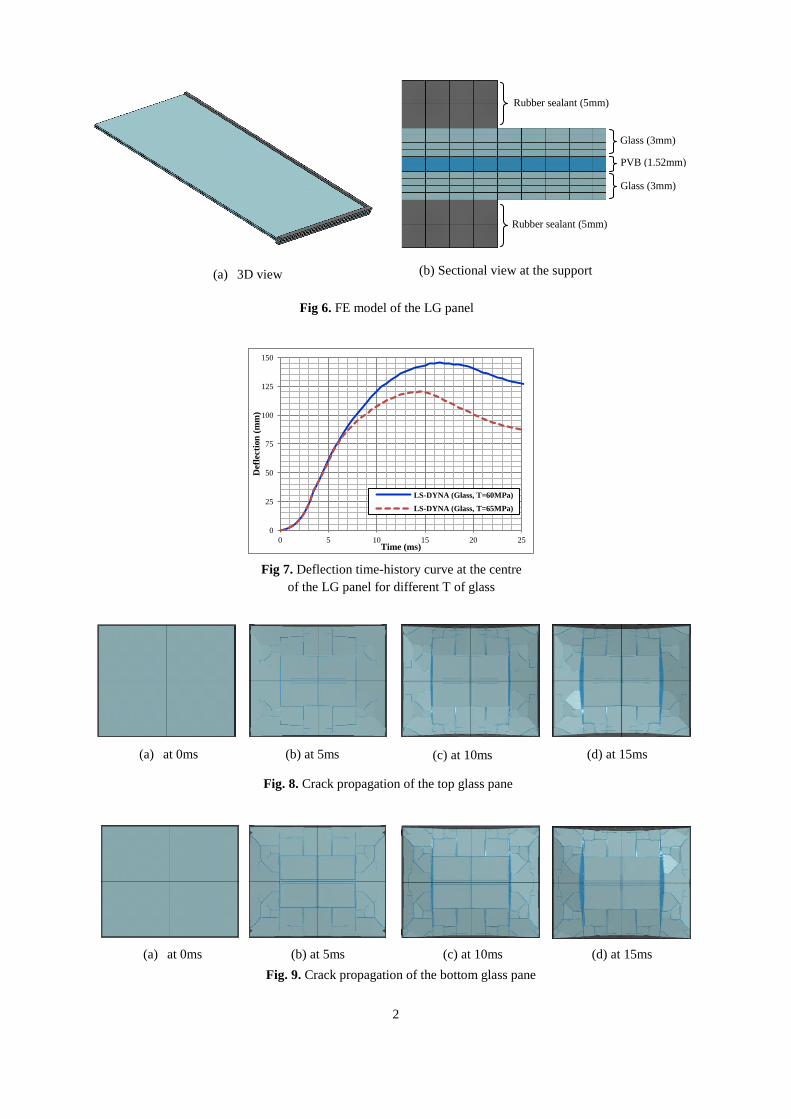
sectional view at the supports of the FE model are shown in Fig. 6(a and b) respectively. 396
The material properties of glass and the JH-2 material constants required for the material 397
model 110 were obtained from the literature (Cronin et al. 2003; Johnson and Holmquist, 398
1993; Holmquist et al. 1995; Hooper et al. 2012) and those used in the analysis are presented 399
in Table 1. The density, Young’s modulus and Poisson’s ratio of glass were taken as 2530 400
kg/m3, 72 GPa and 0.22 respectively (Hooper et al. 2012). The authors have shown that the 401
tensile strength (T) of glass used with the material model should be about 60-65 Mpa for 402
annealed glass in their previous research work (Hidallana-Gamage et al. 2013a, b). 403
p(t) = p0(1 - t/ td)e
- αt/ td (1)
Page 19
18
The material properties of interlayer and structural sealant used in the analysis are 404
summarized in Table 2. The density, Young’s modulus and Poisson’s ratio of the PVB 405
interlayer were taken as 1100 kg/m3, 530 MPa and 0.485 respectively (Hooper et al. 2012). 406
PVB was treated as an elastic-plastic material where its yield stress, failure stress and failure 407
strain were taken as 11 MPa, 28 Mpa and 2.0 respectively (Larcher et al. 2012). The density 408
and Poisson’s ratio of silicone sealant were taken as 1100 kg/m3 and 0.495 respectively, and 409
its Young’s modulus was taken as 2.3 MPa by assuming that it has hardness about 50 IRHD 410
in accordance with ISO 48 (ISO 1994). The yield stress, failure stress and failure strain of the 411
silicone sealant were taken as 2.3 Mpa, 3.5 MPa and 2.5 respectively. 412
Results from FE analysis 413
Results from FE analysis for mid-span deflection, fracture and crack propagation of glass 414
panes, stress variations and failure analyses, and finally energy absorption of glass, interlayer 415
and sealant joints are presented and described in this paper. Only one-quarter of the LG panel 416
was modeled, but graphical views of the entire model are shown using the reflection option in 417
LS-DYNA FE code. 418
Mid span defection 419
Authors have shown that the tensile strengths (T) of glass has a considerable influence on the 420
blast response of LG panels and confirmed that it should be about 60-65 MPa for annealed 421
glass. Fig. 7 compares the deflection-time history curves at the center of the panel for FE 422
models having T of 60 and 65 MPa. The FE model with a T of 60 MPa gives a maximum 423
deflection of about 145 mm at about 16.5 ms while that with a T of 65 MPa gives a maximum 424
deflection of about 120 mm at about 14.5 ms. The deflection-time history curves are identical 425
up to about 6 ms and the FE model with a T of 60 MPa gives a higher deflection their after. 426
This has happened as the FE model with a T of 60 MPa has more damage to the glass panes 427
Page 20
19
than that with a T of 65 MPa. The FE model with a T of 60 MPa is therefore used for the 428
detailed analysis in this paper as a conservative approach. 429
Fracture and stress analysis of glass panes 430
Fracture and crack propagation of the glass panes are studied and presented in the paper. 431
Glass elements failed and deleted along the fracture lines exposing the PVB elements at those 432
locations. Fig. 8 and 9 show the fracture and crack propagation of the top and bottom glass 433
panes respectively at different times. Both top and bottom glass panes show similar crack 434
patterns, but the bottom glass pane has slightly more cracks compared to the top glass pane. 435
There is a considerable increase in the crack propagation with time until about 15 ms and 436
there is no noticeable increase in the cracks there after in both glass panes. Fewer cracks are 437
formed along the edges showing no signs of damage or failure at the supports. 438
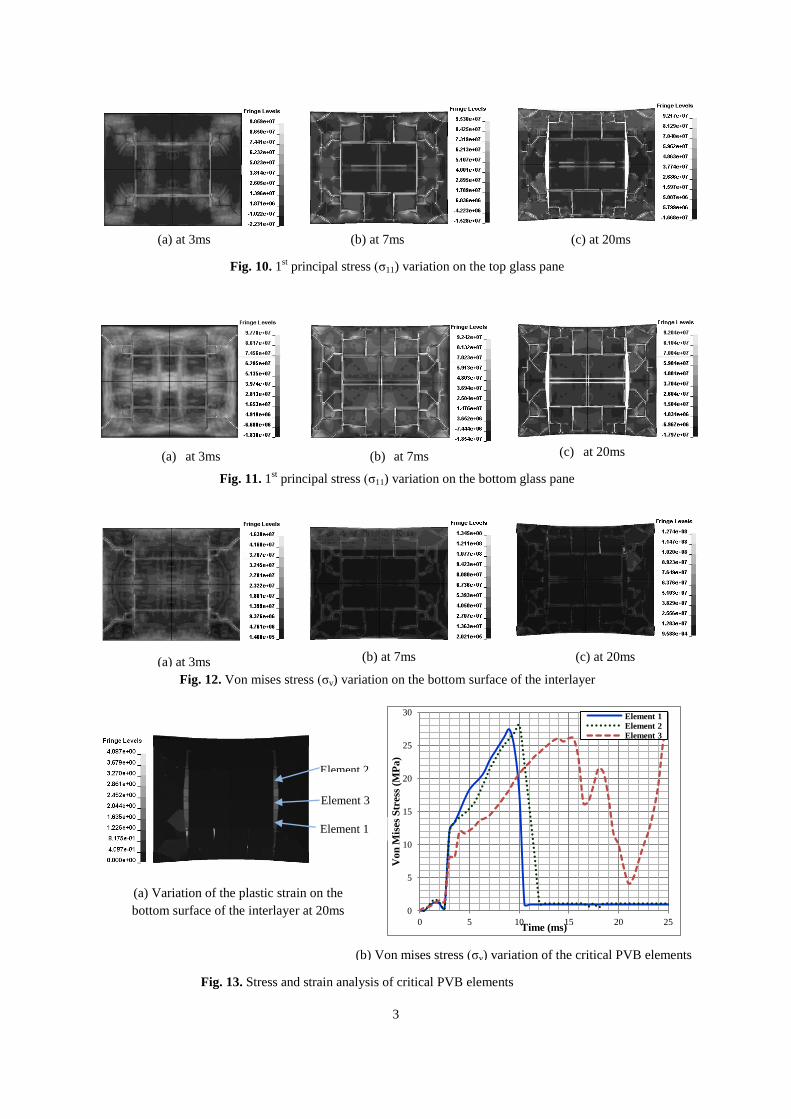
Fig. 10 shows the variation of 1st principal stress (σ11) in the top glass pane at different times. 439
Initially, σ11 increases along the diagonals and at the middle potion of the top glass pane and 440
then the region with high stress expands throughout the top glass pane. Fig. 11 shows the 441
variation of σ11 in the bottom glass pane at different times. There is an increase of σ11 along 442
the edges and at the middle potion of the bottom glass pane initially and then the region with 443
high stress expands throughout the bottom glass pane. It is evident that the σ11 increases and 444
goes beyond even 90 MPa along the fracture lines confirming the failure of glass at those 445
locations. 446
Stress-strain analysis of interlayer 447
Fig. 12 shows the variation of von mises stress (σv) at the bottom of the interlayer at different 448
times. Initially, σv increases along the edges and at the middle of the bottom surface of the 449
interlayer similar to that of bottom glass pane. When the glass cracks, the interlayer stretches 450
Page 21
20
at those locations and therefore there is an increase of σv along the fracture lines of the glass 451
panes. Fig. 13(a) shows the variation of the plastic strain at the bottom of the interlayer at 20 452
ms. Interlayer has not exceeded its yield stress at most locations except those along the two 453
vertical fracture lines where the glass elements failed and were deleted from the FE model. 454
Three PVB elements as shown in Fig. 13(a) are used for detailed analysis and variation of σv 455
in those elements are illustrated in Fig. 13(b). These elements have exceeded their yield stress 456
which is about 11 MPa but only element 1 and 2 have reached their failure stress which is 457
about 28 MPa. Those elements that exceeded the failure stress have negligible stress 458
thereafter confirming their failure. However, no major damage has occurred to the interlayer 459
for the treated blast load. 460
Stress analysis of sealant joints 461
Results from FE analysis indicate that the sealant joints along the long edge of the LG panel 462
have high stresses compared to those along the short edge. The authors have shown that 463
sealant joints at the middle of the long edge have high stresses compared to other parts 464
(Hidallana-Gamage et al. 2013b), and this is supported by Fig. 8 and 9 showing large 465
deformations in the sealant joints at those locations. Fig. 14(a) shows the critical sealant 466
elements at the middle of the long edge of the LG panel, and variation of σv in those elements 467
are illustrated in Fig. 14(b). These elements have reached their yield stress which is about 2.3 468
MPa, but none of the sealant elements in the FE model exceeds the failure stress of about 3.5 469
Mpa. This confirms that there cannot be any failure at the sealant joints of the LG panel for 470
the treated blast load. 471
Energy absorption 472
Fig. 15 compares the total energy absorption of glass, interlayer and sealant joints for 25 ms, 473
where the total energy is the summation of the internal and kinetic energies. Initially, glass 474
Page 22
21
panes absorb most of the energy reaching the maximum of about 170 J at 5 ms, and their 475
energy absorption reduces gradually and remains around 10 J after 15 ms. Energy absorption 476
of the interlayer increases gradually until about 15 ms where it reaches its maximum of about 477
200 J and then remains around that thereafter. Energy absorption of sealant joints increases to 478
about 50 J at about 11 ms, then reduces slightly and remains around 30-40 J after 20 ms. 479
After glass breaks, interlayer absorbs most of the blast energy, and contributes about 80% to 480
the total energy absorption after about 20 ms. This confirms the importance of the interlayer 481
during the post-crack stage of a LG panel. 482
Summary and Conclusion 483
This paper critically analyzed the latest standards and documents used for blast resistant 484
glazing design such as American Society for Testing and Materials (ASTM) F 2248-09 485
(ASTM 2010a), Unified Facilities Criteria (UFC) 4-010-01 (DoD 2013), UFC 3-340-02 486
(DoD 2008), UK Glazing Hazard Guide (1997) and Protective Design Center - Technical 487
Report (PDC- TR) 10-02 (2012). Most of them facilitate designing glazed panels with 488
laminated glass (LG) except UFC 3-340-02 (DoD 2008), which is limited to design with fully 489
tempered glass. Those standards are conservative as they are based on simplified single 490
degree of freedom (SDOF) analysis. They provide provisions of designing glazed panels with 491
limited dimensions and hence cannot be used in designing large facades in real buildings. 492
Dynamic analysis of glazed panels can be carried out with computer programs as described in 493
PDC-TR 10-02 (2012), but it needs a comprehensive knowledge and an understanding about 494
the computer programs for a feasible and safe design. 495
Standard test methods are used to classify the hazard rating of glazed panels depending on 496
their performance under blast loads. This paper reviewed commonly used standard test 497
methods such as ASTM F 1642-04 (ASTM 2010b), International Organization for 498
Page 23
22
Standardization (ISO) 16933 (ISO 2007a) and ISO 16934 (ISO 2007b). Those test methods 499
are expensive and can only be used to classify the hazard rating of glazed panels with limited 500
dimensions. Blast testing causes health and safety issues and environmental pollution. 501
Numerical analysis of LG panels to blast loads will produce a comprehensive set of 502
information and hence provide a viable option to analyze and design LG to blast loads. 503
A comprehensive numerical procedure with LS-DYNA finite element (FE) code was used to 504
study the blast response of LG panels. Glass, interlayer and sealant joints were modeled with 505
three dimensional (3D) constant stress solid elements assuming the window frame as a rigid 506
base for simplicity. A design of a LG panel with a length of 1.1 m, a width of 0.9 m and a 507
thickness of 7.5 mm (3 mm glass + 1.5 mm PVB + 3 mm glass) was carried out according to 508
the guidelines given in ASTM F 2248-09 (ASTM 2010a) and ASTM E 1300-09a (ASTM 509
2009) standards. The design blast load for the LG panel was found from the UFC 3-340-02 510
(DoD 2008) and its performance was examined with the FE model. 511
Results from FE analysis indicated that both glass panes had fractured under the blast load. 512
The interlayer had high stresses along the fracture lines, but no major failure could be seen in 513
the interlayer except along the two vertical fracture lines where the interlayer tore by reaching 514
the failure stress. Sealant joints at the middle of the long edge had high stresses, but no failure 515
was seen anywhere in the sealant joints. LG panel when designed according to the provisions 516
given in ASTM F 2248-09 (ASTM 2010a) should perform to minimal hazard as defined in 517
ASTM F 1642-04 (ASTM 2010b). LG panel that fails to minimal hazard should fracture but 518
should remain in the frame without any failure at the sealant joints and the supportive frame. 519
FE predictions for the failure pattern of the LG panel agreed reasonably well with that 520
expected from the ASTM F 2248-09 (ASTM 2010a). 521
Page 24
23
The interlayer absorbed about 80% of the energy after the glass had broken for the treated 522
blast load. Thickness and material properties of the interlayer have a major influence on the 523
post-crack behavior of LG, but they are not accounted for in the ASTM F 2248-09 (ASTM 524
2010a) and other design standards. Similarly, width and thickness of the sealant joints and 525
also the properties of glass would have an impact on the blast response of LG panels. Present 526
modeling techniques could be used to study the influence of material and geometric 527
properties of glass, interlayer and sealant joints to improve the performance of LG panels 528
under blast loads. This will enable engineers to better design blast resistant glazing with LG 529
within economic constraints. 530
As shown above, numerical analysis with FE codes offer a viable method for blast resistant 531
glazing design with LG. The comprehensive numerical models, such as the one developed in 532
this paper, could simulate the deflections, glass fracture, stress-strain variation and the energy 533
absorption of constituent components in LG panels. Results from FE analysis could be used 534
to examine the failure of glass, interlayer and sealant joints and hence to evaluate the 535
performance of the entire LG panel under blast loading. The comprehensive information 536
provided through such analysis will not only enhance the understanding on the blast response 537
of LG panels, but also facilitate their design. Modeling techniques presented in this paper 538
could therefore be used in blast resistant glazing design as a supportive tool for the design 539
standards, and also as a solution when they are not applicable, reducing cost, avoiding safety 540
issues and environmental pollution involved with blast testing. 541
542
543
544
Page 25
24
References 545
ASTM. (2009). “Standard practice for determining load resistance of glass in buildings.” E 546
1300-09a, West Conshohocken, PA. 547
ASTM. (2010a). “Standard practice for specifying an equivalent 3-second duration design 548
loading for blast resistant glazing fabricated with laminated glass.” 2248-09 AF, West 549
Conshohocken, PA. 550
ASTM. (2010b). “Standard test method for glazing and window systems subject to air blast 551
loadings.” 1642-04, West Conshohocken, PA. 552
Chung, J. H., Consolazio, G. R., Dinan. R. J. and Rinehart, S. A. (2010). “Finite - element 553
analysis of fluid - structure interaction in a blast - resistant window system.” J. Struct. 554
Eng., 136 (3), 297-306. 555
Cronin, D. S., Bui, K., Kaufmann, C., McIntosh, G., Berstad, T. and Cronin, D. (2003). 556
“Implementation and validation of the Johnson-Holmquist ceramic material model in 557
LS-DYNA.” 4th European LS-DYNA Users Conference, ULM, Germany. 558
Dept. of Defense (DOD). (2008). “Structures to resist the effect of accidental explosions.” 559
UFC 3-340-02, Washington, D. C. 560
Dept. of Defense (DOD). (2013). “Unified facilities criteria DOD minimum antiterrorism 561
standards for buildings.” UFC 4-010-01, Washington, D. C. 562
Hallquist, J. O. (2006). “LS-DYNA version 970 theory manual.” Livermore Software 563
Technology Corporation, Livermore, Calif. 564
Hidallana-Gamage, H. D., Thambiratnam, D. P. and Perera, N. J. (2013a). “Computational 565
analysis of laminated glass panels under blast loads: A comparison of two 566
Page 26
25
dimensional and three dimensional modeling approaches.” Int. J. Eng. and Sci., 2(8), 567
69-79. 568
Hidallana-Gamage, H. D., Thambiratnam, D. P. and Perera, N. J. (2013b). “Failure analysis 569
of laminated glass panels subjected to blast loads.” Eng. Failure Anal., 36, 14-29. 570
Holmquist, T. J., Johnson, G. R., Lopatin, C., Grady, D. E., Hertel Jr, E. S. (1995). “High 571
strain rate properties and constitutive modeling of glass.” Sandia National Labs, 572
Albuquerque, NM , United States. 573
Hooper, P. A., Sukhram, R. A. M., Blackman, B. R. K., and Dear, J. P. (2012). “On the blast 574
resistance of laminated glass.” Int. J. Solids and Struct., 49(6), 899-918. 575
International Organization for Standardization (ISO) 48. (1994). “Rubber, vulcanized or 576
thermoplastic: determination of hardness (Hardness between 10 IRHD and 100 577
IRHD).” Geneva, Switzerland. 578
International Organization for Standardization (ISO) 16933. (2007a). “Glass in building - 579
explosion-resistant security glazing - test and classification for arena air-blast 580
loading.” Geneva, Switzerland. 581
International Organization for Standardization (ISO) 16934. (2007b). “Glass in building - 582
explosion resistant security glazing - test and classification by shock tube loading.” 583
Geneva, Switzerland. 584
Johnson, G. R. and Holmquist, T. J. (1993). “An improved computational constitutive model 585
for brittle materials.” AIP Conference Proceedings, Colorado Springs, Colorado, 586
USA, 981-984. 587
Page 27
26
Larcher, M., Solomos, G., Casadei, F., Gebbeken, N. (2012). “Experimental and numerical 588
investigations of laminated glass subjected to blast loading.” Int. J.Impact Eng., 39(1), 589
42-50. 590
Ledbetter, S. R., Walker, A. R. and Keiller, A. P. (2006). “Structural use of glass.” J. Archit. 591
Eng., 12(3), 137-149. 592
Netherton, M. D. and Stewart M. G. (2009). “The effects of explosive blast load variability 593
on safety hazard and damage risks for monolithic window glazing.” Int. J.Impact 594
Eng., 36(12), 1346-1354. 595
Norville, H. and Conrath, E. (2001). “Considerations for blast-resistant glazing design.” J. 596
Archit. Eng., 7(3), 80-86. 597
Norville, H. S. and Conrath, E. J. (2006). “Blast-resistant glazing design.” J. Archit. Eng., 598
12(3), 129-136. 599
Protective Design Center Technical Report. (2012). “Blast resistant design methodology for 600
window systems designed statically and dynamically.” PDC-TR 10-02, US Army 601
Corps of Engineers. 602
Seica, M. V., Krynski, M., Walker, M. and Packer, J. A. (2011). “Analysis of dynamic 603
response of architectural glazing subject to blast loading.” J. Archit. Eng., 17(2), 59-604
74. 605
Smith, D. (2001). “Glazing for injury alleviation under blast loading–United Kingdom 606
Practice.” Proceedings of the 7th international glass conference of Glass Processing 607
Days, Tampere, Finland, 335-340. 608
Page 28
27
Teich, M., Warnstedt, P. and Gebbeken, N. (2011). “The influence of negative phase loading 609
on cable net facade response.” J. Archit. Eng., 18(4), 276-284. 610
U.K. Glazing Hazard Guide. (1997). “Glazing hazard guide, cubicle stand-offs, tables and 611
charts.” SAFE/SSG, Explosive Protection, London, SSG/EP/4/97. 612
Weggel, D. C. and Zapata, B. J. (2008). “Laminated glass curtain walls and laminated glass 613
lites subjected to low-level blast loading.” J. Struct. Eng., 134(3), 466-477. 614
Weggel, D. C., Zapata, B. J., and Kiefer M. J. (2007). “Properties and dynamic behavior of 615
glass curtain walls with split screw spline mullions.” J. Struct. Eng., 133(10), 1415-616
1425. 617
Wei, J. and Dharani, L. R. (2006a). “Response of laminated architectural glazing subjected to 618
blast loading.” Int. J. Impact Eng., 32(12), 2032-2047. 619
Wei, J., Shetty, M. S. and Dharani, L. R. (2006b). “Stress characteristics of a laminated 620
architectural glazing subjected to blast loading.” Comput. & Struct., 84(10-11), 699-621
707. 622
Page 29
1
Table 1. Material properties and JH-2 material constants of glass used in the FE analyses
Material property/JH-2 constant Value
Density (ρ) 2530
kg/m3
Young’s modulus (E) 72 GPa Poisson’s ratio (υ) 0.22 Strength constants
A 0.93 B 0.2 C 0.003 M 1.0 N 0.77 Ref strain rate (EPSI) 1.0 Tensile strength (T) 60 MPa Failure strain 0.0024 Normalized fractured
strength
0.5 HEL 5.95 GPa HEL pressure 2.92 GPa HEL strength 4.5 GPa Damage constants
D1 0.043 D2 0.85
Equation of state K1 (bulk modulus) 45.4 GPa K2 -138 GPa K3 290 GPa β 1.0
Table 2. Material properties of PVB and rubber sealant used in the FE analyses
Material property PVB Rubber
Density (ρ) 1100 kg/m3 1100 kg/m
3
Young’s modulus (E) 530 MPa 2.3 MPa
Poisson’s ratio (υ) 0.485 0.495
Yield stress 11 MPa 2.3 MPa
Failure stress 28 MPa 3.5 MPa
Failure strain 2 2.5
Page 30
1
Fig 5. Blast overpressure time-history curve
Fig 1. Graphical relationship between standoff
distance, TNT charge mass, and 3-second
equivalent design load (ASTM F 2248-09, 2010)
Fig 2. Non-factored load chart for 6.0mm
(0.25in.) glass with four sides simply
supported (ASTM E 1300-09a, 2009)
0
10
20
30
40
50
60
70
80
90
0 1 2 3 4 5 6 7 8 9 10 11
Refl
ecte
d O
verp
ress
ure (
kP
a)
Time (ms)
Fig 3. Peak blast pressure capacity for tempered
glass panes with an aspect ratio (a/b) of 1 and
thickness of 6mm (0.25in) (UFC 3-340-02, 2008) Fig 4. Iso-damage curves for 1.25m x 1.55m LG
panel with a thickness of 6.76mm (3+0.76+3)
(Smith, 2001)
Page 31
2
Fig 6. FE model of the LG panel
0
25
50
75
100
125
150
0 5 10 15 20 25
Defl
ecti
on
(m
m)
Time (ms)
LS-DYNA (Glass, T=60MPa)
LS-DYNA (Glass, T=65MPa)
Fig 7. Deflection time-history curve at the centre
of the LG panel for different T of glass
Fig. 8. Crack propagation of the top glass pane
(a) at 0ms
(b) at 5ms
(c) at 10ms
(d) at 15ms
Fig. 9. Crack propagation of the bottom glass pane
(a) at 0ms
(b) at 5ms
(c) at 10ms
(d) at 15ms
Glass (3mm)
PVB (1.52mm)
Glass (3mm)
Rubber sealant (5mm)
Rubber sealant (5mm)
(a) 3D view
(b) Sectional view at the support
Page 32
3
0
5
10
15
20
25
30
0 5 10 15 20 25
Vo
n M
ises
Str
ess
(M
Pa
)
Time (ms)
Element 1
Element 2 Element 3
Element 1
Element 2
Element 3
Fig. 10. 1st principal stress (σ11) variation on the top glass pane
(a) at 3ms
(b) at 7ms
(c) at 20ms
Fig. 11. 1st principal stress (σ11) variation on the bottom glass pane
(a) at 3ms
(b) at 7ms
(c) at 20ms
(a) at 3ms
(b) at 7ms
(c) at 20ms
(a) Variation of the plastic strain on the
bottom surface of the interlayer at 20ms
(b) Von mises stress (σv) variation of the critical PVB elements
Fig. 13. Stress and strain analysis of critical PVB elements
Fig. 12. Von mises stress (σv) variation on the bottom surface of the interlayer
Page 33
4
0
50
100
150
200
250
0 5 10 15 20 25
En
erg
y A
bso
rp
tio
n (
J)
Time (ms)
Glass PVB Sealant
0
0.5
1
1.5
2
2.5
3
0 5 10 15 20 25
Vo
n M
ises
Str
ess
(M
Pa
)
Time (ms)
Element 4
Element 5
Top glass pane
Element 4
Element 5
(b) Von mises stress (σv) variation of the
critical sealant elements
(a) View at the middle of the long edge of the
LG panel showing critical sealant elements
Fig. 14. Stress analysis of critical sealant elements
Fig. 15. Energy absorption of different components of the LG panel


![UNIFIED FACILITIES CRITERIA (UFC) DoD FACILITIES PRICING … · UFC 3-701-01 23 May 2018 Change 5, 3 February 2020 UNIFIED FACILITIES CRITERIA (UFC) [REVISION] SUMMARY SHEET Document:](https://static.documents.pub/doc/80x56/5ece76c4afcfdc39ce5e1035/unified-facilities-criteria-ufc-dod-facilities-pricing-ufc-3-701-01-23-may-2018.jpg)

![UNIFIED FACILITIES CRITERIA (UFC) DoD FACILITIES PRICING … · 2021. 2. 3. · UFC 3-701-01 23 May 2018 Change 8, 3 Feb 2021 UNIFIED FACILITIES CRITERIA (UFC) [REVISION] SUMMARY](https://static.documents.pub/doc/80x56/61486a752918e2056c22aca1/unified-facilities-criteria-ufc-dod-facilities-pricing-2021-2-3-ufc-3-701-01.jpg)


