Geol. Soc. Malaysia, Bulletin 25, December 1989; pp. 1-25 C-GC-MS ,and its application to crude oil analysis PAUL A. CoMET, Om SIEw TIN ANDY AP AI BEE Core Laboratories 24A, Lim Teck Boo Road Singapore 1953 Abstract: The Gas Chromatograph linked to a Mass Spectrometer with comput- erised data acquisition capability (C-GC-MS) makes for a very versatile and powerful analytical tool. The important function of the GC-MS in petroleum exploration and production studies is its ability to detect BIOMARKERS. What are biomarkers? They are organic compounds whose carbon skeleton give an unambiguous link with a known natural or biological product. Examples are isopre- noids, triterpanes, steranes, sterols etc. In other words they may be described as "chemical fossils." Their thermal stability in oils and sediments (source-rocks) make them very useful in oil to source rock correlation studies or determination of the number of oil pools present in an area. A study using GC-MS data on a number of"oil stained" rock samples from Southeast Asia and the Bahamas will be highlighted as an example to illustrate the usefulness ofC-GC-MS in the recognition of petroleum and determination of its source and maturity. INTRODUCTION What is a C-GC-MS? C-GC-MS (short for Computerised Gas Chromatography-Mass Spectrome- try) basically consists of a gas chromatograph with a mass spectrometer as a de- tector (as opposed to the usual flame ionization detector [FID]). The equipment is controlled by computer; this also acquires the data and is used in its processing. This combination is very versatile as the gas chromatograph has the capability to separate very complex mixtures of organics whilst the mass spectrometer bombards each compound eluting off the GC column with electrons i.e. a very high electrical potential (commonly 50-70 eV) and smashes each molecule to ionic fragments. A magnetic separator detects and separates the ionised molecular fragments according to their mass and charge. Each com- pound thus produces a characteristic mass spectrum (see Spectra 1, 2, and 3) which may contain several hundred molecular fragments, depending on the structure of the particular molecule. A given GC run of an oil may reveal several compounds of related structure present within (for instance) an oil. By homing · in on one diagnostic fragment ion (i.e. using mass fragmentography) (seeFigure 1) over part or the whole run, these compounds will be highlighted, and other compounds in which that ion is less prominent, will be suppressed. Thus the instrument can be used like a microscope, and by keying in particular ions, one can reveal several groups of compounds otherwise not easily distinguishable or detectable. Presented at GSM Petroleum Geology Seminar 1988
Transcript
Geol. Soc. Malaysia, Bulletin 25, December 1989; pp. 1-25
C-GC-MS ,and its application to crude oil analysis
PAUL A. CoMET, Om SIEw TIN ANDY AP AI BEE
Core Laboratories 24A, Lim Teck Boo Road
Singapore 1953
Abstract: The Gas Chromatograph linked to a Mass Spectrometer with computerised data acquisition capability (C-GC-MS) makes for a very versatile and powerful analytical tool. The important function of the GC-MS in petroleum exploration and production studies is its ability to detect BIOMARKERS.
What are biomarkers? They are organic compounds whose carbon skeleton give an unambiguous link with a known natural or biological product. Examples are isoprenoids, triterpanes, steranes, sterols etc. In other words they may be described as "chemical fossils." Their thermal stability in oils and sediments (source-rocks) make them very useful in oil to source rock correlation studies or determination of the number of oil pools present in an area. A study using GC-MS data on a number of"oil stained" rock samples from Southeast Asia and the Bahamas will be highlighted as an example to illustrate the usefulness ofC-GC-MS in the recognition of petroleum and determination of its source and maturity.
INTRODUCTION
What is a C-GC-MS?
C-GC-MS (short for Computerised Gas Chromatography-Mass Spectrometry) basically consists of a gas chromatograph with a mass spectrometer as a detector (as opposed to the usual flame ionization detector [FID]). The equipment is controlled by computer; this also acquires the data and is used in its processing. This combination is very versatile as the gas chromatograph has the capability to separate very complex mixtures of organics whilst the mass spectrometer bombards each compound eluting off the GC column with electrons i.e. a very high electrical potential (commonly 50-70 eV) and smashes each molecule to ionic fragments. A magnetic separator detects and separates the ionised molecular fragments according to their mass and charge. Each compound thus produces a characteristic mass spectrum (see Spectra 1, 2, and 3) which may contain several hundred molecular fragments, depending on the structure of the particular molecule. A given GC run of an oil may reveal several compounds of related structure present within (for instance) an oil. By homing
· in on one diagnostic fragment ion (i.e. using mass fragmentography) (seeFigure 1) over part or the whole run, these compounds will be highlighted, and other compounds in which that ion is less prominent, will be suppressed. Thus the instrument can be used like a microscope, and by keying in particular ions, one can reveal several groups of compounds otherwise not easily distinguishable or detectable.
Presented at GSM Petroleum Geology Seminar 1988
tee.0
se.0, 55
M.'E SO
HASS SPECTRlll-1
SANPLE 1
121
95
135
285
PEAK A
(see Figure 1)
3-METUYLHOP-17(21)-ENE
245
111771 BASE M/E: 135
.-----4189
81 I I II I I .> I" I '----->.. 136
69 II I 107
381
161
177
189
151
424 409
229
398
100 159 408
1643
Spectra 1: Rationalisation of the mass spectra of various unknoW!l triterpenes. Compounds are hypothesised to be 3-Alkylhop17(21)enes. Spectra 1, 2 and 3 are obtained on peaks marked A , B and C on Figure 1.
IBB.B
5e.e
55
M/E 513
~lASS SPECTRU~I 2
S•\I"IPLE I
69 95
199 136
lOB
149 I
161
1~0
191
295
175
200
PEAKB
(see Figure 1)
3-ETHYLHOP-17(21)-ENE + c31 HOPENE
C2H5
259
259 3GB 356
il1901 BASE M/E: 191
I )189 8285
490 450 5BB
Spectra 2: Rationalisation of the mass spectra ofvarious unknown triterpenes. Compounds are hypothesised to be 3-Alkylhop17(21)enes. Spectra 1, 2 and 3 are obtained on peaks marked A, B and C on Figure 1.
160.0
se.e l
IVE
55
HASS SPECTRUH 3
SAJ-IPLE I
95
69 l36
81
l99
l2l
161
151
175
l99
295
i I I 'II IJ,,lll ,, Ill,, I
PEAK C
(see Figure 1)
3··PROPYLHOP-17 (21 )-ENE
C3H8
273
(11984 BASE M.IE: 95
r---i 189
273
~ ·•,,·~·~~·~·~·~' "rr-o-1-'rro \ I ij J I I I I -• I I
')B lliO ISII I I' I I• I •I I I • I "1·.,.,,,.,.,.,;~· ...
300 2013 259 see 45CJ
167
Spectra 3: Rationalisation of the mass spectra of various unknown triterpenes. Compounds are hypothesised to be 3-Alkylhop17(21)enes. Spectra 1, 2 and 3 are obtained on peaks marked A, B and C on Figure 1.
109.0
191
MASS CHRO~IATOGRAM
SAI'IPLE I
1400 24:40
GJ c "' Q. 1-GJ ..... s:: .....
0 ...., u
tl ..... u
GJ c GJ ........ GJ c
"' Q. 1-GJ .... ·r: .... 0 ....,
u
+ 00. ..... N
u
GJ c
"' o. '-GJ ....
·;::: .... 0 ....,
u
+
1600 28:00
tl 0'1 N
u
GJ c GJ I ~ ..... N
·r: .... 0 ....,
u +
tl CXl 0'1 N u
+ GJ c
"' Q. 1-GJ ..... ·r: 1-
0 ....,
CXl tl 0 ...., u
A GJ c GJ I ~ ..... N ~ ..... 00. ..... 00.
I 0'1 Q. N 0 u ~
~ .... ~ <?
+ GJ c GJ
...!.. en ..... -~ ...., ..... Q. 0 .s: g '-'-0 c
1800 31:20
~ ... CXl tl ~
GJ :E ...., . N ....,
u + IX N N
CXl tl .....
B
u c ~ ....
20!10 34:40
SCAHS 1599 TO 2500
2200 38:00
2028
191.05" :t 0.50
SCAN TIME
Figure 1: m/z 191 fragmentogram showing distribution oftriterpenes and triterpanes from the saturated hydrocarbons of an immature S.E. Asian lacustrine source rock. N.B. numerous 3-alkyl hopanes and hopenes. For peaks marked A, B and C, see Spectra 1, 2 and 3.
6 PAUL A. CoMET, Om Smw TIN & YAP AI BEE
C-GC-MS can be applied to the analysis of any organic mixture capable of being volatilised. Thus most organic gases, liquids and solids can be analysed on this equipment. Consequently natural gas, petroleum, tars, pitch, bitumen etc are commonly analysed using C-GC-MS, particularly when undertaking oilsource rock and oil-oil correlation studies. However, the versatility of the machine allows it to be used for many other organic products outside the field of geochemistry, thus pharmaceuticals, drug testing, cosmetics, food additives, flavourings, cooking oil, lubricants etc are commonly analysed using C-GC-MS.
Role of C-GC-MS in Petroleum Analysis
Historically petroleum analysis was for a long period restricted to simple fractionation steps and physical property tests. Thus API gravity determinations, viscosity measurements, boiling point curves, flash points, wax and sulphur contents etc. are some of the necessary preliminary steps in the determination of the commercial value of a crude and indispensable to every petro1eum laboratory. However these analyses do not permit the isolation of the individual compounds which make up crude oil.
More sophisticated analyses attempt to isolate and characterise the individual constituents of petroleum. These techniques involve various forms of chromatography. Thus liquid column (LC) chromatography are used to quickly separate the saturated and aromatic hydrocarbons from the "polar" constituents of petroleum. Thin layer chromatography (TLC) is a more refined version of column chromatography and is also often used. Similarly, high performance liquid chromatography (HPLC) will readily separate the major constituents of petroleum. By a manipulation o(the mixtures of chromatographic media used in the LC column (e.g. various grades of alumina or silica) or on the TLC plate, and by varying the solvent system, it is possible to further resolve some of the major compound "families" found in petroleum, particularly the aromatic hydrocarbons and pigment fractions. Thus the aromatics can be readily separated into mono, di, tri and polyaromatic fractions using simple chromatography (see Rowlandet al, 1986). However the routine isolation and recognition of individual compounds from complex petroleum mixture can at present only be performed by using gas-chromatography (GC). Here an isolated hydrocarbon fraction (i.e. saturates or aromatic) is injected into a very thin bore fused quartz or glass column. The column is coated with a polymer, depending on the particular separation that is to be effected. For hydrocarbon mixtures the polymer phase chosen is generally OV-1 or OV-101 equivalents. The column has gas flowing through it, generally helium, nitrogen or hydrogen and is heated in a GC oven, compound detection is usually accomplished with the aid of an flame ionisation detector (FID).
Modem petroleum analysis is now routinely performed using gas chromatography and computerised gas-chromatography mass-spectrometry. By the
C-GC-MS AND CRUDE OIL ANALYSIS 7
use of the simple preliminary fractionations discussed earlier (using liquid column or thin layer chromatography) petroleum can be quickly resolved into the saturated and aromatic hydrocarbons as well as "polars". Gas chromatography of the saturated fractions usually yields a series of n-paraffins (See Figure 2). The paraffins and short chain acyclic isoprenoids can quickly be identified by their retention index or just by recognising the characteristic patterns of a crude oil (See Figure 2). Co-injection with synthesized standards could be used to identify then-alkanes though this technique would now only be applied to a far less well known series of compounds. However petroleum contains a very large number of minor napthenic components, (several thousand) and these cannot be readily identified by gas chromatography alone due to the complexity of the mixture. Clearly another more sophisticated tool is required for the detailed analysis of crude oils. The most powerful tool known at present for the routine analysis of complex mixtures is computerised gas chromatography-mass spectrometry.
By acquiring the GC-MS data into a computer it becomes possible to manipulate the data. Thus, as many of the compounds in crude oil form homologous or pseudohomologous series, it is very easy to use the computer to pick out diagnostic ions characteristic of whole suites of compounds. As an example, m/z 191 will pick out virtually all the triterpanes, as these nearly always give a characteristic C14H23+ fragment ion (i.e. mass 191) (see Figure 1), alternatively one can take a full mass spectrum for each compound (see Spectra 1, 2 and 3). The full mass spectrum reveals the major structural features of the molecule. As data can be easily retrieved and manipulated, the mass spectra of a number of compounds can be rapidly compared with the spectra from authentic standards, and this data, along with each compounds retention time, used in identification purposes.
Oils still contain large numbers ofuncharacterized compounds, in particular many nitrogen and sulphur compounds remain unknown, even though an approximate idea of their structure can be obtained from mass spectrometry.
Very recent technological developments, has now made available C-GC-MSIR. Here an infra red spectrum is provided with the mass spectrum. This will provide a very useful adjunct in distinguishing isomers of slightly different structure. In an average GC-MS analysis ofFar East crudes there are commonly encountered numerous triterpenoids of unknown structure (see Figure 3). CGC-MS-IR should help in clarifying the structure of some of these unknowns, however, some of these compounds are probably ''bicadinane" isomers ( Coxet al., 1986). The other mass spectrometric techniques such as MS/MS and F AB techniques are still mainly university research tools that are not yet widely applied in the industrial laboratory.
i '
i
I
8 PAUL A. CoMET, Om SIEw TIN & YAP AlBEE
• A B
. li ~ •
Lilt ttl ~ l~li ..I. I .........
c
_j
· ... ~-·--
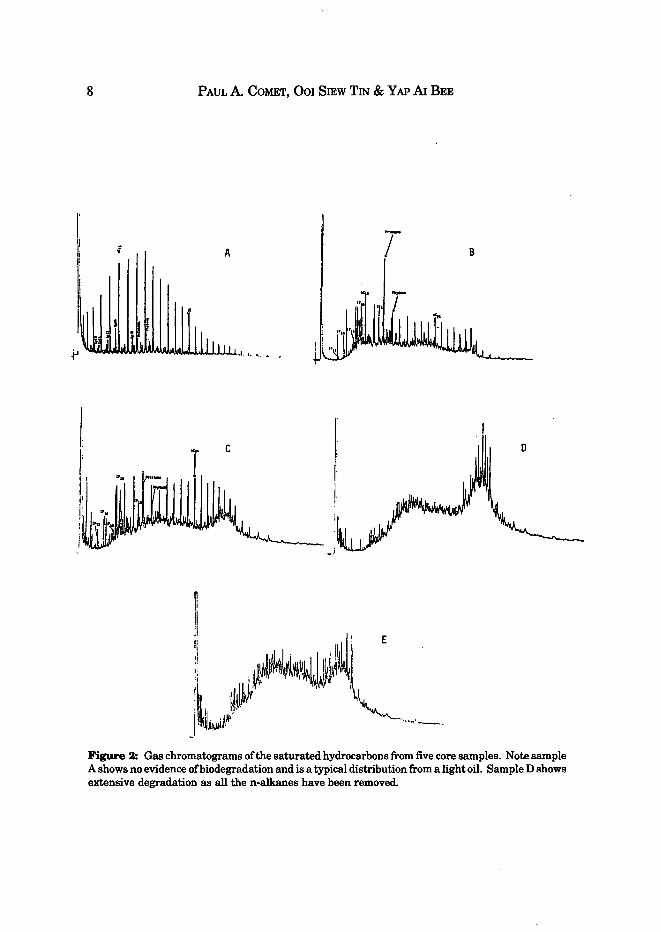
Figure 2: Gas chromatograms of the saturated hydrocarbons from five core samples. Note sample A shows no evidence ofbiodegradation and is a typical distribution from a light oil. SampleD shows extensive degradation as all the n-alkanes have been removed.
Ion
250
200
150 -1
1
100
50
0
217.30 amu.
Oia CZ7 prxzos
I
1
26
Oia C27 .Bazan
l ·mainly
28
C27 5.8+
C27 aaa 20R
Rn
30
C28 SB
+aBB 2
F·i gure 3
cza cz9 01tJ.et 20S 20
32
C29 "BB +G29
6
C29 aBB
C29 W:i/1..
OR
Rn
Rn
34
KEY
Rn-C30 resin compounds (non-hopanoid triterpanes}
SM1PLE C (see Figure 2)
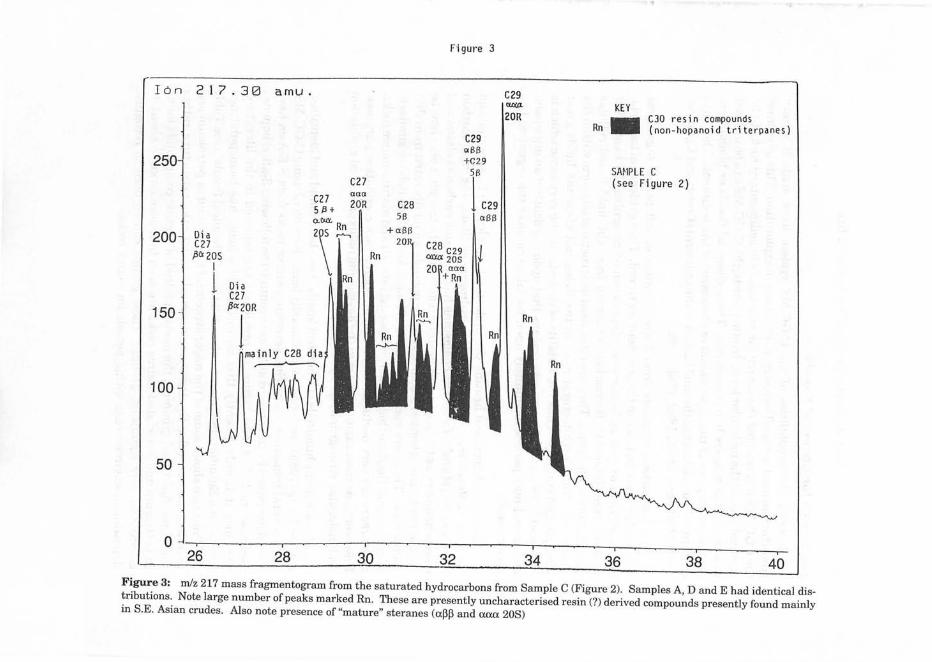
36 38 40 Figure 3: m/z 217 mass fragmentogram from the saturated hydrocarbons from Sample C (Figure 2). Samples A, D and E had identical distributions. Note large number of peaks marked Rn. These are presently uncharacterised resin(?) derived compounds presently found mainly in S.E. Asian crudes. Also note presence of "mature" steranes (al3!3 and aaa 20S)
10 PAUL A. COMET, OOI SIEW TIN & YAP AI BEE
The Search for Chemical Fossils
Recently the capabilities of the C-GC-MS system have made it a very powerful tool used in the oil industry, particularly in exploration. This is because the CGC-MS has enabled the search for new fossils in sedimentary rocks to be pursued even at the molecular level. In other words, the C-GC-MS can be utilized in a method analogous to a microscope. These chemical fossils or biomarkers contain an imprint of the depositional environment of the sediment. They also contain information of the thermal history of the sediment (Comet and Eglin ton, 1987; Mackenzie et al., 1982; Philp, 1985).
The biomarkers originate from a great variety of soft bodied organisms which often leave no trace in the sedimentary record. Thus evidence ofbacteria, algae, jellyfish as well as higher plant inputs can be recognised by biomarker analysis (see Table 1). Biomarkers originate from the lipid based cellular constituents oflife forms. They are often used as structural supports within the living cell. This "architectural role" in the living cell gives the lipids great strength and stability. Thus the stability of cholesterol (the very same which is responsible for many heart attacks) means that upon the death of an organism, cholesterol may persist indefinitely upon burial, even after the organism has decomposed.
Upon deep burial and heating the cholesterol (an alcohol) loses water and becomes cholestadiene and finally, by hydrogen addition, the hydrocarbon known as 5a. (H)cholestane. The cholestane has the same carbon skeleton and stereochemistry as the original cholesterol (see Figure 4), though it may now be part of the hydrocarbons of a source rock, or possibly an oil liberated from that source rock. There are many thousands of biomarkers which behave similarly to cholesterol. Because their structures persist into oils and mature source rocks, biomarkers are very useful for oil-oil and oil-source rock correlation purposes. However their most exciting role is in the developing fields ofbasinal evaluation and molecular stratigraphy.
Though many hundreds of" chemical fossils" have been found and identified, e.g. see Philp (1985), new ones are continually being discovered using C-GC-MS. Thus several immature, lacustrine petroleum source rocks from S E Asia have been determined by the present authors to contain the following 3-alkyl hopenes (see Spectra 1, 2, 3, and Figure 1), previously not reported in the literature. Similarly it is only recently that an integrated scheme has been published (Comet and Eglinton, 1987) for the classification of"chemical fossils" (see Table 1). This table shows some of the major structural types found in petroleum and petroleum source rocks. By classifying chemical fossils by their structure, rather than their functional grouping, the many hundred of organic compounds found in petroleum and associated source rocks are seen to reduce down to about 20 environmentally significant groups. These groups can be used to recognise depositional environments within petroleum source rocks.
Very diverse origins found in great range of organisms depends on functionality
Dehydroabietic acid,• dehydroabietin, retene,
Squalane, lycopane, C25
sesterpane, etc, are believed to be of archaebacterial origin
In sediments, taxonamic allocation
Extended diterpenaid"
Others
(Continue)
Table 1: Input Indicators (Grouped By Structure And Taxonomic Affmities) (Continue)
Structure Structural High Plant Lipids Algal Lipids Bacterial Markers Number Grouping (Terrestrial Markers) (Mainly Marine Markers) and Lipids
VII Hopanoid 3-Keto hydroxy Diverse aerobic bacteria• derivatives and cyanobacteria degraded tetracyclic alkanes/ alkanes aromatics
VIII Nonhopanoid Lupane, etc, (about 20' Fernenes found in" triterpenoid different structural photosynthetic
types) anaerobic bacteria
IX 4-methyl steraids Dinasteral (ex-dinaflagel c .. -4-methyl steraids iates) and possibly the are found in other major 4-methyls methanotrophic in sediements bacteria
X Desmethyl Sitosterol C2.-C27-C26C,., sterals" steroids
XI Polynuclear Common in terresteriall aromatics sediments, coals, etc (PNA's)
XII Parphyrins and Taxonomically non chlorins specific prOductivity
indicators
"Certain bacteria biasynthesise n-acids and n-alkanes in this carbon range, but with little or no carbon preference index. •same marine sediments contain a considerable range of dials and keto-ois in this carbon number range, they are probably of "algae• origin. •Diagenetic derivatives of conifer resin. •Possibly algae. •The majority of hopanolds In sediments are probably bacterial . 'Those sediments containing a considerable range of non-hopanoid structures possibly contain an anglosperma input. •Also in ferns. "Desemthyl steroids are not biosynthesized by bacteria. 'High plants commonly contain 24-ethyl groups in the R position, marine algae In the 24 S position. lEx-coal maceraVoil seep, etc (of indirect biological origin).
Others
Gammacerane (Tetrahymarol found in protozoa)
C-GC-MS AND CRUDE OIL ANALYSIS
I
m
Structures (see Table 1)
13
.Ill
Dl
H
14 PAUL A. COMET, 001 SIEW TIN & YAP AI BEE
SIMPLIFIED SCHEME SHOWING THE TRANSFORMATION OF CHOLESTEROL
INTO PETROLEUM HYDROCARBONS
CHOLESTEROL (found in living plants) becomes Scs CHOLESTANE,.(foun.d in oils and source rocks)
Figure 4: Diagenetic/Maturation scheme showing the transformation of cholesterol into petroleum hydrocarbons.
C-GC-MS AND CRUDE OIL ANALYSIS 15
Another example of the application and advantages of mass spectrometry to petroleum analysis was the investigation of five (5) "dil-stained" cores from the S E Asia region. Solvent extraction and isolation of the aliphatic hydrocarbon fraction from these cores was followed by gas chromatography of the saturated hydrocarbons. The issues under question were: 1) Are the materials staining the cores petroleum or merely non-petroliferous bitumen? 2) If the staining material proved to be petroleum, how many kinds were present? 3) Was more than one source rock involved? 4) What kinds of input were significant in the source rocks? It proved to be possible to answer all of these questions using C-GC-MS data. However, gas-chromatography showed that many of the samples had lost their n-alkanes due to biodegradation, see Figure 2. Because of this it proved not to be possible to readily cross compare the extracts by the use of GC alone.
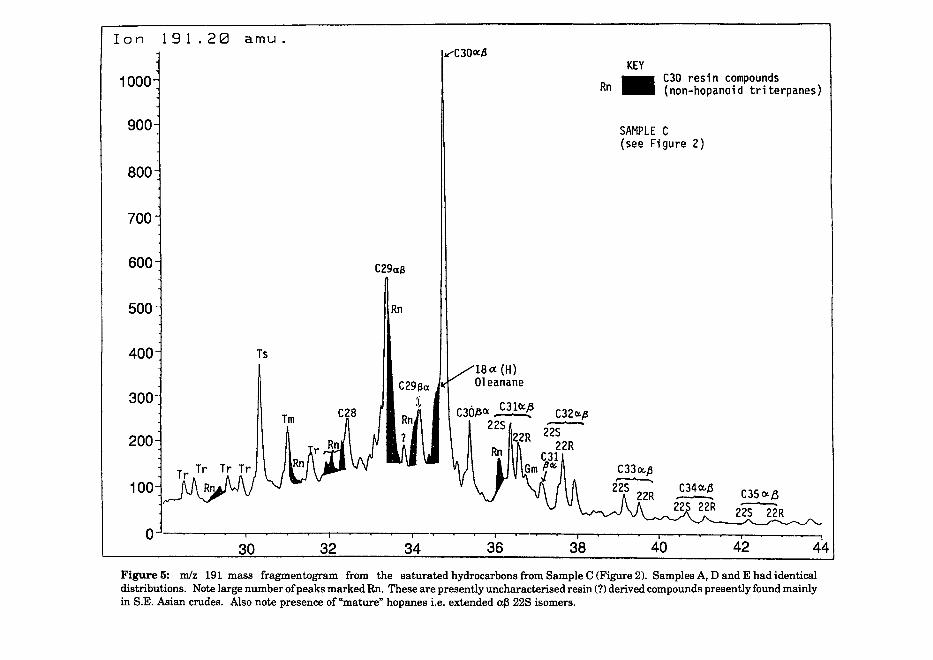
However C-GC-MS clearly showed the affipities of these samples. Four (4) of the samples gave mature sterane profiles (m/z 217). Thus the 5a (H)20R steranes and 5~(H) steranes commonly found in immature, recent sediments had given way to a petroleum assemblage dominated by abb steranes, diasteranes and 20S aaa steranes (see Figures 3). Thus it was possible to recognise these four ( 4) samples as being petroleum derived, mainly biodegraded "tars" (though one sample [Figure 2A] showed little evidence ofbiodegradation). Similarly, the hopane profile (m/z 191) (see Figure 5), was characteristic of petroleum. The complex pattern ofhopenes and ~~hopanes found in recent sediments had been replaced by an immature petroleum assemblage of extended a~ hopanes (note the 22S isomer in greater abundance than the 22R isomer).
These samples proved to be similar to others found in SE Asia in showing a considerable terrigenous input. Thus the triterpane distributions showed a number of biomarkers that probably originate from higher plants e.g. 18a(H)oleanane. However large numbers of higher plant compounds (triterpanes) were also present which presently cannot be identified (see Figure 5). These peaks are marked with Rn, they are presumed to originate from tropical tree resins, but their exact structure remains unknown at present. Some, but not all, of these compounds are probably "bicadinane" isomers. The sterane profile (m/z 217) also shows large numbers of these components (see Figure 3). The isolation and elucidation of the structure of these compounds remains to be undertaken by the academic community.
By contrast, one of the sediment samples (also bitumen stained) showed a very different sterane (m/z 217) and triterpane (m/z 191) profile. The steranes were dominated by 5a(20R) and 5~ steranes. The a~~ and 5a20S sterane isomers were present only in tiny amounts (see Figure 6). The distribution was interpreted as being indicative of an immature bitumen i.e. petroleum was not present in this sample. The triterpanes (m/z 191) similarly indicated the immaturity of the sample. In this case, the extended hopanes exhibited the 22R isomer in greater abundance than the 22S. This is characteristic of immature samples that have experienced some maturation, but insufficient to generate petroleum (see Figure 7 and Tables 2 & 3).
TRITERPANE IDENTIFICATIONS (See Figures 1, 5, 7 and 8)
Assignment
18a (H) 22, 29, 30-trisnorneohopane
17a (H) 22, 29, 30-trisnorhopane
Trisnorhop-17 (21) -ene
17a (H) -22, 29, 30-Trisnorhopane
1713(H)-22,29,30-Trisnorhopane
C28Hopane
17a (H), 21 f3 (H) -Norhopane
As given
1713 (H), 21a (H) -Norhopane
17a (H), 21 b (H) -Norhopane
As given
As given
1713 (H), 21a (H) -Norhopane
Neohop-13 (18) -ene
1713 (H), 21 13 (H) -30-Norhopane
Homohop-17 (21) -ene
17a (H), 2113 (H) -Homohopane (22S)
17a (H), 21 13 (H) -Homohopane (22R)
17a (H), 2113 (H) -3-Methylhopane
1713 (H), 2113 (H) -Hopane (22R)
As given
1713 (H), 21 a-3-Methylhopane
As given
As given
17a (H), 21 f3 (H) -bishomohopane (22S)
17a (H), 21 f3 (H) -Bishomohopane (22R)
1713 (H), 21a (H) -Bishomohopane (22S)
(Continue)
Peak Component
R-C32~a.
ca,~~
S-Caaa.~
R-Caaa.~
caa~a.
c3.~~
C32-Me (~~)
S-C3.a.~
R-C3.a.~
c3.~a.
c33~~
c3.~~
S-C3sa.~
R-C3sa.~
OL (C30)
GM (C30)
Tr
R(C3o)
TABLE 3 (continue)
TRITERPANE IDENTIFICATIONS (See Figures 1, 5, 7 and 8)
Assignment
17~ (H), 21a. (H) -Bishomohopane (22R)
17~ (H), 21 ~(H) -Homohopane (22R)
17a. (H), 21~ (H) -Trishomohopane (22S)
17a. (H), 21 a.~ (H) -Trishomohopane (22R)
17~ (H), 21a. (H) -Trishomohopane
17~ (H), 21 ~ (H) -Bishomohopane (22R)
17~ (H), 21 ~ (H) -Methyl homohopane
17a. (H), 21~ (H) -Tetrakishomohopane (22S)
17a. (H), 21~ (H) -Tetrakishomohopane (22R)
17~ (H), 21a. (H) -Tetrakishomohopane
17~ (H), 21 ~ (H) -Trishomohopane (22R)
17~ (H), 21~ (H) -Tetrakishomohopane (22R)
17a. (H), 21 ~ (H) -Pentakishomohopane (22S)
17a. (H), 21 ~ (H) -Pentakishomohopane (22R)
18a. (H) -Oleanane
Gammacerane
Unknown tricyclic terpane
Unknown triterpane (resin derived)
Ion 191.20 amu. Jt"C30«8
KEY 1000 Rn - CJO resin compounds
(non-hopanoid triterpanes)
900 SAMPLE C (see Figure 2)
800
700
600 C29aB
500 Rn
400 Ts 18CX(H) Oleanane
300 ,. -~ CJQ,8ct~ Tm C28
225 200 22R
100
0 30 32 34 36 38 40 42
Figure 5: m/z 191 mass fragmentogram from the saturated hydrocarbons from Sample C (Figure 2). Samples A, D and E had identical distributions. Note large number of peaks marked Rn. These are presentlyuncharacterised resin(?) derived compounds presently found mainly in S.E. Asian crudes. Also note presence of "mature" hopanes i.e. extended a~ 22S isomers.
Ion 217.30 amu. 1800
1600
1400
1200
1000
800
Oia C27
600 f:3r1- 20S
j Dia C27
/!>Q.20R 400
1 200
C27 oG<X<X. 20S
+ C27 5/3
C27 Q(.c(,or.
20R
C28 5/!> +a~
20R
C28 aaa 20R
ClB cY."f3 2 s
C28
C29 tll.f3j'J 20S
C29 5{3
+ 11.f¥5
2~R
C29 CUICic.
20S
l
C29 c:t4(t
OR
SAMPLE B (see Figure 2)
CJO - possibly 4-methyls ,----.
34 36 38 40 Figure 6: m/z 217 fragmentogram from the saturated hydrocarbons of Sample B (see Figure 2). Note simple sterane distribution and lack of unknown resin compounds. Also note lack of a~~ and IXIXIX 208 steranes. The sample is immature.
40 42 44 Figure 7: m/z 191 fragmentogram from the saturated hydrocarbons from Sample B (see Figure 2). Note the 22R a~ hopanes are present in greater abundance than the 228 a~ hopanes. This indicates sample immaturity. Also note resin (?) derived compounds.
22 PAUL A. CoMET, Om SIEw TIN & YAP AI BEE
Thus by the use ofC-GC-MS on these five (5) samples, it proved possible to show:
1) That four (4) samples contained petroleum in various degrees of biodegration i.e. dead oil. The 5th sample contained mainly immature bitumen.
2) That the oil was sourced from a single terrigenous/lacustrine source rock, rich in higher plant detritus.
Another example of the recognition of petroleum biomarkers using C-GCMS was undertaken on samples collected from the Ocean Drilling Project (ODP) Leg 101, Bahamas. The biomarker patterns from four (4) samples were described. These samples consisted of carbonaceous limestones, (from site 635B) and two gypsum samples and a dolomite (from site 627B); all these samples were mid-Cretaceous age.
Examination of the biomarkers distributions within the saturated hydrocarbon fraction from these four ( 4) samples showed that the two carbonaceous limestones contained sterane distributions similar to that shown in Figure 6. However the triterpanes assemblage still contains hopenes such as Neohop-13(18)-ene and Hop17(21)-ene i.e. similar to Figure 1. These are commonly found only in very immature sediments (Comet, McEvoy et al., 1986). Similarly many of the hopanes have pp "immature" stereochemistry. The sterane profile (m/z 217) is similar to the distribution in Figure 6, i.e. dominated by 5a(H)20R and 5P(H) steranes. Hence the steroid and triterpenoid nuclei from the carbonaceous limestones retain their original biosynthetic stereochemistry, as would be expected from highly immature sediments.
By contrast, l:ioth the gypsum and dolomite samples contained migrated oil. This is shown in Figures 8 and 9. Figure 8 shows the m/z 191 fragmentogram i.e. the triterpane distribution found in both samples. Here the situation is more subtle as a mixture of immature bitumen and migrated oil is present. Thus an "incompatible" combination of triterpenes and pp hopanes from immature bitumen are mixed with the extended aP22S hopanes present only in oils and mature source rocks. Similarly in the sterane series, the immature aaa20R steranes are predominant over a "background" of mature sterane biomarkers i.e. the pp and aaa20S steranes (see Figure 9).
100.13 C30aB GYPSUM 101-6278-SSX-1 (41-43cm)
C2aaB
I !II
C31aB
7 ""V
g I ,,. l . . ?
Cll1 Cll1
t 1\7 ~3oBB ? ?c Ba ~10 29 u u
~ I • I 1 u
... v~.) ~~v..).lt"'Jlt \\
1600 16130 2000 22130 2400 SCAN
Figure 8: mlz 191 fragmentogram from the saturated hydrocarbons from a marine gypsum sample (evaporite) from the Bahamas. This sample [101-627B-55X-1(41-43)] was sampled on board ship (ODP Leg 101). Note mixture of"mature" biomarkers (extended a~ hopanes) and immature bitumen (ji~ hopanes and triterpenes).
1013.13
"' 1.1> .... N 0::
u 0 N
+ "' VI "' 0 IS
N .... N
IS u IS IS .... VI N 0
u N
CQ
"' IS .... N
u 217
'"' ~ \
T 1513'3 1609
0:: 0 N
IS IS IS .... N
u
1
I 170'3
"' 1.1> CO VI NO
u N
+ "' "' 0:: IS VI 0 co 0 N N N u
"' u "' IS IS IS co co N NU
u
0
\ 'l
0:: GYPSU!i 0
"' N 1.1> 101-6278-SSX-1 ( en IS N IS u IS
41-43cm)
+ en N
0:: u 0 N
"' "' IS en "" u
v. 0 N
VI "' 0 "' N IS en
IS N 0:: IS u 0 IS N en
N IS u IS IS co N
u
~
I I 1800 19GB 20ee SCAt!
Figure 9: m/z 217 fragmentogram from the saturated hydrocarbons from a marine gypsum sample (evaporite) from the Bahamas. This sample [101-627B-55X-1(41-43)] was sampled on board ship (ODP Leg 101). Note "background" of mature biomarkers (a~~ and aaa 208 steranes). However two most prominent peaks are "immature" isomers i.e. aaa 20R. Sample was interpreted as a mixture of oil and immature bitumen.
C-GC-MS AND CRUDE OIL ANALYSIS 25
CONCLUSIONS
1) Less than one milligram of crude oil can be reliably identified and quantitated using C-GC-MS, even when the oil is highly degraded.
2) Many of the key components of a crude oil can be reliably and quickly identified.
3) Petroleum is shown to be composed of the "molecular remains" of once living organisms. These include soft bodied micro-organisms as well as higher plants.
4) Even when petroleum has been biodegraded to an intractable tarry residue, the biomarker assemblage it contains indicates its provenance and maturity. This makes biomarker study indispensable for forensic work, particularly where crude oil or high-boiling point distillates are involved.
5) The original environment of deposition as a crude oil may be glimpsed by an investigation of its biomarker composition.
6) The thermal history of an oil may be calculated by observing the ratio of various isomers of certain key biomarkers such as stigmastane ( C29 sterane) and the extended hopanes.
7) New compounds are continually being discovered within petroleum. S E Asians crudes, in particular, are rich in compounds of presumed terrigenous origin, but of unknown structure.
ACKNO~DGEMENTS
Core Laboratories Singapore are thanked for permission to publish this paper. Dr Jim McEvoy is acknowledged for performing the mass spectrometry. Mrs Christina Yong is thanked for patiently typing and compiling the manuscript.
REFERENCES
CoMET, P.A. and EGLINTON, G. 1987. The use ofLipids as Facies Indicators. In: Brooks, J. and Fleet, A.J. (Eds). Marine Petroleum. Source Rocks. Geological Society Special Publication No. 26, pp
CoMET, P.A., McEvoY, J., GIGER W. and DouGLAS, A.G. 1986. Hydrous and Anhydrous Pyrolysis of DSDP Leg 75 Kerogens- A Comparative Study Using a Biological Marker Approach. Org. Geochem. Vol. 9, No.4, pp 171-182.
Cox, L.C., LEEUW, J.W., ScHENCK, P.A., et al., 1986. Bicadinane a c30 Tetracyclic Isoprenoid Hydrocarbon Found in Crude Oil. Nature, Vol. 319, pp 316-319.
MAcKENZIE, A.S., BRASSELL, S.C., EGLINTON, G. and MAxWELL, J.R. 1982. Chemical Fossils - The Geological Fate of Steroids. Science Vol. 217, pp 491-504.