Chapter 4 – Designing Studies SUBJECT: AP Statistics DAY CLASSWORK HOMEWORK 1 In-Class Activity Read pg. 208-213, Take guided notes (pg 2) 2 p. 229 (#1, 4, 5, 8, 9, 13) Video #1 & Take Notes (pg. 3 – 5) Good and Bad Sampling Designs (pg. 213-223) Understanding (pg. 223) 3 p. 229 (#6, 10, 14, 17, 18, 22) Video #2 & Take Notes (pg. 6) How to choose a random sample 4 p. 230 (#12, 15, 19, 24, 25) Read (pg. 223-228) Inference for Sampling Take guided notes (pg. 7-8) Understanding (pg. 228) 5 In-class activity p. 232-233 (#28, 29, 30, 33, 35, 37-42) 6 Quiz 4.1 Read (pg 234-244) Basics of Experimenting Take guided notes (pg. 9-10) Understanding (pg. 237) 7 p. 259 (#47, 50, 51) read directions for #51!!! Video #3 & Take Notes (pg. 11 – 13) Completely Randomized Design (pg. 244-255) 8 p. 260 (#58, 64, 68. 72) Video #4 & Take Notes (pg. 14) Matched Pairs and RBD (pg. 255-257) 9 p. 262-263 (#75, 77, 80) pg. 264-265 #87-95 10 Quiz 4.2 Read (pg. 266 – 271) in your book and come to class prepared to discuss these topics 11 Practice FRAPPY’s #1-3 [pg. 16 – 18] FRAPPY DAY tomorrow!!! 12 FRAPPY DAY Study for test- Notes (pg. 22-23) 13 Review Questions Study! (Prac. WS. A & B pg. 18-21 and MC Video) 14 Chapter 4 Test Lesson Objectives: In this chapter, we will learn: ● The different types of sampling methods and will discuss the pros and cons of each. ○ The goal of sampling is to select a group (a sample) that accurately represents the population. ● We will also focus on different experimental designs and how a well-designed experiment will allow us to generalize our findings based off our representative sample to the entire population. ● This chapter provides the foundational knowledge about data collection which will aid us as we study hypothesis testing beginning in Chapter 9. 1
Transcript
Chapter 4 – Designing Studies SUBJECT: AP Statistics DAY CLASSWORK HOMEWORK
6 Quiz 4.1 Read (pg 234-244) Basics of Experimenting Take guided notes (pg. 9-10)
Understanding (pg. 237)
7 p. 259 (#47, 50, 51) read directions for #51!!!
Video #3 & Take Notes (pg. 11 – 13) Completely Randomized Design (pg. 244-255)
8 p. 260 (#58, 64, 68. 72) Video #4 & Take Notes (pg. 14) Matched Pairs and RBD (pg. 255-257)
9 p. 262-263 (#75, 77, 80) pg. 264-265 #87-95
10 Quiz 4.2 Read (pg. 266 – 271) in your book and come to class prepared to discuss these topics
11 Practice FRAPPY’s #1-3 [pg. 16 – 18] FRAPPY DAY tomorrow!!!
12 FRAPPY DAY Study for test- Notes (pg. 22-23)
13 Review Questions Study! (Prac. WS. A & B pg. 18-21 and MC Video)
14 Chapter 4 Test
Lesson Objectives: In this chapter, we will learn:
● The different types of sampling methods and will discuss the pros and cons of each. ○ The goal of sampling is to select a group (a sample) that accurately represents the population.
● We will also focus on different experimental designs and how a well-designed experiment will allow us to generalize our findings based off our representative sample to the entire population.
● This chapter provides the foundational knowledge about data collection which will aid us as we study hypothesis testing beginning in Chapter 9.
1
Guided Reading, START ON P. 208-213 IN YOUR BOOK Section 4.1: Sampling and
Surveys
1. What are the disadvantages of doing a census? __________________________________________
2. Instead of doing a census, you could use a _____________ to represent the __________________.
3. Def: population _____________________________________________________________________
1. ___________________________ - People chose whether to respond. 2. ___________________________ - Interviewer chooses whom to sample.
The Remedy: Allow _______________________ to choose the sample because a sample selected by chance does not allow favoritism or self-selection, and reduces _____________ by giving all individuals an equal chance to be chosen.
5 GOOD Sampling Designs!
3. Simple Random Sample (SRS) – A SRS is chosen so that every __________ of individuals has an ___________ chance of being selected.
Δ 3 ways to take a Simple Random Sample (SRS):
1) Use an actual, physical routine like drawing names out of a hat. ▪ Make sure everything is “equal” to ensure equal chance and randomness.
2) Use a random number table (back of formula sheet) to select #’s tied to people.
1. It is a long string of the digits 0, 1, 2, 3, 4, 5, 6, 7, 8, and 9 with these two properties.
a. Each entry in the table is equally likely to be any of the ten digits 0 through 9.
b. The entries are independent of each other. That means that knowledge of one part of the table
gives no information about any other part.
2. Q: Why are the numbers in groups of 5? A: To make it easier to read
3. Q: Why are the Lines numbered from 101 to 150? A: To make it easier to read
3) Use technology to randomly generate numbers that are tied to people.
Using the randInt function on your calculator → [Math], PRB Menu, #5 randInt
The inputs are: randInt( min #, max #, number of numbers you want displayed at a time).
Why might the AP Test and your Chapter 4 Test require that you use a random number table as opposed to the randInt function?
3
4. Stratified Random Sample – First divide the population into _____________ (groups that have
something in common to each other…you’re making each group homogenous). Then, select a
_______ from EACH strata and combine them to form the full sample.
o Ex: Randomly select x students from freshmen, sophomores, juniors, & seniors to account for
difference amongst grade level.
5. Cluster Sample – The population is already broken down into pre-formed clusters naturally. Each
cluster is perceived to be similar to each other cluster and a heterogeneous mixture of the population.
Randomly select however many clusters you decide and EVERYONE within those clusters are a part of
your sample.
o Ex: Randomly select 10 study halls to question all the students in there. Each study hall is
assumed to be a mixture of all grade levels. The individuals inside the cluster are assumed to be
randomly picked since their “cluster” was randomly selected.
6. Systematic Random Sample – Individuals are selected according to a random starting point and a
fixed, periodic interval.
o Ex: Out of 100 students, I want to randomly select 5. Student #42 is randomly selected (the
starting point). Then a fixed, periodic interval is determined. Typically, you take your
population size divided by your sample size. For this example that means 100/5 = 20, so that
every 20th student is selected after student #42 until 5 are chosen. If you reach the end of the
line of students before your total sample is chosen, just wrap back around to the beginning of
the list and continue until done.
7. Multistage Random Sample – refers to sampling plans where the sampling is carried out in stages using
smaller and smaller sampling units at each stage.
o Ex: Imagine a cluster sample, but then individuals are randomly selected out of each cluster
instead of just taking the whole cluster of individuals as your sample.
4
Understanding (pg. 223): Complete in space below. Be ready to discuss next class period. The manager of a sports arena wants to learn more about the financial status of people who are
attending an NBA basketball game. He would like to give a survey to a representative sample of the more than 20,000 fans in attendance. Ticket prices for the game vary a great deal: seats near the court cost over $100 each, while seats in the top rows of the arena cost $25 each. The arena is divided into 30 numbered sections, from 101 to 130. Each section has rows of seats labeled with letters from A (nearest to the court) to ZZ (top row of the arena). Would a stratified random sample using the lettered rows or a cluster sample using the numbered sections be the best option to guarantee a representative sample of the various financial statuses of people attending the game? Consider the worst case scenarios of each to decide which method is superior.
5
4.1 – How to choose a random sample! [VIDEO #2]
Today, we practice on how to select a random sample using our 3 methods discussed in Video #1.
We will devise a “scheme” for how we will accomplish our random sample which has 3 parts:
1) Label the individuals in the population. With the “hat method”, this step could just be writing everyone’s name on equal sized piece of paper. For the technology or random number table method, this means assigning numbers to each individual. You must be specific about the range of numbers that will be used. You cannot just say “assign numbers to individuals”.
2) How you will select the first individual. With the “hat method”, this step is simply saying you would mix up the papers and blindly select a piece of paper. With technology, this means describing what function of you would use to select your random number. With the random number table, this means stating what line will you use and how many digits will you select at a time to represent the first individual.
3) Repeating the process and conditions to watch out for. With the “hat method”, this step just means how many names will you select out of the hat, will you put a selected name back in the hat before you select the next, etc. With technology and the random number table, this means using the function or the table from part 2 however many times you need before your whole sample is selected and discussing what to do with repeated numbers.
Ex #1: Here are the names of 10 guys on a local HS baseball team. At practice, every 15 minutes the coach randomly selects 2 guys to run sprints up a steep hill. Practice is 2 hours long and starts at 3:00. Write a scheme using the random number table and use Line 120 to determine who runs.
Joe Ron Dave Matt Bryan Mark Pat Jimmy Adam Gary Line 120: 35476 55972 39421 65850 04266 35435
6
Guided Reading, START ON P. 223-228 IN YOUR BOOK Section 4.1: Inference for Sampling
1. What is the purpose of a sample? ______________________________________________________________
12. When more than one explanatory variable is to be used in an experiment, then each is called a ________.
13. Each explanatory variable, or the answer to #12, can have multiple values called ___________________.
14. Read through and answer the “problem” in the examples on p.237 & 239 about school & TV advertising.
15. Read through the example on p.240 & read through and answer the “problem” on 241 about online vs. in-class
SAT prep.
16. Write down the generic design model most experiments use:
17. Suppose an experiment takes 100 students to test whether drinking Kahok Koffee will improve their test
score on the next AP Stats test. Write out the specific design model this experiment uses:
9
Check your understanding (pg. 237) Complete in space below. Be ready to discuss next class
period. Use additional paper if needed.
10
Completely Randomized Design (CRD) (pg. 244-255) – [VIDEO #3] There are 3 principles of experimental design: 1. Control the effects of the lurking variables on the response by comparing 2 or more treatments.
a. Always use a control group when designing an experiment.
b. What is a control group? _____________________________________________________
2. Randomize – use chance (the random number table) to assign experimental units to treatments.
a. Decide how many treatments there are.
b. Find out how many experimental units you have.
c. Number them.
d. Randomly allocate the experimental units to the groups.
Why is this important? _________________________________________________________
3. Replicate each treatment on many units to reduce chance variation in the results.
a. Larger sample sizes always yield more ________________ results!
b. Use enough experimental units to reduce chance variation because the effects of chance will
average out when the sample size is large.
There are 3 types of experimental designs you will learn soon: 1. Completely Randomized Design (CRD)
2. Matched Pairs Design
3. Randomized Block Design (RBD)
A good experimental design should be double blind. Double Blind - _______________________________________________________________________ Single Blind - ________________________________________________________________________ Placebo - ___________________________________________________________________________ Placebo effect - ______________________________________________________________________
11
A food company assesses the nutritional quality of a new “instant breakfast” product by feeding it to 15 newly weaned male rats. The response variable is a rat’s weight gain over a 28-day period. A control group of 15 rats eats a standard diet, but otherwise receives the exact same treatment as the experimental group.
a. How many factors are there? List it / them.
b. How many experimental units are there?
c. What are the experimental units?
d. How will they be labeled?
e. Use line 110 to randomly allocate the rats to the two groups.
f. The following is a diagram of this completely randomized design. Label the four essential parts.
When doing an experiment we hope to see a difference in the response so large that it is unlikely to happen just because of chance variation. If the difference is larger than we would expect to see strictly due to chance variation we call our result ___________________________.
12
A manufacturer of food products uses package liners that are sealed at the top by applying heated jaws after the package is filled. The customer peels the sealed pieces apart to open the package. What effect does the temperature of the jaws have on the force required to peel the liner? To answer this question, the engineers prepare 20 pairs of pieces of package liner. They seal five pairs at each of 250°F, 275°F, 300°F, and 325°F. Then they measure the strength needed to peel each seal.
a. Use a diagram to describe a completely randomized experimental design. b. Use Table B, starting at line 120, to do the randomization required by your design. *YOU DO!*
A Matched Pairs experimental design can take 2 forms: 1. The experimental units are matched to produce more precise results than simple randomization. 2. Each experimental unit receives both treatments and is compared to him or herself.
Ex 1. A manufacturer of boots plans to conduct an experiment to compare a new method of waterproofing to the current method. The appearance of the boots is not changed by either method. The company recruits 100 volunteers in Seattle, where it rains frequently, to wear the boots as they normally would for 6 months. At the end of the 6 months, the boots will be returned to the company to be evaluated for water damage. a. Describe a design for this experiment that uses the 100 volunteers. Include a few sentences on how it will
be implemented. b. Could your design be double blind? Explain.
A block is a group of experimental units or subjects that are known before the experiment to be similar in some way that is expected to affect the response. In a block design, the random assignment of the units to the treatments is carried out separately within each block. Ex 1. The progress of a type of cancer differs in men and women. A clinical experiment to compare three therapies for this cancer therefore treats sex as a blocking variable. Two separate randomizations are done, one assigning the female subjects to the treatments and the other assigning the male subjects. Note that there is no randomization in making up the blocks (the blocks are made by gender), the randomization comes into play when they split each gender up into the 3 treatment groups. Label the main features of a Randomized Block Design. List the group sizes there are 180 Subjects, 30% of whom are male.
14
Experimental Designs Summarized Situation: Mr. Gottschalk wants to compare the ability of a student to concentrate under two different room temperatures, 70° F and 90° F. He will administer the SAT’s to a random sample of 100 seniors to draw a conclusion about this question. One of the following experimental designs could be used: 1. Completely Randomized Design: Considers the sample as a single group. 2. Randomized Block Design: This should be used if we believe that men and women will react differently
to the different room temperatures 3. Matched Pairs Design: Each student takes the SAT in the 70° room and the 90° room. We must
randomly determine which room they take the test in first.
15
FRAPPY DAY
16
17
18
Practice Worksheet A 1. For each of the following situations, identify the population as exactly as possible. That is, say what kind of
individuals the population consists of and say exactly which individuals fall in the population. If the information given is not complete, complete the description of the population in a reasonable way.
(a) A business school researcher wants to know what factors affect the survival and success of small
businesses. She selects a sample of 150 eating-and-drinking establishments from those listed in the telephone directory Yellow Pages for a large city.
(b) A member of Congress wants to know whether his constituents support proposed legislation on health care. His staff reports that 228 letters have been received on the subject, of which 193 oppose the legislation.
2. Complete the definition: “The design of a study is biased if ... 3. A corporation employs 2000 male and 500 female engineers. A stratified random sample of 200 male and
50 female engineers gives each engineer 1 chance in 10 to be chosen. This sample design gives every individual in the population the same chance to be chosen for the sample.
(a) Is it an SRS? Explain your answer.
(b) Beginning with line 108 on the Random Number Table, reproduced below, select the first 5 female engineers to be in the sample.
Practice Worksheet B A medical study of heart surgery investigates the effect of a drug called a beta-blocker on the pulse rate of the patient during surgery. The pulse rate will be measured at a specific point during the operation. The investigators will use 20 patients facing heart surgery as subjects. You have a list of these patients, numbered 1 to 20, in alphabetical order. 1. Outline as an algorithm (paragraph form) or in diagram form a randomized experimental design for this
study. 2. Use the random digit table starting at line 125 to carry out the randomization required by your design and report the result.
20
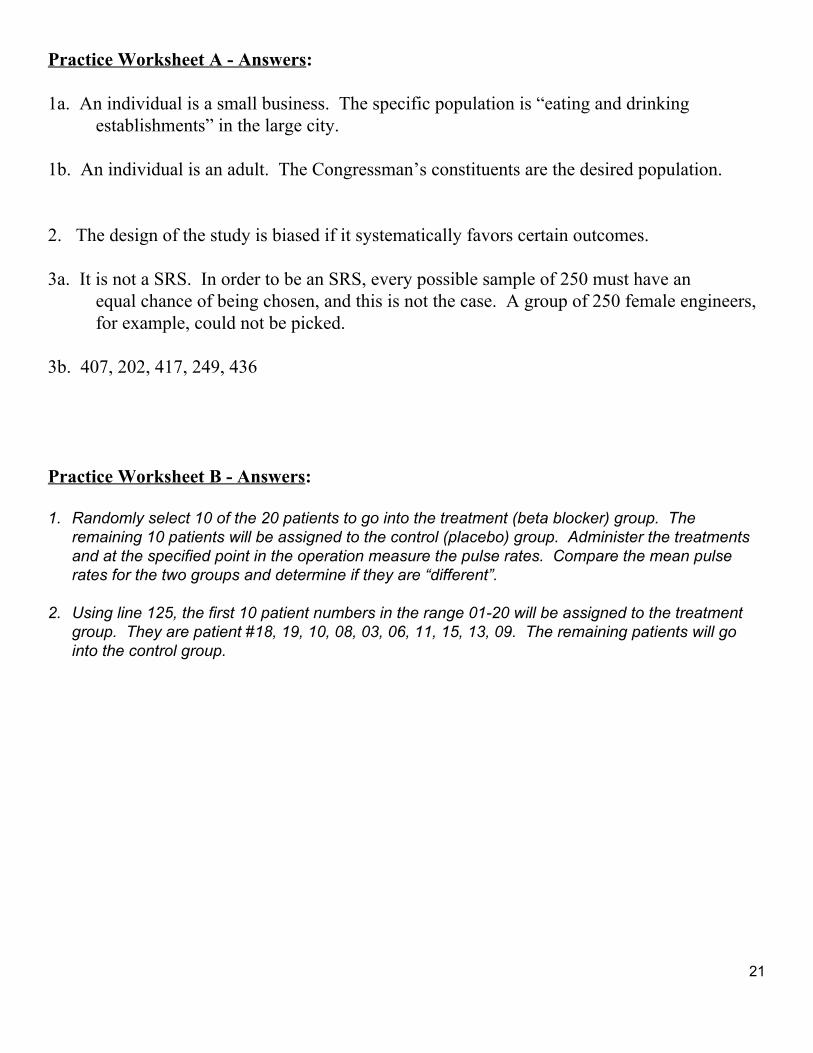
Practice Worksheet A - Answers: 1a. An individual is a small business. The specific population is “eating and drinking
establishments” in the large city.
1b. An individual is an adult. The Congressman’s constituents are the desired population.
2. The design of the study is biased if it systematically favors certain outcomes. 3a. It is not a SRS. In order to be an SRS, every possible sample of 250 must have an
equal chance of being chosen, and this is not the case. A group of 250 female engineers, for example, could not be picked.
3b. 407, 202, 417, 249, 436 Practice Worksheet B - Answers: 1. Randomly select 10 of the 20 patients to go into the treatment (beta blocker) group. The
remaining 10 patients will be assigned to the control (placebo) group. Administer the treatments and at the specified point in the operation measure the pulse rates. Compare the mean pulse rates for the two groups and determine if they are “different”.
2. Using line 125, the first 10 patient numbers in the range 01-20 will be assigned to the treatment group. They are patient #18, 19, 10, 08, 03, 06, 11, 15, 13, 09. The remaining patients will go into the control group.
21
Preparing for your Chapter 4 Test You Should Know:
❑ How to identify the sample and the population ❑ How to identify sources of bias such as voluntary response, convenience sampling,
undercoverage, nonresponse, response bias, lurking variables, confounding, wording of questions, etc.
❑ How to explain and describe the differences between SRS, convenience sampling, stratified random sampling, and cluster random sampling
❑ How to use the table of random numbers and the randInt function on the calculator to select random samples of various sizes.
❑ The difference between observational studies, surveys, and experiments. ❑ How to identify the factors (explanatory variables), treatments, response variables,
experimental units or subjects in an experimental design. ❑ The purpose for using control groups in an experiment ❑ The three principles of an experimental design: control, randomization, replication ❑ How to outline the design of a completely randomized experiment and a randomized block
design experiment ❑ The correct usage for a matched pairs experimental design ❑ That a larger sample size will provide more accurate results than a small sample size