I I1 I IIIIIII ~ _* NASA T E C H N ICA L NOTE NASA &M D-8080 0 00 0 OF) n z c 4 v3 4 z A MATHEMATICAL MODEL OF A N ACTIVE CONTROL LANDING GEAR FOR LOAD CONTROL DURING IMPACT AND ROLL-OUT aaAN COPY: RETURN TO AFMk TECHNZCAL LIBRARY K1RTuN-D AFB, #. M. '\\ John R. McGehee und Huey D. Curden /' / 1 1 \ Lungley Reseurch Center ,i \ ', ' I $?e Humpton, Vu. 23665 4OUT'Qv Y '5 z 3 hs "7.3 4976 NATIONAL AERONAUTICS AND SPACE ADMINISTRATION WASHINGTON, D. C. FEBRUARY 1976 https://ntrs.nasa.gov/search.jsp?R=19760010002 2018-06-05T05:24:36+00:00Z
Transcript
I I1 I IIIIIII ~ .
_*N A S A T EC HNI C A L NOTE NASA &M D-8080
0 00 0 OF)n z c
4 v3 4 z
A MATHEMATICAL MODEL OF A N ACTIVE CONTROL LANDING GEAR FOR LOAD CONTROL DURING IMPACT A N D ROLL-OUT a a A N COPY: RETURN TO
AFMk TECHNZCAL LIBRARY K1RTuN-D AFB, #. M.
'\\
John R. McGehee und Huey D. Curden /'
/ 1 1
\
Lungley Reseurch Center ,i
\ ',
' I $?e\Humpton, Vu. 23665 4OUT'Qv
Y '5 z3 hs
"7.3 4976
N A T I O N A L AERONAUTICS A N D SPACE A D M I N I S T R A T I O N W A S H I N G T O N , D. C. FEBRUARY 1976
A MATHEMATICAL MODEL O F AN ACTIVE CONTROL LANDING GEAR FOR LOAD CONTROL DURING IMPACT AND ROLL-OUT
7. Author(s1
John R. McGehee and Huey D. Carden
9. Performing Organization Name and Address
NASA Langley Resea rch Center Hampton, Va. 23665
-2, Sponsoring Agency Name and Address
National Aeronautics and Space Administration Washington, D.C. 20546
3. Recipienr s Latalog No.
5. Report Date Februa rv 1976
6. Performing Organization Code
8. Performing Organization Report No.
L -10440 -. 10. Work Unit No.
743 -01 -12-03 - ~~~~
1 1 . Contract or Grant No.
~~
13. Type of Report and Period Covered
Technical Note . ~ _ _ _
14. Sponsoring Agency Code
~~. . 5. Supplementary Notes
. - - ~~ ~~
6. Abatract
A mathenlatical model of an active control landing %ear (ACOLAG) has been developed and programed for operation on a digital computer. The mathematical model includes theoretical subsonic aerodynamics ; f i r s t -mode wing bending and tors iona l cha rac t e r i s t i c s ; oleo-pneumatic shock s t ru t with fit and binding friction; closed-loop, se r ies -hydraul ic control; empir ica l t i r e force-deflection cha rac t e r i s t i c s ; antiskid braking; and sinusoidal o r random runway roughness. The inathematical model was used to compute the loads and motions fo r a s imula ted ve r t i ca l drop t e s t and a simulated landing impact of a conventional (passive) main landing gea r desiyned fo r a 2268-kg (5000-lbm) c lass a i rp lane . Computations w e r e a l so made for a siinply modified vers ion of the pass ive g e a r including a ser ies -hydraul ic active control sys tem.
Comparison of computed r e su l t s f o r the pas s ive gea r with exper imenta l data shows that the active control landing g e a r ana lys i s i s valid fo r predicting the loads and motions of an a i rp lane during a symmet r i ca l landing. Computed r e s u l t s for the s e r i e s -hydraulic ac t ive control in conjunction with the simply modified pass ive g e a r show that 20- to 30-percent reductions in wing force , relative to those occurr ing with the modified pass ive g e a r , can be obtained durinq the impact phase of the landing. These reductions in wing fo rce could r e su l t in substantial i nc reases in fatigue life of the s t ruc tu re .
-7. Key Words (Suggested by Author(s)) 18. Distribution Statement
Aircraf t landing gea r I Unclassified - Unlimited
19. Security Classif. (of this report) 20. Security Classif. (of this page) 2 1 . NO. of Pages 22. Price'
Un classif ie d Unclassified 70 $4.25
F o r sale by the Nat iona l Technical In format ion Service, Springfield, Virginia 221 61
I
A MATHEMATICAL MODEL OF AN ACTIVE CONTROL LANDING GEAR
FOR LOAD CONTROL DURING IMPACT AND ROLL-OUT
John R. McGehee and Huey D. Carden Langley Research Center
SUMMARY
A mathematical model of an active control landing gear (ACOLAG) has been developed and programed for operation on a digital computer. The mathematical model includes theoretical subsonic aerodynamics; f irst-mode wing bending and torsional charac ter is t ics ; oleo -pneumatic shock s t ru t with fit and binding friction; closed-loop7 se r i e s -hydraulic control; empirical t i re force -deflection character is t ics ; antiskid braking; and sinusoidal o r random runway roughness. The mathematical model was used to conipute the loads and motions for a simulated vertical drop tes t and a simulated landing impact of a conventional (passive) main landing gear designed for a 2268 -kg (5000-lbm) c lass a i r plane. Computations were a l so made for a simply modified version of the passive gear including a series-hydraulic active control system.
Coinparison of computed resul ts fo r the passive gear with experimental data shows that the active control landing gear analysis i s valid for predicting the loads and motions of an airplane during a symmetrical landing. Computed resu l t s for the se r i e s -hydraulic active control in conjunction with the simply modified passive gear show that 20- to 30percent reductions in wing force, relative to those occurring with the modified passive gear, can be obtained during the impact phase of the landing. These reductions in wing force could resul t in substantial increases in fatigue life of the s t ructure .
INTRODUCTION
Dynamic loads in large a i rc raf t resulting from landing impact and runway and taxi -way unevenness are recognized as a significant factor in causing fatigue damage and dynamic s t ress ing of the air f rame s t ructure . In addition, ground-induced vibrations result in crew and passenger discomfort and can contribute to reduction of the pilot's capability to control the aircraf t . Such vibration probleins have been encountered with some conventional transport a i rcraf t and have required modification of the gear design to improve r ide and handling qualities after the a i rc raf t i s in service.
These ground-induced dynamic loads and vibration problems will be magnified for supersonic -cruise a i rc raf t because of the increased structural flexibility of the slender -
body, thin-wing designs and the higher takeoff and landing speeds. During design studies of supersonic transports conducted in the United States, investigations of the ground ride qualities of one particular design indicated extremely high vibration levels in the crew compartment during takeoff (ref. 1). The design philosophy f o r airplane oleo-pneumatic landing gea r s has been to obtain the lightest gear for the maximum designed sink rate. For supersonic-cruise transport aircraft, it may be necessary to concentrate on limiting the load applied t o the s t ructure by the gear to obtain satisfactory structural dynamic response characterist ics and a satisfactory fatigue life. One potential method for improving ground operations of supersonic cruise a i rcraf t i s the application of active control technology to limit the loads applied to the a i r f r ame by the landing gears .
Analytical studies have been conducted to determine the feasibility of applying active controls to the landing gear during roll-out or taxiing over uneven runways o r taxiways. The study reported in reference 2 indicated that a shock s t rut with a hydraulically controlled actuator in s e r i e s with the passive elements of the strut (ser ies -hydraulic control) possessed the most desirable dynamic properties and would be quite feasible to implement. Little published information is available for actively controlling loads applied to the a i r f r ame by the landing gear during the impact phase.
The purpose of this paper i s to present and validate a mathematical model of an active control landing gear (ACOLAG) employing a series-hydraulic control for load control during impact and roll-out and to present resul ts f rom the application of this cont ro l concept to a simply modified main landing gear of a 2268-kg (5000-lbm) class a i r plane. The model i s evaluated for predicting airplane loads and motions encountered during vertical-drop and landing-impact simulations for a rigid a i r f r ame with a passive (conventional) oleo-pneumatic shock-strut landing gear . The model i s also used to deter -mine control parameters and airplane response for a s e r i e s -hydraulic active control gear.
Edwin L. Fasanella, of LTV Aerospace Corporation, reviewed the equations of motion and assisted in debugging the antiskid braking and active control subroutines of the computer program,
SYMBOLS
The units used for the physical quantities defined in this paper are given f i r s t in the International System of Units and parenthetically in the U.S. Customary Units. Measurements and calculations were made in the U.S. Customary Units.
Aco a r e a of control orifice, m2 (ft2)
A0 a r e a of opening in shock-strut orifice plate, m2 (ft2)
2
AP
A1
A2
PR
a
a m
b
CD,f
cD, i
D,P
cd,co
cd,o
CL
CX
CZ
CP
c ross -sectional a r e a of metering pin, m2 (ft2)
shock-strut hydraulic area (piston area), m2 (ft2)
shock-strut pneumatic a r e a (cylinder area), m 2 (ft2)
aspect ratio of wing, b2/Sw
lift-curve slope a t finite aspect ratio, (dCL/dcr)R
lift-curve slope for infinite R, dCL/da
wing span, m (ft)
aerodynamic friction -drag coefficient
aerodynamic induced-drag coefficient
aerodynamic profile -drag coefficient
discharge coefficient for control servo valve orifice
shock-strut orifice discharge coefficient
aerodynamic lift coefficient
numerical constant for each type of t i re (this symbol i s k l in ref. 3; type III, C x = 0.53; type VII, C x = 0.60)
vertical-force coefficient for each type of t i r e (type I, C z = 0.02; types Ill and VII, C z = 0.03)
torsional damping coefficient of control sensor mass , N/rad-sec (lbf/rad-sec)
3
Df
Dt
DW
d
dce
dcf
dcQ
dct
dcw
dcwG
deh
dew
dwwG
dCL/da
4
crit ical torsional damping coefficient of control sensor mass, N/rad-sec (lbf/rad-sec)
fuselage aerodynamic drag force, N (lbf)
tail aerodynamic drag force, N (lbf)
wing aerodynamic drag force, N (lbf)
diameter of unloaded t i re , m (ft)
a r m between airplane composite mass center and wing elast ic axis in fuselage x b - z b plane, m (ft)
a r m between airplane composite m a s s center and fuselage mass center in fuselage Xb-Zb plane, m (ft)
control-line diameter, m (ft)
a r m between airplane composite mass center and aerodynamic center of p r e s s u r e of tail along Xb-axis, m (ft)
a r m between airplane composite mass center and wing m a s s center in fuselage x b - z b plane, m (ft)
a r m between airplane composite m a s s center and wing-gear interface in fuselage Xb-Zb plane, m (ft)
a r m between wing elastic axis and hub in body coordinate system, m (ft)
a r m between wing elastic axis and wing m a s s center along Xb-axis, m (f t )
a r m between wing mass center and wing-gear interface along Xb-axis, m (ft)
lift -curve slope, rad
d l
d2
d3
d4
d5
d6
E
e
FA, ss
FG,X
FG, Z
FN,s s
F n
Fss, 1
FSS, 2
a r m between airplane composite mass center and wing-gear interface normal to Zb-axis, m ( f t )
distance between tire-runway interface and airplane composite m a s s center normal to Xg-axis, m (ft)
distance between airplane composite m a s s center and tail center of p re s su re parallel t o fuselage longitudinal axis, m (ft)
distance between airplane composite m a s s center and fuselage m a s s center normal to fuselage longitudinal axis, m (ft)
distance between airplane composite m a s s center and wing center of p re s su re parallel to fuselage longitudinal axis, m (ft)
distance between airplane composite m a s s center and wing center of p re s su re normal to fuselage longitudinal axis, m (ft)
Young's modulus for v ing s t ructural material , Pa (lbf,/ft2)
base of natural logarithms
total shock-strut axial force, N (lbf)
ground force at tire-runway interface acting along Xg-axis, N (lbf)
ground force at t ire-runway interface acting along Zg-axis, N (lbf)
force normal to shock s t rut , N (lbf)
nose-gear force along Zg-axis, N (lbf)
shock-strut binding friction force, N (lbf)
sliding friction force between shock-strut piston and cylinder, N (lbf)
5
*T,N
FT,T
FwB
G
g
h
Ia
Ie
Isect
IYY
KWB
Kw r
KX,T
KP
Lt
LW
l c Q
6
t i r e force normal to runway, N (lbf)
tire force tangential to runway, N (lbf)
wing bending force due to cantilever deflection of wing, N (lbf)
shearing modulus of elasticity for wing s t ructural material, Pa (lbf/ft2)
gravitational acceleration, m/sec2 (ft/sec2)
height of wing box, m (ft)
mass moment of inertia of wheel and t i r e about axle, kg-m2 (slug-ft2)
mass moment of inertia of semispan of wing about elastic axis, kg-m2 (slug-ft2)
a r e a moment of inertia of wing chord section, m4 (ft4)
pitching mass moment of inertia of one-half of airplane, with respect t o plane of symmetry, about composite m a s s center, kg-m2 (slug-ft2)
wing bending spring constant, N/m (lbf/ft)
wing torsional spring constant, N-m/rad (lbf -ft/rad)
t i r e fore-and-aft spring constant, N/m (lbf/ft)
spring constant between braking control sensor m a s s and wheel, N/m (lbf/ft)
aerodynamic lift force of tail, N (lbf)
aerodynamic lift force of wing, N (lbf)
length of active control hydraulic line, m (ft)
1 2
Ma
Mbr
Mef
Mew
Mn
mC
mf
mp
N
NRe
P
shock-strut length, m (ft)
length between upper and lower shock-strut bearings for fully extended s t rut ,
m (ft)
length between lower shock-strut bearing and hub for fully extended strut , m (ft)
ground-induced tcrque on wheel about axle, N-m (lbf - f t )
brake torque about axle, N-m (lbf-ft)
torque about wing elastic axis applied to fuselage, N-m (lbf -ft)
torque about wing elastic axis applied to wing, N-m (lbf -ft)
nose-gear moment, N-m (lbf-ft)
composite mass , kg (slugs)
one-half of fuselage mass concentrated at fuselage center of gravity, kg (slugs)
m a s s assumed concentrated at hub (axle), kg (slugs)
semispan wing m a s s assumed concentrated at semispan wing c.g. on spanwise chord containing wing -gear' interface, kg (slugs)
braking control sensor mass , kg (slugs)
number of cycles to failure
Reynolds number of airflow
tire inflation pressure , Pa (lbf/ft2)
7
I
Pat
Pe c
PH
Po,a
P r
P1
p2
Rh
r
S W
S
t
Vac
v 2
Veff
Vtemp
atmospheric pressure, Pa (lbf/ft2)
effective active control pressure, Pa (lbf/ft 2)
hydraulic pressure, Pa (lbf/ft2)
control akcumulator pressure, Pa (lbf/ft2)
absolute t i r e inflation p res su re at zero vertical load, Pa (lbf/ft2)
rated inflation t i r e pressure, Pa (lbf/ft2)
hydraulic p re s su re in shock-strut piston, Pa (lbf/ft2)
pneumatic p re s su re in shock-strut cylinder, Pa (Ibf/ft 2)
amplitude of runway roughness, m (ft)
deflected radius of t ire, m (ft)
planform area of wing, m2 ($1
shock-strut stroke, m (ft)
elapsed time after touchdown, s e c
volume of hydraulic fluid transferred by active control, m3 (ft3)
volume enclosed by shock-strut cylinder, m 3 (ft3)
effective velocity of hydraulic fluid through control, m/sec (ft/sec)
intermediate value of velocity of hydraulic fluid through control for computing p res su re loss, m/sec (ft/sec)
8
c
W
Xb,Xg
xCP
Y
zb,zg
ZBe
Zer ,b
Zew,b
CY
@e
ai
P
Y
YH
maximum width of undeflected t ire, m (ft)
displacement along xb- o r Xg-axis, m (ft)
fore-and-aft shift of t i r e footprint center of pressure, m (ft)
absolute value of spanwise distance from fuselage center line to chord containing wing-gear interface, m (ft)
displacement along z b - o r Z g -axis, m (f t )
bending deflection of wing elastic axis at spanwise chord of wing mass center relative to wing elastic axis a t fuselage center line along Zb-axis, m (ft)
relative displacement between wing elastic axis at spanwise chord containing wing mass center and wing elastic axis in fuselage x b - z b plane along z b axis, m (ft)
displacement of wing elastic axis a t spanwise chord containing wing mass cent e r along Zb-axis, m (ft)
ground elevation measured along Zg-axis, m (ft)
initial height along Zg-axis between shock-strut fluid level and control-reservoir fluid level, m (ft)
total angular displacement of wing chord at spanwise location of wing mass center relative to wing chord at fuselage center line, CYj + @e, rad
wing elastic rotation, rad
angle of incidence of wing, r a d
angular displacement of brake sensor mass, r ad
ratio of specific beat of gas at constant p re s su re to that at constant volume
specific weight of hydraulic fluid, N/m3 (lbf/ft3)
9
I l l I l l I I 1 I 1 I
difference o r change of value
combined vertical tire deflection, m (ft)
vertical t i r e deflection for pu re vertical loading, m (ft)
vertical sinking of t i r e due to fore-and-aft tire deflection, m (ft)
slip ra t io between wheel and surface
slope of runway surface, rad
angle of pitch of airplane, rad o r deg
t i r e p re s su re - r i se parameter
angle, in Xb-Zb plane, between wing chord and line connecting wing elastic axis to airplane composite mass center, r ad
Xcf angle, in x b - z b plane, between fuselage longitudinal axis and line connecting fuselage mass center to airplane composite m a s s center, rad
xcw angle, in x b - z b plane, between line connecting wing mass center to airplane composite m a s s center and line through composite mass center parallel to fuselage longitudinal axis, rad
k w G angle, in Xb-Zb plane, between line connecting wing-gear interface to airplane composite m a s s center and line through composite mass center parallel to fuselage longitudinal axis, rad
xeh angle, in x b - z b plane, between Zb-axis and line connecting wing elastic axis to hub, rad
P friction coefficient between t i re footprint and runway surface, o r tire-runway friction coefficient (positive along negative Xg-axis)
dynamic viscosity of hydraulic fluid, N-sec/m2 (lbf -sec/ft2)
k S , l friction coefficient between shock-strut lower bearing and piston
10
Pss,u friction coefficient between shock-strut upper bearing and cylinder
Pa mass density of a i r , kg/m3 (slugs/ft3)
PH mass density of hydraulic fluid, kg/m3 (slugs/ft3)
U s t r e s s level, Pa (lbf/ft2)
@ angular displacement of wheel about axle, r ad
W G frequency of variation of sinusoidal runway elevation, rad/sec
Wn,P natural frequency of brake control sensor mass , rad/sec
Subscripts :
b body-axis system
C airplane composite mass center
ce,b between airplane composite mass center and wing elastic axis in body-axis system '
e wing elastic axis
f fuselage mass center
g gravity-axis system
h hub m a s s center
i initial value
max maximum value
t - A t value at previous t ime step
11
W wing mass center
wG wing-gear interface
X l inear dimension along Xb-axis
z l inear dimension along Zb -axis
Dots over symbols indicate differentiation with respect to time.
MATHEMATICAL MODEL
Variables considered significant in analyzing actively controlled landing gear s y s tems are shown in figure 1. Of these variables the following are included in this study: impact loads; runway-induced loads; braking loads; aerodynamic loads; flexible -airframe characterist ics; and load isolation. Some examples of previously proposed landing gear active control concepts for load isolation are shown in figure 2. The series-pneumatic and the series -hydraulic controls have the actuator in s e r i e s with the stiffness and damp ing elements of the shock strut . The parallel-hydraulic control has the actuator in parallel with the stiffness and damping elements of the shock strut . In all these systems, cont ro l i s implemented by metering the working fluid (oil o r a i r ) to the actuator. Fo r the present analysis the series-hydraulic control was selected on the basis of resul ts of the feasibility study presented in reference 2.
Three rigid-body degrees of freedom are included in the model: vertical t ranslation, fore-and-aft translation, and pitching about the airplane m a s s center. Since the model was devised t o study active control concepts of a single main gear with pitch rotation included, lateral symmetry was assumed and a simplified representation (linear spring with no rebound) of a nose gear was included t o absorb the rotational energy. Definitions of axes and forces for the rigid-airframe option and for the rigid-fuselageelastic-wing option are presented in figures 3 and 4, respectively. The model accounts for the following variables: sinusoidal o r random runway unevenness; empirical t i r e force -deflection characterist ics and antiskid braking; oleo-pneumatic s t rut with fit and binding friction; closed-loop, series-hydraulic control; first -mode wing bending and tor sional structural-elastic characterist ics; and theoretical subsonic aerodynamics without ground effect. These variables will be discussed in order in the following sections.
12
Runway Model
Two general methods of analysis f o r runway unevenness have been considered in the study reported in reference 4: deterministic and statist ical (power spectral). It was stated in reference 4 that the deterministic approach should be used for dynamic analysis when the response characteristics of the airplane are nonlinear. Consequently, runway models included in the present analysis are a sinusoidal variation of runway elevation as a function of distance t raversed along the runway or a random variation of runway elevation as a function of runway distance. For the sinusoidal variation, the runway elevation is defined in t e r m s of the frequency and the amplitude of undulation as follows:
The slope of the runway surface at any instant in t ime is:
The random variation of runway elevation is defined as piecewise l inear slopes in t e rms of runway distance t r ave r sed as follows:
F o r the random variation a table of runway elevation as a function of distance t raversed is required as input.
T i r e and Brake Models
The tire and brake models employed in this analysis are shown in sketch (a):
Brake sensor ?ass ,e
f Sketch (a)
13
Empirical tire force-deflection equations.- The mechanical properties of the tire-
are defined from semiempirical equations given in reference 3. Equation (125) of reference 3 is used to define the normal tire force FT,N during a landing impact as a function of tire deflection and physical properties of the undeformed tire. This equation is (in the present notation)
where
6 = 6, - 6,
FT,T6, = 0.01 -
KX,T
The tangential t i r e force FT,T during free rolling of the wheel i s defined as that /,
fo rce required to decelerate the wheel such that the tire tangential velocity is equal to the hub velocity. The tangential t i r e force during skidding (slip ratios 5 greater than zero) is defined as the tire-runway friction coefficient (-1 multiplied by the normal t i r e force.
Tire-runway friction coefficient. - The tire-runway friction coefficients are modeled~
as a function of wheel-runway slip ratio 5 (called Sw in ref. 5) on the basis of experimental data presented in references 5 and 6. (See sketch (b).) The dashed line represents the model of the tire-runway friction coefficient at touchdown and during wheel spin-up. In the present analysis, the friction coefficient at touchdown is assumed to be 0.336 on the basis of data in reference 6. During wheel spin-up the tire-runway friction coefficient i s held constant until the wheel slip ratio decreases to a value of 0.06 (sketch (b)), which i s the intersection of the braking and spin-up curves. The friction coefficient is then reduced along the braking-model curve to the value of ze ro friction for f ree rolling. Antiskid braking is initiated at the t ime of nose-gear touchdown, and the friction coefficient follows the braking curve to a slip ratio of approximately 0.25. The antiskid braking system then operates with a sensor mass acceleration corresponding to the slip ratio (approximately 0.25) for maximum t i r e -runway friction coefficient.
14
1.0
.8 r Braking
. 6
.4
.2 Spin-up
0 .2 .4 .6 .8 1.0
Sketch (b)
Braking model.- The antiskid braking system model presented in reference 5 w a s simplified in this paper by omitting the t i re elasticity at the tire-wheel interface. The brakes a r e controlled by the angular acceleration of the control sensor mass , which i s attached to the wheel through a spring-damper arrangement (sketch (a)) . Brake application and release a r e controlled by preselected values of control-sensor -mass accelerations. The brake torque applied by the system is assumed to be torque limited; onset and offset torque r a t e s may be independently changed, but vary linearly with time.
Oleo-Pneumatic Shock-Strut Model
A sketch of a typical oleo-pneumatic shock s t rut and a detailed description of the mechanics of the landing gear are presented in reference 7. During a landing impact the s t rut piston forces hydraulic fluid t o flow through an orifice at a high velocity and creates a p res su re drop ac ross the orifice which res i s t s the motion of the piston. (See fig. 2.) In addition to the hydraulic resistance to s t rut closure, the fluid flow into the s t rut cylinder increases the pneumatic (nitrogen) pressure, which also opposes s t rut closure. Internal bearing friction forces must a lso be considered along with the p re s su re forces. The total axial force developed by a passive (conventional) shock strut , with a metering pin, may be expressed as follows:
FA,ss = (PI - P2)(A1 - Ap) + P2A2 + *(Fss,l + Fss,2)jtanh (2s))( S I
15
where
12 - s
This i s a modified form of the equation presented in reference 7. Since the shock strut connects the air f rame and the hub, the axial force imposes acceleration t o the air f rame while reacting to hub motion.
Series -Hydraulic Active Control Gear Model
The purpose of the series-hydraulic active control gea r i s to limit the force applied to the air f rame at the wing-gear interface by regulating the damping force in the oleo-pneumatic strut. The model of the series-hydraulic active control gear i s shown schematically in sketch (c). The control consists of a servo valve, a high-pressure reservoir, a hydraulic pump, a low-pressure accumulator, an electronic control circuit, accelerome t e rs , p re s su re transducers, and a linear potentiometer.
Accelerometer High-pressure reservoir
Electronic
Hydraulic P*P
Low-pressure potentiometer accumulator
Accelerometer
Sketch (c)
The following example i l lustrates the operation of the series-hydraulic active cont ro l gear during a landing impact and roll-out. The m a s s at the wing-gear interface i s assumed to remain constant during landing; thus, the acceleration of the wing-gear inter -face reflects the force applied at this position. Fo r a specific airplane design and the measured sink rate, the limit force, defined f rom the limit acceleration, i s determined as the product of the mass and the square of the sink rate divided by the available shock-strut stroke. A signal corresponding to the limit acceleration i s input to the electronic control
16
.. .- ... . ...
circuit. The electronic control circuit (sketch (c)) continuously monitors the acceleration signal at the wing-gear interface and compares this signal with the limit acceleration signal. The control i s actuated when the wing-gear accelerometer signal exceeds the acceleration limit signal by a preset tolerance.
Figure 5 schematically i l lustrates three operational phases of the s e r i e s -hydraulic active control gear during a landing impact. First, the gear contacts the runway at the measured sink rate and the shock-strut force builds as the s t ru t stroking velocity b increases. The gear continues to operate in a passive mode (see fig, 5(a)) until the algebraic sum of the forces at the wing-gear interface (airplane weight, aerodynamic forces, and shock-strut force) exceeds the control limit force. The second operational phase occurs during shock-strut compression when the electronic control signals the servo valve to move the spool to connect the piston to the low-pressure accumulator. The rate at which the spool i s moved i s determined within the electronic control as a function of the stroking velocity of the shock s t rut . Hydraulic fluid will then flow from the shock-strut piston into the low-pressure accumulator (see fig. 5(b)) to limit the force r i s e in the shock strut . A s the shock-strut velocity decreases, the shock-strut hydraulic force will decrease. If the wing-gear -interface acceleration drops below the limit acceleration and if the wing-gear -interface velocity i s greater than a predetermined value, the rate of opening of the se rvo valve will be decreased to permit an increase of the hydraulic force and ra i se the shock-strut force. With continuing decrease in the shock-strut velocity and accompanying decrease in hydraulic force, the electronic control will command the se rvo valve spool to commence closing to maintain the wing-gear -interface acceleration within prescribed tolerances of the limit acceleration. When the servo valve spool returns to the fully closed position, the piston i s isolated from the low-pressure accumulator. The third operational phase occurs as the wing-gear acceleration drops below the limit acceleration, and the electronic control commands the spool to connect the piston to the high-pressure hydraulic reservoir . Hydraulic fluid i s then injected into the piston under high p res su re to increase the hydraulic force. (See fig. 5(c).) The rate at which fluid i s injected i s determined by the rate of change of the shock-strut extension velocity.
The transition from the impact phase to the ground-roll phase is accomplished by linearly decreasing the limit-force signal from the value used during the impact phase to a value to be used during the ground-roll phase. During this transition, the limit acceleration tolerance will be increased to a value compatible with the active control gear design. With the assumption that the mass of the airplane remains constant during landing, the momentum of the wing-gear interface i s determined by the wing-gear -interface velocity. The objective of the transition phase i s to reset the signal for control limit acceleration and the tolerance signals to values compatible with a wing-gear -interface acceleration of zero for the ground-roll phase. This infers that the impact energy of the airplane has been dissipated. Transition to the ground-roll configuration i s initiated when the wing
17
gear -interface velocity, which is continuously monitored by the electronic control, be -comes equal to a signal input equivalent t o a n impulse divided by the airplane mass. For takeoff the control will be activated in the ground-roll mode. After takeoff, when the gear becomes fully extended, the control will be recycled into the impact phase of operation and will be deactivated during gear retraction. When the gear i s extended for landing, the control will be activated in the impact mode.
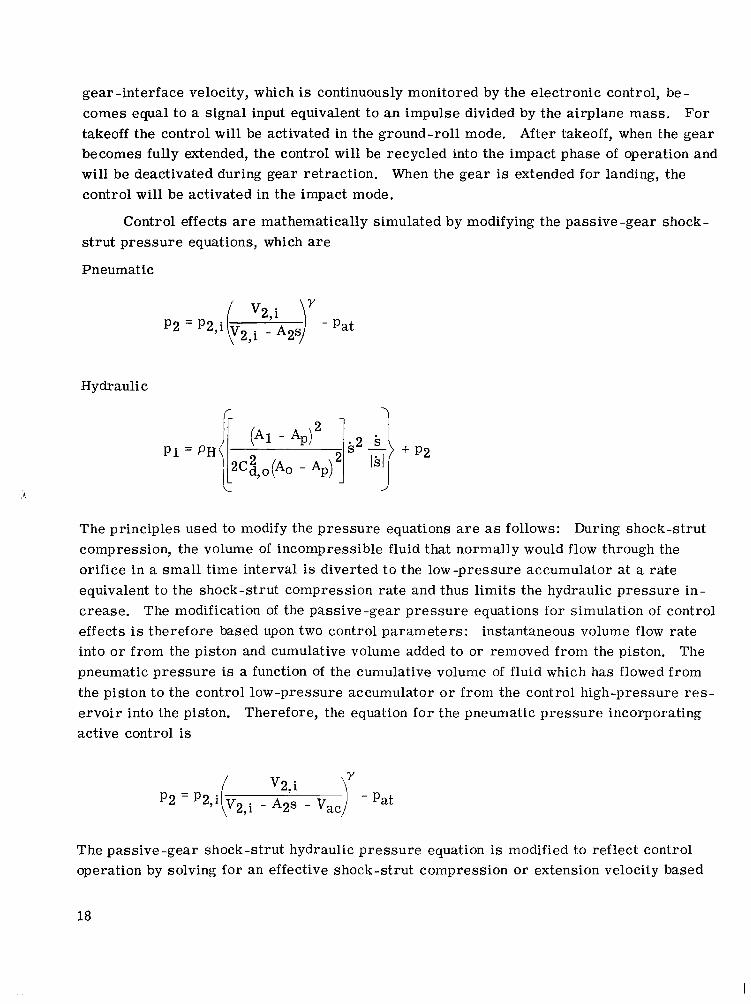
Control effects are mathematically simulated by modifying the passive -gear shock-s t ru t p re s su re equations, which are
Pneumatic
Hydraulic
The principles used to modify the p re s su re equations a r e as follows: During shock-strut compression, the volume of incompressible fluid that normally would flow through the orifice in a small t ime interval i s diverted to the low-pressure accumulator at a rate equivalent to the shock-strut compression rate and thus l imits the hydraulic p re s su re increase. The modification of the passive -gear p re s su re equations for simulation of control
instantaneous volume flow rateeffects i s therefore based upon two control parameters : into o r from the piston and cumulative volume added to or removed from the piston. The pneumatic p re s su re i s a function of the cumulative volume of fluid which has flowed from the piston t o the control low-pressure accumulator o r from the control high-pressure r e s ervoir into the piston. Therefore, the equation f o r the pneumatic p re s su re incorporating active control i s
The passive-gear shock-strut hydraulic p re s su re equation is modified to reflect control operation by solving for an effective shock-strut compression or extension velocity based
18
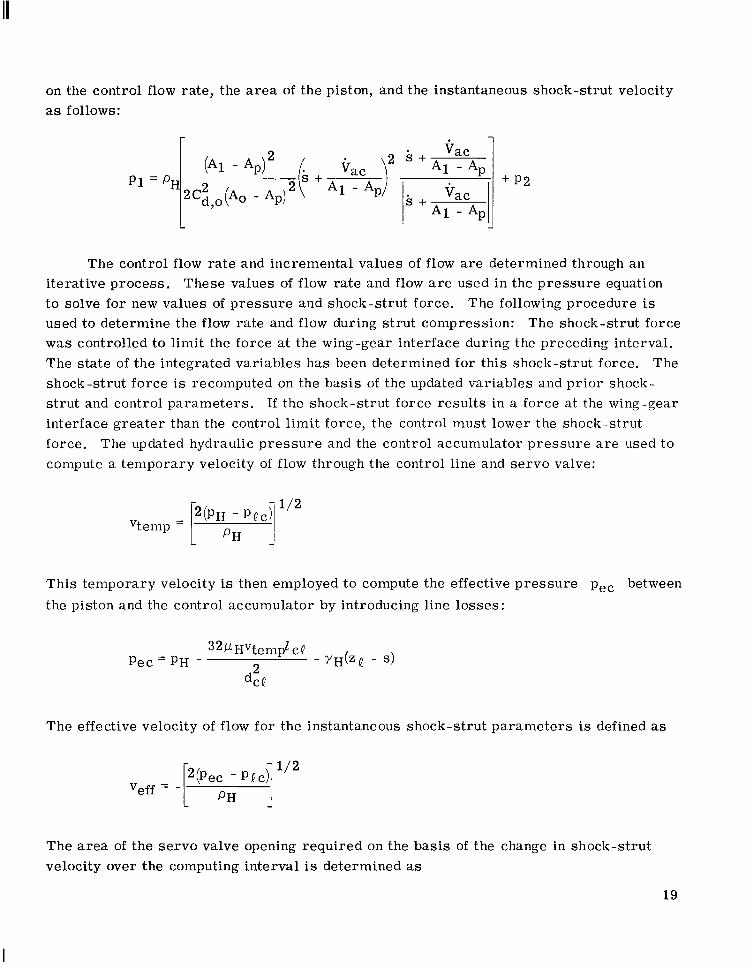
on the control flow rate, the area of the piston, and the instantaneous shock-strut velocity as follows:
r
The control flow rate and incremental values of flow a r e determined through an iterative process. These values of flow rate and flow are used in the p re s su re equation to solve for new values of p re s su re and shock-strut force. The following procedure i s used to determine the flow rate and flow during s t rut compression: The shock-strut force w a s controlled to limit the force at the wing-gear interface during the preceding interval. The state of the integrated variables has been determined for this shock-strut force. The shock-strut force i s recomputed on the basis of the updated variables and pr ior shock-strut and control parameters . If the shock-strut force resul ts in a force at the wing-gear interface greater than the control l imit force, the control must lower the shock-strut force. The updated hydraulic p re s su re and the control accumulator p re s su re a r e used to compute a temporary velocity of flow through the control line and se rvo valve:
This temporary velocity i s then employed to compute the effective p re s su re pec between the piston and the control accumulator by introducing line losses:
The effective velocity of flow for the instantaneous shock-strut parameters i s defined as
L -1
The area of the se rvo valve opening required on the basis velocity over the computing interval i s determined as
of the change in shock-strut
19
The control flow rate is defined as
vac 1 t = Cd,coAcoltVeff
and the incremental flow occurring during the t ime interval is
The shock-strut force for the active gear i s determined by the same equation used for the passive gear. If the shock-strut force again resul ts in a wing force greater than the limit force, the control orifice area i s increased and new values of flow rate and flow are computed on the basis of the shock-strut parameters at the beginning of the interval. The flow which occurred during the f i r s t iteration is removed from the cumulative flow and the new value of flow is algebraically summed. This iterative process continues until the'
Mathematical simuwing force is within the design tolerance of the control limit force. lation of flow f r o m the control high-pressure reservoir into the shock-strut piston i s accomplished in a s imi l a r manner.
Elastic-Wing Model
Limited structural-flexibility effects a r e considered by including in the mathemati cal model first-mode wing bending and wing torsional characterist ics. The wing bending mode i s defined as the deflection of the elastic axis of the wing deforming as a cantilever beam. The wing mass, wing-gear interface, and engine m a s s a r e assumed to be located on the wing chord at the same spanwise location. The wing i s a lso assumed to be rectangular in planform. The equation f o r the spanwise bending spring constant may, with the foregoing assumptions, be expressed as
The bending deflection Z B ~of the wing i s determined from the relative motion of the intersection of the wing elastic axis with the x b - z b plane containing the fuselage center line and the wing elastic axis at the spanwise chord containing the wing mass center. The wing
20
bending force i s determined from the product of wing bending deflection and the wing bending spring constant:
The first-mode torsional characterist ics of the wing are determined assuming a constant wing c ross section from the fuselage center line t o the spanwise chord containing the wing mass center and the wing-gear interface. Wing torsional deflection i s assumed to occur about the elastic axis and the wing chord is assumed to remain undeformed. With these assumptions the wing torsional spring constant i s
where
Ssect chordwise a r e a of wing c ross section, m2 (ft2)
Y spanwise distance from fuselage center line to chord containing wing-gear interface, m (ft)
h height of wing box, m (ft)
twbh thickness of horizontal wing box units, m (ft)
twbv thickness of vertical wing box units, m (ft)
Wwbx width of wing box, m (ft)
The torsional elastic deformation ae of the wing chord a t the spanwise location of the wing mass center relative to the wing chord at the fuselage center line i s determined from the relative angular motion of these sections. The wing torque i s defined a s the product of the torsional elastic deformation and the wing torsional spring constant:
2 1
Aerodynamic Model
The aerodynamic model employed is based on theoretical subsonic aerodynamics, neglecting ground effects, determined from reference 8. The theoretical lift -curve slope fo r a wing of infinite aspect ra t io i s
a, = dCL/da = 2n p e r radian
For a finite aspect ratio, the lift-curve slope i s approximately
a=- & p e r radian 1 + p R2
The wing lift force is
where
The tail lift force is found in a s imilar manner.
The wing aerodynamic drag force (ref. 8) is assumed to consist of induced drag, friction drag, and profile drag and is defined as follows:
2% = 0.5PaSwkc,g(CD,i + CD,f + cD,p)
where
Induced drag,
Friction drag,
Profile drag,
The drag forces for the tail surfaces and the fuselage are determined in a s imilar manner.
EQUATIONS OF MOTION
The deterministic solution consists of determining the forces to be used in the equations of motion, defining the coupled equations of motion which govern the response of the airplane, and performing numerical integration of the equations of motion on a digital computer. The equations of motion were written for two separate options: rigid-airframe option, and rigid-fuselage--elastic-wing option. The coupled equations of motion are p r e sented in appendix A for both options.
F o r the elastic wing, the wing mass center has additional degrees of freedom, which a r e perturbations in the Zb-direction and in rotation about the elastic axis relative to the
rigid-body motions of the airplane.
The equations of motion were solved by performing a numerical integration. The numerical integration procedure i s based on the classical fourth-order Runge-Kutta fo rmula, and use of Richardson's extrapolation-to-the-limit theory resul ts in a fifth-order integration procedure. This procedure operates with a variable time interval which i s sized to meet a specified local relative truncation e r r o r .
ANALYTICAL MODEL SIMULATIONS
To validate the mathematical model described in the foregoing sections and to p e r form an evaluation of the active-control gear, a landing-gear and airplane configuration w a s modeled t o permit simulations of vertical-drop tes ts , landing impacts, and landing roll-outs with the ACOLAG computer program. To accommodate the active control, the passive gear was modified in the analysis to provide additional stroke capability. The stroke was increased from 0.187 m (7.375 in.) to 0.264 m (10.375 in.) by increasing the cylinder length, pneumatic volume, and piston length.
Passive G e a r
Vertical-drop test . - To permit comparison between computed data from the ACOLAG computer program with experimental drop-test data, the program w a s adapted t o include t i r e hysteresis for the nonrotating wheel (ref. 3) , and braking simulation w a s excluded. A lumped mass at the gear trunnion was used to simulate a rigid airframe. The passive
23
landing gear (ref. 7) f r o m a 2268-kg (5000-lbm) c l a s s airplane was selected, since experimental vertical-drop-test data were available for this gear. A sketch of the shock s t rut
and the geometric characterist ics of the gear a r e presented in appendix B. The impact parameters were a sink rate of 2.7 m/sec (5.8 f t j sec) ; a lift fo rce of 10.7 kN (2412.5 lbf), which was held constant throughout the impact; a pitch angle of 00 (gear normal to impact surface); and a wheel rotational velocity of 0 rad/sec (0 ft /sec).
-Landing impact. - F o r comparison of computed data with data obtained from transversely symmetrical airplane landings, t i r e hysteresis effects were eliminated (ref. 3) and antiskid braking was included. An airplane configuration was defined in t e rms of geometry, a rigid-airframe lumped mass distribution, and aerodynamics compatible with the selected landing gear. The geometry and lumped m a s s distribution of the airplane configuration are shown schematically in figure 6 .
Since experimental landing-impact data a r e not available for the selected passive gear (ref. 7), ACOLAG was evaluated for landing impact by comparing the resul ts of this simulation with computed resul ts obtained f r o m a multiple -degree-of -freedom takeoff and landing analysis (TOLA), which, as described in reference 9, will only accommodate conventional gea r s and a rigid air f rame. The impact parameters were a sink rate of 2.7 m/sec (8.8 ft /sec); a ground speed of 45 .7 m/sec (150 ft /sec); a pitch mgle of 10.50; an angle of attack of 13.8O, which resul ts in a lift force equal to the airplane weight at touchdown; and a wheel rotational velocity of 0 rad/sec (0 ft /sec).
Landing roll-out. - To determine the damping characterist ics of the modified passive. -
gear, a landing roll-out simulation was made. F o r this simulation the airplane was placed on the runway with a pitch angle of 0 r ad (0 deg), the gear and t i r e deflected to support the mass of the airplane, the t i r e and wheel in the free-rolling condition, and a ground speed equal to 44.5 m/sec (146 ft /sec). The simulation w a s s tar ted with the t i r e encountering a sinusoidally varying (3 Hz with a half-amplitude of 0.0254 m (0.0833 f t ) ) runway bump which had an initial elevation of zero. At the end of one-quarter cycle, the surface was dropped vertically to ze ro elevation and remained at this elevation for the remainder of the simulated roll-out.
Active Gear
Vertical-drop test. - No experimental data a r e available for the active control gear._ _ _ ~ -.~
Therefore, evaluation of the active control gear was accomplished by comparing computed resul ts for the active gear with those of the passive gear f o r the vertical-drop test. The gear parameters and impact parameters were the same as those for the passive gear.
Landing impact. - F o r this case evaluation of the active control gear was accomplished by comparing computed results for the active gear with those of the modified pas
24
sive gear. The airplane configuration and impact parameters were the same as those described in the section "Landing impact" for the passive gear.
Landing roll-out. - To compare the damping characterist ics of the active gear with those of the modified passive gear, a landing roll-out simulation was made for the airplane and runway parameters cited in the section "Landing roll-out" f o r the passive gear.
The modification of the passive gear discussed in this paper i s simply an expedient method to characterize the range of control parameters that would be required for such a design. However, it should be noted that an active control gear would not be a simple modification of a passive-gear design, but would require an independent design based upon optimization of gear parameters in conjunction with control parameters .
RESULTS AND DISCUSSION
To evaluate the ACOLAG computer program, results were obtained from the vertical-drop -test simulation and compared with the experimental data reported in refer ence 7. The TOLA computer program (ref. 9) was also employed to simulate the same vertical-drop tes t and the resul ts were compared with the experimental data. Evaluation of the ACOLAG landing -impact simulation w a s accomplished by comparing results obtained by using the rigid-airframe and passive-gear modes with results obtained for a s imilar calculation employing the TOLA computer program.
Results a r e presented for vertical-drop-test simulations with stationary and vertically oscillating impact surfaces; for landing-impact simulations on a flat runway surface and a sinusoidally varying amplitude surface; and for a landing roll-out on a runway s u r face having a single, quarter -cycle, sinusoidal bump ending in a vertical discontinuity at peak amplitude, followed by a flat surface.
Passive Gear
. .- _...Vertical-drop simulations. - Figure 7(a) presents computed and experimental time histories of shock-strut force and stroke during the impact phase of the vertical-drop tes t of the passive gear. Since rebound of the upper mass (airframe mass) occurred at approximately 0.16 s e c in both the experiment (ref. 7) and the computer simulation, data a r e not presented beyond this time. The shock-strut forces computed from ACOLAG and TOLA a r e in excellent agreement and both are in good agreement with the experimental data. A s was the case with the shock-strut force, the calculated shock-strut strokes for the two programs a r e in excellent agreement and both are in good agreement with the experimentally determined strokes for most of the time history.
Time histories of vertical ground force and t i re deflection, computed for a rigid a i r f r ame and a passive gear, a r e compared in figure 7(b) with experimental data obtained
25
f rom the vertical-drop test (ref. 7). Computed vertical ground forces are generally in excellent agreement with the ground force obtained f r o m the experiment, The ground force computed from the ACOLAG program is in excellent agreement with that computed from the TOLA program. The tire deflections calculated from the ACOLAG program are in excellent agreement with those computed from the TOLA program and both are in good agreement with experimental data.
Figure 7(c) presents a comparison of mass-center accelerations (nomenclature for experimental data i s upper -mass accelerations) for the computed resul ts and experimental data. Since the shock-strut force i s the only varying force applied to the upper mass, the trend of the comparison should be the same as that f o r the shock-strut force (fig. 7(a)). The trend i s the same and the agreement between computed and experimental mass-center accelerations is good.
Landing-impact simulations. - Evaluation of the ACOLAG computer program for the landing-impact option i s accomplished by comparing computed resul ts from the ACOLAG program with resul ts from the TOLA program. These comparisons are presented in figure 8.
Time histories of pitch attitude a r e compared in figure 8(a) for a landing impact on a flat runway. The agreement between the computed resul ts f rom the two programs i s excellent.
Time histories of shock-strut force and s t roke calculated from the two programs a r e compared in figure 8(b). The shock-strut forces a r e in excellent agreement. A l though the shock-strut strokes computed from the ACOLAG program a r e slightly less than those calculated from the TOLA program, the agreement i s good.
Computed t ime histories of vertical ground force and t i re deflection a r e compared in figure 8(c). The vertical ground forces and t i re deflections calculated with the ACOLAG program are in good agreement with those computed with the TOLA program.
Airplane mass -center accelerations obtained f rom the ACOLAG and TOLA programs a r e compared in figure 8(d). The Zb-axis accelerations are in good agreement to a time of approximately 0.17 sec. At this time, the TOLA program indicates that the nose gear has contacted the surface, and hence the Zb-axis accelerations increase. The ACOLAG program has the nose gear contacting the surface at a t ime of approximately 0.18 sec, at which time, because of the simplified nose-gear representation, data from the ACOLAG program a r e not comparable with those of the TOLA program. Mass-center Xb-axis accelerations a r e in good agreement to a time of approximately 0.11 sec. A t this time the wheel has spun up and i s in a free-rolling state. When the wheel i s freely rolling, the tire-runway friction coefficient in ACOLAG is decreased to a value which produces no wheel slippage. This t i re -runway friction coefficient resulted in a very small component
26
of ground drag force applied at the m a s s center, while the Xb-axis component of the ve r tical ground force was sufficiently large to develop a positive Xb-axis acceleration of the mass center. The definition of the tire-runway friction coefficient in TOLA resulted in a l a rge r tire -runway friction coefficient during free rolling of the wheel. Consequently, the ground drag force applied at the m a s s center and hence the mass-center Xb-axis accelerations were greater . Comparison of Xb-axis accelerations was also terminated at the t ime of contact between the nose gear and the surface.
Considering the good agreement shown between TOLA and ACOLAG resul ts when compared with experimental data and when compared with each other, the ACOLAG prog ram appears to be a valid tool for the study of various actively controlled landing gears .
Ser ies -Hydraulic Active Control Landing Gear
Results which demonstrate the operation of a series -hydraulic active control gear for vertical -drop and landing-impact simulations are presented and compared in figures 9 to 13.
Vertical-drop simulations. - Computed resul ts f o r the passive and active control ._-.. -- .~
gea r s a r e compared in figure 9 for a vertical drop onto a flat stationary surface. Fig
u r e 9(a) presents a comparison between the wing forces experienced during a vertical-
drop simulation of the passive and active gears . The wing force is shown as a function of wing displacement. Presentation of the active-gear resul ts i s discontinued at the maxi
mum value of wing displacement because in the vertical-drop simulation the aerodynamic lift was maintained constant at a value equivalent to the mass of the airplane, and hence resul ts calculated during rebound are not physically realist ic for a landing simulation. F o r the active-gear simulation the wing force was limited to 21.46 kN f 334 N (4825 lbf f 75 lbf), which represents a 26-percent reduction from that of the passive-gear simu1ation.
It was noted in reference 2 that for aluminum structures undergoing a cyclical level resulting in a fatigue life of approximately l o 5 cycles, the relation between the number of cycles to failure N and peak-to-peak s t r e s s o is
where A = 1.8 x Pa5 (1bf5/ftlo). If a fully reversed stress of 241 MN/m2 (35 000 psi) for the passive gear simulation i s assumed on an aluminum wing s t ructure , the fatigue life of this s t ructure would be 34 000 cycles. With the wing fo rce controlled to a value of 74 percent of the passive-gear value, the same s t ructure would have an increased fatigue life of approximately 4.5 t imes, o r 154 000 cycles. Thus it appears that smal l reductions in cyclical stress levels have a significant effect on the fatigue l ife of the structure. Re
27
duction in wing force, however, resul ts in an increase in wing displacement of approximately 10 percent for this case, which is pr imari ly reflected in an increased shock-strut stroke. F o r energy compatibility to exist between the passive-gear and the active-gear simulations, the hatched areas of figure 9(a) must be equal. The energies represented by the hatched areas were determined to be nearly the same. Thus, the incorporation of the control analysis into the passive -gear analysis resul ts in an energy-compatible procedure, which increases confidence in the validity of active control landing gea r analysis.
Time histories of shock-strut force and stroke for the passive and active gears are compared in figure 9(b). At approximately 0.047 sec, control of the shock-strut force level at 21.46 kN f 334 N (4825 lbf f 75 lbf) was initiated to maintain the wing force within the preset limits, which were exceeded at this time. Since the s t rut was compressing, the control removed fluid and the maximum flow rate attained was -428 l /min (-113 gal/min) at 0.084 sec. A t ransfer from the low-pressure mode to the high-pressure mode was required at 0.11 s e c to maintain the wing force. This t ransfer resul ts in a shift to the lower bound of the control limit force and accounts for the lower shock-strut force during the t ime from 0.11 s e c to 0.143 sec. The maximum injection flow rate of 458 f/min (121
The momentum of the upper mass becomesgal/min) occurred a t a t ime of 0.129 sec. equal to the impulse designed into the electronic control circuit at a t ime of 0.143 sec, and the electronic control commands a linear decrease in the limit force from the impact limit force to the roll-out limit force. When the roll-out limit force i s reached, data presentation i s terminated. At the t ime of initiation of control at the roll-out limit force (0.18 sec), the shock-strut stroke for the active-gear simulation was approximately 17 percent greater than the stroke shown for the passive-gear simulation.
Figure 9(c) shows calculated t ime histories of vertical ground force and tire deflection for the vertical-drop simulations of the passive and active gears. As would be expected for the controlled lower shock-strut force, both the vertical ground force and t i re deflection were lower for the active-gear simulation than those for the passive-gear simulation.
Computed resul ts f o r the passive and active control gea r s a r e compared in figure 10 for a vertical drop onto a vertically oscillating surface. The vertically oscillating surface was introduced to simulate a sinusoidally varying runway-unevenness effect, since no ground speed i s involved with vertical-drop testing. The surface oscillation, a frequency of 10 Hz and a half-amplitude of 0.0254 m (0.0833 f t ) , was selected as a worse-case condition, since this corresponded t o the resonant frequency of the hub mass. At touchdown the surface was set into an upward motion opposite to that of the gear.
Wing force as a function of wing displacement i s shown in figure lO(a) for the vertical-drop simulation. In the initial phase of this simulation the ground motion passed through the peak displacement and was moving away from the tire. The resulting initial
- -
rise in wing force did not exceed the upper bound of the limit force (21.80 kN (4900 lbf)); consequently, the control was not activated. During the fourth quarter of the first cycle of ground motion, however, the control was activated because the ground was again moving into the tire and the resulting wing force exceeded the upper bound of the control l imit force. The wing force, fo r the active gear in this simulation, attained a value of only 64 percent of that of the passive gear with a n increase in wing displacement of only 5 percent.
T ime histories of shock-strut force and s t roke are shown in figure 10(b) for the vertical-drop simulation with the oscillating surface. The appreciable reduction in wing force (36 percent) with the relatively smal l increase in wing displacement (5 percent), as shown in figure lO(a),was not attained without penalty. To achieve these values, the maximum control flow rates required, as shown in figure lO(b), were -723 P/min (-191 gal/min) during compression and 1423 P/min (376 gal/niin) during transition from impact to roll-out control. Also, a 25-percent increase in shock-strut s t roke above that of the passive gear was required. However, it should be recalled that the surface motion was chosen t o create a worse-case condition, and for this study the gear was not optimized to be compatible with the se r i e s -hydraulic control.
Figure 1O(c) shows t ime histories of vertical ground force and t i r e deflection computed f o r this simulation. A s would be expected, the maximum ground force and t i r e deflection for the active gear were smal le r than those computed for the passive gear during the portion of the impact phase p r io r t o rebound.
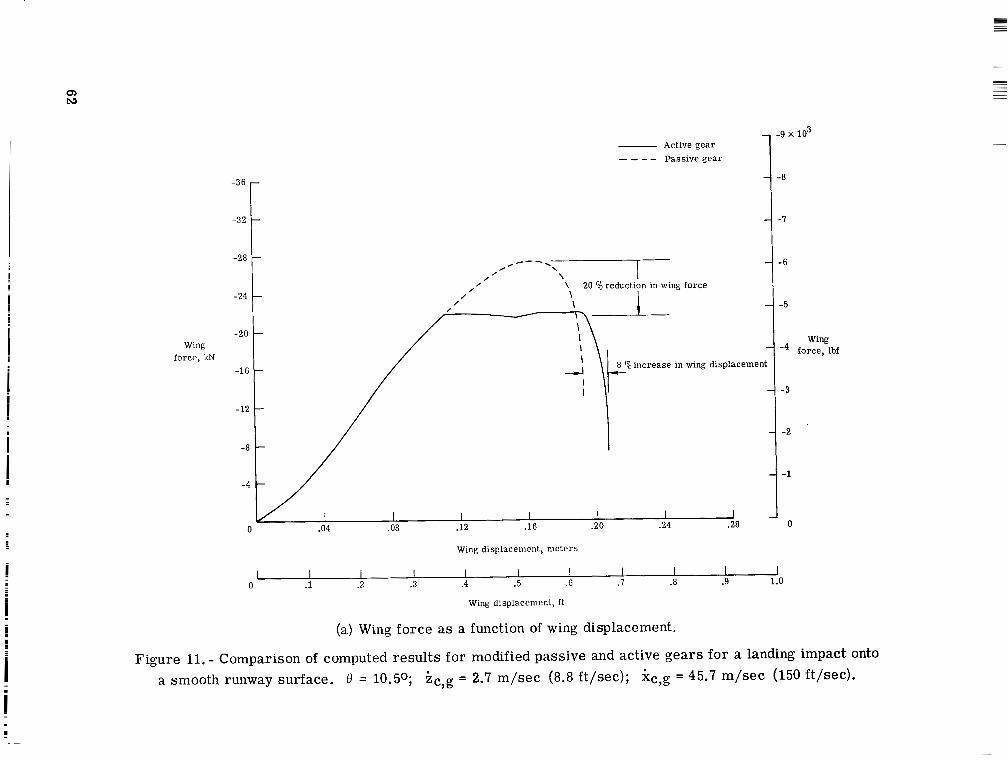
simulations.- Comparisons of computed data for the modified pas-_ _Landing-impact . ____
sive gear and the series-hydraulic active control gear are presented in figures 11 and 12. Figure 11 shows comparisons of computed data for landing-impact simulations onto a smooth runway. Comparisons of computed data for landing-impact simulations onto a sinusoidally uneven runway (frequency of 10 Hz with a half -amplitude of 0.0254 m (0.0833 f t ) ) a r e shown in figure 13.
Figure l l ( a )presents comparisons of computed wing force as a function of wing displacement for the passive gear and the active gear . The active gear achieved a 20-percent reduction in wing force relative to the passive gear, with a n increase in wing displacement of 8 percent.
Figure l l (b ) compares computed t ime his tor ies of shock-strut force and s t roke for the passive and active gears . The shock-strut force for the active control gear gradually increases during the initial control phase, in contrast to the essentially constant shock-s t ru t force for the vertical-drop simulation. (See fig. 9(b).) Since the wing force is the force being maintained by the control, the shock-strut force increases to offset the decrease in lift force as the airplane pitches down during the impact. The maximum control flow ra t e s required during this simulation were 447 Q/”in (118 gal/”in) for injection of fluid into the piston and -397 Q’min (-105 gall inin) for removal of fluid from the piston.
29
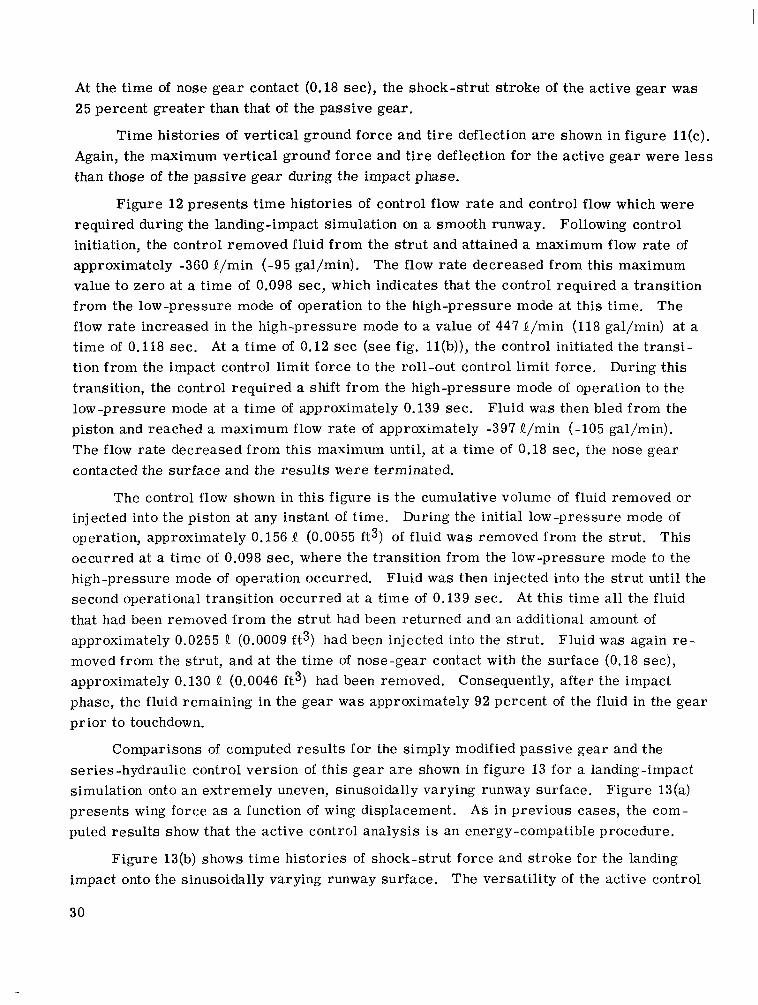
At the t ime of nose gea r contact (0.18 sec), the shock-strut s t roke of the active gear was 25 percent greater than that of the passive gear.
Time histories of vertical ground force and t i r e deflection are shown in figure l l(c). Again, the maximum vertical ground fo rce and tire deflection for the active gear were less than those of the passive gear during the impact phase.
Figure 12 presents t ime histories of control flow rate and control flow which were required during the landing-impact simulation on a smooth runway. Following control initiation, the control removed fluid f r o m the s t ru t and attained a maximum flow rate of approximately -360 Q/min (-95 gal/min). The flow rate decreased from this maximum value to zero at a t ime of 0.098 sec, which indicates that the control required a transition from the low-pressure mode of operation to the high-pressure mode at this time. The flow rate increased in the high-pressure mode to a value of 447 P/min (118 gal/min) at a t ime of 0.118 sec. At a t ime of 0.12 s e c (see fig. l l (b) ) , the control initiated the t ransition from the impact control limit force to the roll-out control limit force. During this transition, the control required a shift f r o m the high-pressure mode of operation to the low-pressure mode at a time of approximately 0.139 sec. Fluid was then bled from the piston and reached a maximum flow rate of approximately -397 Q/min (-105 gal/min). The flow rate decreased f rom this maximum until, at a t ime of 0.18 sec, the nose gear contacted the surface and the resul ts were terminated.
The control flow shown in this f igure i s the cumulative volume of fluid removed or injected into the piston at any instant of time. During the initial low-pressure mode of operation, approximately 0.156 Q (0.0055 ft3) of fluid was removed from the strut. This occurred at a time of 0.098 sec, where the transition from the low-pressure mode to the high-pressure mode of operation occurred. Fluid was then injected into the strut until the second operational transition occurred at a time of 0.139 sec. At this time all the fluid that had been removed from the s t rut had been returned and an additional amount of approximately 0.0255 Q (0.0009 ft3) had been injected into the strut . Fluid was again r e moved from the strut , and at the t ime of nose-gear contact with the surface (0.18 sec) , approximately 0.130 Q (0.0046 ft3) had been removed. Consequently, after the impact phase, the fluid remaining in the gear was approximately 92 percent of the fluid in the gear pr ior to touchdown.
Comparisons of computed resul ts f o r the simply modified passive gear and the series-hydraulic control version of this gear are shown in figure 13 for a landing-impact simulation onto an extremely uneven, sinusoidally varying runway surface. Figure 13(a) presents wing force as a function of wing displacement. A s in previous cases, the computed results show that the active control analysis i s an energy-compatible procedure.
Figure 13(b) shows t ime histories of shock-strut force and stroke for the landing impact onto the sinusoidally varying runway surface. The versatility of the active control
30
logic of the analysis may be seen by comparing the shock-strut-force resul ts shown in this figure with those shown in figure 10(b) at the t ime of control activation. A s discussed in connection with the vertical-drop simulation, control activation w a s initiated in the low -pres su re phase, as anticipated during development of the control logic, and occurred dur ing the fourth quarter of the f i r s t cycle of surface oscillation. In figure 13(b) control w a s initiated in the low-pressure phase during the f i r s t one-quarter cycle of surface oscillation; however, the next one-half cycle of the surface oscillation w a s in phase with the wing motion and the shock-strut force for the passive gear decreased. A s a consequence, the wing force decreased below the lower tolerance of the wing limit force and the high-p res su re phase was required to maintain the wing force within the limits. Operation remained in the high-pressure phase until transition was required from the impact control limit force to roll-out control limit force. Since no experimental data are available on active control landing gears , this illustration of the versatility of the control logic in dealing with unexpected interactive effects increases confidence in the active control landing gear analysis.
The maximum control flow ra tes encountered in this simulation were 432 Q/min (114 gal/min) for the high-pressure phase of operation and -1154 Fjmin (-305 gal/min) for the low-pressure phase of operation. These large flow ra tes coupled with t i re bounce (see fig. 13(b))a r e undesirable.
Time histories of vertical ground force and t i r e deflection for this simulation a r e presented in figure 13(c). The computed resul ts for the active control gear show that upon control activation, ground force and t i re deflection become greater than those for the passive gear. A s previously noted in figure 13(a), the wing force for the passive gear i s
It i s desirable from the standpoint ofoscillatory because of the runway perturbations. fatigue not only to limit the magnitude of the forces applied to the upper body but to reduce oscillations as well. Consequently, with the control operating i h the high-pressure mode the shock-strut force was increased to prevent the wing-force oscillation, A s a result of this increased shock-strut force, the ground ,force and t i re deflection increased relative to those obtained for the passive gear . Presentations of active-gear resul ts a r e discontinued at the t ime the t i re leaves the surface.
Landing roll-out simulations. - The effects of the series-hydraulic control on the-
damping characterist ics of the modified oleo-pneumatic shock s t rut are shown in figure 14 by comparing t ime histories of wing force and vertical ground force for the active and passive gears during a roll-out simulation. The simulations were made assuming that the mass of the airplane was supported by the main gea r s and the ground speed was 44.5 m/sec (146 ft/sec).
Figure 14(a) presents computed t ime histories of wing force for the passive and active gea r s for the roll-out simulation. F o r the active gear, the wing force was con
31
trolled about ze ro force with a tolerance of *2134 N (+480 lbf) and the wing force varied f r o m zero t o approximately -3114 N (-700 lbf). At a t ime of approximately 0.08 s e c the runway elevation dropped vertically to zero and the wing force for the passive gear increased very rapidly to a value of 4782 N (1075 lbf). At a t ime of 2 sec, the wing force for the passive gear had damped to about 11percent of the peak-to-peak value encountered during the first cycle. The active -gear simulation shows that the series-hydraulic control limited the wing force to the control limit force during the f i r s t two cycles, and at a t ime of 2 sec, the wing force had damped to about 5 percent of the peak-to-peak value encountered during the first two cycles.
Computed t ime histories of vertical ground force are presented in figure 14(b) for both the passive- and active-gear landing roll-out simulations. The peak-to-peak excur sion of vertical ground force for the active gear, after the surface discontinuity, was greater than that for the passive gear. Subsequent peak-to -peak force oscillations, about the static ground force of 10.7 kN (2412.5 lbf), were lower than those of the passive gear .
On the basis of these comparisons of wing force and vertical ground force for both the passive and active gears , it appears that the damping characterist ics of the series-hydraulic active control gear were equivalent to o r better than those of the modified pas sive gear for an excitation resulting f rom a vertically discontinuous, sinusoidal bump. In addition, the wing force encountered during t raverse of the bump was reduced by 30 p e r cent of the wing force experienced by the passive gear.
CONCLUDING REMARKS
A mathematical model of an active control landing gear has been developed and programed for operation on a digital computer. The principles upon which the model i s based have also been discussed. The model has been evaluated for predicting airplane loads and motions encountered during simulations of a vertical drop and a landing impact of a rigid air f rame with a landing gear incorporating a conventional (passive) oleo-pneumatic shock strut . Results have also been presented for the operation of a se r i e s -hydraulic active control gear for s imilar simulations of a vertical drop and landing impact and roll-out.
The resul ts obtained from this investigation a r e summarized in the following statements: The computed resul ts from the subject mathematical model, simulating a vertical-drop test with a rigid a i r f r ame and a passive gear, a r e in good agreement with experimental data and with resul ts obtained from a multiple -degree-of -freedom takeoff and landing analysis (TOLA). Computed resul ts for a landing-impact simulation, with a rigid air f rame and passive gear, are in excellent agreement with resul ts computed for the same landing-impact simulation employing TOLA. On the basis of these comparisons, it appears that the mathematical model of the active control landing gear i s valid for the prediction of
32
airplane landing loads and motions for simulated symmetrical landings of a rigid air f rame with passive main landing gears.
Results of vertical-drop and landing-impact simulations employing the mathematical model of the active control landing gear show that wing forces, relative to those encountered with the modified passive gear, can be reduced substantially during the impact phase of the landing. The vertical-drop simulation for the active gear resulted in limiting the wing force to 75 percent of the force f o r the modified passive gear with a-15-percent inc rease in shock-strut stroke. The resul ts of the landing-impact simulation for the active gear on a smooth runway indicated that the wing force could be limited to 80 percent of the force for the modified passive gear during the impact phase, with a 25-percent increase in s t rut stroke relative to that encountered during passive-gear simulation. The results for a landing-impact simulation onto an extremely uneven runway also indicated that the wing force could be limited, during the impact phase, to 80 percent of the wing force encountered with the modified passive gear. In this case, however, a 45-percent increase in shock-strut stroke relative to that encountered with the passive gear was required. These reductions in wing force could result in substantial increases in fatigue life of the s t ructure ,
Comparison of computed resul ts f o r the active and passive gears during a landing roll-out, in which the gea r s were forced into motion by a single, discontinuous, one-quarter cycle, sinusoidal bump, indicated that the se r i e s -hydraulic active control gear had damping characterist ics equivalent to or slightly better than those inherent in the modified passive gear. Fo r these simulations, the active gear reduced the wing force by 30 percent of the wing force generated by the passive gear ,
Control flow ra t e s required by some of these simulations were very large and, if ultimately required for this type of active control gear, could necessitate advances in servo valve technology. However, it should be reemphasized that these resul ts were for a simply modified version of a landing gear with a conventional oleo-pneumatic shock s t rut and, consequently, do not necessarily represent optimum resul ts that could be obtained with a gear specifically designed to be compatible with the series-hydraulic control concept.
Langley Research Center National Aeronautics and Space Administration Hampton, Va. 23665 December 18, 1975
33
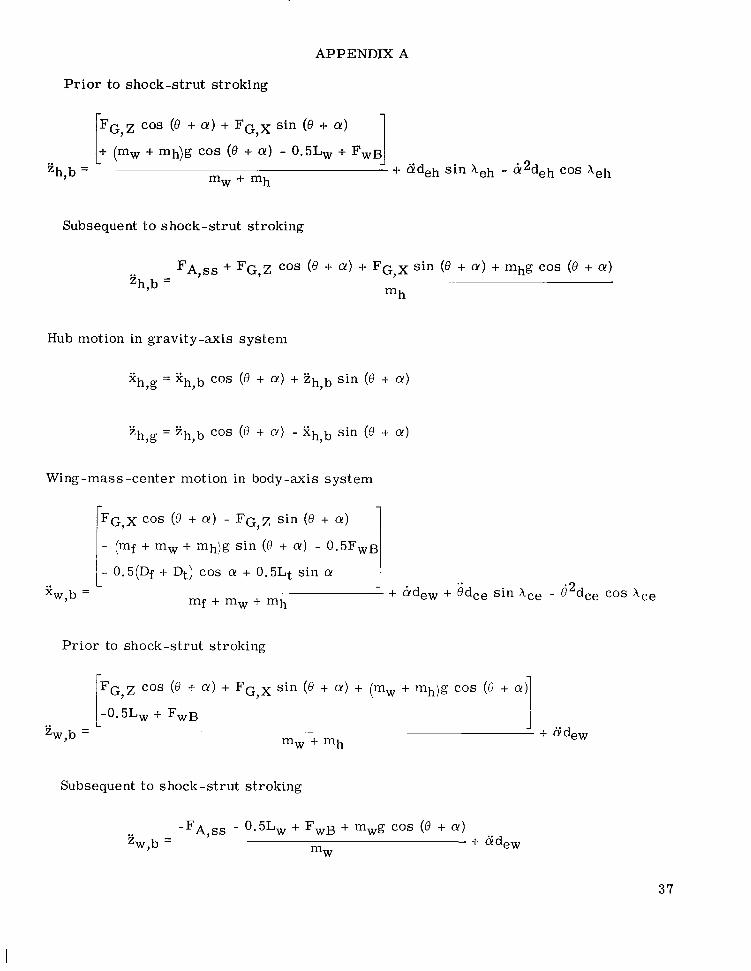
APPENDIX A
EQUATIONS OF MOTION
This appendix presents the equations of motion for the physical system shown schematically in figures 3 and 4 for the rigid-airframe option and the rigid-fuselage-elasticwing option.
Rigid-Airframe Option
The equations of motion for the rigid-airframe option in the body-axis system and the gravity-axis system are presented in this section.
Airplane center-of -gravity (composite m a s s center) motion in body-axis system
p.5Lt sin a - 0.5(Df + Q) cos a - 0.5% + FG x cos (6 + a ) - FG z sin (6 + a )11- (mf + mw + mh)g sin (e + a ) Xc,b = mf + mw + mh
-0.5% - 0 . 5 h cos a - 0.5(Df + Dt) sin a - FA,^^ + (mf + mw)g cos (6 + a ) 'ic,b =
mf + mw
Airplane center-of -gravity motion in gravity-axis system
zCpg= zc,b cos (8 + a ) - xC,b sin (6 + a )
Hub motion in body-axis system
'ih,b = FG,Z cos (6 + a ) + FG x sin (6 + a ) + FA,^^ + mhg cos (6 + a )
~~ ~~ . .
mh
34
APPENDM A
Hub motion in gravity-axis system
sh,g = zh,b cos (e + a) - x h b sin (e + a,)Y
Wing-mass -center motion in gravity-axis system
2w,g= xc,g + $dew sin , X c w + (3) + b2dcw cos j X c w + 8 ;
'iw,g= Zc,g + i d c w cos :~kcw + 8 ) - e- 2d,, sin (XCw + e'i
Fuselage -mass-center motion in gravity-axis system
xf,g = xc,g - Qdcf s in (Xcf + 0) - e' 2dcf cos ( X c f + e )
Wing-gear -interface motion in gravity-axis system
xwG,g = j;'c,g + edcwG sin (&cwG+ e ) + e. 2dcwG cos (XcwG + 0 )
Shock-strut motion in body-axis system
gb= zwG,g cos ( e + a ) + x w ~ , gsin (e + a ) - zh,g cos (e + a ) - xh,g s in (e + a ) - e- 2zSs
Pitch angular acceleration about airplane center of gravity
--0 .5hdct + 0.5Dfdcf + 0.5Qdct + 0 . 5 L W d c ~ , ~cos a, - 0. 5LwdCW,Zsin a,
s in a, - F ~ , ~ ~ d l- 0.5DwdCW,Zcos a, - 0 . 5 D ~ d ~ ~ , ~ + F ~ , x d 2cos ( e + a,)
e = -I- F ~ , z d 2sin ( e + a,) + Mn - ~- - 4
.* -.
IYY
3 5
I
- --
APPENDIX A
Wheel angular acceleration about hub
Brake -control sensor -mass acceleration about hub
Rigid -Fuselage -Elastic -Wing Option
The equations of motion for the rigid-fuselage -elastic -wing option in the body-axis system and the gravity-axis system are presented in this section.
Airplane center -of -gravity (composite mass center) motion in body-axis system
r0.5Lt sin a - 0.5(Df + Dt) cos CY - 0.5% + FG,X cos (e + CY) - FG,Z sin (0 + a )1i- (mf + mw + mh)g sin (e + a ) ~ ~ ~- - -Xc,b = mf + mw + mh
+ mfg cos (e + a ) - Fn cos 0Zc,b = -0.5Lt cos a - 0.5(Df + Dt) sin CY - F w ~ - . . . . .
mf
Airplane center-of -gravity motion in gravity-axis system
xc,g = xc,b cos (0 + CY)+ Zc,b sin (e + CY)
!ic,g= Zc,b cos (0 + CY) - xc,b sin (0 + CY)
Hub motion in body-axis system
+ i d c e sin Ace - i 2 d C e sin h c e
36
APPENDIX A
Pr io r to shock-strut stroking
Subsequent t o shock-strut stroking
Hub motion in gravity-axis system
Wing-mass -center motion in body-axis system
FG,X cos (0 + a ) - FG,Zsin (0 + a )
- (mf + mw + mh)g s in (0 + a ) - 0 . 5 F w ~
.. ~~ ~Xw,b =
I- 0.5(Df + Dt) cos a + 0.5Lt s in a i + &dew + 8dr-e s in Xce - d2dce COS hcemf + mw + mh
Pr io r to shock-strut stroking
cos (0 + a ) + FG,Xsin (0 + a ) + (mw + mh)g cos (0 + a )
-0.5Lw + F,B ..=w,b = rG9z
mw ~
+ “h
11 + Bdew
Subsequent to shock-strut stroking
- 0.5Lw + F,B + m,g cos (e + a )zw,b = + 6dew
mW
37
APPENDIX A
Wing-mass -center motion in gravity-axis system
xw7g= xw7b cos (0 + a)+ zw,b s in (e + a)
Zw,g = zw,b cos (0 + a) - xw,b sin (e + a)
Fuselage -mass-center motion in gravity-axis system
xf,g = xc7g - gdcf sin (Xcf + e) - h2dCf COS (Acf + e)
zf,g = zc,g - idcf COS (Xcf + 6) + d2dCf sin (Xcf + 6)
Wing-gear -interface motion in body-axis system
FA,^^ - 0.5Lw + F,B + mwg cos (8 + a) - - ~ ~ _..- _‘wC,b =
mW - + &(dew + &G)
Shock-strut motion in body-axis system
Motion of elastic axis a t spanwise location of wing mass center:
P r io r to shock -strut stroking
Subsequent to shock-strut stroking
FA,^^ - 0.5Lw + F,B + mwg cos (8 + a ) iew,b =
mW
APPENDIX A
Motion of elastic axis at spanwise location of wing mass center relative to fuselage
Rotational motion of wing about elastic axis and relative to fuselage:
P r io r to shock-strut stroking
Subsequent to shock-strut stroking
Wheel angular acceleration about hub
Brake -control-sensor acceleration about hub
Pitch angular acceleration about airplane center of gravity
1-0.5Qdg + 0.5Dfdq + 0.5Dtdq + 0.5Lwd5 cos a - 0.5Lwdg sin a1 sin (0 + a ) + Mn J
IYY
39
I
APPENDIX B
DESCRIPTION OF LANDING GEAR
The landing gear simulated in this paper was originally designed for a small a i r plane having a g ross m a s s of approximately 2268 kg (5000 lbm). (See ref. 7.) The gear is a cantilevered type with a conventional oleo-pneumatic shock strut . The tire is a 0.69-m (27-in.) diameter type I (smooth contour) which was inflated to 221 kPa (32 psi). The m a s s of the landing gear is 68 kg (150 lbm) and the unsprung m a s s i s 59 kg (131 lbm).
*2
Sketch (d)
The important geometric characterist ics of the landing-gear shock strut are illustrated in sketch (d), and the program input parameters are as follows:
Mass density of hydraulic fluid, p~ . . . . . . . . . . . 838 kg/m3 (1.626 slugs/ft3) Volume of hydraulic fluid in fully extended strut , VH . . . . -0.0014 m3 ( ~ 0 . 0 5ft3)
Wheel and t i re : Wheel flange diameter, df . . . . . . . . . . . . . . . . . . . 0.39053 m (1.28125 ft) Width of wheel r im, ww . . . . . . . . . . . . . . . . . . . . . . 0.227 m (0.745 f t ) Unloaded diameter of t ire, d . . . . . . . . . . . . . . . .0.686 m (nominal 2.25 ft) Maximum width of undeflected t i re , w . . . . . . . . . . . . . . 0.245 m (0.805 f t ) Unloaded rated inflation t i r e pressure, pr . . . . . . . . . 482.63 kPa (10 080 psf) Unloaded t i r e inflation pressure, po . . . . . . . . . . . . . 220.6 kPa (4608 psf) Pressu re - r ise parameter, K . . . . . . . . . . . . . . . . . . . . . . . . . . . 0.66 Vertical-force coefficient, C z . . . . . . . . . . . . . . . . . . . . . . . . . . . 0.02
41
REFERENCES
1. Wignot, Jack E.; Durup, Paul C.; and Gamon, Max A.: Design Formulation and Analysis
of an Active Landing Gear. Volume I. Analysis. AFFDL-TR-71-80, Vol. I, U.S. Air
Force, Aug. 1971. (Available f r o m DDC as AD 887 127L.)
2. Bender, E. K.; Berkman, E. F.; and Bieber, M.: A Feasibility Study of Active Landing
Gear. AFFDL-TR-70-126, U.S. Air Force, July 1971. (Available f rom DDC as AD 887 451L.)
3. Smiley, Robert F.; and Horne, Walter B.: Mechanical Propert ies of Pneumatic Tires With Special Reference to Modern Aircraft Tires. NASA T R R-64, 1960. (Super
sedes NACA T N 4110.)
4. Tung, C. C.; Penzien, J.; and Horonjeff, R.: The Effect of Runway Unevenness on the Dynamic Response of Supersonic Transports. NASA CR-119, 1964.
5. Batterson, Sidney A.: A Study of the Dynamics of Airplane Braking Systems as Affected by Tire Elasticity and Brake Response. NASA TN D-3081, 1965.
6. Milwitzsky, Benjamin; Lindquist, Dean C.; and Potter, Dexter M.: An Experimental
Study of Applied Ground Loads in Landing. NACA Rep. 1248, 1955. (Supersedes
NACA T N 3246.
7. Milwitzsky, Benjamin; and Cook, Franc is E.: Analysis of Landing-Gear Behavior. NACA Rep. 1154, 1953. (Supersedes NACA TN 2755.)
8. Diehl, Walter Stuart: Engineering Aerodynamics. Sixth ed. Ronald Press Co., c.1936.
9. Lynch, Urban H. D.: Takeoff and Landing Analysis (TOLA) Computer Program. Part 1: Capabilities of the Takeoff and Landing Analysis Computer Program. AFFDL-TR-71-155, Pt. 1, U.S. Air Force, Feb. 1972. (Available form DDC as AD 741 942.)
42
loads induced / A loads
Input loads fo r total
response analysis
'eedback
Airframe response, , -
Flexible airframe
0 Modal frequencies
0 Modal displacements
Perturbation .loads
~~
Operational loads
0 Steering 0 Thrust reversal
and braking 0 Aerodynamic 0 Asymmetric
impact
Shock strut
-Tire
Figure 1.- Variables considered significant for analyzing active control landing gear systems.
Series-pneumatic control
Parallel-hydraulic control
Serie s-hy d rau1ic cont ro1
mSensor
Electronic /e=l-J
Figure 2.- Active control concepts for airplane landing gears.
X Y (into paper)
Body axes Gravity axes
Shock- s t rut
FG, Zl
Figure 3. - Definition of axes and forces for rigid-airframe option.
----
Yb(into paper) Y
g(into paper)
zg
Body axes Gravity axes
Motion due to first wingShock-strut bending and torsion
Figure 4.- Definition of axes and forces for rigid-fuselage --elastic-wing option.
(a) Passive gear phase. Compressing with wing force less than limit force.
1 1 1 Fluid motion
Pressure force
Direction of motion
t t t t
A2
S- 1 A1
*1
(b) Active gear phase. Low- (c) Active gear phase. High-pressure operation; compress - pressure operation; extending; ing; wing force greater than wing force less than limit force. limit force.
Figure 5. - Operational phases of series-hydraulic active control gear.
Yb(into paper) Y (into paper)
"T;'
Figure 6. - Rigid-airframe configuration used for study, (Dimensions a r e not to scale.) I
32 0 Experiment (ref. 7) - .7 - 7 103
-TOLA
28
24
20
16 c
-6
- 5
-' Strut
stroke, ft
Strut force,
kN
4 Strut force,
Ibf
- 3
- 2
- 1
- 0
Time, sec
(a) Time histories of shock-strut force and stroke.
Figure 7.- Comparison of computed results obtained from ACOLAG and TOLA with experimental data for a vertical drop onto a flat stationary surface. 8 = Oo; iC,,= 2.7 m/sec (8.8 ft/sec); kc,, = 0 m/sec (0 ft/sec).
32 0 Experiment ( re f . 7) .7 I x lo3 -TOLA -.20 - --- -ACOLAG
28 .6 6
24 .16
20
Vert ical ground force 16
pe r gear ,
12 L-
I 8 r
I
4 1
0
i .5 5
~
- .2 - 2
- .I - 1
I I I I 0 - 0 0 .05 .10 .15 2 0 .25
T ime , sec
(b) Time histories of vertical ground force and t i r e deflection.
Figure 7. - Continued.
- - - - - -3 .5
-3 .0
-2 .5
-2.0 Mass-center acceleration,
g u n i t s
-1.5
-1.0
- .5
0
0 Experiment (ref. 7) TOLA ACOLAG
Tinre, sec
(c) Time histories of mass-center acceleration.
Figure 7. - Concluded.
-2 I I I I I
Figure 8. - Comparison of computed results from ACOLAG and TOLA for landing-impact simulation. 0 = 10.5O; kc,, = 2.7 m/sec (8.8 ft/sec); kc,, = 45.7 m/sec (150 ft/sec).
28
32 - -TOLA - .I I x lo3
- _ _ - - ACOLAG .20
rForce6
24 - .16 5
20 4
Main gear Main gear 16 - strut force, s t ru t force, Ibf
liN 3
12
2
1
0
Time, sec
(b) Time histories of shock-strut force and stroke.
Figure 8. - Continued.
cn w
32
28
24
20
Vert ical 16 ground force
pe r gear , kN
li
t
1
(
.20
.16
.12
- T i r e deflection p e r gear ,
me te r s
.OI
.oi
(
6
5
4 Vert ical
ground force p e r gear ,
lbf 3
2
- 1
- 0I I 1 I .05 .10 .15 .20 2 5
Time, s e c
(c) Time histories of vertical ground force and t i re deflection.
Figure 8. - Continued.
I
---- -3 .0
-2.5
-
-
TOLA ACOLAG
I I I I I 0 .05 .10 .15 2.0 .25
Time, sec
(d) Time histories of mass-center acceleration.
Figure 8. - Concluded.
.5
- - - - 32 Active gear
Passive g e a r
- 5j6 ,I
Wing wing force, 16L -I4 force,
kN I lbf
I - 3 I
12 c I
, -I 2 8 L
4 L - 1 I
- 0
Wing displacement, meters
32
.2c
28
24 .16
20
.12
Strut 16 ' Strut force stroke,
per gear, meters kN
12 .OE
8
.04
4
C a
-Active gear ---- Passive gear
Control flow rate, Control flow rate, -428 l /min (-113gal/min) - 4 5 8 l /min (+121galjmin)
Time, sec
(b) Time histories of shock-strut force and stroke.
Figure 9. - Continued.
.7 - I x io3
6 - 6
5 -I 5
4 - 4 Strut Strut force
ft per gear,.
lbf .3 -3
.2 12
.1 1
0 0 5
32
28
24
20 Vertical groucd force
per gear , kN
12
8
4
0
I
.6
-5
.4 T i r e deflect ic pe r geai
ft
.3
.2
.1
0 )
T x 103
5
3
4 Vertical ground force
per gear, lbf
2
1
0
Time, sec
(c) Time histories of vertical ground force and tire deflection.
Figure 9. - Concluded.
-36-401-
-Active gear Passive gear ----
-9 x lo3
-8
; A i r
I I; ‘ I I 1 36 %reduction
-7
Tolerance I
I I
‘ I in wing force I
I I
I I I I
-6
I I -5
Wing force, lbf
5 %increase in -4
- I wing displacement
-3
-2
-1
I I I I I I 0 .04 .08 .12 .16 .20 .24 .28 0
Wing displacement, iiieters
I I I I I I I I I I I 0 .1 .2 . 3 .4 .5 .6 .7 .8 .9 1.0
Wing displacement, f t
(a) Wing force as a function of wing displacement. i
Figure 10.- Comparison of computed results for modified passive and active gears for a vertical drop onto !
a vertically oscillating surface. 8 = 00., z c,g = 2.7 m/sec (8.8 ft /sec); xc,g = 0 m/sec (0 ft/sec).
Q,0
40 -Active gear ---- Passive gea r
36 .24
32
2 0 28
24 .16
Strut 20 - Strut Strut
fo rce force per p e r gear, stroke, gear, Ibf
me te r s .12 kN 16
12 .08
8
.04
4
0 0
(b) Time histories of shock-strut force and stroke.
Figure 10. - Continued.
.28 -40 - - .9 - -9 x lo3-Active gear
---- Passive gear
-36 .24 - - .8 - -8
-32 .20
-28
-24 .16 Vertical T i r e ground deflection force -20 per gear,
per gear. meters kN .12
-16
-12 .08
-8
.04
-4
0 0
,’;-\
‘\
- .I - -7
- .6 * -6
.5 Tire -5 Vertical
deflectic ground force
per gea: per gear,.4 f t -4 Ibf
.3 -3
.2 -2
.I -1
0 0
Time, sec
(c) Time histories of vertical ground force and t i re deflection.
Figure 10. - Concluded.
-36
Q, N
-32 ‘c !
Wing force, kN
I I 0 .1
-9 lo3 -Active gea r -- -- Passive gea r
-8J -7
Wing displacement, me te r s
I I .2 I .3I .4 .5I .6I .II .8I .9I 1.0
Wing displacement, ft
(a) Wing force as a function of wing displacement.
Figure 11.- Comparison of computed results for modified passive and active gears for a landing impact onto a smooth runway surface. 0 = 10.50; kc,, = 2.7 m/sec (8.8 ft/sec); kc,g = 45.7 m/sec (150 ft/sec).
i
- - - - 36“1 .24
Control flow rate, -360 Q/min (-95 gal/nim)
S tNt force per gear, kN
Active gea r Passiv.e gea r
Control flow rate, 4 4 7 I/min (+118gal/niin)
1 - Control flow rate, -397 U m i n (-105gal/min)
Strut force per
stroke, gear, Ibf
(b) Time histories of shock-strut force and stroke.
Figure 11.- Continued.
----
--40
-36
-32
-28
-24
- Passive gear .24
--2.0
- .6
Vertical ground
force per gear , !04
-
- .16
(c) Time histories of vertical ground force and t i re deflection.
Figure 11.- Continued.
8
I
- 6
----
-20 -500 - -Control flow rate - 6 x IO-' --12 X 10
Control flow
.30 L 1 I I I 1.15 2 0 .25
0 .05 'lo Time, sec
Figure 12. - Time histories of control flow rate and control flow for landing impact of .active gear onto runway surface. 0 = 10.50; zc,g = 2.7 m/sec (8.8 ft/sec); xc,, = 45.7 m/sec (150 ft/sec).
-8
-4
0
Control 4 flow rate,
gal/min
8
12
16
20
a smooth
-----
-32
-24
-20 -
-12 i-I
I
I - 4 tI /
I I
I
I
Active gea r Passive gea r 1
7 x lo3
4 5
Wing force, lbf
-' 3
- 2
- 1
I I I I I I I -0 .04 .08 .12 .16 .20 .24 .28 0
Wing displacement, me te r s
L I I I I I I I I I I 0 .1 .2 .3 .4 .5 .6 .7 .8 .9 1.0
Wing displacement, ft
(a) Wing force as a function of wing displacement.
Figure 13. - Comparison of computed results for modified passive and active gears for a landing impact onto a sinusoidal runway surface. 0 = 10.5O; iC,,= 2.7 m/sec (8.8 ft /sec); xc tg = 45.7 m/sec (150 ft/sec).
40 r Active gear _- - - - - Passive gear I
36 1 .24 r Control flow rate, -
.1154 ( min (-305 gal, m n ) - Tire bounce I
Strut Strut
gear, kN meters
12 I- .08
.04
4
06I0 Time, sec
(b) Time histories of shock-strut force and stroke.
Figure 13.- Continued.
.28
.24
.2(
Active gear
I I
--28 - .6 -8 6
-1 .5 - 5! T i r e Vertical
deflection ground per gear, I force per
-4 f t -: 4 gear, Ibf
- 3i.3
- .2 - 2
- 1
-0
-24 .16 - \ \ \ \ \ \
Vertical T i re ground deflection force -20 r p e r gear ,
per gear, meters kN .12 -
-16 +
-12
--8
-4 -I-
O
(c) Time histories of vertical ground force and t i re deflection.
Figure 13. - Concluded.
- -1.00 lo3
- -.75
- -.50
- -.25
- 0
Wing force, lbf
- .25
-4 -
-Active gear _ -- - Passive gear
-I I .50 I l l I
.75
1.00
1 I I I I I
1.250 .5 1.0 Time, sec 1.5 2.0 2.5
(a) Time histories of wing force.
Figure 14. - Comparison of computed results for active and passive gears for a landing roll-out after traversing a vertically discontinuous bump. f3 = 00; zc,g = 0 m/sec (0 ft/sec); Xc,, = 44.5 m/sec (146 ft/sec).
WASHINGTON. D.C. 20546 P O S T A G E A N D FEES P A I D N A T I O N A L AERONAUTICS A N D
OFFICIAL BUSINESS SPACE A DM IN l S T R A T l O N PENALTY FOR PRIVATE USE $300 SPECIAL FOURTH-CLASS RATE 451
U S M A I L BOOK
2 3 8 001 C 1 U A 76012.3 S 0 0 9 0 3 D S D E P T OF T H E A I R Fl-iRCf AF I.;’E4PUNS L A d O R A T O R Y ATTN: T E C H N I C A L L I B R A R Y St lL 1 K I R T L A N O AFB NM 8 3 1 1 7
POSTMAgTIR If Undeliverable (Section 158 Post;il Rfnniinl) Do N o t Return
‘‘Theaeronautical and spate activitiqs of the United States shall be conducted so as t o contribute . . . t j the expamion of human knowledge of phenomena in the atmosphere and space. T h e Administratio% shall provide for the wzdest practicable and appropriate dissemimtion of information concerning its activities and the results thereof.”
-NATIONALAERONAUTICSAND SPACE ACT OF 1958.
NASA SCIENTIFIC AND TbCHNICAE PUBLICATIONS TECHNICAL REPORTS: Scientific and technical information considered important, complete, and a lasting contribution to existing knowledge.
TECHNICAL NOTES: Information less broad in scope but nevertheless of importance as a contribution to existing knowledge.
TECHNICAL MEMORANDUMS : Inforpation ,re$eiving limited distribution because of preliminary data, security classification, or other reasons. Also includes conference proceedings with either limited or unlimited distribution. -CONTRACTOR REPORTS: Scientific and technical information generated under a NASA contract or grant and considered an important contribution to existing knowledge.
TECHNICAL TRANSLATIONS: Information published in a foreign language considered to merit NASA distribution in English.
SPECIAL PUBLICATIONS: Information derived from or of value to NASA activities. Publications include final reports of major projects, monographs, data compilations, handbooks, sourcebooks, and special bibliographies.
TECHNOLOGY UTILIZATION PUBLICATIONS: Information on technology used by NASA that may be of particular interest in commercial and other-non-aerospace applications. Publications include Tech Briefs, Technology Utilization Reports and Technology Surveys.
Details on the availability of these publications may be obtuined from:
SCIENTIFIC AND TECHNICAL INFORMATION OFFICE
N A T I O N A L A E R O N A U T I C S A N D SPACE A D M I N I S T R A T I O N Washington, D.C. 20546