University of Nebraska C i St ti ti l Department of Statistics Comparing Statistical Interval Estimates Michelle Quinlan 1 James Schwenke 2 Walt Stroup 1 Interval Estimates Michelle Quinlan , James Schwenke , Walt Stroup 1 University of Nebraska-Lincoln 2 Boehringer Ingelheim Pharmaceuticals, Inc.
Transcript
University of Nebraska
C i St ti ti l
Department of Statistics
Comparing Statistical Interval Estimates
Michelle Quinlan1 James Schwenke2 Walt Stroup1
Interval EstimatesMichelle Quinlan , James Schwenke , Walt Stroup
1University of Nebraska-Lincoln2Boehringer Ingelheim Pharmaceuticals, Inc.
Stability Shelf Life Working Group
Product Quality Research Institute (PQRI) Stability Shelf Life Working Group (SSL WG) was formed in 2006 g p ( )Members include statistical and pharmaceutical scientists from industry and academiaObjectives include:
Investigate statistical methods for estimating shelf life consistent with Quality by Design (QbD)Assess alternative methods for estimating shelf life Enhance safety/efficacy of pharmaceutical products through accurate estimation of shelf life
Shelf Life Estimation
What is shelf life?P i t h i t l ti t fi t i t t ifi tiPoint where interval estimate first intersects specification limit for stability limiting characteristicICH Q1E guidelines focus on 95% confidence interval forICH Q1E guidelines focus on 95% confidence interval for mean to estimate shelf life
Specification limits also define bounds for future batches to confirm a product's shelf lifeOther interval estimates being used to estimate shelf life i l d di ti d t l i t linclude prediction and tolerance intervals This presentation is a summary of continuing research conducted to investigate the appropriate use of various intervalconducted to investigate the appropriate use of various interval estimates in the estimation of shelf life
Outline
Comparing interval estimatesWhat is a tolerance interval?What is a tolerance interval?Other interval estimates
Evaluation of interval estimatesEvaluation of interval estimatesPrediction intervals vs. β-expectation tolerance intervalsβ-expectation vs β-content tolerance intervalsβ expectation vs. β content tolerance intervals
Simulation results Characteristics of interval estimatesCharacteristics of interval estimatesAppropriate use of intervals in various situationsConclusionsConclusions
Comparing Interval Estimates
Statistical interval estimates are constructed toEstimate parametersEstimate parametersQuantify characteristics of population
To correctly interpret estimates it must be clearly defined whatTo correctly interpret estimates, it must be clearly defined what each interval is estimating
Confidence/prediction intervals are well understoodpDefinition of a tolerance interval varies among literature sources
What is a Tolerance Interval?
Tolerance intervals are being used with more frequency, thus a consistent definition needs to be establishedDefinitions found in literature:
A bound that covers at least (100-α)% of the measurements ( )with (100-γ)% confidence (Walpole and Myers)
o Focuses on where individual observations fall
o Equivalent to a (100-γ)% CI on middle (100-α)% of Normal distribution
An interval that includes a certain percentage of measurements with a known probability (Mendenhall andmeasurements with a known probability (Mendenhall and Sincich)
o TI is identical to CI, except it attempts to capture a proportion of t th th l ti t hmeasurements rather than a population parameter, such as μ
What is a Tolerance Interval?
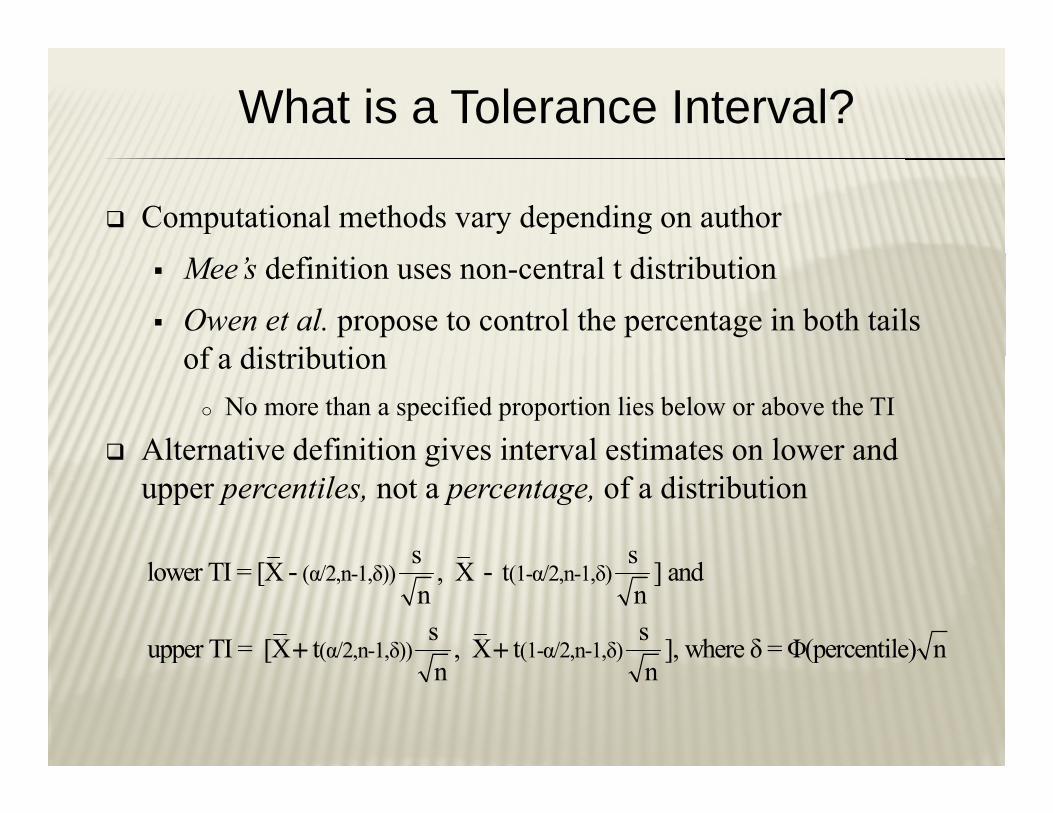
Computational methods vary depending on authorMee’s definition uses non-central t distribution Owen et al. propose to control the percentage in both tails of a distributionof a distribution
o No more than a specified proportion lies below or above the TI
Alternative definition gives interval estimates on lower andAlternative definition gives interval estimates on lower and upper percentiles, not a percentage, of a distribution
s s(α/2,n-1,δ)) (1-α/2,n-1,δ)
(α/2,n-1,δ)) (1-α/2,n-1,δ)
s slower TI = [X , X t ] and n ns supper TI = [X t , X t ], where δ = Φ(percentile) n
- -
+ +pp (p )n n
Other Interval Estimates
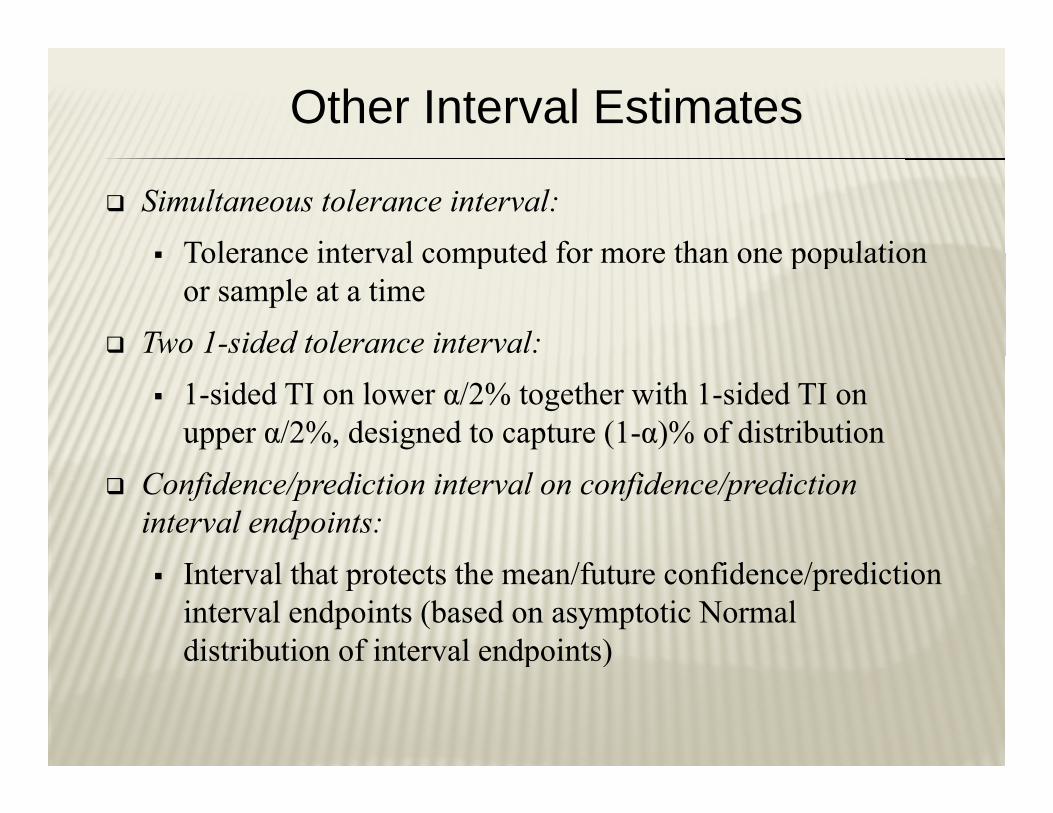
Simultaneous tolerance interval:Tolerance interval computed for more than one populationTolerance interval computed for more than one population or sample at a time
Two 1-sided tolerance interval:1-sided TI on lower α/2% together with 1-sided TI on upper α/2%, designed to capture (1-α)% of distribution
Confidence/prediction interval on confidence/prediction interval endpoints:
Interval that protects the mean/future confidence/prediction interval endpoints (based on asymptotic Normal distribution of interval endpoints)p )
Other Interval Estimates
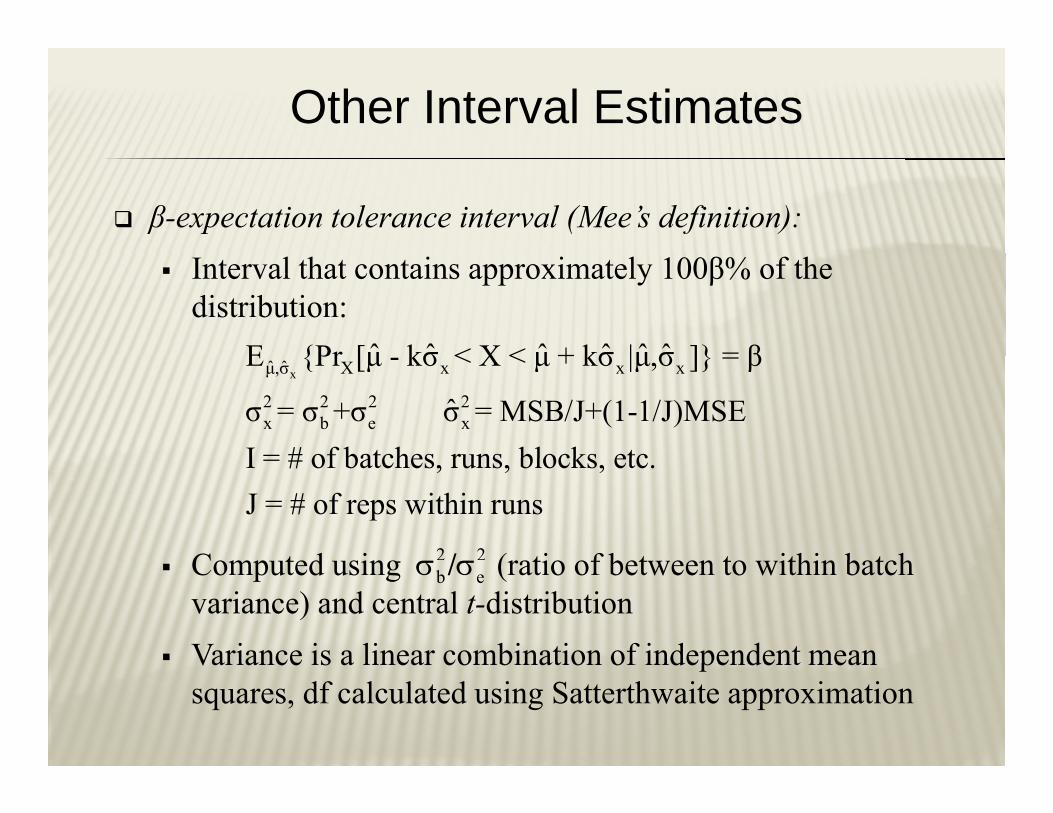
β-expectation tolerance interval (Mee’s definition):Interval that contains approximately 100β% of the distribution:
ˆ ˆ ˆ ˆ ˆ ˆE {Pr [μ kσ < X < μ + kσ |μ σ ]} = βxˆ ˆμ,σ X x x x
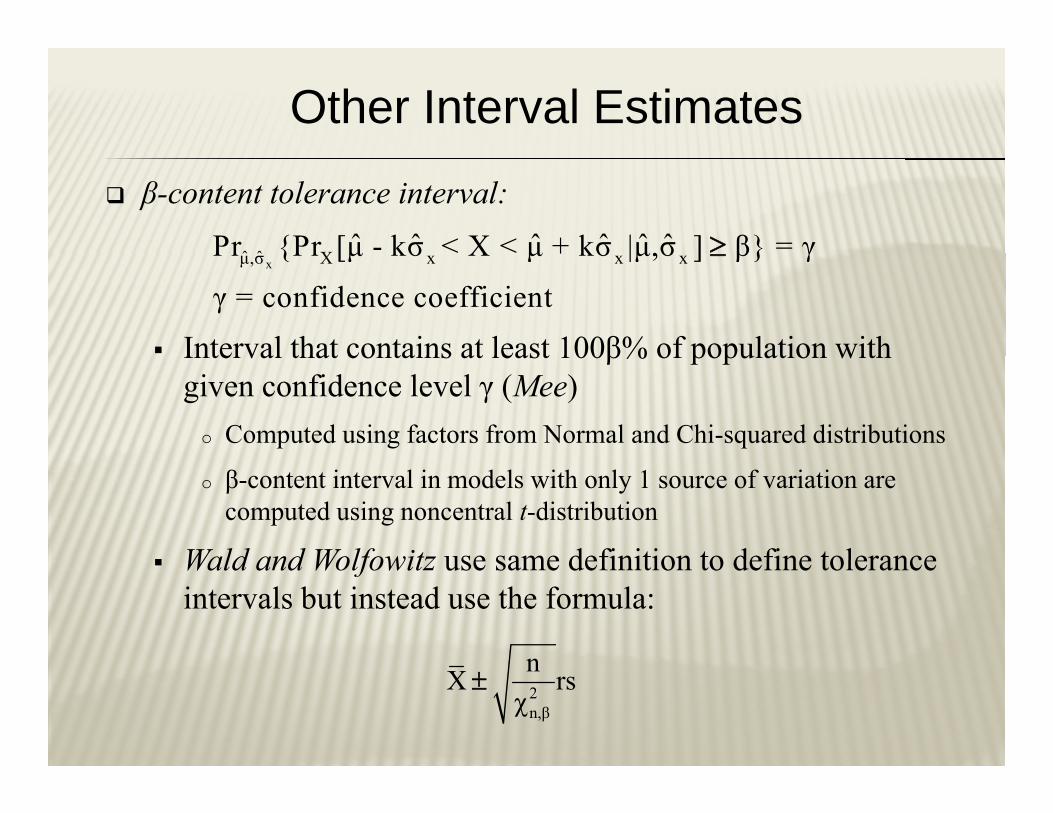
Interval that contains at least 100β% of population with
xˆ ˆμ,σ X x x xPr {Pr [μ kσ < X < μ + kσ |μ,σ ] β} γ
γ = confidence coefficient
≥
Interval that contains at least 100β% of population with given confidence level γ (Mee)
o Computed using factors from Normal and Chi-squared distributions
o β-content interval in models with only 1 source of variation are computed using noncentral t-distribution
Wald and Wolfowitz use same definition to define toleranceWald and Wolfowitz use same definition to define tolerance intervals but instead use the formula:
n2n,β
nX rsχ
±
Other Interval Estimates
SAS® Proc Capabilities Method 3 computes an approximate statistical tolerance interval that contains at least p proportionstatistical tolerance interval that contains at least p proportion of the population with formula given by:
11 2
α2 (n - 1)
n -1X z (1 1/2n) sχ+± +p
Patel states 1-sided tolerance limits are directly related to 1-sided confidence limits on percentiles
Formulas are provided for constructing TI when one or both μ and σ are unknown
Evaluation of Interval Estimates
The relationship among prediction, β-expectation, and β content intervals is investigatedβ-content intervals is investigated
Prediction intervals are compared with β expectationPrediction intervals are compared with β-expectation intervals for models with 1 variance component (all factors fixed)
β-expectation intervals are compared with β-content β p p βintervals
Prediction Intervals vs. β-expectation Tolerance Intervals
1 variance component
Tolerance Intervals
β-expectation interval equals prediction interval for both ll d ( dl f hoverall mean and treatment means (regardless of the
number of factors in model)o Here = 0 because = 02 2/σ σ 2σo Here 0 because 0
o No df adjustment needed b e/σ σ bσ
Formula for β-expectation interval reduces to formula for prediction interval
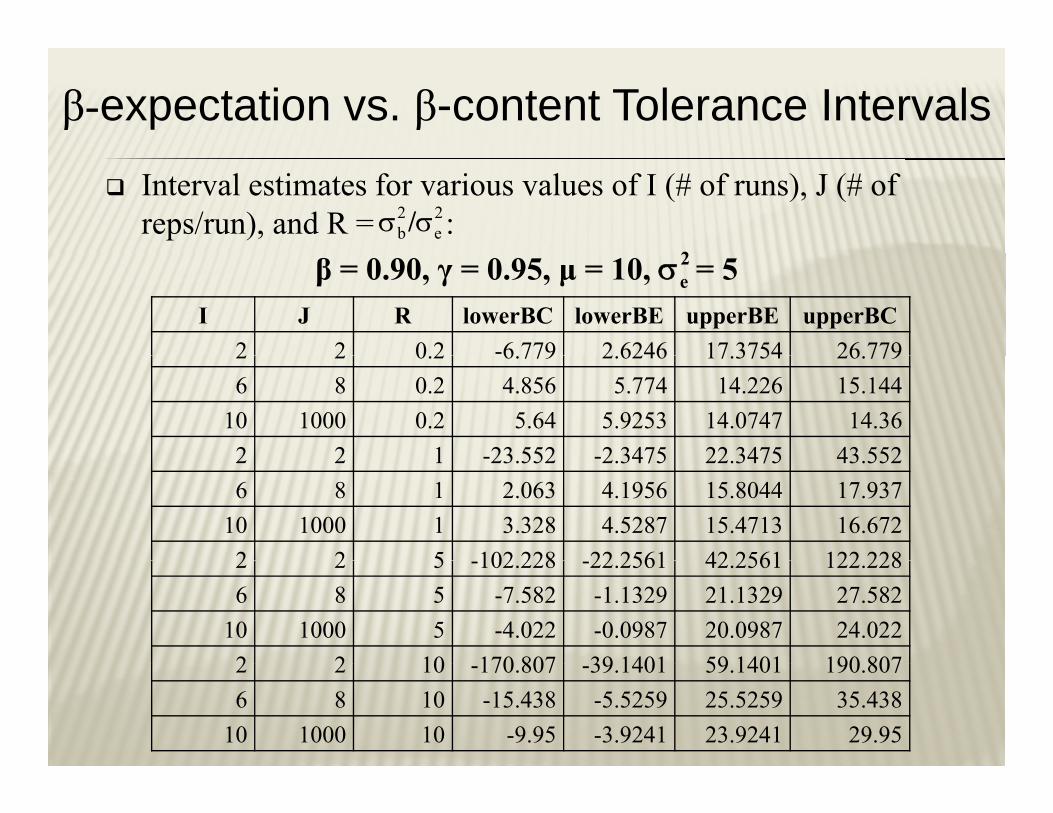
β-expectation vs. β-content Tolerance IntervalsInterval estimates for various values of I (# of runs), J (# of reps/run), and R = :2 2
b e/σ σ2β = 0.90, γ = 0.95, μ = 10, = 5
I J R lowerBC lowerBE upperBE upperBC2 2 0 2 -6 779 2 6246 17 3754 26 779
To understand tolerance intervals and their relationship among other interval estimates for one sample with one variance pcomponent, a computer simulation was conducted
50 iterations with data sets of size 50 Observations were randomly generated, various interval estimates were constructed and comparedThe mean of each interval estimate across iterations is computed Comparisons are made among the interval estimatesComparisons are made among the interval estimates
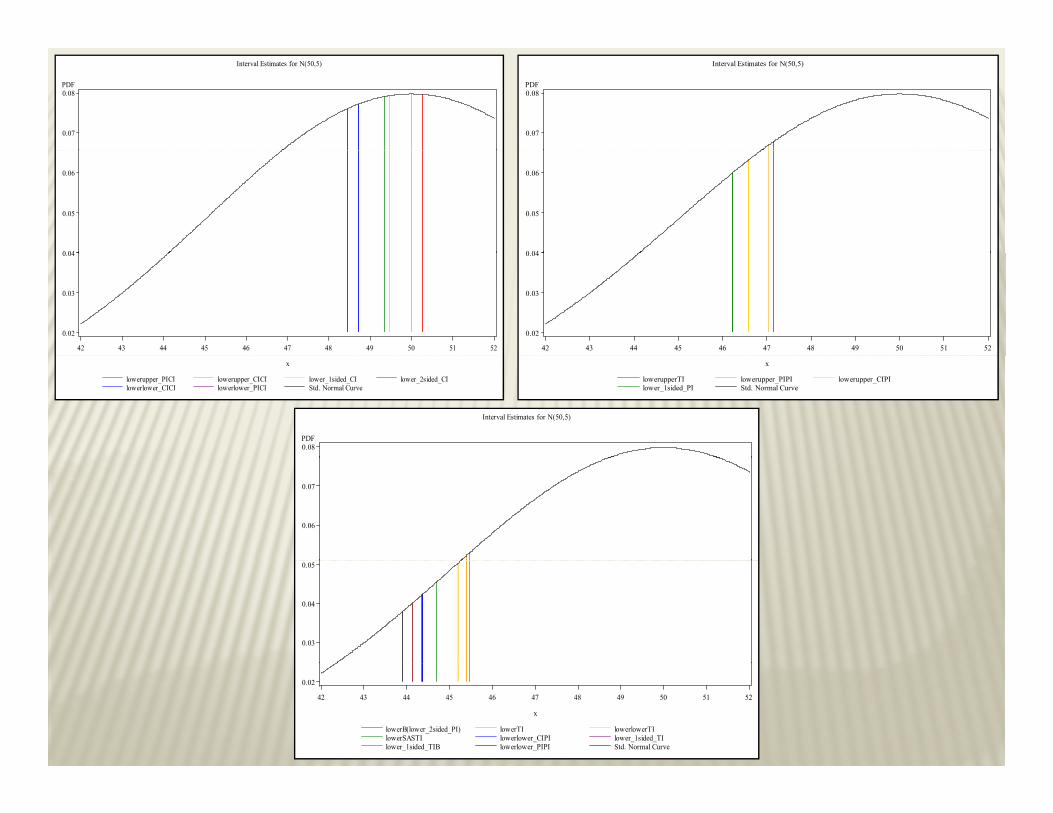
Comparing Interval EstimatesInterval Estimates for N(50,5)
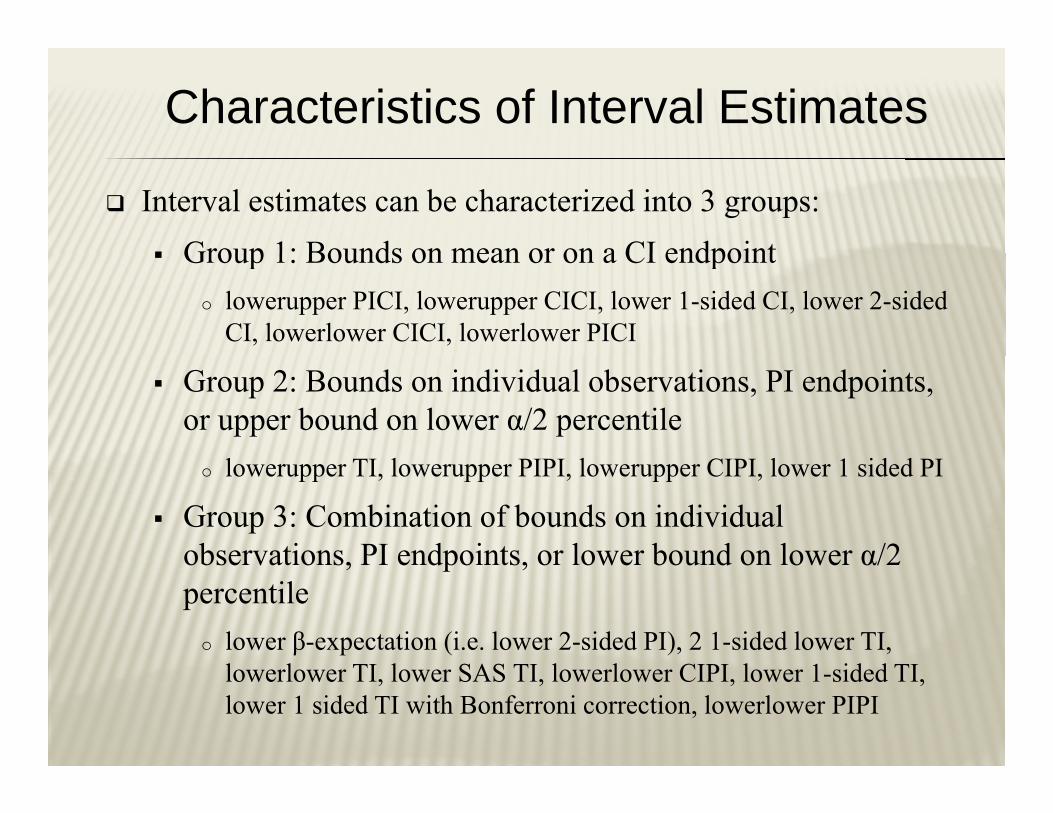
Group 2: Bounds on individual observations, PI endpoints, or upper bound on lower α/2 percentile
l l l l id do lowerupper TI, lowerupper PIPI, lowerupper CIPI, lower 1 sided PI
Group 3: Combination of bounds on individual observations PI endpoints or lower bound on lower α/2observations, PI endpoints, or lower bound on lower α/2 percentile
o lower β-expectation (i.e. lower 2-sided PI), 2 1-sided lower TI, lowerlower TI, lower SAS TI, lowerlower CIPI, lower 1-sided TI, lower 1 sided TI with Bonferroni correction, lowerlower PIPI
Conclusions
Current literature sources offer a wide variety of definitions for tolerance intervalsPrediction intervals equal β-expectation tolerance intervals for models with 1 variance componentβ-content intervals TI are wider than β-expectation TI1-sided TI is directly related to a 2-sided TI on percentileSimulation results indicate
Interval estimates can be characterized into 3 groupsIt must be determined the correct parameter of interest to be captured to determine which estimate to use
ReferencesBoulanger, B., V. Devanaryan, W. Dewé, and W. Smith. “Statistical Considerations in Analytical Method Validation.” SAS book on pre-clinical StatisticsStatistics.Kuik, D.J., H.J. Ader, and P.D. Bezemer. “Sample Size Computations for Tolerance Region Estimation.” Proceedings of the Conference CompStat 2002 Short Communications and Posters2002 Short Communications and Posters.Mee, R.W. “β-Expectation and β-Content Tolerance Limits for Balanced One-Way ANOVA Random Model.” Technometrics. Aug. 1984, Vol. 26, No 3No. 3.Mee, R.W. “Estimation of the Percentage of a Normal Distribution Lying Outside a Specified Interval.” Commun. Statist.-Theor. Meth., 17(5), 1465-1479 (1988)1479 (1988).Mee, R.W., and D.B. Owen. “Improved Factors for One-Sided Tolerance Limits for Balanced One-Way ANOVA Random Model.” Journal of the American Statistical Association Dec 1983 Vol 78 No 384American Statistical Association. Dec. 1983, Vol. 78, No. 384.Mee, R.W. “Simultaneous Tolerance Intervals for Normal Populations With Common Variance.” Technometrics. Feb. 1990, Vol. 32, No. 1.
References
Mendenhall, W. and T. Sincich. Statistics for Engineering and the Sciences. 4th Ed. New Jersey: Prentice-Hall, 1995.“Methods for Computing Statistical Intervals.” SAS Institute Inc. 2004. SAS OnlineDoc® 9.1.3. Cary, NC: SAS Institute Inc. Odeh, R.E., Youn-Min Chou, and D.B. Owen. “Sample-Size Determination for Two-Sided Expectation Tolerance Intervals for a Normal Distribution.” Technometrics. Nov. 1989, Vol. 31, No. 4. Odeh, R.E. and D.B. Owen. Tables for Normal Tolerance Limits, Sampling Plans and Screening. New York: Marcel Dekker Inc., 1980. Owen, D.B. “Control of Percentages in Both Tails of the Normal Distribution.” Technometrics. Nov. 1964, Vol. 6, No. 4.Patel, J.K. “Tolerance Limits – A Review.” Commun. Statist.-Theor. Meth., 15(9), 2719-2762 (1986).Rao, J.N.K., K. Subrahmaniam, and D.B. Owen. “Effect of Non-Normality , , , yon Tolerance Limits Which Control Percentages in Both Tails of Normal Distribution.” Technometrics. Aug. 1972, Vol. 14, No. 3.
References
Satterthwaite, F.E. “An Approximation Distribution of Estimates of Variance Components.” Biometrics Bulletin. Dec. 1946, Vol. 2, No. 6.Wald, A. and J. Wolfowitz. “Tolerance Limits for a Normal Distribution.” The Annuals of Mathematical Statistics. 1946, Vol. 17, No. 2.Walpole, R.E. and R.H. Myers. Probability and Statistics for Engineers and Scientists. 5th Ed. New York: Macmillan, 1993.Weissberg, A. and G.H. Beatty. “Tables of Tolerance-Limit Factors for Normal Distributions.” Technometrics. Nov. 1960, Vol. 2, No. 4. Wroughton, Jacqueline. “Techniques and Applications of Interval Estimation.” PhD dissertation, 2007.
Acknowledgements
This research is funded through theThis research is funded through the
PQRI Stability Shelf Life Working GroupQ y g p
PQRI is the Product Quality Research Institute, Arlington, Virginia
PQRI Stability Shelf Life Working Group
Suntara Cahya Eli Lilly and CompanyDavid Christopher Schering Plough Research InstitutePatrick Forenzo Novartis Pharmaceuticals CorporationMichael Golden Pearl TherapeuticsAbhay Gupta FDA / CDERAbhay Gupta FDA / CDERPaula Hudson Eli Lilly and CompanySvetlana Lyapustina Drinker Biddle & Reath LLPN P V Ph i l INate Patterson Vertex Pharmaceuticals, Inc.Michelle Quinlan University of Nebraska-LincolnDennis Sandell Siegfried Pharma DevelopmentJames Schwenke Boehringer Ingelheim Pharmaceuticals, Inc.Walt Stroup University of Nebraska-LincolnDave Thomas Johnson & JohnsonDave Thomas Johnson & JohnsonTerry Tougas Boehringer Ingelheim Pharmaceuticals, Inc.