IIE Transactions (2014) 46, 728–741 Copyright C “IIE” ISSN: 0740-817X print / 1545-8830 online DOI: 10.1080/0740817X.2013.855846 Minimizing mortality in a mass casualty event: fluid networks in support of modeling and staffing IZACK COHEN ∗ , AVISHAI MANDELBAUM and NOA ZYCHLINSKI Technion, Industrial Engineering and Management, Haifa, Israel E-mail: [email protected]Received November 2012 and accepted August 2013 The demand for medical treatment of casualties in mass casualty events (MCEs) exceeds resource supply. A key requirement in the management of such tragic but frequent events is thus the efficient allocation of scarce resources. This article develops a mathematical fluid model that captures the operational performance of a hospital during an MCE. The problem is how to allocate the surgeons—the scarcest of resources—between two treatment stations in order to minimize mortality. A focus is placed on casualties in need of immediate care. To this end, optimization problems are developed that are solved by combining theory with numerical analysis. This approach yields structural results that create optimal or near-optimal resource allocation policies. The results give rise to two types of policies, one that prioritizes a single treatment station throughout the MCE and a second policy in which the allocation priority changes. The approach can be implemented when preparing for MCEs and also during their real-time management when future decisions are based on current available information. The results of experiments, based on the outline of real MCEs, demonstrate that the proposed approach provides decision support tools, which are both useful and implementable. Keywords: Mass casualty events, fluid models, resource allocation, optimal policy 1. Introduction Mass Casualty Events (MCEs) occur quickly and sud- denly. They produce a relatively large number of casual- ties who need immediate care and thus overwhelm hospital resources. They frequently occur due to terror attacks, ac- cidents, or natural disasters. For example, on the morning of July 7, 2005, terrorists launched a series of attacks across London that left 56 people dead and 775 injured (Aylwin et al ., 2006); a Buenos Aires train crashed in 2012, resulting in more than 700 injuries (BBC News, 2012); and our part- ner hospital has, unfortunately, gathered ample experience in catering to MCEs after terror events—an experience that will guide us later on in our examples. The environment of an Emergency Department (ED) in a hospital during an MCE is stressful. People run around frantically, casualties’ cries emanate from the treatment rooms, and worried relatives hope for encouraging news. During this time it is imperative to deliberately manage the event and make, as far as possible, the right clinical and operational decisions. Figure 1 illustrates the flow of ca- sualties through a hospital after an MCE. (Our showpiece ∗ Corresponding author Color versions of one or more of the figures in the article can be found online at www.tandfonline.com/uiie. for this article is a large Israeli hospital that has become experienced in handling emergencies; our modeling frame- work nevertheless is general and can be easily modified to accommodate other hospitals.) On arrival, casualties are triaged and prioritized for treat- ment according to their medical situation (Mehta, 2006). There are several triage systems that distinguish between several classes of casualties (e.g., Lerner et al . (2008)). Our hospital uses a simple in-hospital triage system that classi- fies arriving casualties according to one of two categories: Immediate or Not Immediate. We focus on the former cat- egory: it concerns casualties who are in danger of dying unless provided with prompt medical treatment; this en- tails stabilizing life-saving treatment and for some also an immediate operation, which underscores the significance of appropriately managing medical resources. After an MCE, there is a mounting demand for medical treatment, typically far in excess of the existing capacity to administer it. Consequently, the medical staff, and es- pecially the surgeons who are most frequently the bottle- neck resource (Hirshberg et al ., 1999; Einav et al ., 2006), cannot provide prompt treatment to all casualties. Casu- alties classified as Immediates are prioritized for prompt treatment. However, it may turn out to be impossible to attend promptly to all the Immediates; therefore, the main objective of MCE management is to minimize their mortality. 0740-817X C 2014 “IIE”
Minimizing mortality in a mass casualty event:fluid networks in support of modeling and staffing
IZACK COHEN∗, AVISHAI MANDELBAUM and NOA ZYCHLINSKI
Technion, Industrial Engineering and Management, Haifa, IsraelE-mail: [email protected]
Received November 2012 and accepted August 2013
The demand for medical treatment of casualties in mass casualty events (MCEs) exceeds resource supply. A key requirementin the management of such tragic but frequent events is thus the efficient allocation of scarce resources. This article develops amathematical fluid model that captures the operational performance of a hospital during an MCE. The problem is how to allocate thesurgeons—the scarcest of resources—between two treatment stations in order to minimize mortality. A focus is placed on casualtiesin need of immediate care. To this end, optimization problems are developed that are solved by combining theory with numericalanalysis. This approach yields structural results that create optimal or near-optimal resource allocation policies. The results giverise to two types of policies, one that prioritizes a single treatment station throughout the MCE and a second policy in which theallocation priority changes. The approach can be implemented when preparing for MCEs and also during their real-time managementwhen future decisions are based on current available information. The results of experiments, based on the outline of real MCEs,demonstrate that the proposed approach provides decision support tools, which are both useful and implementable.
Keywords: Mass casualty events, fluid models, resource allocation, optimal policy
1. Introduction
Mass Casualty Events (MCEs) occur quickly and sud-denly. They produce a relatively large number of casual-ties who need immediate care and thus overwhelm hospitalresources. They frequently occur due to terror attacks, ac-cidents, or natural disasters. For example, on the morningof July 7, 2005, terrorists launched a series of attacks acrossLondon that left 56 people dead and 775 injured (Aylwinet al., 2006); a Buenos Aires train crashed in 2012, resultingin more than 700 injuries (BBC News, 2012); and our part-ner hospital has, unfortunately, gathered ample experiencein catering to MCEs after terror events—an experience thatwill guide us later on in our examples.
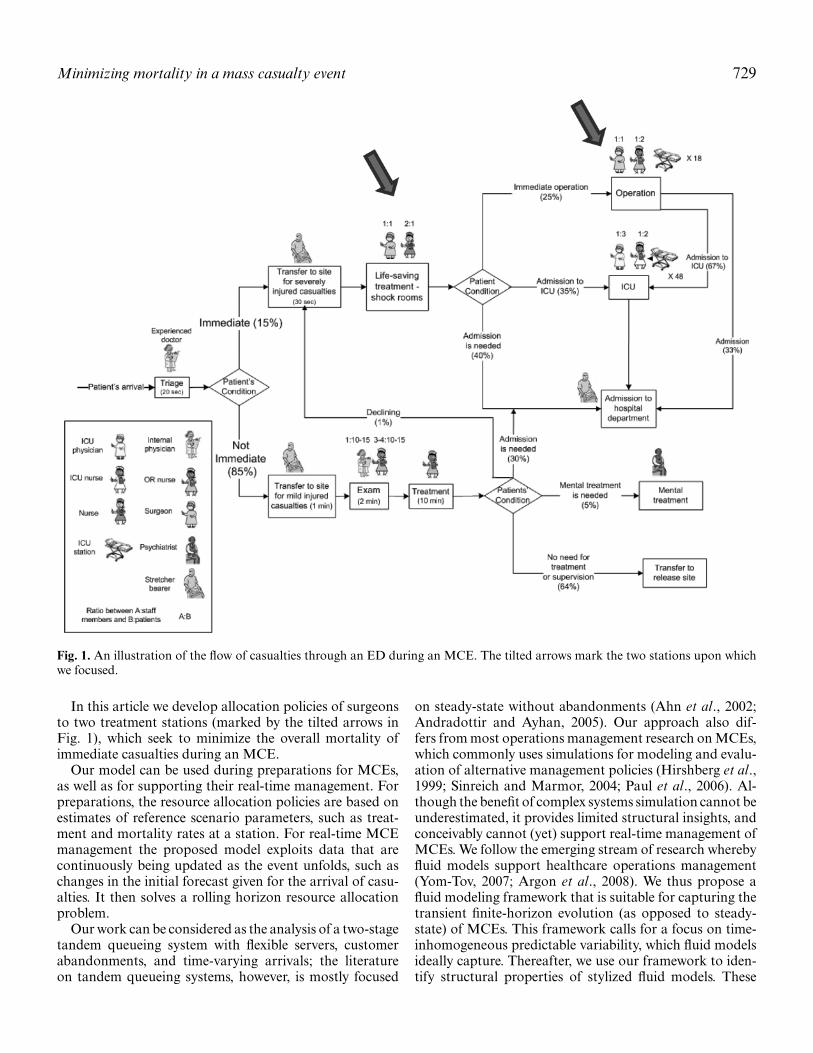
The environment of an Emergency Department (ED) ina hospital during an MCE is stressful. People run aroundfrantically, casualties’ cries emanate from the treatmentrooms, and worried relatives hope for encouraging news.During this time it is imperative to deliberately manage theevent and make, as far as possible, the right clinical andoperational decisions. Figure 1 illustrates the flow of ca-sualties through a hospital after an MCE. (Our showpiece
∗Corresponding authorColor versions of one or more of the figures in the article can befound online at www.tandfonline.com/uiie.
for this article is a large Israeli hospital that has becomeexperienced in handling emergencies; our modeling frame-work nevertheless is general and can be easily modified toaccommodate other hospitals.)
On arrival, casualties are triaged and prioritized for treat-ment according to their medical situation (Mehta, 2006).There are several triage systems that distinguish betweenseveral classes of casualties (e.g., Lerner et al. (2008)). Ourhospital uses a simple in-hospital triage system that classi-fies arriving casualties according to one of two categories:Immediate or Not Immediate. We focus on the former cat-egory: it concerns casualties who are in danger of dyingunless provided with prompt medical treatment; this en-tails stabilizing life-saving treatment and for some also animmediate operation, which underscores the significance ofappropriately managing medical resources.
After an MCE, there is a mounting demand for medicaltreatment, typically far in excess of the existing capacityto administer it. Consequently, the medical staff, and es-pecially the surgeons who are most frequently the bottle-neck resource (Hirshberg et al., 1999; Einav et al., 2006),cannot provide prompt treatment to all casualties. Casu-alties classified as Immediates are prioritized for prompttreatment. However, it may turn out to be impossibleto attend promptly to all the Immediates; therefore, themain objective of MCE management is to minimize theirmortality.
Fig. 1. An illustration of the flow of casualties through an ED during an MCE. The tilted arrows mark the two stations upon whichwe focused.
In this article we develop allocation policies of surgeonsto two treatment stations (marked by the tilted arrows inFig. 1), which seek to minimize the overall mortality ofimmediate casualties during an MCE.
Our model can be used during preparations for MCEs,as well as for supporting their real-time management. Forpreparations, the resource allocation policies are based onestimates of reference scenario parameters, such as treat-ment and mortality rates at a station. For real-time MCEmanagement the proposed model exploits data that arecontinuously being updated as the event unfolds, such aschanges in the initial forecast given for the arrival of casu-alties. It then solves a rolling horizon resource allocationproblem.
Our work can be considered as the analysis of a two-stagetandem queueing system with flexible servers, customerabandonments, and time-varying arrivals; the literatureon tandem queueing systems, however, is mostly focused
on steady-state without abandonments (Ahn et al., 2002;Andradottir and Ayhan, 2005). Our approach also dif-fers from most operations management research on MCEs,which commonly uses simulations for modeling and evalu-ation of alternative management policies (Hirshberg et al.,1999; Sinreich and Marmor, 2004; Paul et al., 2006). Al-though the benefit of complex systems simulation cannot beunderestimated, it provides limited structural insights, andconceivably cannot (yet) support real-time management ofMCEs. We follow the emerging stream of research wherebyfluid models support healthcare operations management(Yom-Tov, 2007; Argon et al., 2008). We thus propose afluid modeling framework that is suitable for capturing thetransient finite-horizon evolution (as opposed to steady-state) of MCEs. This framework calls for a focus on time-inhomogeneous predictable variability, which fluid modelsideally capture. Thereafter, we use our framework to iden-tify structural properties of stylized fluid models. These
730 Cohen et al.
structural properties yield management policies that min-imize the number of fatalities. The suggested policies areboth insightful and implementable.
The article is organized as follows. We review the rele-vant literature in the next section. Section 3 describes MCEenvironments, modeling assumptions, and the model for-mulation. Section 4 contains an analysis of optimal re-source allocation policies and provides managerial insightsfor applying them. In Section 5, we apply and test ourresults against the outline of two MCEs. Section 6 ex-tends the model to cases where resource allocation deci-sions are made periodically and to real-time management ofMCEs. The final section offers worthy directions for furtherresearch.
2. Literature review
Our approach follows two streams of research: MCEs andfluid models. In this section we briefly review the relevantliterature from both streams and the one example we foundthat combines the two. The MCE-related literature is di-verse: it analyzes clinical (Hirshberg et al., 2001; Hirshberget al., 2005; Aylwin et al., 2006), social science (Hughes,1991; Altay and Green, 2007; Merin et al., 2010), and op-erational aspects. We focus on operational aspects for whichthe relevant research is limited (Altay et al., 2007) and theproblems are challenging, even when compared with theclinical aspects (Waeckerle, 1991).
When an MCE occurs the Immediates are treated first(Lerner, 2008). The main objective is then to reduce themortality of its treated casualties by providing them witha “level of care that approximates the care given to simi-lar casualties under normal conditions” (Hirshberg et al.,2001; Hirshberg et al., 2005, p. 647).
With that in mind, we seek to develop resource manage-ment policies that minimize the mortality of Immediatesduring an MCE. The need for such policies becomes clearfrom their in-practice application: one example is the Is-raeli field hospital in Haiti that was established after theJanuary 2010 earthquake; it treated approximately 100 ca-sualties per day and had a capacity of 60 beds that waslater increased to 72 beds. Kreiss et al. (2010) and Merinet al. (2010) reported that dynamic resource allocation andstaffing enhanced the efficiency of that hospital.
Several researchers have dealt with resource alloca-tion during MCEs. Argon et al. (2008) developed state-dependent heuristic prioritization policies for casualtiesbeing treated by a single-server clearing system. Casual-ties who are not treated within their “lifetime” die andthe objective is to maximize the expected number of sur-vivors. Jacobson et al. (2012) extended the latter researchto consider different mortality probabilities for differenttypes of casualties and multiple resources. Both these mod-els assume that all casualties are available at the outsetof the MCE, triaged to different priority categories, and
that there is a single station. Mills et al. (2013) examined apossible scenario for these models—the evacuation by am-bulances of casualties from an MCE arena to a hospital.They developed prioritization policies for different casu-alty classes that were triaged in situ. Our model’s focus ison the ED arena where casualties arrive continuously, andthe surgeons are required to be in two different places “atonce” in order to take care of a single type of casualties (i.e.,Immediates). Our choice of surgeons as the scarce resourceis supported by the experience of our hospital partners, aswell as by Einav et al. (2006). The latter collected their dataat trauma centers in Israel from 32 MCEs caused by sui-cide bombings. Their analysis indicates that the surgeonsrepresent a scarce resource that is needed in the ED and theoperating rooms simultaneously.
Our model also contributes to the almost non-existentliterature about designing the surge capacity of a hospital.Hick et al. (2004, p. 254) defined surge capacity as the “abil-ity to manage a sudden, unexpected increase in patient vol-ume (i.e., number of patients) that would otherwise severelychallenge or exceed the current capacity of the health caresystem.” Examples of fundamental questions that must beaddressed when designing surge capacity are: how manycasualties are expected at the different treatment stationsconcurrently, and what is the estimated time from the startof the event until the peak demand at these stations. Thedefinition of what constitutes surge capacity varies; it typ-ically follows rules of thumb such as, when determiningsurge capacity by the percentage of the hospital’s bed ca-pacity (e.g., the Israeli Ministry of Health sets a hospital’ssurge capacity at 20% of its beds). At other times, surgecapacity is set according to a fixed number of casualtiesbased on past events (Kosashvili et al., 2009), simulationsof performance as a function of the casualties arrival rate(Hirshberg et al., 2005), or the time between the start ofan MCE until the trauma teams reach their full capacity(Hirshberg et al., 2010). As a by-product of our approach,which finds the best resource allocation policies to mini-mize mortality, we forecast the time and magnitude of thepeak demand at the treatment stations. Our model can thusbe used to support decisions for designing surge capacity byperforming a sensitivity analysis on the level of resources,consequently estimating the allowed time from the start ofan event to when an increase in capacity is needed (e.g.,recruit surgeons from the hospital or, alternatively, directcasualties to other hospitals).
Simulation is widely accepted as an effective method forassisting management in healthcare decision making. Thesimulation model of Sinreich and Marmor (2004) is anexcellent example of this approach. It was developed forshort-term operational planning in EDs. Based on datafrom 12 urban terrorist bombing events, Hirshberg et al.(1999) developed a simulation model of an ED during suchevents. They concluded that the surge capacity of a hospi-tal depends primarily on the number of available surgeons;they then defined an optimal staff profile for surgeons and
Minimizing mortality in a mass casualty event 731
trauma nurses that arise as the scarce resources. Paul et al.(2006) used simulations for predicting casualties’ waitingtimes, and for estimating hospitals’ capacities within a dis-aster region.
We use fluid models that account for the transient natureof MCEs. We adopt this approach because of its analyticaltractability, which leads to optimal policies for simple, yetrealistic, MCE scenarios. In such models, the entities thatmove through the system (e.g., casualties) are assumed tobe fluid and so the flow can be described through differ-ential equations. The literature indicates that fluid models(or approximations) are accurate for heavily loaded ser-vice systems. For example, Mandelbaum, Massey, Reiman,and Rider (1999) and Mandelbaum, Massey, Reiman, andStolyer (1999) developed fluid approximations for a multi-server single queue with abandonment and retrials. Themodel was proven accurate both in its steady state and inits transient state; the latter was caused by a sudden peakin the casualties’ arrival rate, as is typical during an MCE.Mandelbaum, Massey, Reiman, and Stolyer (1999) showedthat waiting time approximations are asymptotically exactas the size of the system increases. Our model exploits per-formance measures, such as the time-varying number ofpeople in the system and the number at each station, whichallow one to develop resource allocation policies. Fluidmodels of service systems have been extended to includestate-dependent arrival rates and general arrival and ser-vice rates (Whitt, 2005, 2006).
Fluid models have been successfully implemented indifferent types of service systems. These cover the earlyapplications for post offices, claims processing in a SocialSecurity office (Oliver and Samuel, 1962; Vandergraft,1983), and more recently a financial service call center(Green et al., 2005).
The research setting of Yom-Tov (2007) is perhaps theclosest to ours. She developed fluid and diffusion limits forthe Erlang-R model, which accommodates returns of cus-tomers to service. These limits lead to fluid approximationsthat are not only useful in analyzing time-varying systems,but they also help understand their transient behavior. Hermodel was used to analyze MCEs in which the arrival ratechanges rapidly during a short period of time. A numeri-cal example in which the arrival rate is multiplied fivefoldover 2 hours was simulated and compared with its fluid anddiffusion approximations. The comparison demonstrated ahigh degree of accuracy.
Our model differs from the existing literature in two fun-damental ways: first, it deals with a situation in which thecasualties arrive at a hospital according to a general arrivalrate and, second, we explicitly consider two stations, intandem, where medical treatment is delivered by the samescarce resource.
Our primary focus is to minimize the number of mor-talities, and so we seek resource allocation solutions andpolicies for planning and real-time management of MCEs.Note that prior research, which dealt with our problem
specification, presents results of simulations and numericalanalysis that can be computationally intensive and provideslimited general insight.
3. The model
This section starts with a discussion of the environment,the assumptions that we make, and the dynamics duringan MCE. In subsection 3.2 we introduce notations andformulate the problem.
3.1. The model’s environment, assumptions, and dynamics
We model part of an ED in a hospital during an MCE.As explained, we presume that surgeons are the bottleneckresource during MCEs.
Our fluid model approximates ED dynamics during anMCE. Casualties arrive at the ED continuously (e.g., agiven reference scenario). If there are enough resources,then casualties are admitted for treatment, which is eitherlife-saving (Station 1) or an operation (Station 2). Theseare performed at a known service rate. Casualties may dieeither during treatment or while waiting for it. The mor-tality rates can be different at different stations. Mortalityrates can be interpreted as either fatality rates of casual-ties or as operational constraints. In the latter case, theyare the reciprocals of the average maximum allowable timefor a casualty to complete treatment, in order to avoid fa-tality (Paul et al., 2006). We assume that mortality rate isconstant for each station, which enables explicit analyticalsolutions and structural insights and, equally important,it is reasonable since it does in fact capture the underly-ing stochastic death times—some long, others short. Ourmodels can nevertheless accommodate differing rates, ormerely constraints on waiting times, albeit at the cost ofinsight and tractability. One could also argue in favor ofstochastic dependence of death times across stations, butthis would lead to far more complicated models (Pang andWhitt, 2012), which we leave for future research.
As common in practice, we assume that one surgeontreats a single casualty at either one of the stations(Hirshberg et al., 1999; Aylwin et al., 2006). It is worthnoting that one surgeon may treat several mortal-risk ca-sualties at the same time in response to a specific real-timecrisis. However, this is undesirable and does not change themedical policies; therefore, we do not take such an optioninto account. We believe that the preparation for an MCEshould be based on a model that takes the standard medi-cal practices into consideration. Moreover, our belief is thatreal-time emergency decision making may relax some of theassumptions that we made during the preparation phase,as a prompt solution to a local crisis. There is also a tech-nical reason for assuming the constant casualty–surgeonratio—it facilitates the model’s formulation; changing it
732 Cohen et al.
Sta�on 1 Sta�on 2
To immediate operation
To admission and ICU
Arriving Immediates
Mortality Mortality
To admission and ICU
Fig. 2. Casualties flow in a two-station network.
will significantly complicate the model and the structuralresults that we achieve.
The routing probabilities and the duration of treatmentsin Fig. 1 were estimated by expert trauma doctors. Never-theless, our modeling framework is general and we analyzedifferent scenarios. The tilted arrows in Fig. 1 mark thetwo stations on which we focus, while Fig. 2 introducesthe corresponding basic stylized model, which captures theconflict of surgeon allocation.
The sequence of events for Fig. 2 is as follows:
1. Immediate casualties arrive at Station 1 after beingtriaged. We assume that all Immediates share similar(severe) clinical assessment. Their flow through the net-work would therefore be according to first-come first-served priority.
2. An Immediate who enters Station 1 at time t receiveslife-saving treatment if at least one of the N1(t) surgeonsis available; if not, she or he waits for treatment.
3. With probability p12, the casualty who finished treat-ment at Station 1 is directed to Station 2, where N2(t)surgeons are allocated. An available surgeon starts treat-ment immediately; alternatively, the casualty must waitfor a surgeon who is in the middle of treatment.
4. Treatment rates are μ1 and μ2 for Stations 1 and 2,respectively.
5. Casualties may die either while waiting for or receivingtreatment. The mortality rates are θ1 and θ2 for Sta-tions 1 and 2, respectively. A reasonable assumption isthat θ1, θ2 � 1 (time units throughout the article are inminutes).
6. The “effective” treatment time for a casualty treated ata station includes the duration of the treatment and anytime delay caused by unavailable surgeons.
Treatment may take place at a station only if the necessaryresources (e.g., surgeons, operating rooms, and medicalequipment) are available. We assume that the only con-straining resources are the N surgeons who are availableat the hospital, or formally N1(t) + N2(t) ≤ N, at all timest ≥ 0 during the MCE.
Our key technique is to prepare for an MCE by assum-ing a reference scenario and finding the best decisions for
the surgeon allocations. These decisions impact the wait-ing times of casualties, their flow through the network,and their likelihood of survival. Our fluid model approachcaptures the dynamic nature of an MCE and suggests dy-namic policies; these may be ignored if we either assumetime-homogenous parameters (e.g., constant arrival rate)or use a steady-state model (e.g., steady-state simulation orqueueing theory approximations).
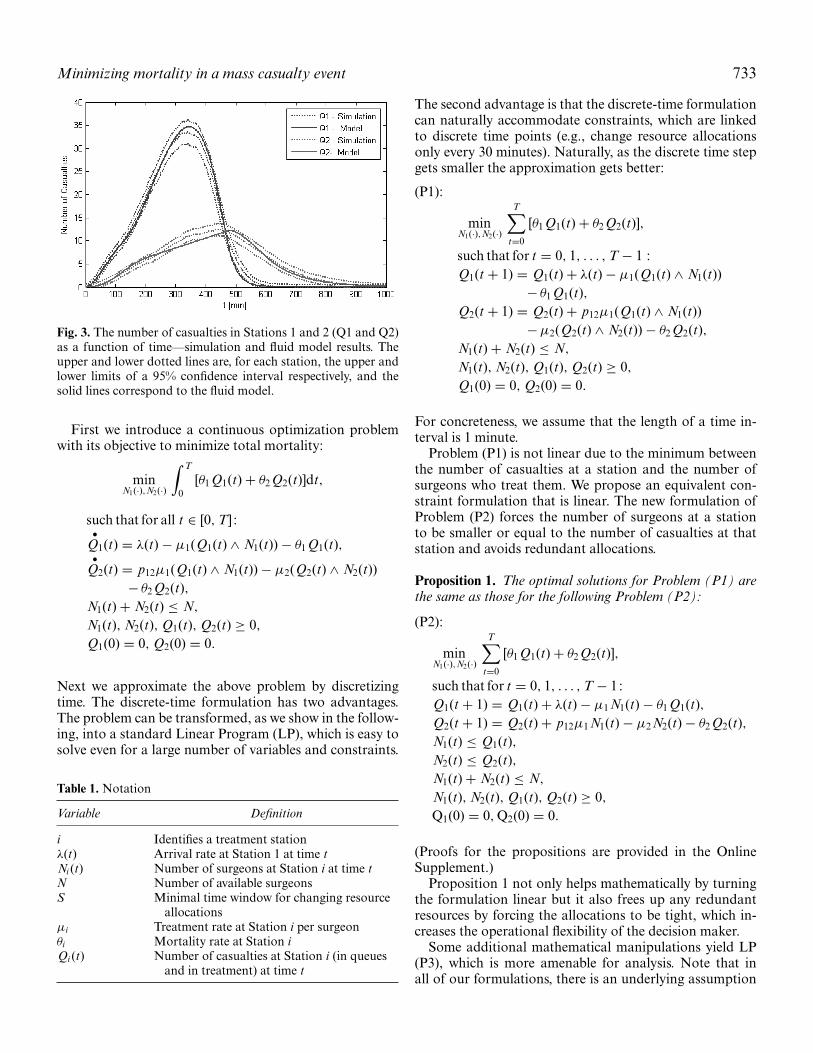
The fluid model serves as an approximation of the un-derlying stochastic environment in which arrivals, mortal-ity, treatment times, and the other parameters are randomvariables. Therefore, in addition to the support from theliterature that fluid models should provide good approxi-mations of their corresponding stochastic environment, weconducted experiments to validate the accuracy of our fluidmodel when used to capture our specification of the prob-lem as presented in Fig. 2. These experiments, each using500 simulation replications, compared the fluid model re-sults against a discrete-event stochastic simulation in whichcasualties arrive according to a non-homogenous Pois-son process that was used to represent a general, time-dependent arrival rate; treatment durations were randomlygenerated from exponential distributions. In all cases, thefluid model forecasted, rather accurately, the stochastic be-havior of the corresponding simulation in that its resultswere nearly always within the bounds of the 95% simu-lation confidence interval and always within the (wider)bounds of a 99% confidence interval (Fig. 3 is a represen-tative example).
3.2. Model formulation
Table 1 includes the notations used throughout the arti-cle. Whenever possible we suppress subscripts to improvereadability.
We assume that by the time the first casualty arrivesat the hospital all prior casualties will have been cleared.We then choose T to be large enough to ensure thatthe last casualty has completed treatment by time T ;[0, T] is hence the time interval over which our model isformulated.
Minimizing mortality in a mass casualty event 733
Fig. 3. The number of casualties in Stations 1 and 2 (Q1 and Q2)as a function of time—simulation and fluid model results. Theupper and lower dotted lines are, for each station, the upper andlower limits of a 95% confidence interval respectively, and thesolid lines correspond to the fluid model.
First we introduce a continuous optimization problemwith its objective to minimize total mortality:
Next we approximate the above problem by discretizingtime. The discrete-time formulation has two advantages.The problem can be transformed, as we show in the follow-ing, into a standard Linear Program (LP), which is easy tosolve even for a large number of variables and constraints.
Table 1. Notation
Variable Definition
i Identifies a treatment stationλ(t) Arrival rate at Station 1 at time tNi (t) Number of surgeons at Station i at time tN Number of available surgeonsS Minimal time window for changing resource
allocationsμi Treatment rate at Station i per surgeonθi Mortality rate at Station iQi (t) Number of casualties at Station i (in queues
and in treatment) at time t
The second advantage is that the discrete-time formulationcan naturally accommodate constraints, which are linkedto discrete time points (e.g., change resource allocationsonly every 30 minutes). Naturally, as the discrete time stepgets smaller the approximation gets better:
(P1):
minN1(·),N2(·)
T∑t=0
[θ1 Q1(t) + θ2 Q2(t)],
such that for t = 0, 1, . . . , T − 1 :Q1(t + 1) = Q1(t) + λ(t) − μ1(Q1(t) ∧ N1(t))
For concreteness, we assume that the length of a time in-terval is 1 minute.
Problem (P1) is not linear due to the minimum betweenthe number of casualties at a station and the number ofsurgeons who treat them. We propose an equivalent con-straint formulation that is linear. The new formulation ofProblem (P2) forces the number of surgeons at a stationto be smaller or equal to the number of casualties at thatstation and avoids redundant allocations.
Proposition 1. The optimal solutions for Problem (P1) arethe same as those for the following Problem (P2):
(P2):
minN1(·),N2(·)
T∑t=0
[θ1 Q1(t) + θ2 Q2(t)],
such that for t = 0, 1, . . . , T − 1:Q1(t + 1) = Q1(t) + λ(t) − μ1 N1(t) − θ1 Q1(t),Q2(t + 1) = Q2(t) + p12μ1 N1(t) − μ2 N2(t) − θ2 Q2(t),N1(t) ≤ Q1(t),N2(t) ≤ Q2(t),N1(t) + N2(t) ≤ N,
N1(t), N2(t), Q1(t), Q2(t) ≥ 0,
Q1(0) = 0, Q2(0) = 0.
(Proofs for the propositions are provided in the OnlineSupplement.)
Proposition 1 not only helps mathematically by turningthe formulation linear but it also frees up any redundantresources by forcing the allocations to be tight, which in-creases the operational flexibility of the decision maker.
Some additional mathematical manipulations yield LP(P3), which is more amenable for analysis. Note that inall of our formulations, there is an underlying assumption
734 Cohen et al.
that resource allocations of surgeons can be changed at anytime, thus preempting treatments. This assumption is rea-sonable for MCEs that operate under heavy traffic regimesfor which it has been proved (e.g., Atar et al., (2004)) thata non-preemptive policy is asymptotically equivalent to itspreemptive counterpart. In reality it is common that allo-cation updates follow periodic assessments (e.g., every 30minutes). In Section 6 we deal with such constraints andanalyze their impact.
Proposition 2. The formulation of Problem (P2) is equiva-lent to the following formulation (P3):
Problem (P3) is solved by standard LP techniques (we usedMatlab and Mosek toolbox; www.mosek.com) to find op-timal dynamic surgeon allocations. In the next section weanalyze the problem to identify structural properties of op-timal policies.
4. Problem analysis
When surgeons are overloaded, the decision maker mustprioritize them to either Station 1 or Station 2. The opti-mal allocation policy can be dynamic, in which prioritieschange (e.g., first prioritize Station 1 and at some later time
prioritize Station 2), or static, in which priorities are keptfixed throughout the event.
In this section we characterize optimal priority settingsfor various scenarios, which are then followed by an analysisof each scenario. We start by introducing a greedy formula-tion for the optimization problem. This greedy formulationidentifies, at each discrete time point t = 0, 1, . . . ,T − 1(t is the starting time of interval t + 1), the surgeon allo-cations N1(t), N2(t) that minimizes mortality over intervalt + 1 only. To this end, we formulate a sequence of contin-uous Knapsack problems (Kellerer et al., 2004, pp. 17–20),indexed by t = 0, 1, . . . ,T − 1. Problem t corresponds totime interval t, and it uses the quantities λ(t), Q1(t), Q2(t)that are known at the end of interval t − 1. Formally, fort = 0, 1, . . . ,T−1, the problem is(P4):
maxN1(t),N2(t)
N1(t)μ1[θ1 − p12θ2] + N2(t)μ2θ2,
subject toN1(t) ≤ Q1(t),N2(t) ≤ Q2(t),N1(t) + N2(t) ≤ N,
N1(t), N2(t), Q1(t), Q2(t) ≥ 0.
Proposition 3 characterizes the optimal allocation policyfor the greedy Problem (P4). (Its proof is provided in theOnline Supplement.)
Proposition 3. An optimal policy for the greedy problem(P4) is to allocate to Station i∗ all of the surgeons it requiresfrom the N available, where i∗ = 1 if μ1 (θ1 − p12θ2) ≥ μ2θ2and i∗ = 2 otherwise; if there are still available surgeons leftthen allocate them to the other station.
In other words, the prioritized (higher priority) Station iis allocated all its needed resources, to the extent possi-ble: min(Qi (t), N) surgeons; any remaining surgeons areassigned to the other station.
Note that for equal mortality rates, Proposition 3 de-termines station priorities according to the relative valuesof μ1 (1 − p12) and μ2. The greedy policy plays an impor-tant role in solving our original problem, as formulatedin Problems (P1) to (P3). This role emerges by identifyingnine cases, according to all possible combinations betweenμ1 (1 − p12) and μ2, θ1 and θ2.
In the first three cases, mortality rates are equal. Case1: θ1 = θ2 and μ1 (1 − p12) = μ2; Case 2: θ1 = θ2 andμ1 (1 − p12) > μ2; Case 3: θ1 = θ2 and μ1 (1 − p12) < μ2.For the next three cases the mortality rate is higher atStation 1. Case 4: θ1 > θ2 and μ1 (1 − p12) = μ2; Case5: θ1 > θ2 and μ1 (1 − p12) > μ2; Case 6: θ1 > θ2 andμ1 (1 − p12) < μ2. For the last three cases Station 2 hasa higher mortality rate, Case 7: θ1 < θ2 and μ1 (1 − p12) =μ2; Case 8: θ1 < θ2 and μ1 (1 − p12) > μ2; Case 9: θ1 < θ2
Minimizing mortality in a mass casualty event 735
Table 2. Summary of suggested priority settings of surgeon allocations
Conditions θ1 = θ2 θ1 > θ2 θ1 < θ2
μ1 (1 − p12) = μ2 Station 1 or 2—equalperformance (Case 1)
Station 1 (Case 4) Station 2 (Case 7)
μ1 (1 − p12) > μ2 Station 1 (Case 2) Station 1 (Case 5) Prioritize Station 1 and switchpriorities at some t (Case 8)
μ1 (1 − p12) < μ2 Station 2 (Case 3) Prioritize Station 2 and switchpriorities at some t (Case 6)
Station 2 (Case 9)
and μ1 (1 − p12) < μ2 (Table 2 lists these cases and theirsuggested priority settings, which we develop in the follow-ing discussions).
It turns out that the sequence of greedy solutions, viaProblem (P4), in fact solves Problem (P3) when the mor-tality rates at both stations are equal (i.e., Cases 1 to3).Formally:
Proposition 4. Assume that θ = θ1 = θ2. Then an optimalsolution of Problem (P3) is given by any sequence of greedysolutions for Problem (P4).
The proof of this last proposition is rather tedious; hence,it is placed in the Online Supplement. The proof yields astatic priority rule for an optimal surgeons’ allocation.
We now extend Proposition 4 to some cases of unequalmortality rates, which we formalize as Proposition 5.
Proposition 5. If Station i gets priority when θi = θ j , then itwill get priority when θi > θ j .
The details of the induction-based proof appear in the On-line Supplement. The proposition explicitly identifies opti-mal allocation policies for Cases 4, 5, 7, and 9.
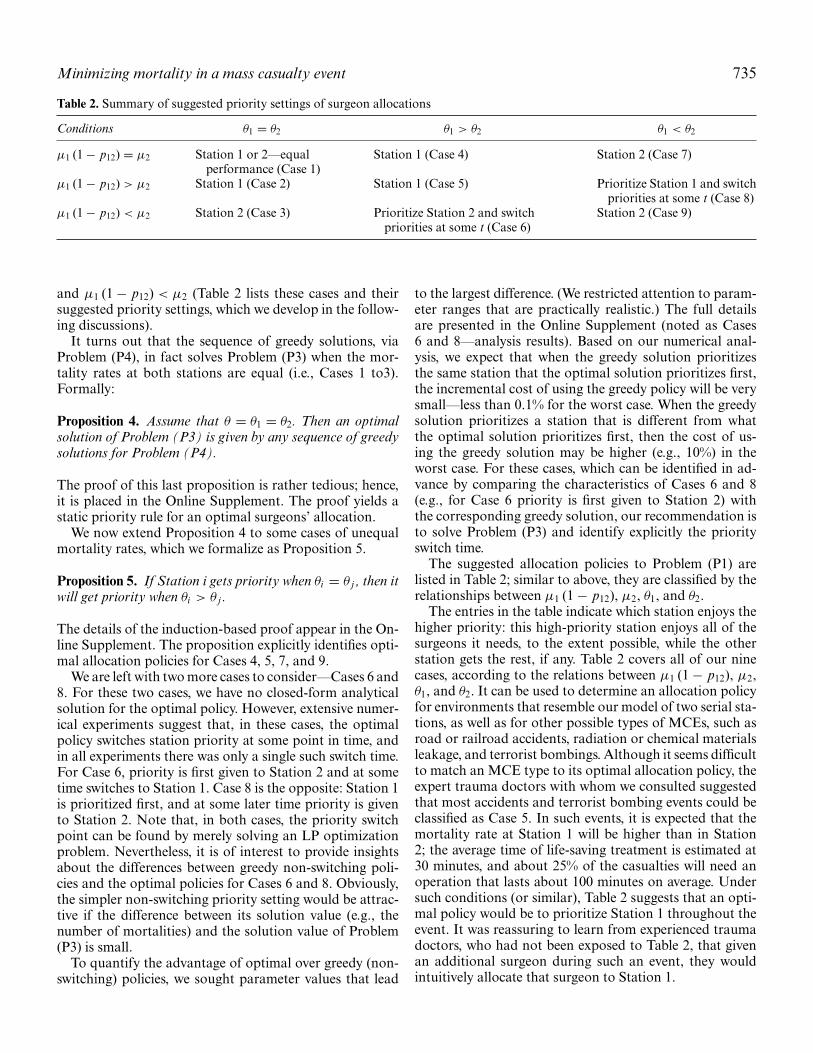
We are left with two more cases to consider—Cases 6 and8. For these two cases, we have no closed-form analyticalsolution for the optimal policy. However, extensive numer-ical experiments suggest that, in these cases, the optimalpolicy switches station priority at some point in time, andin all experiments there was only a single such switch time.For Case 6, priority is first given to Station 2 and at sometime switches to Station 1. Case 8 is the opposite: Station 1is prioritized first, and at some later time priority is givento Station 2. Note that, in both cases, the priority switchpoint can be found by merely solving an LP optimizationproblem. Nevertheless, it is of interest to provide insightsabout the differences between greedy non-switching poli-cies and the optimal policies for Cases 6 and 8. Obviously,the simpler non-switching priority setting would be attrac-tive if the difference between its solution value (e.g., thenumber of mortalities) and the solution value of Problem(P3) is small.
To quantify the advantage of optimal over greedy (non-switching) policies, we sought parameter values that lead
to the largest difference. (We restricted attention to param-eter ranges that are practically realistic.) The full detailsare presented in the Online Supplement (noted as Cases6 and 8—analysis results). Based on our numerical anal-ysis, we expect that when the greedy solution prioritizesthe same station that the optimal solution prioritizes first,the incremental cost of using the greedy policy will be verysmall—less than 0.1% for the worst case. When the greedysolution prioritizes a station that is different from whatthe optimal solution prioritizes first, then the cost of us-ing the greedy solution may be higher (e.g., 10%) in theworst case. For these cases, which can be identified in ad-vance by comparing the characteristics of Cases 6 and 8(e.g., for Case 6 priority is first given to Station 2) withthe corresponding greedy solution, our recommendation isto solve Problem (P3) and identify explicitly the priorityswitch time.
The suggested allocation policies to Problem (P1) arelisted in Table 2; similar to above, they are classified by therelationships between μ1 (1 − p12), μ2, θ1, and θ2.
The entries in the table indicate which station enjoys thehigher priority: this high-priority station enjoys all of thesurgeons it needs, to the extent possible, while the otherstation gets the rest, if any. Table 2 covers all of our ninecases, according to the relations between μ1 (1 − p12), μ2,θ1, and θ2. It can be used to determine an allocation policyfor environments that resemble our model of two serial sta-tions, as well as for other possible types of MCEs, such asroad or railroad accidents, radiation or chemical materialsleakage, and terrorist bombings. Although it seems difficultto match an MCE type to its optimal allocation policy, theexpert trauma doctors with whom we consulted suggestedthat most accidents and terrorist bombing events could beclassified as Case 5. In such events, it is expected that themortality rate at Station 1 will be higher than in Station2; the average time of life-saving treatment is estimated at30 minutes, and about 25% of the casualties will need anoperation that lasts about 100 minutes on average. Undersuch conditions (or similar), Table 2 suggests that an opti-mal policy would be to prioritize Station 1 throughout theevent. It was reassuring to learn from experienced traumadoctors, who had not been exposed to Table 2, that givenan additional surgeon during such an event, they wouldintuitively allocate that surgeon to Station 1.
736 Cohen et al.
5. An analysis of two MCE scenarios
In this section we demonstrate the application of Table 2results to reference MCE scenarios. To be as realistic aspossible, we used two scenarios that are based on actualterror attacks. Specifically, we analyzed the results with themedical overseer of the events and found that our modelprovides logical and coherent management policies.
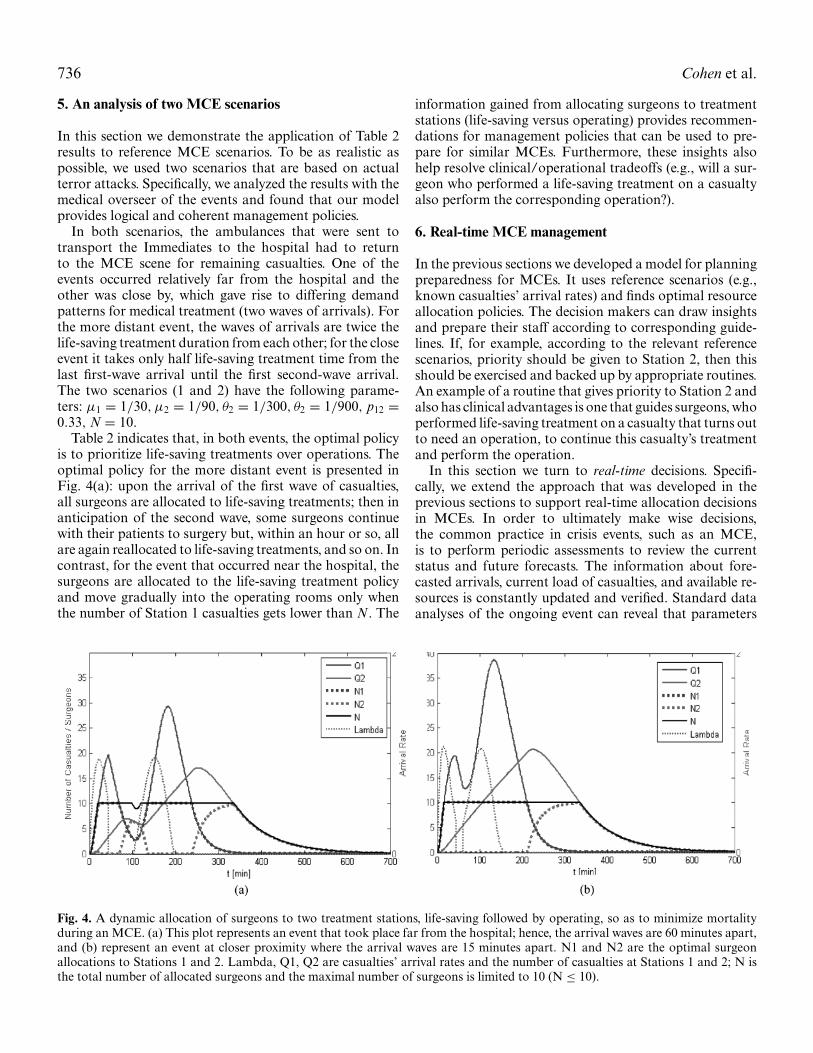
In both scenarios, the ambulances that were sent totransport the Immediates to the hospital had to returnto the MCE scene for remaining casualties. One of theevents occurred relatively far from the hospital and theother was close by, which gave rise to differing demandpatterns for medical treatment (two waves of arrivals). Forthe more distant event, the waves of arrivals are twice thelife-saving treatment duration from each other; for the closeevent it takes only half life-saving treatment time from thelast first-wave arrival until the first second-wave arrival.The two scenarios (1 and 2) have the following parame-ters: μ1 = 1/30, μ2 = 1/90, θ2 = 1/300, θ2 = 1/900, p12 =0.33, N = 10.
Table 2 indicates that, in both events, the optimal policyis to prioritize life-saving treatments over operations. Theoptimal policy for the more distant event is presented inFig. 4(a): upon the arrival of the first wave of casualties,all surgeons are allocated to life-saving treatments; then inanticipation of the second wave, some surgeons continuewith their patients to surgery but, within an hour or so, allare again reallocated to life-saving treatments, and so on. Incontrast, for the event that occurred near the hospital, thesurgeons are allocated to the life-saving treatment policyand move gradually into the operating rooms only whenthe number of Station 1 casualties gets lower than N. The
information gained from allocating surgeons to treatmentstations (life-saving versus operating) provides recommen-dations for management policies that can be used to pre-pare for similar MCEs. Furthermore, these insights alsohelp resolve clinical/operational tradeoffs (e.g., will a sur-geon who performed a life-saving treatment on a casualtyalso perform the corresponding operation?).
6. Real-time MCE management
In the previous sections we developed a model for planningpreparedness for MCEs. It uses reference scenarios (e.g.,known casualties’ arrival rates) and finds optimal resourceallocation policies. The decision makers can draw insightsand prepare their staff according to corresponding guide-lines. If, for example, according to the relevant referencescenarios, priority should be given to Station 2, then thisshould be exercised and backed up by appropriate routines.An example of a routine that gives priority to Station 2 andalso has clinical advantages is one that guides surgeons, whoperformed life-saving treatment on a casualty that turns outto need an operation, to continue this casualty’s treatmentand perform the operation.
In this section we turn to real-time decisions. Specifi-cally, we extend the approach that was developed in theprevious sections to support real-time allocation decisionsin MCEs. In order to ultimately make wise decisions,the common practice in crisis events, such as an MCE,is to perform periodic assessments to review the currentstatus and future forecasts. The information about fore-casted arrivals, current load of casualties, and available re-sources is constantly updated and verified. Standard dataanalyses of the ongoing event can reveal that parameters
Fig. 4. A dynamic allocation of surgeons to two treatment stations, life-saving followed by operating, so as to minimize mortalityduring an MCE. (a) This plot represents an event that took place far from the hospital; hence, the arrival waves are 60 minutes apart,and (b) represent an event at closer proximity where the arrival waves are 15 minutes apart. N1 and N2 are the optimal surgeonallocations to Stations 1 and 2. Lambda, Q1, Q2 are casualties’ arrival rates and the number of casualties at Stations 1 and 2; N isthe total number of allocated surgeons and the maximal number of surgeons is limited to 10 (N ≤ 10).
Minimizing mortality in a mass casualty event 737
such as the arrival rates, actual mortality rates, and treat-ment times are different than assumed in the referencescenarios (e.g., due to the nature of injuries or misinfor-mation), which may change the resource allocations andsometimes the priorities between the treatment stations.It is important in these cases to take an approach thatbases decision making on the most current information.We adopt such an approach. Based on current estimatesof the situation, we take a rolling horizon approach thatsolves the optimization problem (P5) to optimality, at eachstatus assessment, to find the optimal resource allocationsfrom that point onwards. These allocations, as well as thestation priorities, may turn out different from those thatresulted from the planning models. In this section, we as-sume that allocations must follow periodic situation assess-ments that take place every S minutes, where S is the min-imal time window in which allocations can be practicallychanged.
To recapitulate, the main two differences between theplanning models introduced earlier and the one presentedin the sequel are: first, for real-time management, we usethe most updated information about the event, which isconstantly being updated and may be different from the in-formation used for the planning models; and second, unlikeprior models, we allow the resource allocations to changeonly after status assessments.
In the formulation of Problem (P2) and Proposition 1, weintroduced constraints that force the number of surgeons tobe smaller or equal to the number of casualties at a station.Clearly, these constraints are not feasible under the newassumption of periodic allocations. We thus develop a lin-ear formulation, Problem (P5), which includes constraintsto ensure that allocations are set periodically and enablesa solution to be reached by means of commercial softwarepackages. The details of developing the formulation arepresented as Proposition 6 in the Online Supplement.
(P5):
minN1(·),N2(·)
T∑t=0
[θ1 Q1(t) + θ2 Q2(t)],
such that for t = 0, 1, . . . , T − 1:Q1(t + 1) = Q1(t) + λ1(t) − μ1 Z1(t) − θ1 Q1(t),Q2(t + 1) = Q2(t) + p12 × μ1 Z1(t) − μ2 Z2(t) − θ2 Q2(t),N1(t) + N2(t) ≤ N,
Zi (t) ≤ Ni (t), Zi (t) ≤ Qi (t) i = 1, 2,
Zi (t) ≥ 0,Ni (t) ≥ 0, Qi (t) ≥, Qi (0) = 0 i = 1, 2,
andNi (u) = Ni (u + 1) = ... = Ni (u + S − 1)
i = 1, 2; u = 0, S, 2S... T/S S.
Variables Zi (·) are added to formulate the problemas a linear one. Formulation (P5) is updated as timeprogresses: for example, at the first time assessment
the original constraints Q1(0) = Q2(0) = 0 are replacedby Q1(S) = Q1,s and Q2(S) = Q2,s . The latter values,Q1,s and Q2,s , are determined according to the actual num-ber of people observed at each station at time S, and so theproblem is solved from time S onwards (T can be updatedand should be long enough to ensure that the last casualtyis treated) using the most updated information regardingcasualty arrivals, mortality rates, treatment rates, the totalnumber of surgeons, etc.
To make things concrete, we provide two illustrative ex-amples. Their parameters were fit to the outlines of a terrorattack that happened in Israel in 2003; parameters such asmortality rates and treatment times were estimated by theevent’s manager (an M.D.). We manipulated the originalarrival rate of the event and assumed that it is a quadraticfunction to illustrate an event that lasts for several hours.The specific details are as follows:
μ1 = 1/30, μ2 = 1/100, θ1 = 1/300, θ2 = 1/900,
p12 = 0.25, N = 10,
λ(t) = −1 × 10⁻⁵t2 + 0.0044t, 0 ≤ t ≤ 440.
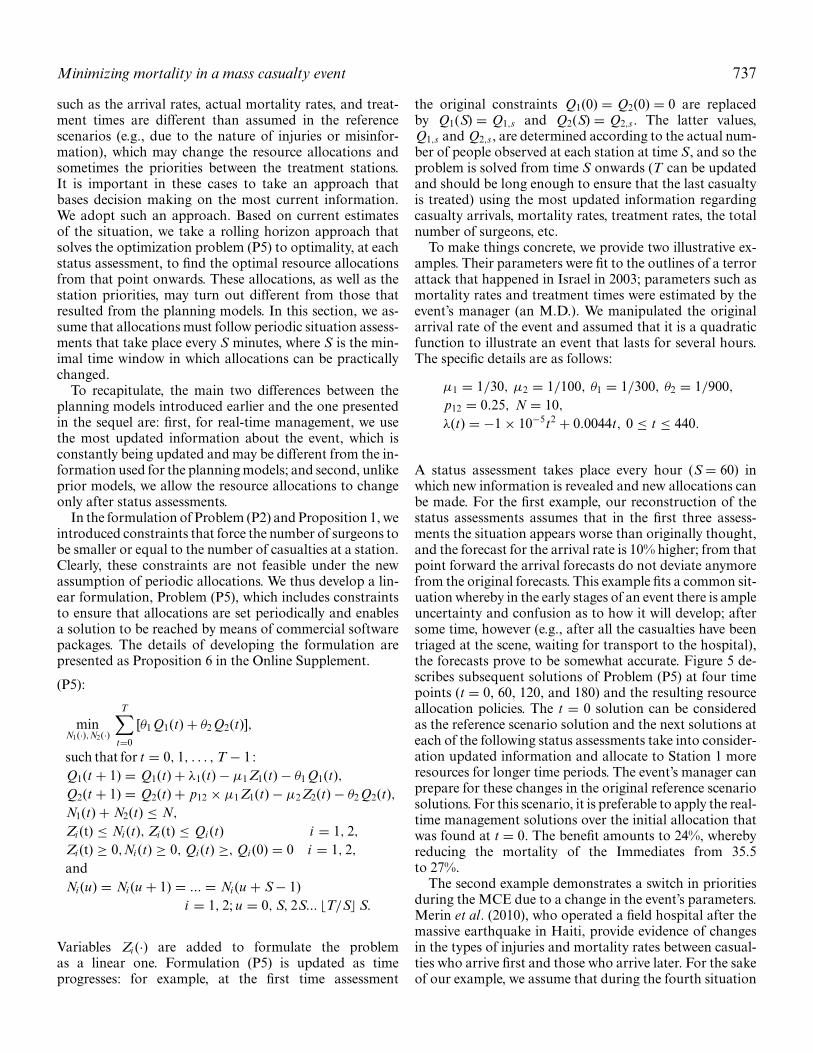
A status assessment takes place every hour (S = 60) inwhich new information is revealed and new allocations canbe made. For the first example, our reconstruction of thestatus assessments assumes that in the first three assess-ments the situation appears worse than originally thought,and the forecast for the arrival rate is 10% higher; from thatpoint forward the arrival forecasts do not deviate anymorefrom the original forecasts. This example fits a common sit-uation whereby in the early stages of an event there is ampleuncertainty and confusion as to how it will develop; aftersome time, however (e.g., after all the casualties have beentriaged at the scene, waiting for transport to the hospital),the forecasts prove to be somewhat accurate. Figure 5 de-scribes subsequent solutions of Problem (P5) at four timepoints (t = 0, 60, 120, and 180) and the resulting resourceallocation policies. The t = 0 solution can be consideredas the reference scenario solution and the next solutions ateach of the following status assessments take into consider-ation updated information and allocate to Station 1 moreresources for longer time periods. The event’s manager canprepare for these changes in the original reference scenariosolutions. For this scenario, it is preferable to apply the real-time management solutions over the initial allocation thatwas found at t = 0. The benefit amounts to 24%, wherebyreducing the mortality of the Immediates from 35.5to 27%.
The second example demonstrates a switch in prioritiesduring the MCE due to a change in the event’s parameters.Merin et al. (2010), who operated a field hospital after themassive earthquake in Haiti, provide evidence of changesin the types of injuries and mortality rates between casual-ties who arrive first and those who arrive later. For the sakeof our example, we assume that during the fourth situation
738 Cohen et al.
Fig. 5. Optimal resource allocation solutions for different time points 0, 60, 120, 180, corresponding to (a), (b), (c), and (d), respectively.The dotted lines in (b), (c), and (d) represent the resource allocations that were found at t = 0 and the solid lines represent the optimalallocations based on updated information.
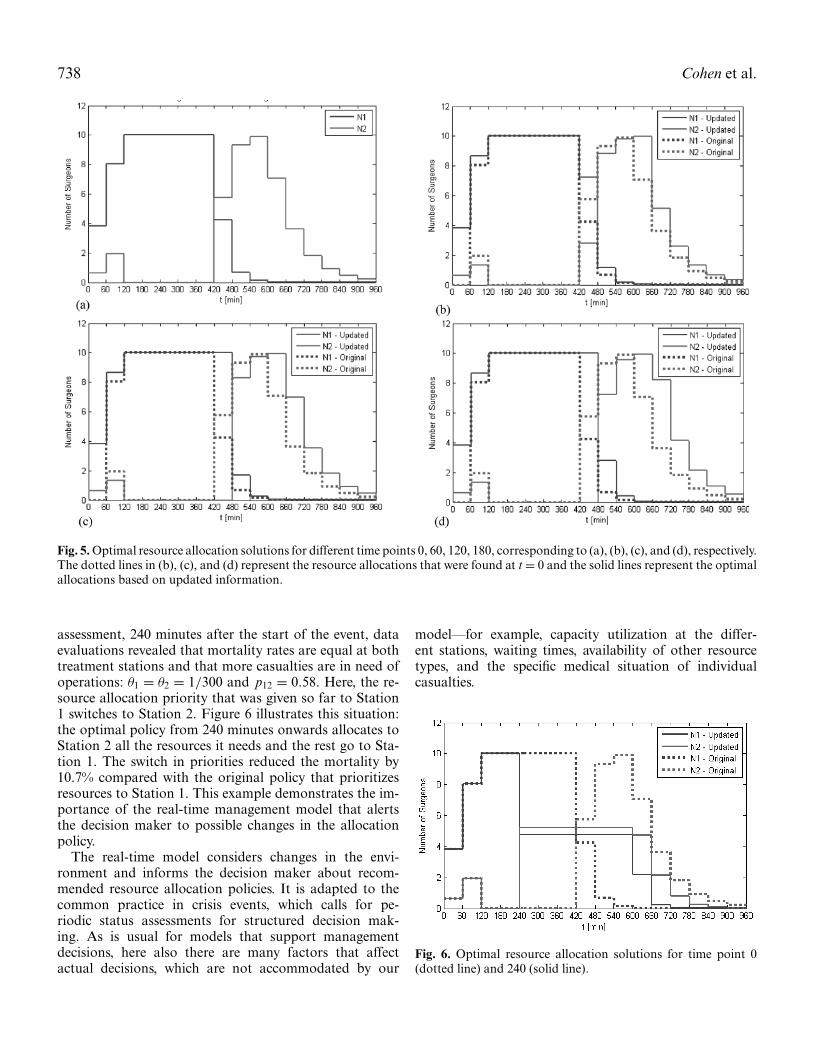
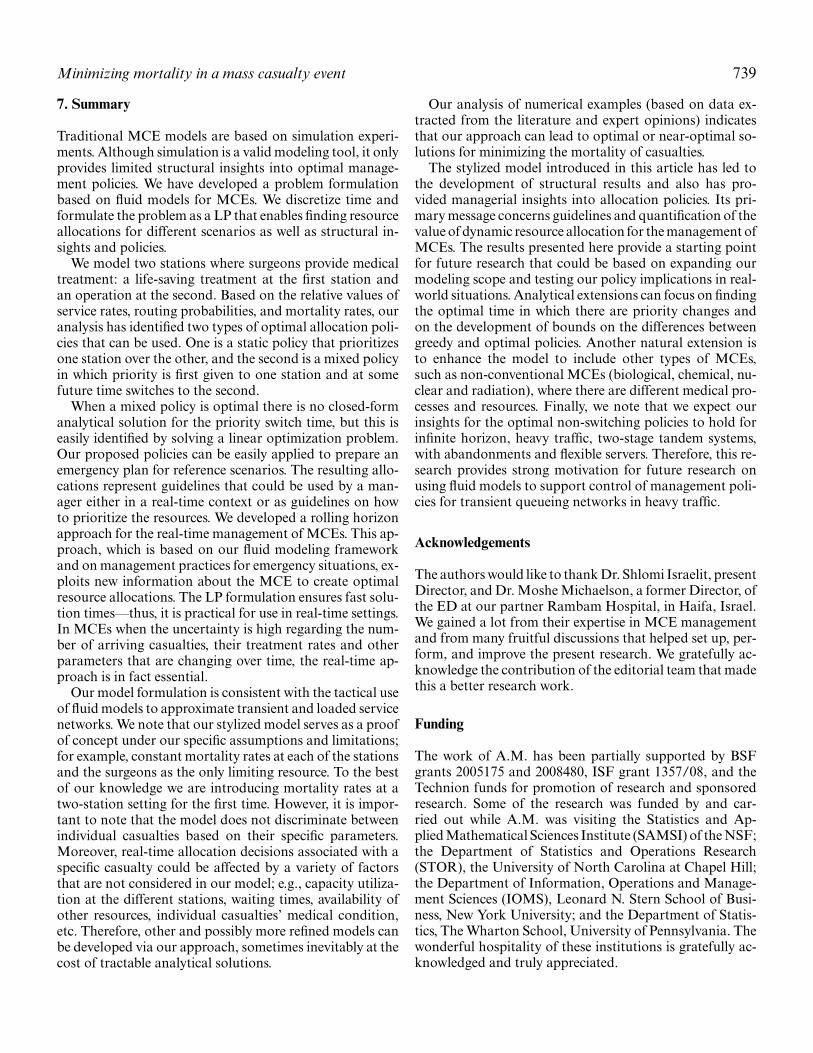
assessment, 240 minutes after the start of the event, dataevaluations revealed that mortality rates are equal at bothtreatment stations and that more casualties are in need ofoperations: θ1 = θ2 = 1/300 and p12 = 0.58. Here, the re-source allocation priority that was given so far to Station1 switches to Station 2. Figure 6 illustrates this situation:the optimal policy from 240 minutes onwards allocates toStation 2 all the resources it needs and the rest go to Sta-tion 1. The switch in priorities reduced the mortality by10.7% compared with the original policy that prioritizesresources to Station 1. This example demonstrates the im-portance of the real-time management model that alertsthe decision maker to possible changes in the allocationpolicy.
The real-time model considers changes in the envi-ronment and informs the decision maker about recom-mended resource allocation policies. It is adapted to thecommon practice in crisis events, which calls for pe-riodic status assessments for structured decision mak-ing. As is usual for models that support managementdecisions, here also there are many factors that affectactual decisions, which are not accommodated by our
model—for example, capacity utilization at the differ-ent stations, waiting times, availability of other resourcetypes, and the specific medical situation of individualcasualties.
Fig. 6. Optimal resource allocation solutions for time point 0(dotted line) and 240 (solid line).
Minimizing mortality in a mass casualty event 739
7. Summary
Traditional MCE models are based on simulation experi-ments. Although simulation is a valid modeling tool, it onlyprovides limited structural insights into optimal manage-ment policies. We have developed a problem formulationbased on fluid models for MCEs. We discretize time andformulate the problem as a LP that enables finding resourceallocations for different scenarios as well as structural in-sights and policies.
We model two stations where surgeons provide medicaltreatment: a life-saving treatment at the first station andan operation at the second. Based on the relative values ofservice rates, routing probabilities, and mortality rates, ouranalysis has identified two types of optimal allocation poli-cies that can be used. One is a static policy that prioritizesone station over the other, and the second is a mixed policyin which priority is first given to one station and at somefuture time switches to the second.
When a mixed policy is optimal there is no closed-formanalytical solution for the priority switch time, but this iseasily identified by solving a linear optimization problem.Our proposed policies can be easily applied to prepare anemergency plan for reference scenarios. The resulting allo-cations represent guidelines that could be used by a man-ager either in a real-time context or as guidelines on howto prioritize the resources. We developed a rolling horizonapproach for the real-time management of MCEs. This ap-proach, which is based on our fluid modeling frameworkand on management practices for emergency situations, ex-ploits new information about the MCE to create optimalresource allocations. The LP formulation ensures fast solu-tion times—thus, it is practical for use in real-time settings.In MCEs when the uncertainty is high regarding the num-ber of arriving casualties, their treatment rates and otherparameters that are changing over time, the real-time ap-proach is in fact essential.
Our model formulation is consistent with the tactical useof fluid models to approximate transient and loaded servicenetworks. We note that our stylized model serves as a proofof concept under our specific assumptions and limitations;for example, constant mortality rates at each of the stationsand the surgeons as the only limiting resource. To the bestof our knowledge we are introducing mortality rates at atwo-station setting for the first time. However, it is impor-tant to note that the model does not discriminate betweenindividual casualties based on their specific parameters.Moreover, real-time allocation decisions associated with aspecific casualty could be affected by a variety of factorsthat are not considered in our model; e.g., capacity utiliza-tion at the different stations, waiting times, availability ofother resources, individual casualties’ medical condition,etc. Therefore, other and possibly more refined models canbe developed via our approach, sometimes inevitably at thecost of tractable analytical solutions.
Our analysis of numerical examples (based on data ex-tracted from the literature and expert opinions) indicatesthat our approach can lead to optimal or near-optimal so-lutions for minimizing the mortality of casualties.
The stylized model introduced in this article has led tothe development of structural results and also has pro-vided managerial insights into allocation policies. Its pri-mary message concerns guidelines and quantification of thevalue of dynamic resource allocation for the management ofMCEs. The results presented here provide a starting pointfor future research that could be based on expanding ourmodeling scope and testing our policy implications in real-world situations. Analytical extensions can focus on findingthe optimal time in which there are priority changes andon the development of bounds on the differences betweengreedy and optimal policies. Another natural extension isto enhance the model to include other types of MCEs,such as non-conventional MCEs (biological, chemical, nu-clear and radiation), where there are different medical pro-cesses and resources. Finally, we note that we expect ourinsights for the optimal non-switching policies to hold forinfinite horizon, heavy traffic, two-stage tandem systems,with abandonments and flexible servers. Therefore, this re-search provides strong motivation for future research onusing fluid models to support control of management poli-cies for transient queueing networks in heavy traffic.
Acknowledgements
The authors would like to thank Dr. Shlomi Israelit, presentDirector, and Dr. Moshe Michaelson, a former Director, ofthe ED at our partner Rambam Hospital, in Haifa, Israel.We gained a lot from their expertise in MCE managementand from many fruitful discussions that helped set up, per-form, and improve the present research. We gratefully ac-knowledge the contribution of the editorial team that madethis a better research work.
Funding
The work of A.M. has been partially supported by BSFgrants 2005175 and 2008480, ISF grant 1357/08, and theTechnion funds for promotion of research and sponsoredresearch. Some of the research was funded by and car-ried out while A.M. was visiting the Statistics and Ap-plied Mathematical Sciences Institute (SAMSI) of the NSF;the Department of Statistics and Operations Research(STOR), the University of North Carolina at Chapel Hill;the Department of Information, Operations and Manage-ment Sciences (IOMS), Leonard N. Stern School of Busi-ness, New York University; and the Department of Statis-tics, The Wharton School, University of Pennsylvania. Thewonderful hospitality of these institutions is gratefully ac-knowledged and truly appreciated.
740 Cohen et al.
Supplemental Material
Supplemental data for this article can be accessed on thepublisher’s website.
References
Ahn, H., Duenyas, I. and Lewis, M.E. (2002) Optimal control of a two-stage tandem queueing system with flexible servers. Probability inthe Engineering and Informational Sciences, 16, 453–469.
Altay, N. and Green, W.G. (2007) OR/MS research in disaster opera-tions management. European Journal on Operational Research, 175,475–493.
Andradottir, S. and Ayhan, H. (2005) Throughput maximization for tan-dem lines with two stations and flexible servers. Operations Research,53(3), 516–531.
Argon, N.T., Ziya, S. and Righter, R. (2008) Scheduling impatient jobsin a clearing system within sights on patient triage in mass casualtyincidents. Probability in the Engineering and Informational Sciences,22(3), 301–332.
Atar, R., Mandelbaum, A. and Reiman, M.I. (2004) Scheduling a multiclass queue with many exponential servers: asymptotic optimality inheavy traffic. The Annals of Applied Probability, 14(3), 1084–1134.
Aylwin, C.J., Konig, T.C., Brennan, N.W., Shirley, P.J., Davies, G., Walsh,M.S. and Brohi, K. (2006) Reduction in critical mortality in urbanmass casualty incidents: analysis of triage, surge, and resource useafter the London bombings on July 7, 2005. Lancet, 368, 2219–2225.
BBC News. (2012) Argentine train crash: brake warning denied. Avail-able at http://www.bbc.co.uk/news/world-latin-america-17174635(accessed February 27, 2012).
Einav, S., Aharonson-Daniel, L., Weissman, C., Freund, H.R., Peleg,K. and Israel Trauma Group. (2006) In-hospital resource utiliza-tion during multiple casualty incidents. Annals of Surgery, 243(4),533–540.
Green, L.V., Kolesar, P.J. and Whitt, W. (2007) Coping with time-varyingdemand when setting staffing requirements for a service system.Production and Operations Management, 16(1), 13–39.
Hick, J.L., Hanfling, D., Burstein, J.L., DeAtley, C., Barbisch, D., Bog-dan, G.M. and Cantrill, S. (2004) Health care facility and commu-nity strategies for patient care surge capacity. Annals of EmergencyMedicine, 44(3), 253–261.
Hirshberg, A., Frykberg, E.R., Mattox, K.L., and Stein, M. (2010) Triageand trauma workload in mass casualty: a computer model. Journalof Trauma-Injury Infection & Critical Care, 69, 1074–1082.
Hirshberg, A., Holcomb, J.B. and Mattox, K.L. (2001) Hospital traumacare in multiple-casualty incidents: a critical view. Annals of Emer-gency Medicine, 37, 647–652.
Hirshberg, A., Scott, B.G., Granchi, T., Wall Jr., M.J., Mattox, K.L. andStein, M. (2005) How does casualty load affect trauma care in urbanbombing incidents? A quantitative analysis. Journal of Trauma, 58,685–695.
Hirshberg, A., Stein, M. and Walden, R. (1999) Surgical resource utiliza-tion in urban terrorist bombing: a computer simulation. Journal ofTrauma, 47, 545–550.
Hughes, M.A. (1991) A selected annotated bibliography of social scienceresearch on planning for and responding to hazardous materialdisasters. Journal of Hazardous Materials, 27, 91–109.
Jacobson, E.U., Argon, N.T. and Ziya, S. (2012) Priority assignment inemergency response. Operations Research, 60(4), 813–832.
Kellerer, H., Pferschy, U. and Pisinger, D. (2004) Knapsack Problems.Springer-Verlag, Berlin, Germany.
Kosashvili, Y., Aharonson-Daniel, L., Peleg, K., Horowitz, A., Laor,D. and Blumenfield, A. (2009) Israeli hospital preparedness forterrorism-related multiple casualty incidents: can the surge capacity
and injury severity distribution be better predicted? Injury, 40(7),727–731.
Kreiss, Y., Merin, O., Peleg, K., Levy, G., Vinker, S., Sagi, R., et al. (2010)Early disaster response in Haiti: the Israeli field hospital experience.Annals of Internal Medicine, 153(1), 45–48.
Lerner, E.B., Schwartz, R.B., Coule, P.L., Weinstein, E.S., Cone, D.C.,Hunt, R.C., et al. (2008) Mass casualty triage: an evaluation of thedata and development of a proposed national guideline. DisasterMedicine and Public Health Preparedness, 2(1), S25–S34.
Mandelbaum, A., Massey, W.A., Reiman, M.I. and Rider, R. (1999)Time-varying multiserver queues with abandonments and retrials,in Proceedings of the 16th International Teletra Congress, Key, P.and Smith, D. (eds), pp. 355–364.
Mandelbaum, A., Massey, W.A., Reiman, M.I. and Stolyar, A. (1999)Waiting time asymptotics for time varying multiserver queues withabandonment and retrials in Proceedings of the Annual Allerton Con-ference on Communication Control and Computing, pp. 1095–1104.
Mehta, S. (2006) Disaster and mass casualty management in a hospital:how well are we prepared? Journal of Postgraduate Medicine, 52(2),89–90.
Merin, O., Ash, N., Levy, G., Schwaber, M.J. and Kreiss, Y. (2010) TheIsraeli field hospital in Haiti—ethical dilemmas in early disasterresponse. New England Journal of Medicine, 362, e38(1)–e38(3).
Mills, A.F., Argon, N.T. and Ziya, S. (2013) Resource-based patient pri-oritization in mass-casualty incidents. Manufacturing & Service Op-erations Management, 15(3), 361–377.
Oliver, R.M. and Samuel, A.H. (1962) Reducing letter delays in postoffices. Operations Research, 10, 839–892.
Pang, G. and Whitt, W. (2012) The impact of dependent service timeson large-scale service systems. Manufacturing & Service OperationsManagement, 14(2), 262–278.
Paul, J.A., George, S.K., Yi, P. and Lin, L. (2006) Transient modelling insimulation of hospital operations for emergency response. Prehos-pital and Disaster Medicine, 21(4), 223–236.
Sinreich, D. and Marmor, Y. (2004) A simple and intuitive simulationtool for analyzing emergency department operations, in Proceed-ings of the 2004 Winter Simulation Conference, IEEE Publications,Piscataway, NJ, pp. 1994–2002.
Vandergraft, J.M. (1983) A fluid flow model of networks of queues. Man-agement Science, 29(10), 1198–1208.
Waeckerle, J.F. (1991) Disaster planning and response. New EnglandJournal of Medicine, 324, 815–821.
Whitt, W. (2005) Two fluid approximations for multi-sever queues withabandonments. Operations Research Letters, 33, 363–372.
Whitt, W. (2006) Fluid models for multiserver queues with abandon-ments. Operations Research, 54(1), 37–54.
Yom-Tov, G. (2010) Queues in hospitals: queueing networks with reenter-ing customers in the QED regime. Ph.D. Thesis, IE&M, Technion,Israel.
Biographies
Izack Cohen is a visiting lecturer in the Industrial Engineering and Man-agement Faculty at the Technion. He received his B.Sc. in Chemical Engi-neering (1991), his M.Sc. in Materials Engineering (1997), and his Ph.D.in Industrial Engineering and Management (2004). He has managedvarious technological, logistics, and information systems organizationsand technological projects. His research interests include project man-agement, supply chain management, service engineering for healthcare,and innovative maintenance methods.
Avi Mandelbaum is the Benjamin and Florence Free Chair Professor ofOperations Research, Statistics and Service Engineering, at the Faculty ofIndustrial Engineering (IE&M) at the Technion, Israel. He has a B.Sc. in
Minimizing mortality in a mass casualty event 741
Mathematics and Computer Science and an M.A. in Statistics, both fromTel-Aviv University. His Ph.D. is in Operations Research, from CornellUniversity. After graduation he joined the Graduate School of Businessat Stanford University. He left the United States, in 1991 to assume aposition at IE&M. This faculty position, as well as his current researchand application interests, constitutes a convex hull of all the areas inwhich he had been educated. He founded and has been the academicdirector of the Technion IE&M SEELab (SEE = Service EnterpriseEngineering). The SEELab is collecting and maintaining data from
large service operations, which it then prepares to support research andteaching.
Noa Zychlinski has a B.Sc. (Cum laude, 2005) and an M.Sc. (Cum laude,2012) in Industrial Engineering and Management from the Technion,Israel. After graduating from her B.Sc., she worked as a project managerand a team leader in an IT company that develops and implementsorganizational information systems. Her research interests include servicesystems, with focus on healthcare applications.