38
P R E S E N T A I T O N O N C M P A Y SAT - Società Aeroporto Toscano Galileo Galilei - S.p.A Gina Giani – CEO & General Manager Small & Mid Cap Investor Day – Lugano, 28 settembre 2012

P R E S E N T A IT O N
O NC M P A Y
SAT - Società Aeroporto Toscano Galileo Galilei - S.p.A
Gina Giani – CEO & General Manager
Small & Mid Cap Investor Day – Lugano, 28 settembre 2012

1995: Entry of privateshareholders
1998: SAT opens to low-costcarriers: first Ryanair flightfrom Pisa
December 2006:40-year Concession Agreement
1980:SAT starts operating
’80s ‘90s
October 2005: openingof a Ryanair base inPisa.
Summer 1997: Airlines: 4 (only IATA) Destinations: 10 Weekly frequencies.: 137
June 2007:Launch of Pisa-NYC direct flight.
2005 2006 2007
July 2007: listing on Italian Stock Exch.
2009
August 2009:Sign of ENAC-SAT Regulated Tariff Contract..
Summer 2012Airlines: 16 (5 IATA + 11 low cost)Destinations: 78Weekly frequencies: 445
20122008
� SAT is the management company of “Galileo Galilei” Pisa International Airport, the 1st one in Tuscany.
� 40 years concession signed in 2006.
� Outperforming growth: Pisa Airport passenger traffic CAGR 2000-2011, equal to 12,4%, is almost 3 timeshigher than the Italian Airport System one (+4,4%).
PISA AIRPORT PAX (million)
3,01
2,33
2,031,981,65
1,381,25
2000 2001 2002 2003 2004 2005 2006
3,73
2007
3,96
2008
PISA AIRPORT CAGR 2000/2011: +12,4%
2009
4,024,07
2010
ITALIAN AIRPORT SYSTEM CAGR 2000/2011: +4,4%
2011
4,53
SAT Highlights
2

3*Data source: Assaeroporti
ITALIAN REGIONAL AIRPORTin 2011 by international traffic (pax/000)*
Venice
Pisa
6,464
3,210
Bologna 4,111
Napoli 2,636
(+31%)
(+5.9%)
(+7.7%)
(+6.8%)
(**) Excluding Roma and Milan airport systems
Pisa International Airport ranks 3rd
in the Italian Airports International pax traffic ranking 10
THE 6th ITALIAN REGIONAL AIRPORT IN 2011 (pax/000)
9
8
7
6
5
4
3
2
1 8,585 (+25.0%)
6,794 (+7.5%)
5,886 (+6.8%)
4,993 (+14.3%)
5,769 (+3.3%)
4,527 (+11.3%)
3,699 (+7.4%)
3,386 (+12.0%)
3,710 (+4.2%)
3,726 (+ 9.6%)
36,851 (+5.5%)
42,433 (+3.7%)Rome (system)
Milan (system)
Venice
Catania
Naples
Palermo
Bologna
Pisa
Turin
Verona
Cagliari
Bari
148,781 (+6.4%)Total Italian Airports
Pisa International Airport ranks 8th in the Italian Airports passenger traffic ranking and 6th in the
Italian regional airports ranking.
SAT Highlights

4
Exceptionally resilient business model
� The transport demand is normally related to GDP, then sensitive to crisis scenario like theone we are currently facing.
� The traffic results achieved by Pisa Airport over the latest years – despite the difficulteconomic background – confirm the correlation with the company’s strategic choices ratherthan with the GDP’s trend.
11,3%
SAT Highlights
-1,2%
-5,1%
1,5% 0,5%0,40%
-4,20%
1,80% 1,50%
6,4%
1,4%
3,3% (*)
11,3%
-6,0%
-4,0%
-2,0%
0,0%
2,0%
4,0%
6,0%
8,0%
10,0%
12,0%
2008 2009 2010 2011
- Var. % SAT traffic pax- Var. % Euro Area GDP- Var. % Italy GDP
(*) net of «volcan impact»

Traffic Building Marketing Strategies
5

Pisa Airport Catchment Area
Lucca
Livorno
Siena
Arezzo
*Source: 2009 ISTAT data, elaborated by GIS System
PratoPistoia
La Spezia
MassaCarrara
Tuscany: nbr. of inhabitants: 3.707.818
Nbr. of inhabitants by distance from
Pisa Airport:
less than 30’
815.992 nbr. of inhabitants
less than 60’
2.598.717 nbr. of inhabitants
less than 120’
5.444.247 nbr. of inhabitants
Grosseto
less than 1 hour from the airport for “short-haul” flights
less than 2 hours from the airport for “medium and long-haul” flights reaching Genoa and Bologna provinces
6

7
� The “reverse marketing” strategy implemented by SAT hasthe objective of increasing the number of Europeanpassengers travelling to Pisa Airport (“incoming traffic”)and not only the number of passengers departing from itscatchment area (“outgoing traffic”).
Domestic Traffic 53%
InternationalTraffic 47%
“Europe at the mouth of Arno”
BREAKDOWN OF TRAFFIC BY DESTINATION
1997 2011
International Traffic 71,2%
Domestic Traffic 28,8%
We keep Tuscany’s profile high in the world
Pisa International Airport. Sharing Tuscany’s style
Pisa Airport gateway to Tuscany
� Strategic partnerships with airlines in order to developtraffic by promoting Pisa Airport and Tuscany in theairlines’ markets.
AIRLINESTRAFFIC BUILDING
� SAT carried out marketing activities jointly with variousairlines in order to attract more traffic to Pisa
� Minimum levels of passengers, flights and destinations for acertain number of years agreed by SAT and partner airlines
CO-MARKETING AND CONSULTING AGREEMENTS
“Reverse Marketing” Strategy

16 operating carriers:
2 Home base carriers
1 Intercontinental carrier
4 “hub” carriers
9 “point-to point” carriers
78 destinations(11 domestic/67 International)
445 weekly frequencies
8
Summer 2012: scheduled pax destinations
9 new destinations
23 markets served with direct scheduled flights� Albania� Belgium � Cyprus� Czech Republic� Denmark� France� Germany� Greece� Hungary� Ireland� Italy� Malta� Netherlands� Norway� Poland� Portugal� Romania� Spain� Sweden� United Kingdom
� Morocco� Russian Federation� Unites States

Markets’ broad diversification (*)
1998 2008 2009 2010 2011
United Kingdom 295.749 1.006.486 918.087 839.578 855.334
Spain 10.609 377.316 326.158 493.885 601.758
France 39.671 329.776 342.223 318.002 385.927
Germany 48.346 410.585 398.707 329.623 313.184
Netherlands - 178.294 192.853 169.777 176.016
Belgium - 136.873 138.533 134.626 144.248
Scandinavian countries - 122.651 127.819 150.491 135.447
Albania 41.545 43.344 55.227 95.126
Romania 26.488 30.332 67.078 85.106
Morocco 18.213 59.891 63.270
Greece 13.196 35.894
Ireland - 86.146 79.642 54.840 57.960
U.S.A. - 67.256 59.238 48.418 33.448
Italy 534.174 937.665 1.089.645 1.058.388 1.291.577
* scheduled flights 9

10
Operations infrastructure� Two runways:
– main runway (2.993 metres): currently used for take-off and landing
– secondary runway (2.792 metres): used mainly as a taxi-ing route to the main runway; fully operational as 2nd runway for landing
and take-off from Apr2010
� 21 a/c positioning stands
� 1 loading bridge
� Operational hours: 19 hrs (closed from 12.00 p.m. until 5 a.m.)
� Pisa APT can be used by all aircraft types
� Current min aircraft turnaround times: 25 minutes
� NO environmental restrictions
� ICAO Category: 4E
� ILS category: 1
1st runway
2nd runway
Best runway system in central Italy after Rome Fiumicino
Airport
21 a/c positioning stands

11
Contratto di Programma/Regulated Charges Contract
The Italian Airport Sector has always been characterized by high levels ofregulatory risk.
August 2009: SAT is the first Italian operator to have its Contratto diProgramma/Regulated Charges Contract approved by ENAC.
Regulated aviation-tariffs remunerate SAT’s operating expenses andinvestments for aviation-related activities.
Contratto di Programma
Visibility on airport charges dynamics

12
Non Aviation Development Strategies

13
“Commercial” Non Aviation Revenues (*): 2000 - 2011
Passengers“Commercial” Non Aviation revenues
Non Aviation Development Strategies
Descrizione 2000 2001 2002 2003 2004 2005 2006 2007 2008 2009 2010 2011
Passengers (Nbr) 1.246.807 1.378.322 1.654.570 1.982.897 2.031.890 2.334.843 3.014.656 3.725.770 3.963.717 4.018.662 4.067.012 4.547.197
Total N.A. revenues (€uro)
3.644.400 4.191.154 4.820.134 5.839.175 6.198.729 7.172.941 10.055.584 13.156.412 14.405.159 15.511.477 15.801.548 15.890.647
0
1.500.000
3.000.000
4.500.000
6.000.000
7.500.000
9.000.000
10.500.000
12.000.000
13.500.000
15.000.000
16.500.000
18.000.000
2000 2001 2002 2003 2004 2005 2006 2007 2008 2009 2010 2011
Year 2000 2011 ∆∆∆∆ %
Revenues (€) 3.644.400 15.801.721 336%
Passengers 1.246.807 4.547.197 265%
(*) “Non Aviation” business activities related to: Parking,Advertising, Retail, Food, Car Rental, Real Estate Sub-concessionand other kind of subconcession.

SAT manages all existing landside and airside commercial activities inside Galilei Airport premises through sub-concession granted by
third parties and/or direct management.
• Catering (bars, restaurants)
• Retail
• Car rental
• Car wash
• Tenant Sub-concessions
• Petrol station
• Vip Lounge
• Others
• P1 “West” Car Park
• P2 “Multilevel” Car Park
• P3 “Short-stay” Car Park
• P4 ” East – Long-term” Car Park
•Advertising
• Business Centre
• Welcome desk
• Newsagent (Landside)
Commercial activities
Direct managementSub-concession
Commercial activities
14

15
Galilei Airport is the main gateway to Tuscany and, as such, represents the first and last“taste” of the Region, promoting prodocts, as well as its artistic and cultural contents,actually its style of life.
Galilei Airport, a showcase for Tuscany
Non Aviation Development Strategies - Food & Retail
Type/Area 2007 2011 2012
Retail Landside 16 14 17
Retail Airside 5 9 8
Food 5 11 12
Total 26 34 37

16
Pisa International Airport at a glance
� Over 4.5 million passengers (2011)
� 15.000 visitors per day
� 2.500 staff (500 SAT)
� Cargo terminal: 6,300 sqm
� 2 cargo scheduled airlines
� Passenger terminal: 20,700 sqm
� 16 passengers scheduled airlines
� Apron: 170.000 sqm
� 21 parking stands
� 2 runways
� Pisa Airport railway station
� 5 on-airport car parks
� Over 3,100 car parking spaces
� Car rental terminal (3rd in Italy per nbr. rented cars)
� 10 leading rental car companies
� Over 1,500 parking spaces
� 100 sub-concessionary companies
� 25 shops
� 12 food & beverage

17
SAT’s results

Pisa Airport pax traffic figures
18
Pisa Airport Pax ( mln)
CAGR 2009/2011: +6,13%

Key financials
EBITDA (€ mln) EBIT (€ mln)
% Revenues
10,6812,57
14,58
4,886,12
0
5
10
15
2009 2010 2011 1H2011 1H2012
+25,3%
17,2%17,8%
19,6%
15,1%
% Revenues
CAGR 2009/2011: +16,8%
18,6%
PBT (€ mln)
2,461,85
7,81
6,505,81
0
2
4
6
8
2009 2010 2011 1H2011 1H2012
CAGR 2009/2011: +15,9%
+33,1%
9,3%
9,2%10,5%
5,7%7,5%
% Revenues
2,902,09
8,48
6,826,16
0
2
4
6
8
2009 2010 2011 1H2011 1H2012
8,8%
CAGR 2009/2011: +17,3%
+38,6%
9,9%
9,7%
11,4%
6,5%
% Revenues
NET INCOME (€ mln)
1,401,03
4,35
3,543,11
0
1
2
3
4
5
2009 2010 2011 1H2011 1H2012
CAGR 2009/2011: +18,3%
+35,9%
5,0%5,0%
5,9%
3,2%4,2%
% Revenues
19

Revenues
20
Operating revenues continued growth
TOTAL REVENUES (€ mln)
32,9332,33
74,2970,6262,19
0
20
40
60
80
2009 2010 2011 1H2011 1H2012
CAGR 2009/2011: +9,3%
+1,9%
OPERATING REVENUES (€ mln)SERVICES CONSTRUCTION
REVENUES (€ mln)
30,6928,57
65,0960,17
56,11
10
30
50
70
2009 2010 2011 1H2011 1H2012
CAGR 2009/2011: +7,71%
+7,4%
2,253,76
9,2010,45
6,08
0
2
4
6
8
10
12
2009 2010 2011 1H2011 1H2012
CAGR 2009/2011: +23,01%
-40,2%

Operating revenues
Solid growth driven by pax traffic development
Positive perfomance despite the impact of economic crisis on consumption
AVIATION OPERATING REVENUES(€ mln)
NON AVIATION OPERATING
REVENUES (€mln)
21,8720,73
46,9942,20
37,78
0
10
20
30
40
50
2009 2010 2011 1H2011 1H2012
CAGR 2009/2011: +11,52%
+5,5%
8,827,84
18,1017,9818,32
5
10
15
20
2009 2010 2011 1H2011 1H2012
+12,4%
21

22
“Non Aviation” operating revenues
€/000 1H2012 1H2011 ∆∆∆∆ ∆∆∆∆%
Parking 1.947 1.993 -46 -2,3%
Car rental 1.908 1.612 296 18,4%
Retail 1.036 994 43 4,3%
Food 941 760 181 23,8%
Advertising 628 557 70 12,6%
+10,3%
Non Aviation Operating Revenues/Pax (€)

23
Laundry (30 mq)
Pharmacy (110 mq)
Underwear Shop (65 mq)
Wine Bar/Sandwich Bar (105 mq)
New Commercial activities
Rearrangement of the West Side of the Passengers Terminal
+310 sqmcommercial
landside areas
Total investment: € 1,5 millions
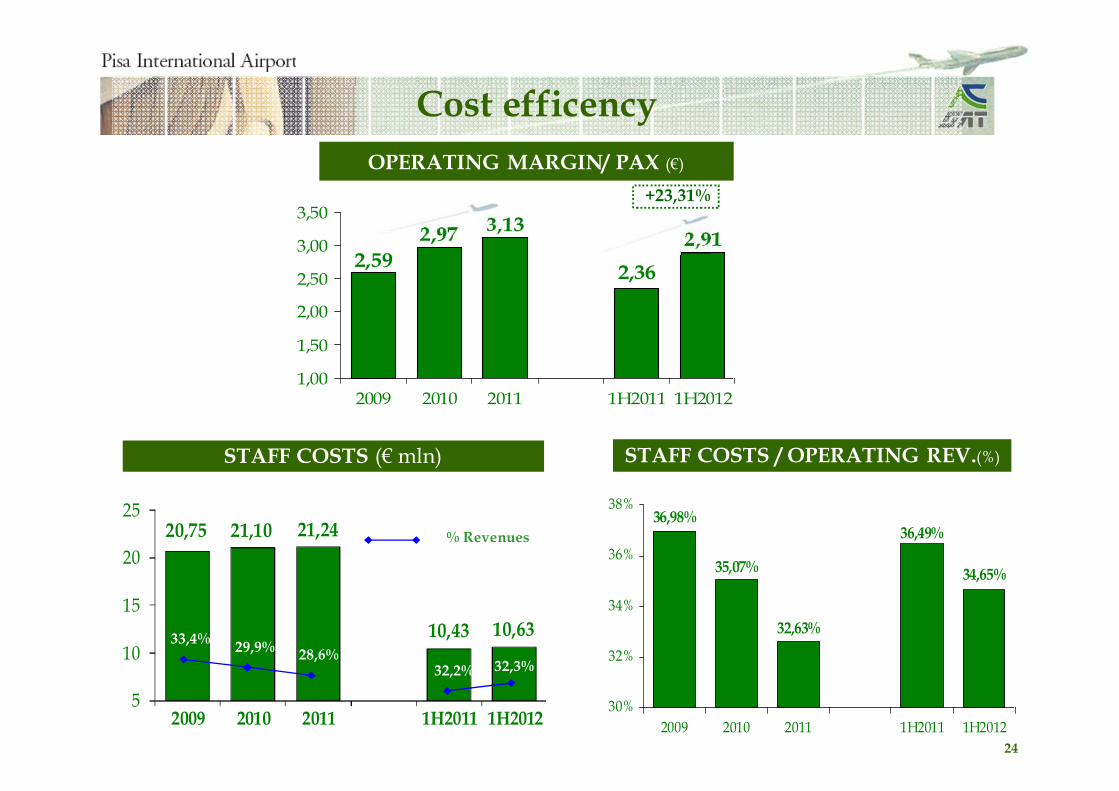
Cost efficency
OPERATING MARGIN/ PAX (€)
STAFF COSTS (€ mln)
2,91
2,36
3,132,97
2,59
1,00
1,50
2,00
2,50
3,00
3,50
2009 2010 2011 1H2011 1H2012
+23,31%
20,75 21,10 21,24
10,43 10,63
5
10
15
20
25
2009 2010 2011 1H2011 1H2012
33,4%29,9%
28,6%32,2% 32,3%
% Revenues
32,63%
35,07%
36,98%36,49%
34,65%
30%
32%
34%
36%
38%
2009 2010 2011 1H2011 1H2012
24
STAFF COSTS / OPERATING REV.(%)

25
UTA / EFT (thousands) PASSENGERS / EFT (thousands)
Productivity improvement
5,375,22
11,5210,3910,11
0
2
4
6
8
10
12
14
2009 2010 2011 1H2011 1H2012
CAGR 2009/2011: +6,76%
+2,87%
5,285,13
11,3310,229,96
0
2
4
6
8
10
12
2009 2010 2011 1H2011 1H2012
CAGR 2009/2011: +6,67%
+2,92%
26
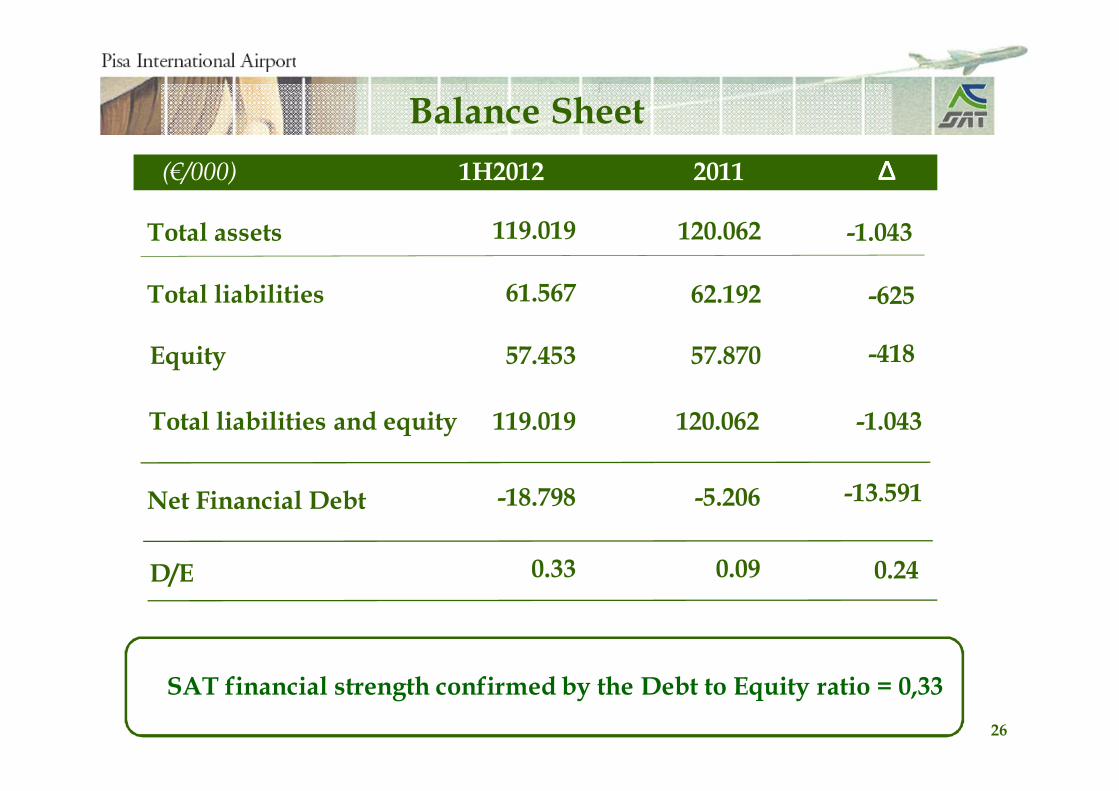
Total assets
Total liabilities
Total liabilities and equity
Net Financial Debt
119.019
62.192
120.062
-5.206
120.062
61.567
119.019
-18.798
Equity 57.87057.453
1H2012(€/000) 2011
Balance Sheet
∆∆∆∆
-1.043
-625
-418
-1.043
-13.591
D/E 0.090.33 0.24
SAT financial strength confirmed by the Debt to Equity ratio = 0,33

The People Mover Project and SAT Real Estate Strategy
27

28
3 MAIN EFFECTS
1. Improve rail accessibility from/to Florence and from/to Central Italy(Pisa is the second railway station in Tuscany in terms of passengers andconnections);
2. Exploit a valuable area to be used as City Gate along with thecommercial expansion of “Aerotropolis” (with a service platform opento passengers and inhabitants similar to the Schiphol Plaza but with aregional airport size);
People Mover Project
Target: to replace the rail connection between Pisa Airport and PisaMain Railway Station with a fully automated shuttle service.
3. Revaluation of SAT’s real estate properties.

2929
Length: approx. 1,40 km.
People Mover track: Overhead arrival to the Terminal
People Mover ground level route.
Pisa Airport railway station.
12
4
1
Control room and mantainance
Parking modal interchange.
2
Pisa Main Railway Station.
3
4
3 Length: approx. 0,44 km.People Mover overhead route.
People Mover Project

30
New available area
People Mover Project

31
Replacement of the rail connection betweenPisa Airport and Pisa Main Railway Stationwith a fully automated shuttle service.
Improvement of the rail accessibility from/to Florenceand from/to Central Italy (Pisa is the second railwaystation in Tuscany in terms of passengers andconnections).
People Mover Project

32
The People Mover Project
STAKEHOLDERS: SAT, Region Tuscany, Province of Pisa, Municipality of Pisa, RFI Italian StateRailway Company S.p.A. e FS Urban Systems S.p.A.
ESTIMATED COSTS: approx. 82 million euro, 27,8 of which provided by Tuscany Region throughEU funds. The remaining amount will be covered by the awarding company, which will carry it outthrough a “project financing” and run it for at least 40 years.
SAT’S ROLE: on the basis of an Agreement Programme(*), which does not include any financialcommitment for the Company, SAT is committed to make available all properties involved by theproject, in order to allow its implementation as per agreed schedule. SAT has also signed an agreementwith the Municipality of Pisa and PisaMo, providing its own staff for the project development.
(*) agreement by which all partecipating subjects coordinate their activities in order to fulfil the same project.
EXECUTING COMPANY: PisaMo S.p.A. (controlled by the Municipality of Pisa).
INSTALLATION DEADLINE: the People Mover must be completed by Dec. 31st 2015 .
NEXT STEPS: Contract drawing up and beginning of design by October 2012. Construction kick-off in 2013.
COMPETIVE TENDER: on 28th March 2012 it has been awarded the competitive tender by PisaMoS.p.A. to leave the design, making and management of the People Mover. Contractor: Leitner S.p.A.intemporary joint venture with Società Italiana per Condotte d’Acqua S.p.A., Inso S.p.A. and AgudioS.p.A.

� Traffic building strategy (reverse marketing) based on the cultural and historical appealof the Region Tuscany.
� Exceptionally resilient business model: growth despite economic crisis and recentextraordinary events
� The Contratto di Programma/Regulated Charges Contract ensuring solid basis ofrevenues for the future airport development.
� Strong partnerships with airlines (e.g. Ryanair agreement until 2016).
� A runway system (2) able to accommodate all types of aircraft, ensuring businesscontinuity.
� Non Aviation revenues allowing Reverse Marketing initiatives.
� People Mover Project (“The airport inside the railway station/The railway station insidethe airport”)
� Opportunity to develop collateral airport related business activities as service platformopen to passengers and inhabitants – “City Gate”
Investment case
33

Q & A
34
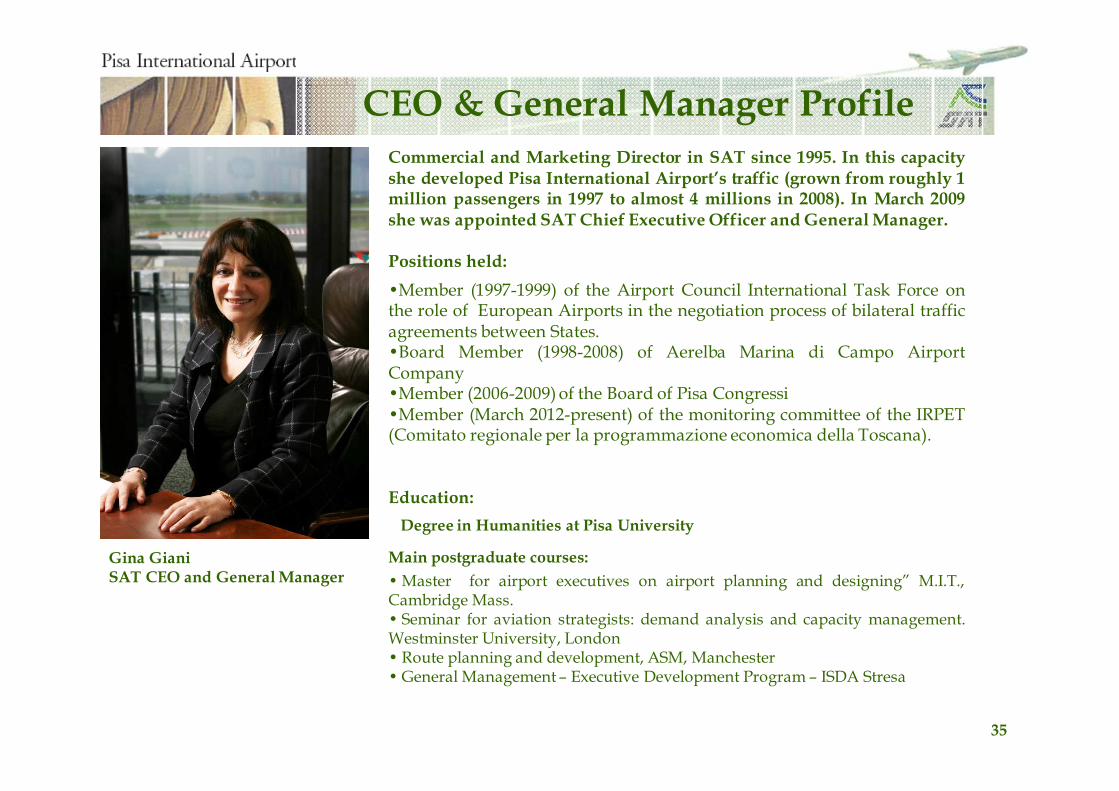
CEO & General Manager Profile
Commercial and Marketing Director in SAT since 1995. In this capacityshe developed Pisa International Airport’s traffic (grown from roughly 1million passengers in 1997 to almost 4 millions in 2008). In March 2009she was appointed SAT Chief Executive Officer and General Manager.
Positions held:
•Member (1997-1999) of the Airport Council International Task Force onthe role of European Airports in the negotiation process of bilateral trafficagreements between States.•Board Member (1998-2008) of Aerelba Marina di Campo AirportCompany•Member (2006-2009) of the Board of Pisa Congressi•Member (March 2012-present) of the monitoring committee of the IRPET(Comitato regionale per la programmazione economica della Toscana).
Education:
Degree in Humanities at Pisa University
Main postgraduate courses:
• Master for airport executives on airport planning and designing” M.I.T.,Cambridge Mass.• Seminar for aviation strategists: demand analysis and capacity management.Westminster University, London• Route planning and development, ASM, Manchester• General Management – Executive Development Program – ISDA Stresa
Gina GianiSAT CEO and General Manager
35

36
Region of Tuscany 1.666.250 16,90 31
Province of Pisa 913.850 9,27 17
Municipality of Pisa 833.150 8,45 15
Pisa Chamber of Commerce 775.700 7,87 14
Province of Leghorn 233.350 2,37 4
Florence Chamber of Commerce 140.000 1,42 3
Province of Lucca 102.650 1,04 2
Province of Florence 102.650 1,04 2
Municipality of Leghorn 73.250 0,74 1
Municipality of Florence 68.800 0,70 1
Livorno Chamber of Commercio 30.800 0,31 1
Total shareholders’ agreement 5.453.974 55,32 100,0
Shareholders Nr. share% share capital
% shareholders agreement
Foundation Cassa di Risparmio di Pisa 513.524 5,21 9
SAT Shareholders
� On 12th September 2011, Finatan S.p.A., Fada S.p.A and Savimag S.r.l. ( 23,39% as a whole) have drawn up a three-year lastingshareholders’ agreement.
� 3 years lasting shareholders' agreement signed on July 20th 2010 is currently holding 55.32% of SAT's share capital.

CONTATCS
37
Gabriele Paoli – Investor relator
Tel. +39 050 849 240
SAT - Società Aeroposto Toscano G. Galilei - S.p.A.
Market MTA
ISIN IT0000214293
Price (25/9/2012) € 8,51
1M performance +5,06%
6M performance -0,93%
1Y performance -4,92%
SAT: 1Y performance (as at 25th sept 2012)
Stock data & peformances

38
This document has been prepared by SAT – Società Aeroporto Toscano Galileo Galilei – S.p.A. solely for informationpurposes and for use in presentations of the Company. The information contained herein has not been independentlyverified. No representation or warranty, express or implied, is made as to, and no reliance should be placed on, thefairness, accuracy, completeness or correctness of the information or opinions contained herein. None of the company,its affiliates, or its representatives shall have any liability whatsoever (in negligence or otherwise) for any losshowsoever arising from any use of this document or its contents or otherwise arising in connection with thisdocument.This document includes forward-looking statements. These forward-looking statements express current expectationsand projections about future events, involve predictions and are subject to a number of factors that may influence theaccuracy of the statements and the projections upon which the statements are based.Prospective investors are cautioned not to place undue reliance on these forward-looking statements because theyinvolve known and unknown risks, uncertainties and other factors which are, in many cases, beyond our control.In light of these risks, uncertainties, and assumptions, the forward-looking events discussed in this document mightnot occur and no assurance can be given that the anticipated results will be achieved.Actual events or results may differ materially as a results of risks and uncertainties facing SAT – Società AeroportoToscano – S.p.A.. Such risks and uncertainties include, but are not limited to increased competition and regulatory,legislative and judicial developments that could cause actual results to vary materially from future results indicated,expressed or implied in such forwardlooking statements.Moreover, any statements regarding past trends or activities should not be taken as a representation that such trendsor activities will continue in the future.This document does not constitute an offer or invitation to purchase or subscribe for any shares and no part of it shallform the basis of or be relied upon in connection with any contract or commitment whatsoever.The executive responsible for the drafting of the company’s accounting and corporate documents, Marco Forte, herebydeclares pursuant to clause 2, art.154 bis, decree law 58/1998, that the accounting information in this release is in linewith the Company’s accounting records and registers.
Disclaimer


