o succeed in providing services, the quality of services should meet users’ satisfaction. This is a motivation to study the relationship between the service quality and the real perceived quality of users, which is commonly referred to as the quality of experience (QoE). However, most of existing QoE studies that focus on video-on-demand or IPTV services analyze only the influence of network behaviors to video quality. This paper focuses on P2P video streaming services, which are becoming a significant portion of Internet traffic, and pays attention to the change of users’ perception with the adjustment of objective factors as well as network behaviors. We propose to use mean opinion score and peak signal to noise ratio methods as QoE evaluations to consider the effect of the chunk loss ratio, the group-of-picture size, and the chunk size. The experimental results provide a convincing reference to build the complete relationshipbetween objective factors and QoE. We believe that this assessment will contribute to study a new service quality evaluation mechanism based on users’ satisfaction in the futur
15
International Journal of Computer Networks & Communications (IJCNC) Vol.7, No.3, May 2015 DOI : 10.5121/ijcnc.2015.7305 59 CORRELATING OBJECTIVE FACTORS WITH VIDEO QUALITY EXPERIENCED BY END USERS ON P2PTV Huong Pham-Thi 1 , Hiep Hoang-Van 2 , and Takumi Miyoshi 1 1 Graduate School of Engineering and Science, Shibaura Institute of Technology, Saitama, Japan 2 School of Information and Communication Technology, Hanoi University of Science and Technology, Hanoi, Vietnam ABSTRACT To succeed in providing services, the quality of services should meet users’ satisfaction. This is a motivation to study the relationship between the service quality and the real perceived quality of users, which is commonly referred to as the quality of experience (QoE). However, most of existing QoE studies that focus on video-on-demand or IPTV services analyze only the influence of network behaviors to video quality. This paper focuses on P2P video streaming services, which are becoming a significant portion of Internet traffic, and pays attention to the change of users’ perception with the adjustment of objective factors as well as network behaviors. We propose to use mean opinion score and peak signal to noise ratio methods as QoE evaluations to consider the effect of the chunk loss ratio, the group-of-picture size, and the chunk size. The experimental results provide a convincing reference to build the complete relationship between objective factors and QoE. We believe that this assessment will contribute to study a new service quality evaluation mechanism based on users’ satisfaction in the future. KEYWORDS Quality of service, Quality of experience, Peer-to-peer streaming 1.INTRODUCTION For quality evaluation, the quality of service (QoS) is a popular measurement index that is taken into consideration by the service providers and network carriers. In fact, QoS is evaluation based on the network parameters such as delay, jitter, and allocated bandwidth to assess the service quality. Service providers can control and manage QoS parameters. Hence, the quality of applications will be considered from the viewpoint of QoS. Although the QoS is good enough to meet requirements, the perceived quality of users does not necessarily satisfy users’ expectation in real systems. In this case, the QoS parameter no longer becomes the criterion to evaluate service satisfaction. Accordingly, we need another quality measurement deriving from users’ viewpoint to exactly reflect the experience and feeling of customers regarding the service quality. To overcome the limitation of QoS schemes, research community has been continuously studying new methods for solving the problems. It is the reason why the quality of experience (QoE) has been proposed. Known as a quality measurement index from the viewpoint of end users, the QoE is the best method to evaluate users’ feeling as well as their satisfaction with the applications. Therefore, studying on the QoE field will play an important role in not only improving the service quality but enhancing the system ability to respond to the feedbacks from users.
Transcript
International Journal of Computer Networks & Communications (IJCNC) Vol.7, No.3, May 2015
DOI : 10.5121/ijcnc.2015.7305 59
CORRELATING OBJECTIVE FACTORS WITH VIDEO
QUALITY EXPERIENCED BY END USERS ON P2PTV
Huong Pham-Thi1, Hiep Hoang-Van
2, and Takumi Miyoshi
1
1 Graduate School of Engineering and Science, Shibaura Institute of Technology,
Saitama, Japan 2School of Information and Communication Technology, Hanoi University of Science
and Technology, Hanoi, Vietnam
ABSTRACT
To succeed in providing services, the quality of services should meet users’ satisfaction. This is a
motivation to study the relationship between the service quality and the real perceived quality of users,
which is commonly referred to as the quality of experience (QoE). However, most of existing QoE studies
that focus on video-on-demand or IPTV services analyze only the influence of network behaviors to video
quality. This paper focuses on P2P video streaming services, which are becoming a significant portion of
Internet traffic, and pays attention to the change of users’ perception with the adjustment of objective
factors as well as network behaviors. We propose to use mean opinion score and peak signal to noise ratio
methods as QoE evaluations to consider the effect of the chunk loss ratio, the group-of-picture size, and the
chunk size. The experimental results provide a convincing reference to build the complete relationship
between objective factors and QoE. We believe that this assessment will contribute to study a new service
quality evaluation mechanism based on users’ satisfaction in the future.
KEYWORDS
Quality of service, Quality of experience, Peer-to-peer streaming
1.INTRODUCTION
For quality evaluation, the quality of service (QoS) is a popular measurement index that is taken
into consideration by the service providers and network carriers. In fact, QoS is evaluation based
on the network parameters such as delay, jitter, and allocated bandwidth to assess the service
quality. Service providers can control and manage QoS parameters. Hence, the quality of
applications will be considered from the viewpoint of QoS. Although the QoS is good enough to
meet requirements, the perceived quality of users does not necessarily satisfy users’ expectation
in real systems. In this case, the QoS parameter no longer becomes the criterion to evaluate
service satisfaction. Accordingly, we need another quality measurement deriving from users’
viewpoint to exactly reflect the experience and feeling of customers regarding the service quality.
To overcome the limitation of QoS schemes, research community has been continuously studying
new methods for solving the problems. It is the reason why the quality of experience (QoE) has
been proposed. Known as a quality measurement index from the viewpoint of end users, the QoE
is the best method to evaluate users’ feeling as well as their satisfaction with the applications.
Therefore, studying on the QoE field will play an important role in not only improving the service
quality but enhancing the system ability to respond to the feedbacks from users.
International Journal of Computer Networks & Communications (IJCNC) Vol.7, No.3, May 2015
60
In general, service providers desire to optimize their network resources while users would like to
experience good quality. For this reason, both controlling QoS and determining the way of
effective QoE management are necessary. QoE, however, is subjective and depends on individual
users. This raises a challenge how service providers manage and quantify this subjective factor.
To address this issue, many approaches have been introduced for multimedia services, especially
video services [1]. A typical approach, which has been studied in many literatures and has
interested research community, is to obtain the relationship between QoS metrics and QoE. It can
be said that QoS is feasible to control and manage because it includes absolutely technical
metrics. In addition, most of the QoS metrics will influence the QoE of end users. Based on this
relationship, the providers can manage the network conditions throughout information related to
QoS metrics and also quickly evaluate the QoE information of users. It means that the providers
not only control and guarantee good QoE of end users but also keep good network performance
and the optimization of network resources. However, finding out the correlation of the service
quality and QoE for multimedia services is very complex, especially for P2P services because of
their distributed features. Hence, it is strongly required to achieve a good correlation between the
service quality and QoE, which accurately describes users’ perception on P2P systems in general
and P2PTV systems in particular.
To understand the QoE and the relationship between the service quality and QoE, most existing
studies focus on the effect of network metrics to the perceived quality. According to ITU-T
recommendation P.10/G.100 [2], QoE is the overall acceptability of an application or a service, as
perceived subjectives by the end users. This document also shows that there are many factors
affecting to QoE such as client, terminal, network, and services infrastructure. Furthermore, QoE
also depends on each user because overall acceptability may be influenced by users’ expectations
and context. However, most studies just focus on the effect of network behaviors on layer 3 and
lack the effect of many factors from other aspects [3]-[7]. Moreover, these studies were based on
some objective quality metrics to evaluate QoE such as Media Delivery Index (MDI), Moving
Pictures Quality Metric (MPQM), Structural Similarity Index (SSIM) and Video Quality Metric
(VQM). Although these methods are feasible to apply on studies and bring some positive results,
they do not directly reflect the perceived quality of users.
For this reason, it is necessary to consider QoE from multiple aspects by subjective tests along
with the impact of network factors. In this study, we consider the effect of two typical factors, a
chunk loss ratio and a chunk size, on the perceived video quality of users. These are important
parameters of the P2P data communication. In addition, as an important element of video
sequence that also affects to the quality, a group-of-picture (GOP) size will be studied. Our
consideration focuses on the factors that are major factors affecting to QoE or have not mentioned
in previous studies yet. A subjective evaluation based on mean opinion score (MOS) method is
used to assess QoE by a test panel of real users. On the other hand, an objective evaluation is also
used to evaluate users’ perception by using PSNR method.
In this paper, we discuss and investigate the effect of not only network layer factors but also
multimedia characteristics, which must be considered in the mapping process between objective
factors and QoE. The impact of these factors on perceived QoE can be proved by subjective tests.
This study contributes to consider QoE from more aspects than previous studies, which just focus
on technical aspects or network effects. Our contribution in this paper is especially on the P2PTV,
which is a potential system and needs to be assessed the influence to users’ QoE. We set up our
simulation and select QoE measurements based on the previous research on QoE. We then
practically investigated several objective factors affecting to QoE on P2PTV network. Our aims
are to analyze the influence of the factors to user experience and to partly build the relationship
between QoE and objective factors for P2PTV systems. As the experimental results, we found:
International Journal of Computer Networks & Communications (IJCNC) Vol.7, No.3, May 2015
61
- A mapping function between chunk loss ratio and QoE by subjective tests with high
correlation with user perception.
- The effect of chunk size and GOP size to perceived video quality of end users.
The remaining of this paper is structured as follows. In the next section, we overview some
related works. In section 3, we present the quality of experience and highlight some typical
approaches for QoE evaluation. We continuously discuss to choose the suitable method in this
context for experimental tests. Section 4 describes the detail of experiments and evaluation
results. Section 5 discusses the advantage and disadvantage of our works. Finally, we show the
conclusion and future work in Section 6.
2. RELATED WORKS
Nowadays, many studies have been interested in the effect of parameters to the quality of
experience for video streaming services. Some studies investigate the QoS/QoE relationship on
IPTV [3]-[7]. Kim et al. [3] propose a method to numerically evaluate QoE of IPTV services by
using QoS parameters measured in the network layer and obtain the QoS/QoE correlation analysis
results. In this research, the authors show a function between QoE and QoS parameters including
packet loss, burst level, packet jitter, packet delay, bandwidth, and GOP length. The weighted
value of each metric is based on the recommendation standards in ITU-T Y.1541 [4] and DSL
Forum [5]. The study shows the positive results on IPTV services. However, the proposal is
difficult to apply for other services due to the lack of methods how to select suitable weighted
values.
Truong et al. [6] propose to build up an intelligent QoE control system by adjusting QoS
parameters. It means that a service system can quickly react with customers’ perception while
using the service. To approach this target, the authors studied the mapping functions between
QoS and QoE. In this research, the authors carefully considered the influence of QoS parameters
to the changing behavior of users’ satisfaction by using both MOS method and VQM. As the
results, they show the relationship between MOS and packet loss rate, delay, and jitter for IMS-
based IPTV services. The authors also try to study a complete relationship between QoS
parameters and QoE [7]. This research allows to adjust QoS parameters based on the service
perception periodically sent from users. The methodology used to analyze QoE in this study is
feasible to apply for other services.
Some other QoE studies were done on P2PTV systems [8]-[12]. In [8], Rossi et al. performed
simulations to compare different network-aware P2PTV systems. The study considered many
various algorithms such as chunk selection, topology management, content availability, overlay
topology, host capacity, and path latency. EvalVid tool [9] is used to evaluate video quality by
using PSNR as a QoE metric. The results show that the signaling error probability can
significantly affect to QoE that is expressed by the average PSNR value.
In [10], Fortuna et al. presented a systematic performance analysis of pull-based P2P video live
streaming systems. This research provides guidelines for the design of the overlay topology and
the chunk schedulers. The authors propose a realistic simulative P2P model that expresses the
impacts of access-line bandwidth, network latencies, and video properties while still guaranteeing
a good scalability for the system. The authors then investigated the influence of chunk scheduling
algorithms to QoE on this system. The results show that it is possible to improve users’ QoE by
International Journal of Computer Networks & Communications (IJCNC) Vol.7, No.3, May 2015
62
carefully designing the overlay topology and prioritizing chunks. However, this study also uses
only PSNR as a QoE metric.
In other researches about QoE problems on P2PTV systems [11], [12], the authors considered the
effects of chunk scheduling algorithms, media encoding, and network condition on the perceived
quality. All the proposed algorithms were performed to evaluate quality by using subjective
quality metrics such as PSNR and SSIM.
As mentioned above, there are many proposals on the relationship between network parameters
and QoE for multimedia services. Most existing QoE studies for video streaming services are
based on IPTV systems, and typical ones were introduced as the requirements for QoE in IPTV
by ITU-T FG-IPTV group and ITU-T SG12. For P2PTV context, most studies focus on the
impact of the scheduler or the topology on the video quality by using objective methods such as
PSNR, VQM, and SSIM [8]-[12]. However, these methods are difficult to reflect actual user
satisfaction about perceived quality. This is a motivation of this study to investigate the impacts
of objective parameters to QoE by using a subjective method such as MOS, which is based on a
human factor reflecting better user perception. Our study considers the effect of objective factors
including chunk loss ratio, GOP size, and chunk size in the domain of P2PTV system. The
purpose of the study is to meet wider user expectations by serving a good correlation with
subjective ratings and low computational complexity to be feasibly applied to applications.
3. QOE FOR VIDEO SERVICES ON P2P NETWORKS
3.1. The Quality of Experience
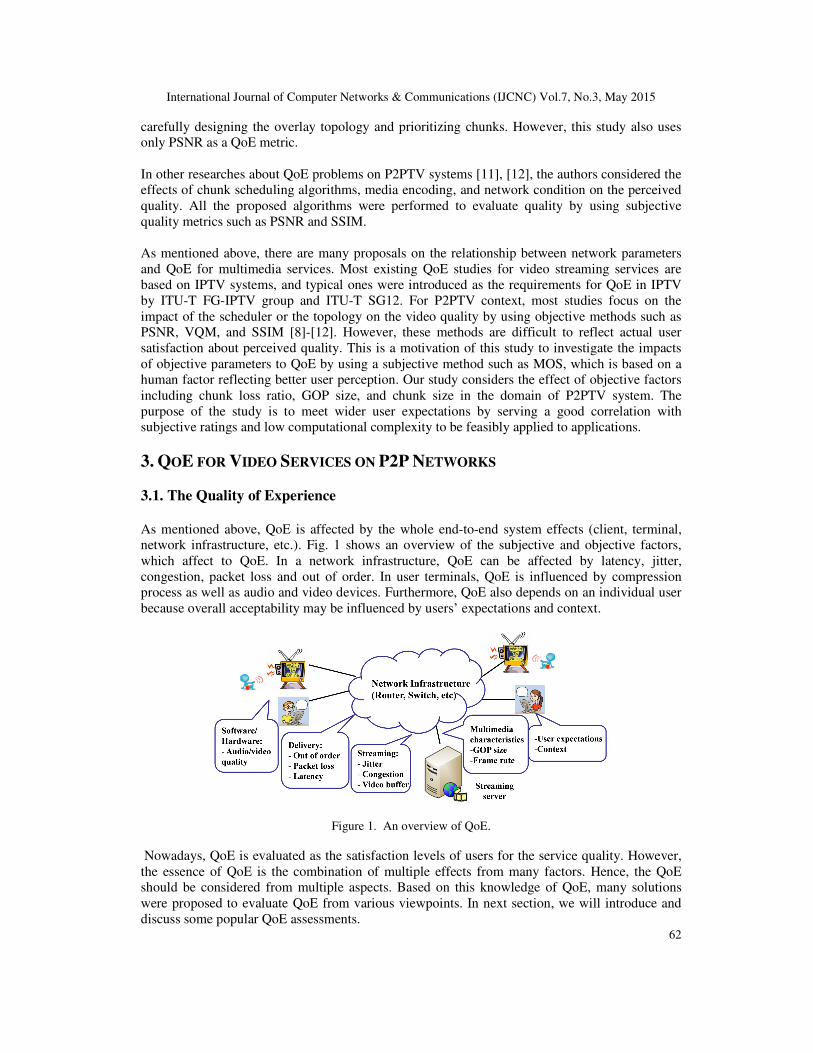
As mentioned above, QoE is affected by the whole end-to-end system effects (client, terminal,
network infrastructure, etc.). Fig. 1 shows an overview of the subjective and objective factors,
which affect to QoE. In a network infrastructure, QoE can be affected by latency, jitter,
congestion, packet loss and out of order. In user terminals, QoE is influenced by compression
process as well as audio and video devices. Furthermore, QoE also depends on an individual user
because overall acceptability may be influenced by users’ expectations and context.
Figure 1. An overview of QoE.
Nowadays, QoE is evaluated as the satisfaction levels of users for the service quality. However,
the essence of QoE is the combination of multiple effects from many factors. Hence, the QoE
should be considered from multiple aspects. Based on this knowledge of QoE, many solutions
were proposed to evaluate QoE from various viewpoints. In next section, we will introduce and
discuss some popular QoE assessments.
International Journal of Computer Networks & Communications (IJCNC) Vol.7, No.3, May 2015
63
3.2. QoE Measurements and Analysis Approaches
Recently, many approaches have been proposed to evaluate QoE and many of them focused on
video streaming applications [1], [13]-[17]. In this study, we introduce two popular approaches
that are based on the content inspection and the nature of QoE.
In the first approach, QoE measurements can be defined as full-reference (FR), reduced-reference
(RR) and no-reference (NR) methods. FR method uses information from both the original video
at the source and received video by users to assess the perceived quality. RR method evaluates the
quality level by comparing some equivalent parameters extracted from the original and received
video sequence. NR method analyzes only received sequence in evaluation process. NR method is
suitable for live streaming services because it does not require the original video at the source for
comparison. Nevertheless, this method is complicated because of requiring a wide variety of key
metrics.
In the second approach, most of methods can be classified as objective and subjective methods.
Typical objective methods include PSNR, VQM, MPQM and MDI. On the other hand, subjective
methods are commonly referred as MOS. In this study, we will introduce QoE evaluation as a
viewpoint of the second approach.
First, we discuss some popular objective methods. These methods choose some network
parameters that are major factors affecting to the video quality. For each method, some thresholds
are chosen as standards, which correspond to levels of user acceptance. However, these methods
have the same problems as previous QoS methods: the network parameters are good enough
while the perceived video quality does not satisfy users. On the other hand, these methods are still
being used and giving positive results in certain cases.
VQM has been developed to provide an objective measurement for perceived video quality.
Recently, VQM is adopted as an ITU standard [18]. This method measures the perceptual effects
of video impairments including blurring, jerky/unnatural motion, global noise, distortion block,
and color distortion, and combines them into a single metric. The testing results show that VQM
has a high correlation with subjective video quality assessment [19].
MDI is a scoring mechanism that indicates video quality levels [16], [17], [20]. It provides an
accurate measurement of jitter and delay at network layer (IP), which are major causes of
reducing quality. The MDI metric is displayed as two values: a delay factor (DF) and a media loss
rate (MLR). MDI is a collection of measurement used to control the quality of video streams.
Therefore, the QoE can be evaluated by MDI metric. The advantage of MDI method is that it can
be tested at any point in the network from the source to the users. It can adjust the network
condition to satisfy the QoE of users based on MDI metrics. The model is suitable for monitoring
the quality of video streaming in IPTV systems.
PSNR is a traditional quality evaluation metric that is calculated by the root mean square of the
differences of the original and the received video frames [21]. PSNR is derived by setting the
mean squared error (MSE) in relation to the maximum possible value of the luminance. The
advantages of PSNR method are simple calculation, easy accessibility, and easy implementation
to the measurement system. The PSNR metric is averaged by all the differences of original and
received pictures. Although QoE is affected by human vision system, some errors are difficult to
International Journal of Computer Networks & Communications (IJCNC) Vol.7, No.3, May 2015
64
recognize by human vision and users still experience better quality in spite of lower PSNR value.
There exist the weaknesses of the measurement based on PSNR method such as poor correlation
with subjective factors and necessity to know the source image in the estimation process.
For Voice over IP (VoIP) systems, the QoE is evaluated by actual tests. The systems collect the
experience regarding VoIP services from many users, and the results are then quantified by MOS.
The MOS term has been introduced in telephony networks to obtain the users’ feeling of the call
quality [22]. Nowadays, MOS is also popularly used as a subjective measurement indication to
obtain QoE for video services [23].
For video services, the MOS method is widely used to obtain subjective QoE in the research.
MOS value is taken from a panel of participants, and frequently used to assess and rank the video
quality. In this method, examinees watch the same video and give their opinion scores ranging
from 1 (bad) to 5 (excellent). The mean value is then calculated as a collective opinion.
Therefore, the MOS value can directly reflect the satisfaction of users with the perceived quality,
and accordingly higher MOS value shows better quality. However, a problem remaining is that it
is difficult to apply MOS in real time applications. In other words, this method is only feasible in
the laboratory environment. For this reason, it is necessary to obtain the relationship between the
QoE and objective parameters in advance through the preliminary experiments. In this study, we
will use this method for all our experiments to estimate the quality of experience of users.
To analyze QoE on P2PTV systems, both subjective and objective methods should be used. MOS
is chosen as a QoE metric based on subjective tests. For the objective method, although several
objective video quality models have been developed in the past two decades, PSNR has
continuously been a popular evaluation to represent the quality difference among pictures.
Furthermore, the previous published test results showed that PSNR was still a common objective
video quality metric in studies [13],[24],[25]. They explain why PSNR is the most common
metric used in the literature. For this reason, we use PSNR as a video quality metric for our
models in test 2.
4. EXPERIMENTS
4.1. Experimental Simulation
In P2P systems, data will be divided into equal-size segments called chunks, and these chunks
will be exchanged among peers. In our simulation, P2PTVsim [26] is used to simulate P2P
overlays and video transmission mechanism. PSNR-tools [27] is also used to obtain the pseudo
P2P-transferred video. PSNR-tools is a collection of small utilities to manipulate video files.
P2PTVsim is a sort of peer-to-peer TV simulators. Both P2PTVsim and PSNR-tools have been
initially developed by the research group in napa-wine project [28].
All tests were performed on a PC with hardware and software information as follows: Intel Core
i5-2400 CPU 3.1GHz, 4GB memory, and operating system Ubuntu 10.5. We set up parameters in
the simulation based on those in [11] and recommendation from [26]. In particular, the number of
chunks is 1000, and the number of peers on the overlay network is 1000. The degree parameter,
which represents the number of neighbor peers randomly selected in the P2P overlay, is 20.
Foreman_cif video sequence (4:2:0 YUV format) with resolution 352x288 is used as a streaming
source. The source video is encoded H264/MPEG4 with GOP = 12 and GOP = 15 before
streaming. The scheduler selects the chunks and peers to exchange data. The success and
efficiency of the application depend on the construction of a good overlay as well as on the use of
effective scheduling techniques for information distribution. Therefore, the scheduler plays an
International Journal of Computer Networks & Communications (IJCNC) Vol.7, No.3, May 2015
65
important role in the success of P2P live streaming application. In this simulation, the scheduler
introduces the latest useful chunk and random useful peer (LUC/RUP) as a selection solution. By
using this scheduler, each peer (receiver) randomly chooses its parent peers (senders) from the
connected neighbor peers, and the senders then select the latest chunk that is not owned by the
receiver to send. The result of each simulation is different because our study uses the random
topologies which are close with the real system. For this reason, each simulation has been
repeated 50 times to calculate the average results as previous studies [11][12].
To evaluate QoE on P2PTV system in this study, we deploy two methods as follows:
- MOS method: A MOS scale is used for the quality evaluations shown in table 1 [23]. We
use MOS as a QoE metric for all tests.
- PSNR method: PSNR-tools is also used to compare the received video with the source
video and to calculate PSNR values. We use this method in test 2 to compare with the
MOS results. Table 1. Five-grade MOS scale.
MOS Quality Impairment
5 Excellent Imperceptible
4 Good Perceptible, but not annoying
3 Fair Slightly annoying
2 Poor Annoying
1 Bad Very annoying
4.2. Experimental Results
4.2.1. The Effect of Chunk Loss Ratio
In this case, the chunk loss ratio is used as a network parameter. We assume that the change of
network parameters such as latency, deadline, and bit rate will finally affect the chunk loss ratio.
Therefore, the final investigating factor that mainly affects the perceived quality of users is the
chunk loss. Hence, we focus on the chunk loss ratio as a network parameter. We try to find out
the mapping function that represents a relationship between the perceived quality of users and the
chunk loss ratio. Thirteen university students from Asian countries who were studying in
Shibaura Institute of Technology, Japan, joined in our experiments. They watched the same video
streaming that was simulated as a P2P-transferred data by P2PTVsim and marked their opinion
scores on the evaluation sheets. The MOS values scored by students were then calculated and
evaluated. The obtained results shown in Fig. 2 describe the relationship between the chunk loss
ratio and the QoE.
International Journal of Computer Networks & Communications (IJCNC) Vol.7, No.3, May 2015
66
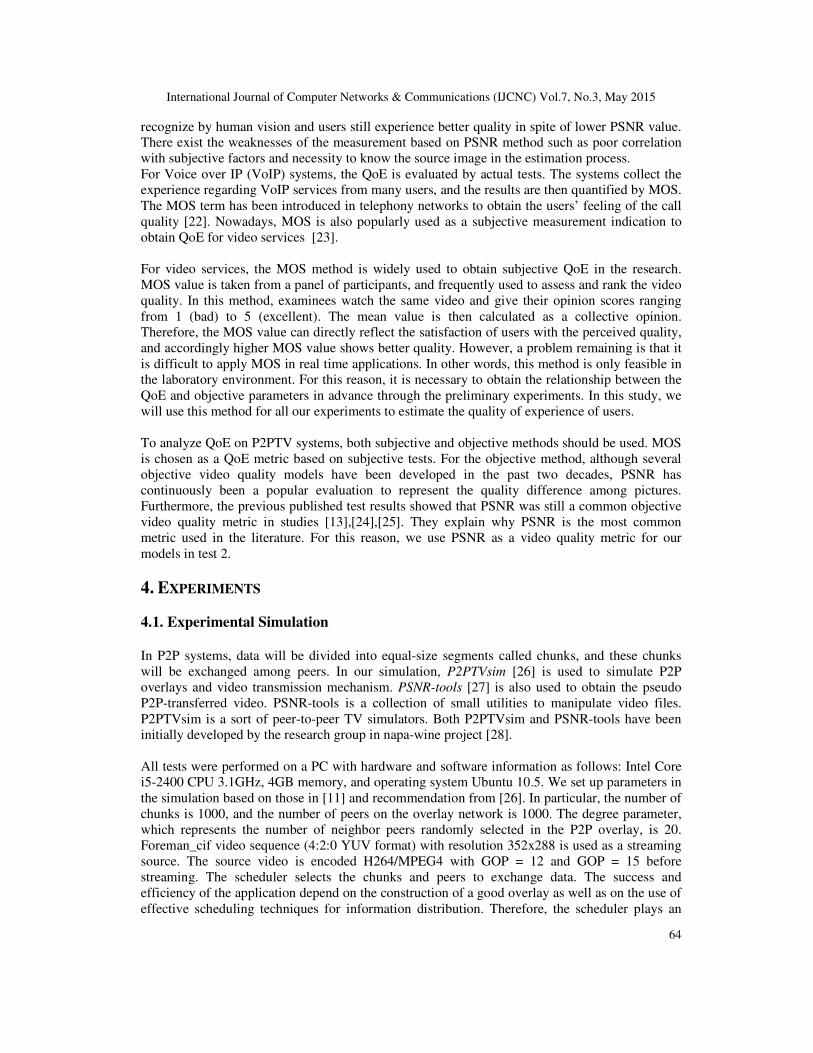
Figure 2. MOS as a function of chunk loss ratio.
Fig. 2 describes the approximate correlation function of the chunk loss ratio and MOS, y=4.465e-
6.60x with the correlation coefficient 0.957. As shown in Fig. 2, the MOS decreases exponentially
in contrast to the increase of the chunk loss ratio. As shown in table 1, the threshold for the
acceptability of a perceived video quality is the MOS value of 3. Based on the function in Fig. 2,
it means that, when the chunk loss ratio is less than 0.06%, users can approve the video quality.
On the contrary, when the chunk loss ratio is more than 0.22%, the perceived quality is so bad
that most users are very annoyed.
4.2.2. The Effect of GOP size
The GOP is a group of successive frames within a set of coded video stream. The GOP basically
contains three kinds of frames: I, P, and B frames. I frame represents a fixed picture and is
independent of other frames. The more I frames the video stream has, the robuster it is to the
error. To save the bandwidth and to reduce the streaming size, however, each video sequence
should have only one I frame per GOP. Therefore, the GOP size is defined as the length between
two I frames.
As mentioned above, QoE can be affected by intrinsic properties of video sequence such as GOP
structure, frame rate, and frame type. However, the GOP size is one of the most important factors
in video sequence. We thus continue to investigate the influence of GOP size on the perceived
video quality of users. In these experiments, we consider the effect of two GOP sizes of 12 and
15, simply described as GOP12 and GOP15, which are popular used in video service systems.
In our simulation, four bitrate values are used: 0.7, 0.8, 0.9, and 1.0 Mbps. Moreover, the deadline
specifies the maximum acceptable time in which each chunk has to be distributed in the P2P
network. In other words, the chunks that take longer time to arrive than the deadline are recorded
as ones having arrived but not stored for further distribution. If the deadline is too long, it will
cause bad performance in the network. Therefore, the deadline is recommended from 5 to 10
seconds, and the configuration enables the network to get good performance in experiments [26].
After many experiments, the deadline values were chosen as 5.75, 6.72, and 7.68 seconds.
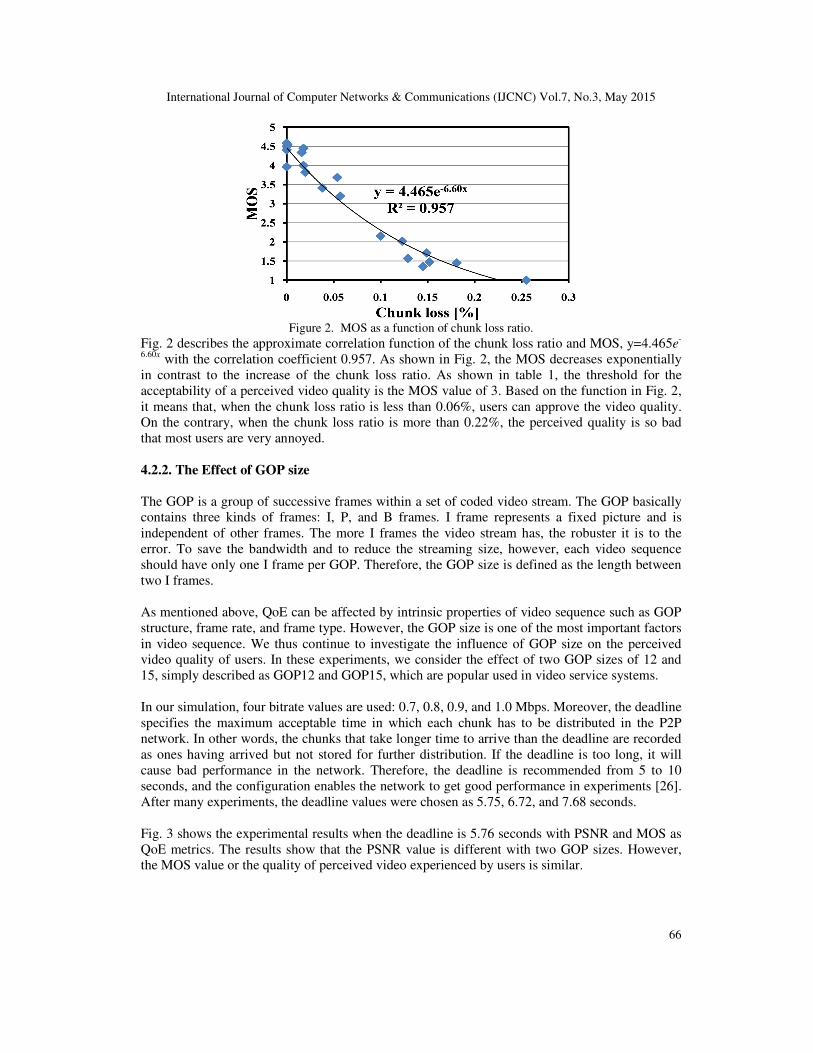
Fig. 3 shows the experimental results when the deadline is 5.76 seconds with PSNR and MOS as
QoE metrics. The results show that the PSNR value is different with two GOP sizes. However,
the MOS value or the quality of perceived video experienced by users is similar.
International Journal of Computer Networks & Communications (IJCNC) Vol.7, No.3, May 2015
67
(a)
(b)
Figure 3. QoE as functions of bitrate when deadline=5.76s: (a) PSNR as a QoE metric; (b) MOS as a QoE
metric.
In Fig. 4, the PSNR value of the received video sequence with GOP15 is larger than that with
GOP12. Since higher PSNR represents better video quality, GOP15 shows better performance. In
fact, the received video sequence with GOP15 has higher MOS value than GOP12. However,
GOP12 shows better PSNR when the bitrate is 0.7 Mbps and the deadline is 6.24 seconds. Since
the PSNR value is calculated by errors that cannot be recognized by human vision, users
sometimes experience better quality in spite of lower PSNR value. This is one of the
disadvantages of the PSNR method, which can be solved by MOS method.
International Journal of Computer Networks & Communications (IJCNC) Vol.7, No.3, May 2015
68
(a)
(b)
Figure 4. QoE as functions of bitrate when deadline=6.24s: (a) PSNR as a QoE metric; (b) MOS as a QoE
metric.
Fig. 5 describes the experimental results when the deadline is 6.72 seconds. From the results, we
conclude that the quality of received video with GOP15 is better than that with GOP12. However,
the differences slightly affect to the QoE of users. This can be explained as follows: the ratio of I
frames with GOP12 (1/12) is higher than that with GOP15 (1/15). As a rule, the probability of I
frame loss with GOP12 is higher, and accordingly the MOS value becomes smaller. The frame
rate of video sequence with GOP15 is 30 fps, while that with GOP12 is 25 fps. The results also
show that the best network performance is gained when the video rate is 0.9 Mbps. For this
reason, the next experiments will be setup as GOP is 15 and video rate is 0.9 Mbps.
International Journal of Computer Networks & Communications (IJCNC) Vol.7, No.3, May 2015
69
(a)
(b)
Figure 5. QoE as functions of bitrate when deadline=6.72s: (a) PSNR as a QoE metric; (b) MOS as a QoE
metric.
4.2.3. The Effect of Chunk Size
In some real-time P2PTV applications such as PPStream [29], PPTV [30], and Sopcast [31], a
chunk size value is quite small to suit the real conditions for watching live streaming. In this
experiment, we try to investigate the effect of chunk size to QoE. We chose the chunk size value
as 1, 2, and 3 kilobytes respectively. Other network parameters are set up based on the previous
experimental results: the GOP size is 15, the frame rate is 30 fps, the video rate is 0.9Mbps, and
the deadline values are 6.72, 7.68, 8.64, and 10.56 seconds.
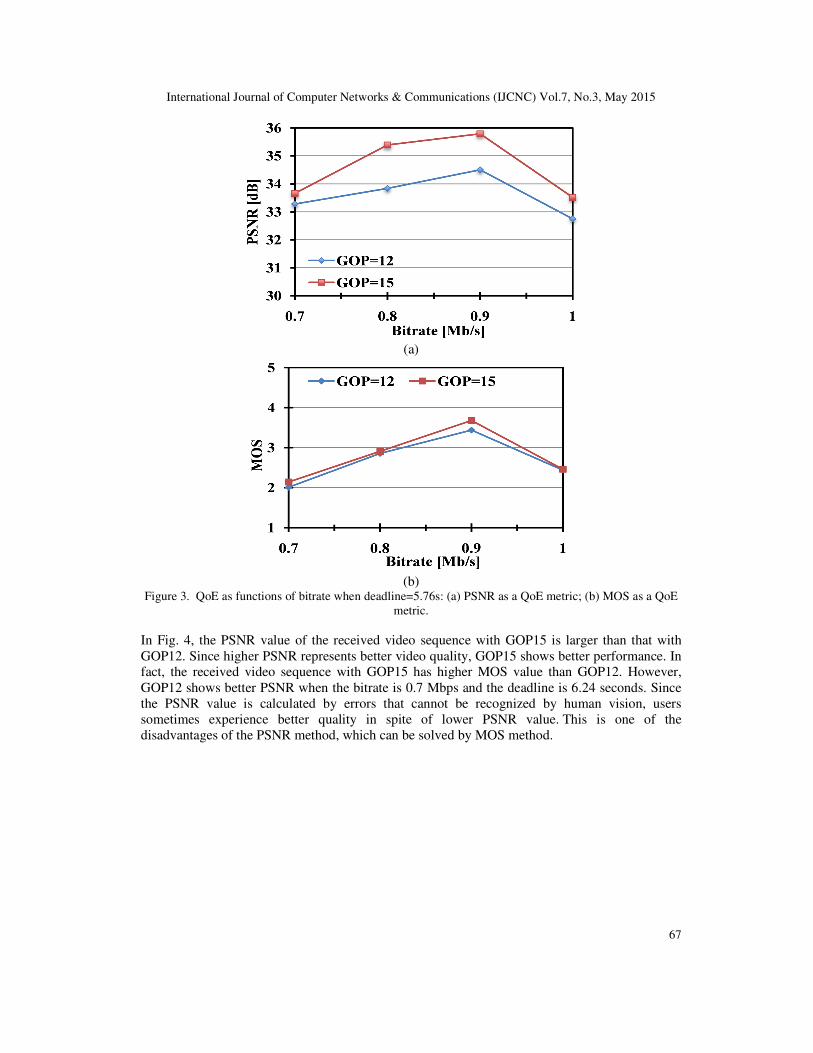
Fig. 6 shows the effect of the chunk size to QoE with various target deadlines. At the same chunk
size value, the smaller the deadline is, the lower the MOS is. Furthermore, smaller chunk size
leads to higher users’ satisfaction. However, if the chunk size is too small, it may cause the
technical complication because each peer has to collect a huge number of small chunks from
many other peers. In conclusion, further investigation on the relationship between chunk size and
International Journal of Computer Networks & Communications (IJCNC) Vol.7, No.3, May 2015
70
other parameters in P2PTV applications is vital to improve and guarantee the quality of video
streaming.
Figure 6. The effect of chunk size to QoE.
5. DISCUSSION
In this study, we investigated the effect of objective factors on QoE for P2PTV systems. The
experimental results clearly showed the influence of the chunk loss ratio, GOP size, and chunk
size to user perceived QoE. From these results, we can conclude that the chunk loss ratio should
be less than 0.06% and then users will be satisfied with perceived video quality. In addition, a
larger GOP size and a smaller chunk size are better for user experiences in this context. Our
experiments are based on subjective ratings, which exactly reflect users’ feeling. Hence, we
believe that the obtained results will improve the accuracy of the computed QoE.
Regarding the impact of the chunk size, we discover that the chunk size in real systems is quite
small. We guess that it is suitable for the real time conditions that require a small delay. Hence,
we do some experiments in case 3 to assess the impact of the chunk size. The obtained results
show that a smaller chunk size in this context leads to better perceived quality of users. However,
we also recognize that the chunk size is very sensitive factor and its influence to QoE may be
very complicated. There are two opposite effects of the chunk size to QoE:
- If the chunk size is small, the transmission delay is also short but the delay to collect all
chunks at destination will be longer.
- If the chunk size is large, the transmission delay is longer but the time to collect chunks
will be shorter.
Therefore, we predict that a trade-off point may exist to balance these effects. We will try to
acquire this point in next studies.
In addition, all subjective tests were performed in our experiments with Vietnamese, Japanese,
Thai, and Malaysian students from different majors such as systems engineering, bioscience
engineering, and mechanical engineering. We recognize that QoE metric is different with each
student. However, the results are less different when students are in the same majors. This means
that users who have the same specific experience or knowledge in one field have the similar QoE
results. Users’ characteristics obviously have influenced users’ satisfaction, and it is thus
International Journal of Computer Networks & Communications (IJCNC) Vol.7, No.3, May 2015
71
necessary to investigate the effect of users’ characteristics on QoE in detail. It will help us to
obtain the more accurate results as well as will become the basis to serve better QoE for users.
6. CONCLUSIONS
In this paper, we contributed to formulate the effect of chunk loss ratio, GOP size, and chunk size
to the quality of experience on the P2PTV application. We used the MOS method in subjective
tests to evaluate QoE metric that enabled to improve the accuracy of the user satisfaction analysis.
It allows to build a realistic mapping function between QoE and the chunk loss ratio, which
reflects high correlation with user perception. In addition, the experimental results also asserted
that the multimedia characteristics such as the GOP size have a certain influence on the quality of
received video while the human experience is slightly affected.
Although we obtained some results of the effects of the chunk size factor, there are still many
challenges that encourage us to deeply investigate as well as to solve them completely. First, the
number of testers in this paper is thirteen, which might be too small to conclude our results.
However, we believe that it would be acceptable in the laboratory environment and give us some
sort of new findings. In the future work, we will continue the study with a large number of users.
Secondly, the QoE evaluation, which is based on the relationship between QoS and QoE, is still
interested in community research [32-34]. Therefore, the effect of other factors including both
subjective and objective factors of QoE will be our targets in the next study. In other words, we
will try to optimize the network resources but still ensure the service quality for end users.
REFERENCES
[1] M. Alreshoodi and J. Woods, “Survey on QoE/QoS correlation models for multimedia services,” Int.
J. Distributed & Parallel Systems (IJDPS2013), vol. 4, no. 3, pp. 53-72, May 2013.


![Recent Progress on Liquid Biopsy Analysis using Surface ... · biomedical applications of SERS: labelfree detection - and indirect detection using SERS tags [20]. In label-free SERS](https://static.documents.pub/doc/80x56/5f48e596b982e00d4625f82d/recent-progress-on-liquid-biopsy-analysis-using-surface-biomedical-applications.jpg)


