c_ -/qq_-55 £ife @stems. J#c. //_/ " , TR-1415-36 ELECTROLYSIS PERFORMANCE IMPROVEMENT CONCEPT STUDY (EPICS) FLIGHT EXPERIMENT PHASE C/D FINAL REPORT by M. G. Lee and F. H. Schubert November 28, 1995 Prepared Under Contract NAS9-18568 DRL No. T-2244 (Line Item No. 22) DRD No. SE-1299T by Life Systems, Inc. Cleveland, OH 44122 for the Lyndon B. Johnson Space Center, National Aeronautics and Space Administration https://ntrs.nasa.gov/search.jsp?R=19960027896 2018-08-02T01:32:34+00:00Z
Transcript
c_ -/qq_-55 £ife @stems.J#c.
//_/ " ,
TR-1415-36
ELECTROLYSIS PERFORMANCE IMPROVEMENT CONCEPT STUDY (EPICS)
FLIGHT EXPERIMENT PHASE C/D
FINAL REPORT
by
M. G. Lee and F. H. Schubert
November 28, 1995
Prepared Under Contract NAS9-18568
DRL No. T-2244 (Line Item No. 22)DRD No. SE-1299T
by
Life Systems, Inc.
Cleveland, OH 44122
for the
Lyndon B. Johnson Space Center, National Aeronautics and Space Administration
Electrolysis Performance Improvement Concept Study
Erasable Programmable Read Only Memory
Extravehicular Activity
Fluids Control Assembly
Ground Support EquipmentInterface Control Document
Integrated Electrolysis Unit
International Space Station Alpha
Johnson Space Center
Kennedy Space Center
Light Emitting Diode
Mechanical/Electrochemical Assembly
Mission Elapsed Time
National Aeronautics and Space Administration
National Space Transportation System
Office of Aeronautics, Exploration and Technology
Oxygen Generation Assembly
Orbital Replaceable Unit
Pressure Control Assembly
Preliminary Design Review
performance display unit
Payload Integration Plan
Program Requirements Document
Pre-Ship ReviewResistance Thermal Detector
Sensor Dedicated Shutdown Unit
Static Feed Electrolyzer
Static Feed Water Electrolysis Module
Thermal Control AssemblyThermal Control Plate
Test Support Accessories
Water Vapor Electrolysis
V
8 stcms,
SUMMARY
The overall purpose of the Electrolysis Performance Improvement Concept Study flight
experiment is to demonstrate and validate in a microgravity environment the Static Feed
Electrolyzer concept as well as investigate the effect of microgravity on water electrolysis
performance. The scope of the experiment includes variations in microstructural
characteristics of electrodes and current densities in a static feed electrolysis cell
configuration. The results of the flight experiment will be used to improve efficiency of the
static feed electrolysis process and other electrochemical regenerative life support processes
by reducing power and expanding the operational range. Specific technologies that will
benefit include water electrolysis for propulsion, energy storage, life support, extravehicular
activity, in-space manufacturing and in-space science in addition to other electrochemical
regenerative life support technologies such as electrochemical carbon dioxide and oxygen
separation, electrochemical oxygen compression and water vapor electrolysis.
The Electrolysis Performance Improvement Concept Study flight experiment design
incorporates two primary hardware assemblies: the Mechanical/Electrochemical Assembly
and the Control/Monitor Instrumentation. The Mechanical/Electrochemical Assembly
contains three separate integrated electrolysis cells along with supporting pressure and
temperature control components. The Control/Monitor Instrumentation controls the operation
of the experiment via the Mechanical/Electrochemical Assembly components and provides for
monitoring and control of critical parameters and storage of experimental data. The
Electrolysis Performance Improvement Concept Study flight experiment hardware is designed
to be a totally self-contained system and mounted into an envelope equivalent to two standard
middeck lockers on the Shuttle Orbiter. The Electrolysis Performance Improvement Concept
Study hardware mounts directly to payload mounting panels in place of middeck lockers.
The mission for the actual flight experiment extends to two consecutive days of testing for
approximately eight hours of testing each day. The test plan basically consists of two current
variations, 2 and 7 A (equivalent to 37 and 129 A/ft2), over the two-day period. The
experiment was conducted on STS-69 Endeavor. Since the Electrolysis Performance
Improvement Concept Study flight experiment is fully automated, the only requirement for
the crew is the initial actuation of the experiment and deactivation at the end of a two-day
experiment. Each repetition of the two-day experiment requires the activation and
deactivation by the crew. The Control/Monitor Instrumentation is designed to handle the
complete sequencing of the experiment and storage of data. No special data links or audio
visual equipment are needed.
The flight experiment, although shortened by unforeseen shutdowns, achieved the following:
. Successful demonstration of the Static Feed Electrolyzer concept for on-orbitoxygen generation at 37 A/ft 2.
. Successful demonstration of a unitized regenerative fuel cell concept for energy
storage application.
SHstems.:#c
3. Slight performance improvement in electrolysis operation.
. Soundness of the water electrolysis concept itself and the mechanical design of
the flight experiment.
Since the causes of the shutdowns have been clearly identified and the upgrading and
recertification of the experiment can be completed with minimal efforts, reflight of the
Electrolysis Performance Improvement Concept Study Flight Experiment at the earliest
possible opportunity is strongly recommended.
INTRODUCTION
The Electrolysis Performance Improvement Concept Study (EPICS) is a flight experiment
that demonstrated and validated in a microgravity environment the Static Feed Electrolyzer
(SFE) concept which was selected for the use aboard the Space Station Freedom for oxygen
(02) generation. It also investigated the impact of microgravity on electrochemical cell
performance. Electrochemical cells are important to the space program because they provide
an efficient means of generating oxygen (02) and hydrogen (H2) in space. Oxygen and H 2are essential not only for the survival of humans in space but also for the efficient and
economical operation of various space systems. Electrochemical cells can reduce the mass
volume and logistical penalties associated with resupply and storage of these components by
generating these gases in space.
The scope of experiment included variations in microstructural characteristics of electrodes
and current densities. The analyzed results can be used to identify ways for improving the
performance of the Static Feed Electrolysis process and other electrochemical regenerative
life support processes. Specific technologies that will benefit include water electrolysis for
propulsion, energy storage, life support, extravehicular activity (EVA), in-space
manufacturing, and in-space science in addition to electrochemical regenerative life support
technologies such as electrochemical carbon dioxide (CO2) and 0 2 separations,
electrochemical 0 2 compression and water vapor electrolysis (WVE).
Background
Advanced space missions will require 0 2 and H 2 utilities for several important operations
including: (1) propulsion, (2) electrical power generation and storage, (3) Environmental
Control and Life Support System (ECLSS), (4) Extravehicular Activity (EVA), (5) in-space
manufacturing activities and (6) in-space science activities. A key to providing these utilities
for advanced space missions will be to minimize resupply from Earth requirements and initialEarth-to-Orbit launch mass.
This report presents the details and results of a flight experiment which investigated the
effect of low gravity on the performance of an electrochemically-based subsystem which
provides these utilities. The experiment focuses on the SFE concept of generating 0 2 and
H 2. It is important to note that this focus on a specific electrochemical process will not only
2
8Hstcms,Jnc
provide performance design data for that specific process; it will also provide methodologies,
flight experiment hardware and performance information applicable to a diverse range of
electrochemical processes.
The SFE technology, using an alkaline electrolyte, has been recognized as a design capable
of efficient, reliable 0 2 and H 2 generation with few subsystem components. The static feed
concept has evolved over the last 25 years under the NASA and Life Systems, Inc. (Life
Systems) sponsorship. During this time, the concept progressed from single-cell operation
through the fabrication and testing of multiperson subsystems (for life support) culminating in
its selection for the Oxygen Generation Assembly (OGA) of the Air Revitalization System
aboard the Space Station.
Recent developments at Life Systems have demonstrated substantial reduction in the
operating voltage of the electrolysis cells and have allowed for the consolidation of ancillary
components resulting in the reduction of power, weight, volume and complexity. The
overall impact of these state-of-the-art advancements is significant since the OGA is the
largest power consuming subsystem of a regenerative life support system and even more
significant when considering advanced mission scenarios which require tons of 0 2 production
per year for propellant.
Detailed descriptions of the static feed orocess, its theory of operation and its performance
have been discussed previously. (1,2'3'4) The following subsections briefly summarize the
subsystem and cell level concepts and the electrochemical reactions involved.
Basic Process of Static Feed Electrolyzer
Within a water electrolysis cell, water is broken apart into its component elements by
supplying electrons to the hydrogen at a negatively charged electrode (cathode) and removing
electrons from the oxygen at a positively charged electrode (anode). The half-cell reactions
are as follows for water electrolysis cells using an alkaline electrolyte:
At the cathode:
2 H20 + 2e- --- H 2 + 2 OH- (1)
(a) Superscripted numbers in parentheses are citations of references listed at the end of
this report.
3
£J# SHstems.J#c
At the anode:
- 12 OH =- 02 + 2e- + H20
2(2)
These result in the overall reaction of:
1
H20 = H 2 + ] 02(3)
The Static Feed Electrolysis Cell
The efficiency with which these reactions can be used for practical O2/H 2 generation is,however, highly dependent on cell technology, especially on electrode components. Figure 1
is a functional schematic of the SFE cell. As electrical power is supplied to the electrodes,
water in the electrode core is electrolyzed creating a concentration gradient between the
water feed cavity and the electrolyte in the electrode core. Water vapor diffuses from the
water feed matrix cavity through the water feed membrane to the cathode due to this
gradient.
IPower
Supply I
ii:
_ !iii 2
-- : J
_--___H20
e-
l
C,,cu,a,,n0Feed Water As _ _ f
Coolant _
Electrolyte
Matrix
Water Vapor
Feed Membrane
H20
02
Anode ( + ):
_ Catho6e (-):
Overall:
Reaclions
4OH---.,.- 02 + 2H20 + 4e-
4H20 + 4e---.-. 2H2 + 4OH-
2H20 + Power-..--- 2H2 + 02
FIGURE 1 ELECTROLYZER CELL SCHEMATIC AND REACTIONS
4
£i/c @stems.;He
Subsystem Concept
The basic cells are combined with supporting components to form the subsystem. A
simplified process schematic of a static feed electrolysis subsystem is shown in Figure 2.
The mechanical/electrochemical portion of the subsystem consists principally of four
components: an electrochemical module, a Pressure Control Assembly (PCA), a Thermal
Control Assembly (TCA) and a Fluids Control Assembly (FCA). The module consists of a
series of individual electrochemical cells stacked fluidically in parallel and connected
electrically in series to form the Static Feed Water Electrolysis Module (SFWEM). Oxygen
and H 2 are generated in the SFWEM from water supplied by the water supply tank.
Circulation _
Pump kj ,,j' Heat f l/llIJIJ IIIrfl I
E_.a__er I [ l[ Iii111 /
" " " I IIIIIIIIIIIIII I/Electr°lysis
Coolant In ]/'--__-----------------Jk-._ cL_olol'a'r_'t'; 'ul '''I-j/ M°dule
,0 2
, H2
FIGURE 2 SIMPLIFIED SFE PROCESS SCHEMATIC
From the module the product gases pass through the PCA which monitors and adjusts
subsystem pressures and maintains proper overall and differential pressures between the 0 2 ,
H 2 and water feed cavities of the module. The PCA is an integrated mechanical component
which integrates several components into one Orbital Replaceable Unit (ORU), increasing
reliability and maintainability. The TCA supplies liquid coolant to the module for thermal
control. Again, the TCA integrates several components into one ORU. The heat is
transferred from the subsystem by way of a liquid/liquid heat exchanger. Water is supplied
to the module by a pressurized, cyclically filled water supply tank. During the fill cycle, the
water tank is isolated from the module and depressurized. The subsystem has the capability
Systems.:#c.
for separate Nitrogen (N2) purging of O2-and-H 2 containing cavities of the SFWEM and for
repressurizing of the water feed tank after the water tank fill cycle. The fill cycle of the
water tank and the capability of N 2 purging of both the 0 2 and H 2 cavities of the SFWEM
are controlled by the FCA. The PCA, TCA and FCA are mounted on an interface plate in
which a major portion of the plumbing is embedded.
An automatic Control/Monitor Instrumentation (C/M I) provides the following functions:
(1) automatic mode and mode transition control, (2) automatic shutdown provisions for self-
diagnostics and (5) provisions for interfacing with the operator through a performance display
unit (PDU) and/or NASA-provided command, control and display subsystem (CCDS).
Objectives
The overall objectives of the EPICS flight experiment are demonstration and validation of the
SFE concept in microgravity and also to investigate how a microgravity environment may
improve water electrolysis performance by experimenting with various cell components ofdifferent microstructural characteristics, current densities and thermal conditions within the
cell. The results will be used to improve static feed electrolysis process efficiency for
propulsion, energy storage, life support, EVA, in-space manufacturing activities and in-space
science activities. In addition, other electrochemical regenerative life support technologies
can also be improved using the flight experiment results.
The specific objectives of the experiment include:
1. Demonstrate and validate the Static Feed Electrolysis concept in microgravity.
. Investigate the impact on cell performance of varying electrode characteristics,
porosity and thickness, in microgravity.
. Evaluate performance improvement in microgravity at two different currentdensities.
. Develop flight experiment hardware which is adaptable to other electrochemicalresearch activities.
5. Develop flight experiment hardware which is safe and reliable.
° Develop flight experiment hardware which requires minimal interaction by thecrew.
° Develop flight experiment hardware which requires minimal National Space
Transportation System (NSTS) integration efforts.
6
£i[c SHstcms,Jnc
° Bring attention to the potentiality that low-gravity may have a positive effect on
performance of space systems.
Relationship to NASA Goals
The EPICS flight experiment has a direct relationship with future National Aeronautics and
Space Administration (NASA) mission needs/goals. The primary reason for this is that the
experiment focuses on the SFE process for generating 0 2 and H 2. Hydrogen and 0 2 arekey to the survival of humans in deep space and for the efficient and economical operation of
numerous space systems. These space systems typically include: (1) Environmental Control
and Life Support System (ECLSS), (2) energy storage, (3) propulsion, (4) EVA and (5)
special applications. The ECLSS application utilizes 0 2 for the crew, the air lock
repressurization and to replenish other external leakage. The ECLSS application also utilizes
H 2 for the reduction of CO 2. The energy storage application utilizes 0 2 and H 2 as reactants
for a fuel cell. The propulsion application utilizes high pressure 0 2 and H 2 as propellants.
The EVA application utilizes ultra-high pressure 0 2 to recharge the 0 2 bottle in the
extravehicular mobility unit. The special applications have unique 0 2 and H 2 requirementsto support in-space science and/or manufacturing activities.
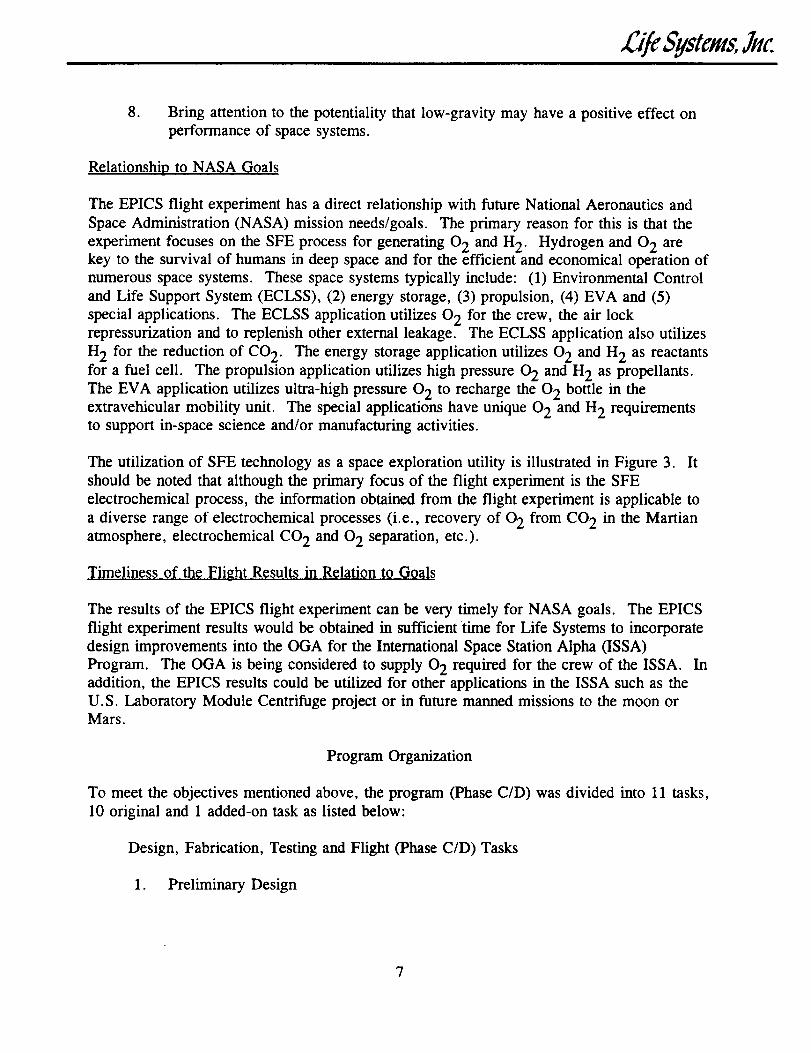
The utilization of SFE technology as a space exploration utility is illustrated in Figure 3. It
should be noted that although the primary focus of the flight experiment is the SFE
electrochemical process, the information obtained from the flight experiment is applicable to
a diverse range of electrochemical processes (i.e., recovery of 0 2 from CO 2 in the Martian
atmosphere, electrochemical CO 2 and 0 2 separation, etc.).
Timeliness of the Flight Results in Relation to Goals
The results of the EPICS flight experiment can be very timely for NASA goals. The EPICS
flight experiment results would be obtained in sufficient time for Life Systems to incorporate
design improvements into the OGA for the International Space Station Alpha (ISSA)
Program. The OGA is being considered to supply 0 2 required for the crew of the ISSA. In
addition, the EPICS results could be utilized for other applications in the ISSA such as the
U.S. Laboratory Module Centrifuge project or in future manned missions to the moon orMars.
Program Organization
To meet the objectives mentioned above, the program (Phase C/D) was divided into 11 tasks,
10 original and 1 added-on task as listed below:
Design, Fabrication, Testing and Flight (Phase C/D) Tasks
1. Preliminary Design
<
8 "
Scstems.lec
2. Payload Integration Plan (PIP), PIP Annexes and Interface Control
Document (ICD)
3. Engineering Model Development
4. Final Design
5. Engineering Analysis
6. Fabrication and Assembly
7. Testing, Data Reduction, and Analysis
8. Pre- and Post-Flight Support
9. Program Documentation
10. Program Management and Control
11. Technical Improvement and Additional Tasks Required
For simplicity, the added activities due to the mid-program incorporation of the Program
Requirements Document (PRD), JSC-37757, consisting of added technical requirements,
added program documentation efforts and added program management, were incorporated
into the existing task structure.
End Products
The end products of Phase C/D of this contractual effort are:
1. Drawings. Delivered to NASA Johnson Space Center (JSC) the following sets of
drawings.
a. A reproducible set of preliminary design drawings prior to the Preliminary
Design Review (PDR).
b. A reproducible set of final design drawings prior to the Critical Design
Review (CDR).
c. A reproducible set of as-built drawings prior to the Pre-Ship Review
(PSR).
2. Space Shuttle-Related Documentation. Delivered to JSC all documentation
required for Space Shuttle safety and integration activities.
9
SHstcms.JHc.
. Project Documentation. Delivered to JSC all required documents, including this
Final Report, as listed in the Data Requirements List (DRL).
. Flight Hardware. Delivered the flight hardware and software and any necessary
support equipment to the Kennedy Space Center (KSC) for flight aboard theSpace Shuttle STS-69.
5. Flight Data. Delivered to JSC:
a. A magnetic tape containing all the data gathered during the space flight,
reduced to engineering units.
b. Summary data plots and tables.
Report Organization
The following sections include separate discussions on the EPICS flight experiment
hardware, Ground Support Equipment (GSE), test results, followed by conclusions andrecommendations.
EPICS FLIGHT EXPERIMENT HARDWARE
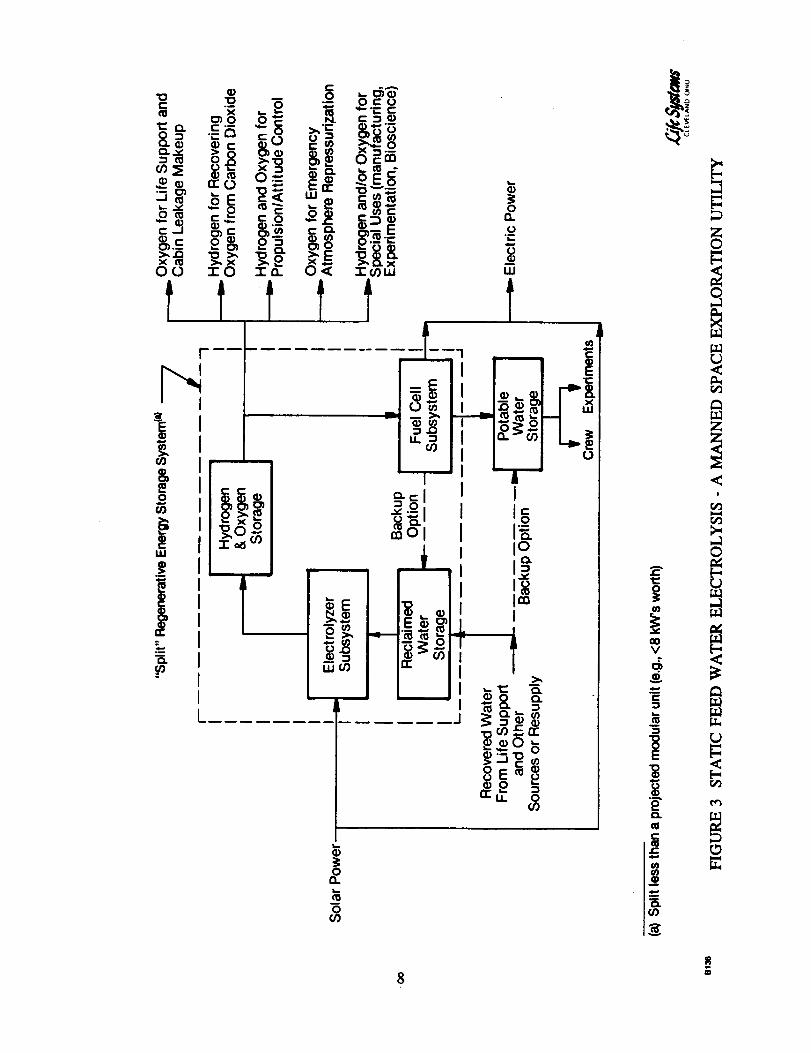
A block diagram representation of the EPICS flight experiment hardware design is shown in
Figure 4. The EPICS design incorporates two primary hardware assemblies: the
Mechanical/Electrochemical Assembly (M/EA) and the Control/Monitor Instrumentation
(C/M I). The M/EA contains three separate integrated electrolysis cells along with
supporting pressure and temperature control components. The C/M I controls the operation
of the experiment via the M/EA components and provides for monitoring and control of
critical parameters and storage of experimental data.
The EPICS flight experiment hardware is designed to be a totally self-contained system that
can be mounted into an envelope equivalent to two standard middeck lockers on the Shuttle
Orbiter. The EPICS hardware mounts directly to payload mounting panels in place of
middeck lockers. The basic packaging concept is illustrated in Figure 5. Figures 6 and 7
show pictures of the flight hardware.
The EPICS flight hardware is mounted to two separate payload mounting panels. The M/EA
and the C/M I have their own enclosures. The enclosures and the internal components, i.e.,
Integrated Electrolysis Units (IEUs), card cages, etc., are attached to mounting plates. The
mounting plates are attached to the payload mounting panels.
The EPICS M/E A is represented schematically in Figure 8. The M/E A includes three
separate IEUs and ancillary components. These components are described below.
Integrated Electrolysis Unit
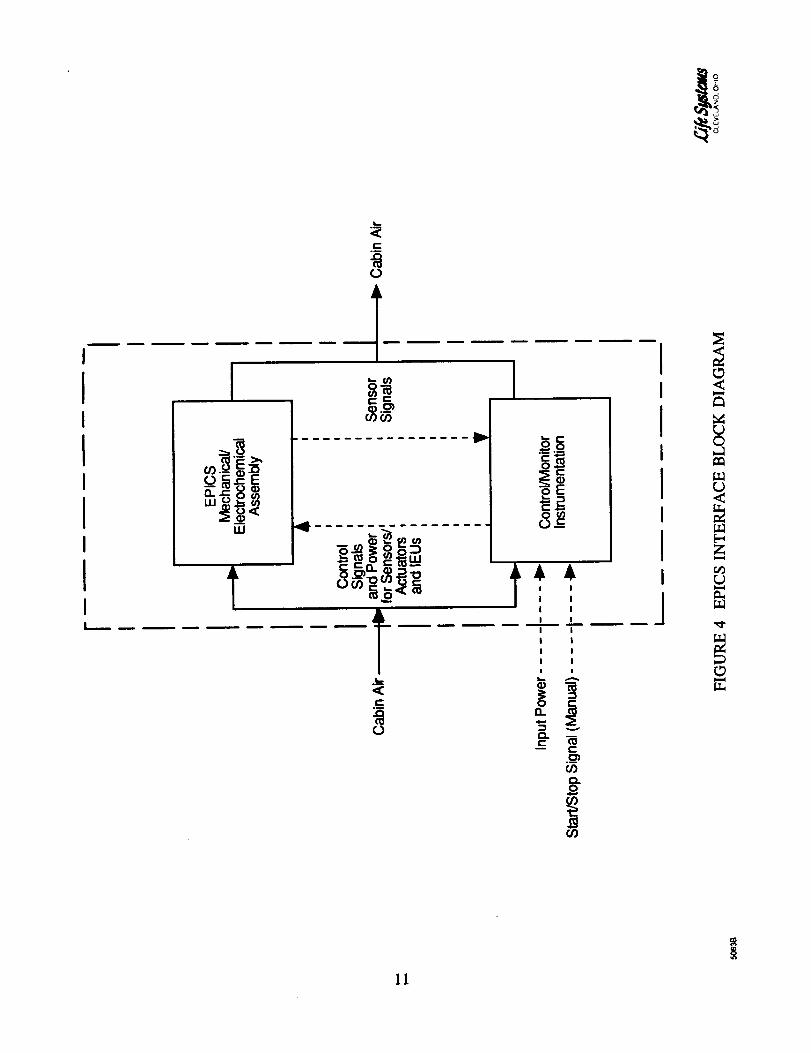
The IEU is an assembly of components that provide the physical capability for conducting the
EPICS experiment. The functional schematic and the three dimensional view of an IEU are
shown in Figures 9 and 10, respectively. The major components of an IEU include the
following:
• Integrated electrolysis cell
• Thermal Control Plate (TCP)
• 0 2 and H 2 accumulators
Each of these components is described below.
Integrated Electrolysis Cell. The integrated electrolysis cell consists of an electrolyzer cell
core and a recombiner cell core configured together within polysulfone cell housing frames.
Both of the cell cores incorporate unitized construction where the electrode-matrix-electrode
sandwich is bonded together on the perimeter with a thermoplastic. This provides a surface
for sealing and also simplifies assembly. The cell cores are separated by support screens and
a hydrophobic separator. The hydrophobic separator simulates the SFE water vapor feed
mechanism and prevents the forming of a liquid bridge between the electrolyzer and
recombiner electrodes. All fluidic connections between the gas compartments are achieved
via internal manifolding within the cell frame. The active area of the electrodes in the
integrated electrolysis cell is 1.44 x 5.44 in or 7.82 in 2.
The cell frame includes double redundant seals on the internal seals and triple redundant
seals on the external seals. The cell frame also provides sealed external tabs for current
connection to the electrochemical cells. Two Resistance Thermal Detector (RTD)
temperature sensors are positioned near the external surface of the electrolyzer side of the
integrated electrolysis cell. One is used in the thermal control loop and the other the Sensor
Dedicated Shutdown Unit (SDSU). The SDSUs are incorporated into the EPICS C/M I to
provide backup shutdown protection, i.e., provide for two-failure tolerance protection.
In the experiment, the only difference between each of the IEUs is the microstructural
configuration of the electrolyzer cell cores. One IEU will have a baseline SFE configuration
while the other two will have minor variations to electrode porosity and matrix thickness.
Thermal Control Plate. The Thermal Control Plate (TCP) is used to maintain the integrated
electrolysis cell at the desired operating temperature. The TCP is fabricated out of Inconel
718. Each TCP is equipped with a heater, six heat pipes, two thermostats and cooling fins.The heater is an adhesive-backed thin-film heater. One of the TCP thermostats is mounted
15
i I !Ii ! i :
i E!!
i &
il--_
,(
I
II
w
-. §:e
IB-"
L_ • -- ''_
_-_ -,,>>> =>
_-_
16
i,-
E
,_.9
_"B
U.J.'_-
A
O,-,-i
E
pit
w
l--_C LLJ
W ,_CO_ I--
W 0 I--
I--
_ o0 0 "_
Z Z LUw w 7-_,_ _ _--
--I
_C
Z<7-¢...) 0¢::wO
>"-'Jw
ol.-- z
!
I
_ ....11.1.1
_ LI.I
.LL
>'-- u.; u.; zz-"J ::_ Z Z
C_
LLII--
--.J:::::)rj
C,_Z
n 00
_2L_
_ Z
b,j n-" 0..LU CO_C
.-r" Z(._
_- "r-
(/'_n
W
I,-.O0
r_
0(,_
a_0oo
z_
I--Zwo_r_
C.)
0
Z
0
!
17
l
I
+
O"1-O4
+O4
OA
n-O
oe-
<
\\\\\\\
o1\
\\\\\\\\
I
n-O _ _-._- _ O
+ +A
Ooa
+
'00 O
+ 0 "r+
ca +
0 0e- "_ e-
0 < 0/
, /' / /
N
w
rn
/ \ // \ // \ //---_ \ /
¢%1
/ _-\ // \_.// \ ._ /
// \_:/
/ \%// \_-// \ // o\ // z\ // \ // ",,, // N /
l%1
O
I,,,,,,
O
O
I
oa_OE
OO<
Z
I0zal
_Z
<Z_,O_
Z
0 0
19
E
0
_fc $_stcms.:He
0
Z
0
c_
o
SHstems.:#c.
directly on top of the heater. This thermostat is used for overtemperature protection and will
interrupt current to the heater if the se_oint is exceeded. The heater has an active area of
approximately 2.74 x 2.94 in or 8.06 in 2. The maximum heater output is 28 W. The heater
thermostat setpoint is 160 F.
The other thermostat is located on the TCP near the heater. This thermostat is connected to
an SDSU and is used to provide an additional level of protection for IEU overtemperature.The setpoint of this thermostat is 150 F.
The six mini-flat type heat pipes are located in the center region of the TCP. The heat pipes
are positioned to transfer heat both into and away from the active area of the integrated
electrolysis cell. The heat pipes will be bonded into place with a thermally conductive epoxy
adhesive. The heat pipes utilize water as the working fluid.
The cooling f'ms are located on the TCP on the side opposite the heater. The cooling fins
are bonded by thermally conductive epoxy to the TCP. The surface area of the cooling finsof a TCP is approximately 0.68 f12.
0 2 andH 2. Accumulators. The 0 2 and H 2 accumulators are mechanical metal bellows. The
bellows provide a buffer volume for 02 and H 2 to account for electrochemical inefficiencies
within the system. The accumulators provide a positive pressure gradient from internal to
external due to the spring constant associated with bellows displacement. Mechanical
compression springs were installed externally on the 0 2 accumulator bellows to provide
higher pressure in the 0 2 side than the H 2 side for optimum recombiner performance. The
maximum volume displacements for the 0 2 and H 2 accumulators are 6.1 in 3 (100 cm 3) and12.2 in3 (200 cm3), respectively. The internal pressure associated with full displacement is
approximately 3.2 and 6.1 psig for the H 2 and the 0 2 accumulators, respectively.
The accumulators are housed below the integrated electrolysis cell within an external shell.
The shell is connected to the TCP with mounting brackets. The external side of the bellows
is open to ambient pressure. The internal side of the bellows is fluidically connected to the
integrated electrolysis cell through manifolding within the mounting brackets. Both
accumulator assemblies are enclosed in a hydrophobic sleeve bonded to the bases of the
accumulator housings in order to contain any liquid electrolyte that could be released from
the electrode core in case of potential failure.
A manual valve is attached to each mounting bracket and connected fluidically to each
accumulator. This valve is used only used during ground operations for pressure testing or
system purging. During flight this valve stays closed and the outlet is capped.
A pressure switch is also attached to each mounting bracket and connected fluidically to each
accumulator. The pressure switch is used to provide overpressure protection. The pressure
switch setpoint is 20.2 + 0.5 psia. If the internal IEU pressure exceeds the setpoint, then
the pressure switch will remove power to the IEU through the SDSU.
20
£ifc SHstcms.JHc
The accumulators have a position indicating sensor. This device outputs a signal to the
C/M I proportional to the accumulator displacement. This signal will be monitored by the
C/M I to ensure that each of the accumulators are in the normal operating range and during
electrolysis-only operation, the rate of change of position of the bellows is within an
acceptable range.
Ancillary_ Components
The M/E A ancillary components consists of four fans with filters, an outlet air temperature
sensor and a combustible gas sensor. Three of the fans are thermal control fans. The
thermal control fans circulate middeck air over the cooling fins on the TCP to provide
cooling. Each fan operates independently on an on/off basis as needed to keep the IEU at
the desired temperature. Each fan has an inlet air filter. The inlet air filter is a 70 mesh
stainless steel screen that will keep middeck airborne debris out of the fan.
The fourth fan is a continuously operated purge fan. The function of this fan is to
continuously circulate middeck air throughout the enclosed volume to dilute any H 2 that may
leak out of the IEUs. This fan operates independently of the C/M I and is on when the
EPICS main power is on.
The air outlet temperature sensor is an RTD temperature sensor. This temperature sensor is
located in the outlet air flow path. The purpose of this temperature sensor is to monitor the
air outlet temperature.
The combustible gas sensor is a solid state gas sensor that is mounted within the outlet air
flow path. The purpose of this sensor is to monitor H 2 levels around the EPICS system.This sensor is a check to ensure that the purge fan is operating properly and that the IEUs
are not leaking H 2.
Control/Monitor Instrumentation
The EPICS C/M I consists of microprocessor-based instrumentation that is responsible for
controlling the experiment and collecting the experimental data. The hardware and softwareof the C/M I are discussed below.
Hardware
The EPICS C/M I layout is illustrated in Figure 11. An EPICS electrical block diagram is
shown in Figure 12. As indicated in this figure, the major functional blocks are as follows:
• Computer• Power Conversion
• Data Storage
• Generic Sensor Signal Conditioning
• Actuator Signal Conditioning
21
0m
UJ
UJ
cj c- c
m
¥
e-
(J
F-"J
@0
(J(J
r.o
COaCO
T
o_u-O_
I
Q.Eo0
o9
t-o
(J
i
II.=o_
23
.<
0
<
r_
Systa,s.Jnc.
• Current Controllers
• SDSUs
• Front Panel
Each of these functional blocks is described below.
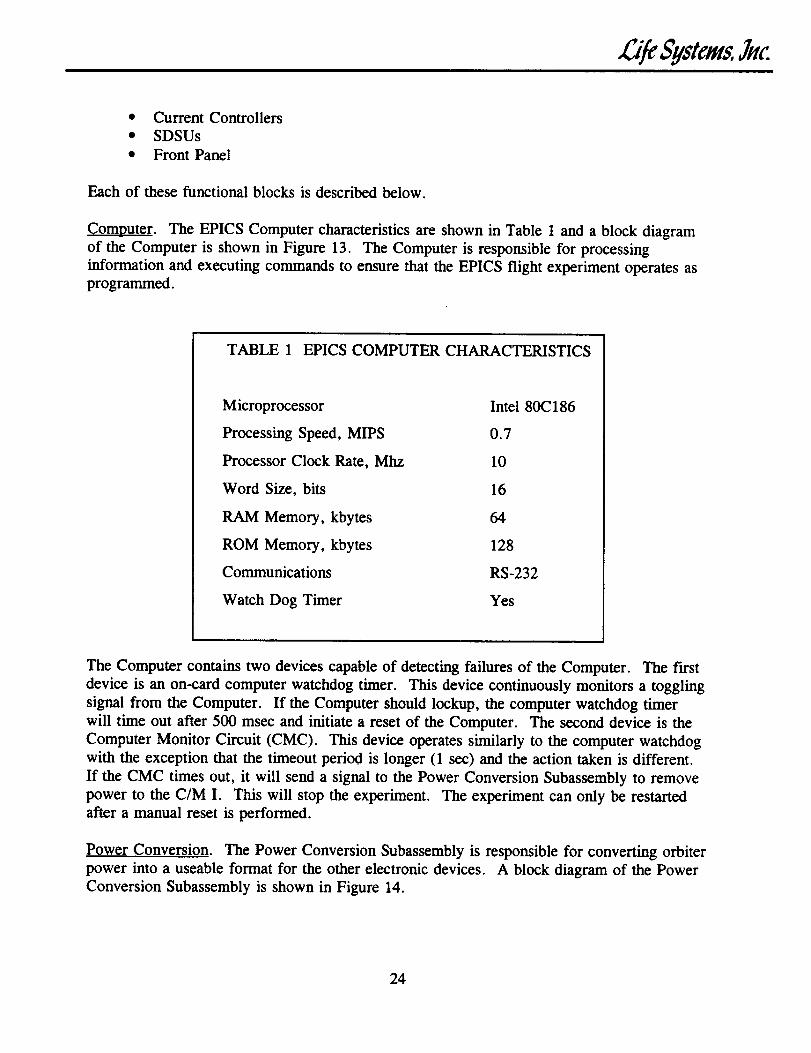
Computer. The EPICS Computer characteristics are shown in Table 1 and a block diagram
of the Computer is shown in Figure 13. The Computer is responsible for processing
information and executing commands to ensure that the EPICS flight experiment operates asprogrammed.
TABLE 1 EPICS COMPUTER CHARACTERISTICS
Microprocessor
Processing Speed, MIPS
Processor Clock Rate, Mhz
Word Size, bits
RAM Memory, kbytes
ROM Memory, kbytes
Communications
Watch Dog Timer
Intel 80C 186
0.7
10
16
64
128
RS-232
Yes
The Computer contains two devices capable of detecting failures of the Computer. The first
device is an on-card computer watchdog timer. This device continuously monitors a toggling
signal from the Computer. If the Computer should lockup, the computer watchdog timer
will time out after 500 msec and initiate a reset of the Computer. The second device is the
Computer Monitor Circuit (CMC). This device operates similarly to the computer watchdog
with the exception that the timeout period is longer (1 sec) and the action taken is different.
If the CMC times out, it will send a signal to the Power Conversion Subassembly to remove
power to the C/M I. This will stop the experiment. The experiment can only be restarted
after a manual reset is performed.
Power Conversion. The Power Conversion Subassembly is responsible for converting orbiter
power into a useable format for the other electronic devices. A block diagram of the Power
Data Storage. The C/M I Data Storage Subassembly is responsible for storing the EPICS
experimental data. This device uses a nonvolatile flash memory cartridge with a capacity of
1 MB. Data is stored every 30 seconds during key experimental periods.
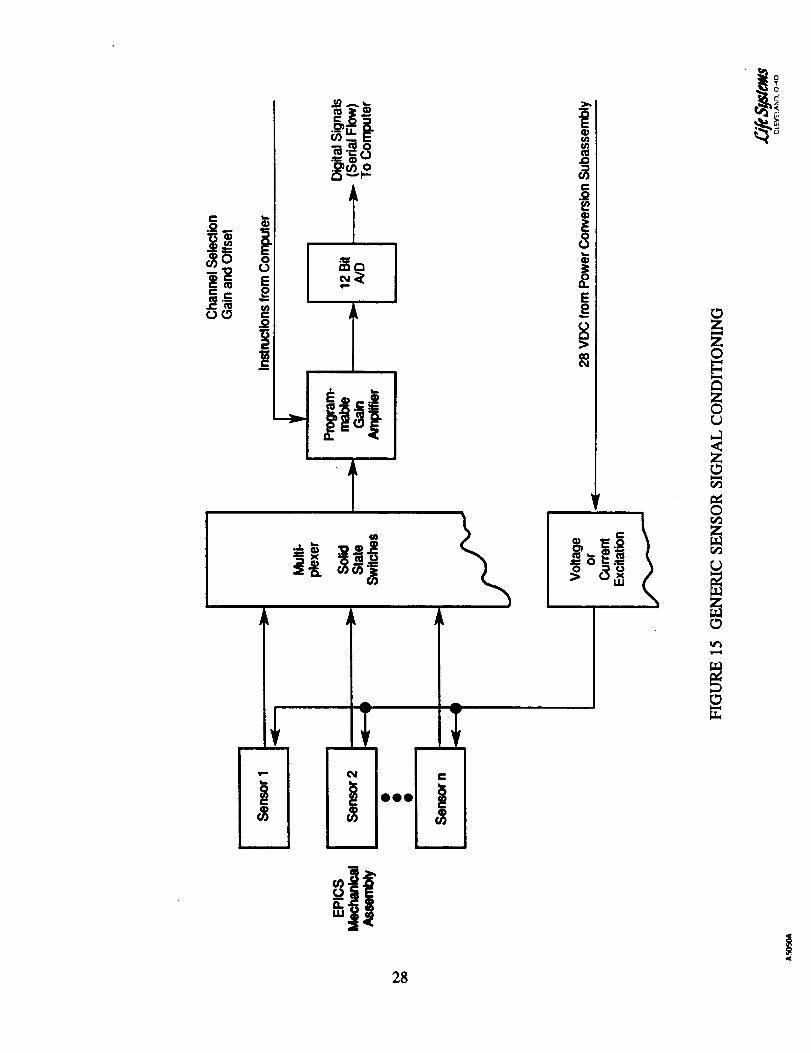
Generic Sensor Signal Conditioning. The C/M I Generic Sensor Signal Conditioning
Subassembly is responsible for processing sensor signals from the M/E A. A schematic
representation of the Generic Sensor Signal Conditioning Subassembly is shown in Figure 15.
The sensor ranges and accuracies are shown in Table 2.
Actuator Signal Conditioning. The EPICS Actuator Signal Conditioning electronics
processes the logic signals from the Computer to drive the actuators (i.e., heaters, fans and
current controllers). The Actuator Signal Conditioning is shown in Figure 16. As indicated
in this Figure, the Actuator Signal Conditioning includes an Actuator Watchdog Timer. This
device continuously monitors a toggling signal from the Computer. If the Computer locks
up, the Actuator Watchdog Timer will timeout after 500 msec and safe state (i.e., unpower)all actuators.
Current Controllers. The EPICS experiment contains three independent Current Controllers
(i.e., one for each IEU). The Current Controllers are responsible for providing a controlled
current to the integrated electrolysis cell in either a electrolysis-only or a dual
electrolysis-recombination mode. A Current Controller is shown in Figure 17.
Sensor Dedicated Shutdown Unit. The C/M I includes three independent SDSUs (i.e., one
SDSU for each IEU). These devices are independent circuit controls that will terminate
power to the IEU heater and the Current Controller if a fault condition is detected on its
dedicated sensors. A schematic representation of an SDSU is shown in Figure 18. As
indicated in this figure, for each SDSU and IEU pair, the power to the IEU heater and
Current Controller must travel through two relays connected in series. Three of the
dedicated sensors are on/off devices (i.e., pressure switches and a thermostat). The fourth
sensor is a temperature sensor. This sensor has its own signal conditioning and comparator
circuit separate from the Generic Sensor Signal Conditioning circuitry.
Front Panel. The EPICS Front Panel is illustrated in Figure 19. This panel provides the
ability to manually initiate the experiment and to stop all or part of the experiment if desired.
Automatic shutdowns of the IEUs are indicated with a red Light Emitting Diode (LED).
A C/M I cooling fan is mounted on the Front Panel. This fan operates whenever the C/M I
is powered. Similar to the other fans, it has an inlet air filter to keep middeck airbornedebris out. The air filter is fabricated from a 70-mesh stainless steel screen.
27
!
I I i
C
o
28
SHstcmsJHc.
TABLE 2 EPICS SENSOR RANGES AND ACCURACY
No. Description
1 Cell Voltage
2 Cell Voltage
3 Cell Current
4 Cell Temperature
5 Cell Temperature (SDSU) (d)
6 Air Outlet Temperature
7 Combustible Gas Sensor
8 Accumulator Level
9 Pressure Switch (d)
10 Heater Thermostat (e)
11 IEU Thermostat (d)
Symbol Normal Range Accuracy
El, E3, E5 1.4 to 2.1 V +0.002 V
E2, E4, E6 0.4 to 1.0 V -1-0.002 V
I1, 12, I3 0 to 7 A -1-0.1 A
T1, T2, T3 65 to 140 F + 1.0 F
T4, T5, T6 150 F (a) + 1.0 F
T7 65 to 113 F +1.0 F
CG1 0 +0.1% H 2 in Air
Y1 to Y6 20 to 80% -t-5%
P1 to P6 20.2 psia (a) +0.5 psi
HS1 to HS3 160 F (a,b) (b)
TS1 to TS3 150 F (a,c) (c)
(a) Setpoint values.
(b) Shall open on increasing temperature at 160 -I- 5 F and close on decreasing
temperature at 145 + 5 F.
(c) Shall open on increasing temperature at 150 + 5 F and close on decreasing
temperature at 135 + 5 F.
(d) This sensor is connected to the SDSU. It is not connected to the Generic Sensor
Signal Conditioning Subassembly.
(e) This sensor is used for overtemperature protection and will interrupt current flow to
the heater if the setpoint is exceeded. It is not connected to the Generic Sensor
The C/M I software is stored in Erasable Programmable Read Only Memory (EPROM)
within the Computer. The EPICS has three basic modes: Normal, Shutdown and
Unpowered. These modes and the allowable mode transitions are illustrated in Figure 20 anddescribed in Table 3.
During Normal mode, the software controls the test sequence, monitors sensors and
manipulates actuators. The test sequence control loop block diagram is illustrated in
Figure 21. The test sequence control consists of enabling current and temperature control
loops with predetermined setpoints. The current control loop algorithm is illustrated in
Figure 22. This loop maintains cell current at proper levels by sending setpoint information
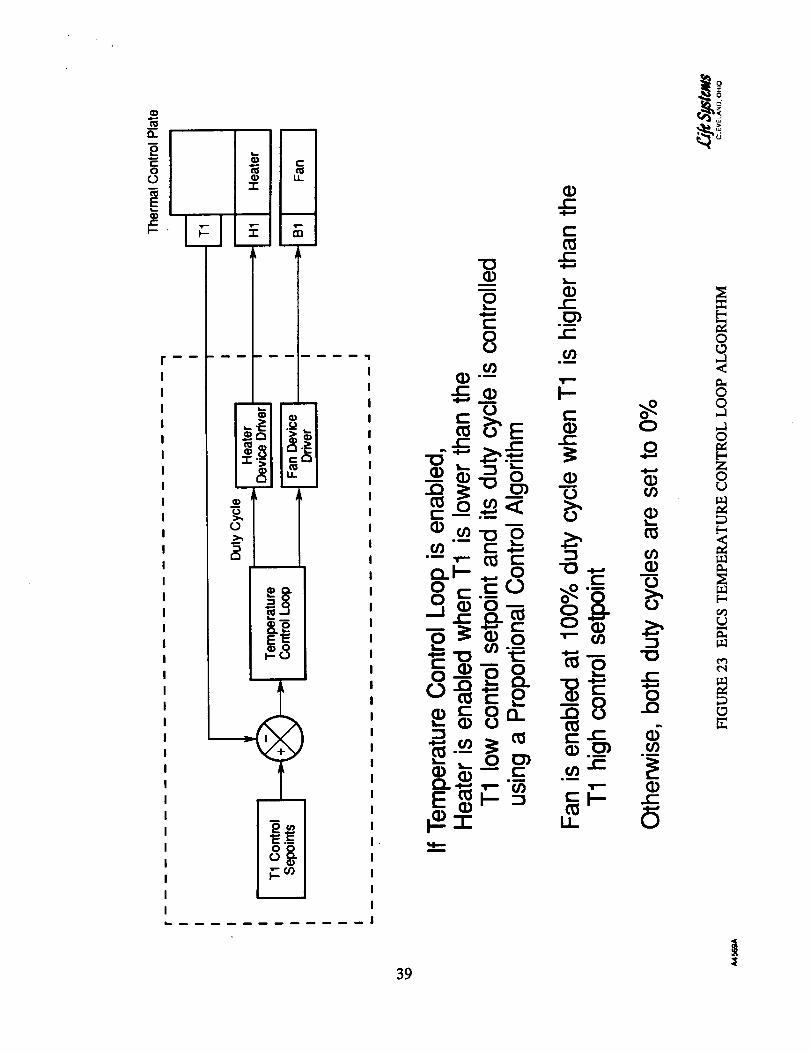
to the Current Controller and monitoring performance. The temperature control loop
algorithm is illustrated in Figure 23. This loop maintains the IEU at the desired temperature
by manipulating heat input or cooling air flow based on the setpoint deviation. During
temperature ramping, only the heater is enabled. During electrolysis-recombination periods,both the heaters and the fans are enabled. The heaters and fans are controlled such that
either one or the other is on but not both depending on whether the temperature is above orbelow the setpoint.
Simultaneously, while the test sequence is being controlled, the software is also monitoring
the sensors for high or low limit alarms. The sensor limits that will initiate a shutdown areshown in Table 4.
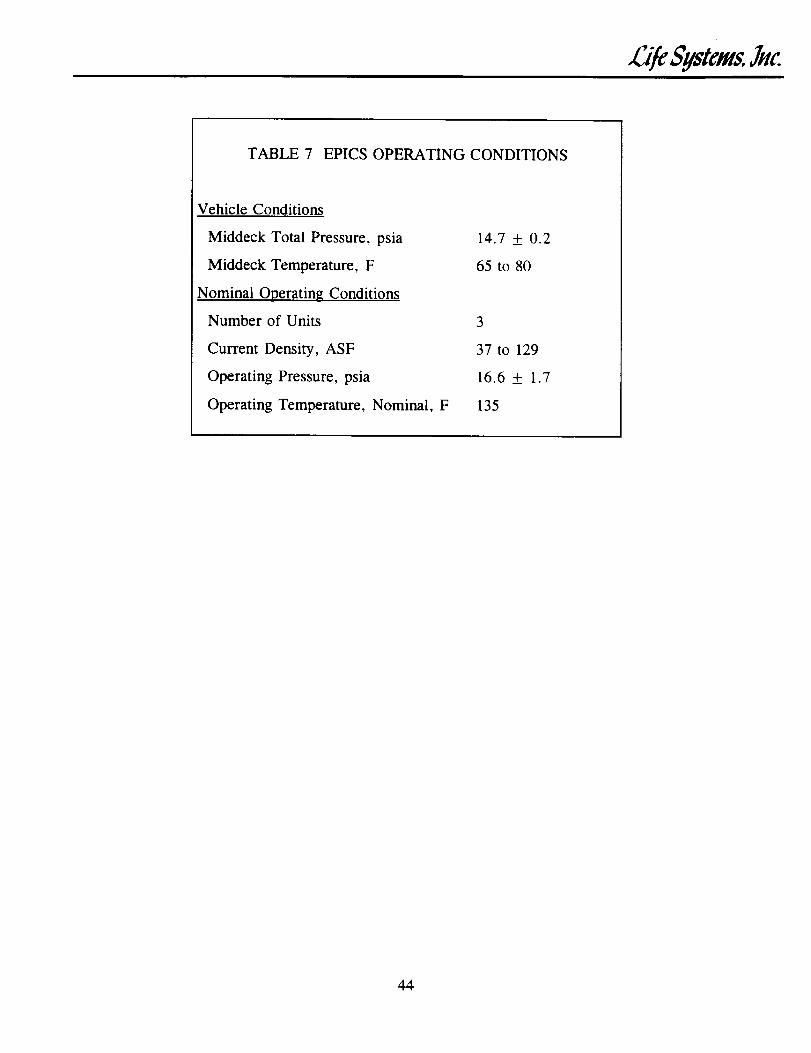
EPICS Operation
The EPICS experiment begins operation when activated by a crew member. A generalized
test sequence for a given day is shown in Figure 24. The C/M I actions are described in
Tables 5 and 6. The operating conditions are presented in Table 7.
The EPICS experiment initially starts out with all of the IEUs evacuated. Upon experiment
activation by a crew member, each IEU begins heating up to the operating temperature. At
the end of the temperature ramp, the current controller applies a specified current to the
electrolysis cell only. This generates H 2 and 0 2 and starts pressurizing each IEU. When
the internal pressure reaches approximately 16.6 psia, each accumulator expands to about one
half of its available travel range. This volume of gas provides a buffer for the recombiner
cell to account for electrochemical inefficiencies. The current controller then switches over
to combined electrolyzer/recombiner operation. The identical current then flows through the
electrolyzer and the recombiner thus matching the gas generation rate with the gas
consumption rate. The EPICS remains in this state for approximately 6.5 hours.
During this electrolysis/recombination period, all sensors are continuously monitored for
fault conditions. Thermal control of the integrated electrolysis cell is accomplished by
adding or removing heat using the IEU heater or circulating middeck air over the coolingfins on the TCP.
34
_[c S¢stcms,Jec.
, I
Normal
(A)
P
Unpowered
(D)A
w
Shutdown
(B)
• 3 Modes
• 2 Operating Modes• 5 Mode Transitions
• 3 Programmable, Allowable
Mode Transitions
FIGURE 20 EPICS MODES AND ALLOWABLE MODE TRANSITIONS
03/12/92
35
£i/c Systems,JHc.
TABLE 3 EPICS OPERATING MODES AND UNPOWERED MODE DEFINITIONS
Mode (Code) Definition
Normal (A)
Shutdown (B)
Unpowered (D)
The Integrated Electrolysis Units (IEUs) are performing their function
as specified by the test sequence being performed by the controller.
The units are in the desired temperature range as specified by the
controller. Normal Mode is initiated by:
• Manual actuation
No current is being supplied to the IEUs. The experiment is powered
and all sensors are active. The Shutdown Mode is initiated by:
• Manual actuation
• Low Recombiner Cell Voltage (E2, E4, E6) on each IEU (a)
• High or Low Electrolysis Cell Voltage (El, E3, E5) on each IEU (a)
• High or Low Cell Current (I1, 12, 13) on each IEU (a)
• High or Low IEU Temperature (T1, T2, T3) on each IEU (a)
• High Air Outlet Temperature (T7)
• High or Low Accumulator Level (Y1, Y2, Y3, Y4, Y5, Y6) oneach IEU (a)
• High Combustible Gas Level (CG1)
• Power on reset from Unpowered Mode (D)
• Mode transition from Shutdown Mode (B) to Normal Mode (A) wasnot successful
No electrical power supplied to the EPICS unit. The Unpowered
Mode is initiated by:
• Manual request• Power failure
• CMC alarm
(a) It is possible for an individual IEU to be shut down while the other two operate
normally. These parameters can initiate this along with SDSU cell temperature, H 2or 0 2 pressure switch, and IEU thermostat.
TABLE 10 CHARACTERISTICS OF EPICS TEST SUPPORT ACCESSORIES
Item Name:
Model Number:
Top Assembly Number:
Estimated Weight, Ib:
Estimate Size (LxWxH), in:
Work Area Required, ft 2
Interfaces:
Estimated Power Requirements, W:
Wire Harness/Test Cable Requirements:
.(a)Fluid Requirement_ :
EPICS Test Support Accessories
D-8715
100
30 x 48 x 75
48
Deionized Water
High Purity N 2Facility Power at 208 VAC, 3-Phase
500
Power Interface Cable with Standard Orbiter
Power Connector
Deionized Water 200 cc (Batch Charged) High
Purity N 2 40 L (Supplied at 5 psig)
(a) Fluid requirements are maximum values based on one complete purge cyclefor all three IEUs.
49
Systems,JHc.
Diagnostic Computer
The EPICS diagnostic computer is a standard IBM-compatible computer. This computer was
utilized extensively during testing at Life Systems and at the JSC and the Kennedy Space
Center (KSC). The primary purposes of the diagnostic computer are to provide a means of
displaying internal C/M I data and to provide a mechanism for issuing control commands to
the C/M I. The diagnostic computer operates independently of the C/M I and utilizes Life
Systems Diagnostic Test Software (DTS). The diagnostic computer uses the RS-232 serial
interface to communicate to the C/M I. The major characteristics for the diagnosticcomputer are shown in Table 11.
When the diagnostic computer is connected to the EPICS C/M I serial interface and the DTS
program is executed, the operator has the capability to view setpoints, raw sensor values,
processed sensor values and other C/M I parameters. For calibration purposes, a known
voltage can be supplied to the external voltage channel and a comparison can be made to the
processed values. In addition to the display capability, the DTS program also provides the
capability to override controls or manually activate the actuators. This feature is utilized
when a hazard control or actuator needs to be tested. It should be noted that these changes
are temporary and do not affect the software stored in the Erasable Programmable Read Only
Memory (EPROM). In order to obtain the original EPICS software (i.e., free of alteration)
the C/M I needs only to be powered down then powered up.
Calibration Equipment
The EPICS GSE calibration equipment consists of calibrated voltage source and a digital
multimeter. These devices were utilized at Life Systems and KSC to check the calibration of
the EPICS C/M I. The characteristics of these devices are shown in Tables 12 and 13.
The calibration equipment was utilized prior to acceptance testing and both prior to and
following the mission. This equipment was used in conjunction with the diagnostic
computer. The calibration check consisted of connecting a calibrated and verified voltage
source to the EPICS external voltage connector and comparing the internal C/M I values with
the source values. An interface block diagram for this operation is shown in Figure 26.
Mission Scenario
The mission for the actual flight experiment extends to two consecutive 24-hour days of
testing for approximately eight hours of testing each day. The test plan is shown in Figure
27 and basically consists of two current variations, 2 and 7 A, over the two-day period.
Since the EPICS flight experiment is fully automated, the only requirement for the crew is
the initial actuation of the experiment. The C/M I is designed to handle the complete
sequencing of the experiment and storage of data. No special data links or audio visual
equipment are needed. The crew can manually terminate power to the experiment at anytimewithout creating a hazard.
50
£ife SHstems.Jnc.
TABLE 11 CHARACTERISTICS OF DIAGNOSTIC COMPUTER
Item Name:
Model Number(a):
Top Assembly Number:
Estimated Weight, lb:
Estimate Size (LxWxH), in:
Work Area Required, ft 2
Interfaces:
Estimated Power Requirements, W:
Wire Harness/Test Cable Requirements:
Fluid Requirements:
Diagnostic Computer
IBM PS/2 Model 70 386
Not Applicable
50
30 x 24 x 20
9
Facility Power at 115 VACRS-232 Serial Communications
500
Custom Serial Interface Cable from
EPICS C/M I to Serial Port on the
Computer
Not Applicable
(a) The model number shown here is only one of many. Any computer compatible
with this model is acceptable.
51
SHstcms.JHc
TABLE 12 CHARACTERISTICS OF CALIBRATED VOLTAGE SOURCE
Item Name:
Model Number(a):
Top Assembly Number:
Estimated Weight, lb:
Estimate Size (LxWxH), in:
Work Area Required, ft 2
Interfaces:
Estimated Power Requirements, W:
Wire Harness/Test Cable Requirements:
Fluid Requirements:
Transportation/Handling Requirements:
Calibrated Voltage Source
Datel DVC 8500
Not Applicable
3
6x6x3
4
Facility Power at 115 VAC
C/M I External Voltage Channel
10
Standard Test Leads
Interface Cable to C/M I
Not Applicable
Normal Requirements for PortableInstrumentation
(a) Any equivalent model number to the one shown here is applicable.
52
£i/e Systems,:uc.
TABLE 13 CHARACTERISTICS OF DIGITAL MULTIMETER
Item Name:
Model Number(a):
Top Assembly Number:
Estimated Weight, lb:
Estimate Size (LxWxH), in:
Work Area Required, ft 2
Interfaces:
Estimated Power Requirements, W:
Wire Harness/Test Cable Requirements:
Fluid Requirements:
Transportation/Handling Requirements:
Digital Multimeter
FLUKE 8060A
Not Applicable
1
8x4x2
4
Test Connection
Battery Powered (9 VDC)
Standard Test Leads
Not Applicable
Normal Requirements for PortableInstrumentation
(a) Any equivalent model number to the one shown here is applicable.
53
I
Ii
II
iI
II
_ua
8 _
°_
54
0 u.
i
Ai/e$ ste lue.
_Je_iment _l_dule
Day 1 2 3 (a) 4 (a) 5 (a) 6 (a)
Current, A 2 7 2 7 2 7
Test Duration, hr
IEU1 8 8 8 8 8 8IEU2 8 8 8 8 8 8IEU3 8 8 8 8 8 8
LL
0-Ea)
I--
160
150
140
130
120
110
100
Normal Operation
Transition
I I I I I I I I I I
1 2 3 4 5 6 7 8 9
Time, hr
10
Each eight-hour period consists of one and one half hours of startup, followed by six and onehalf hours of operation at 135 F.
(a) The experiment may be repeated during the mission at the discretion of NASA
FIGURE 27 FLIGHT TEST PLAN FOR EPICS EXPERIMENT
02/03/94
55
@stems,l#c
TESTING AND DATA ANALYSIS
Acceptance Testing
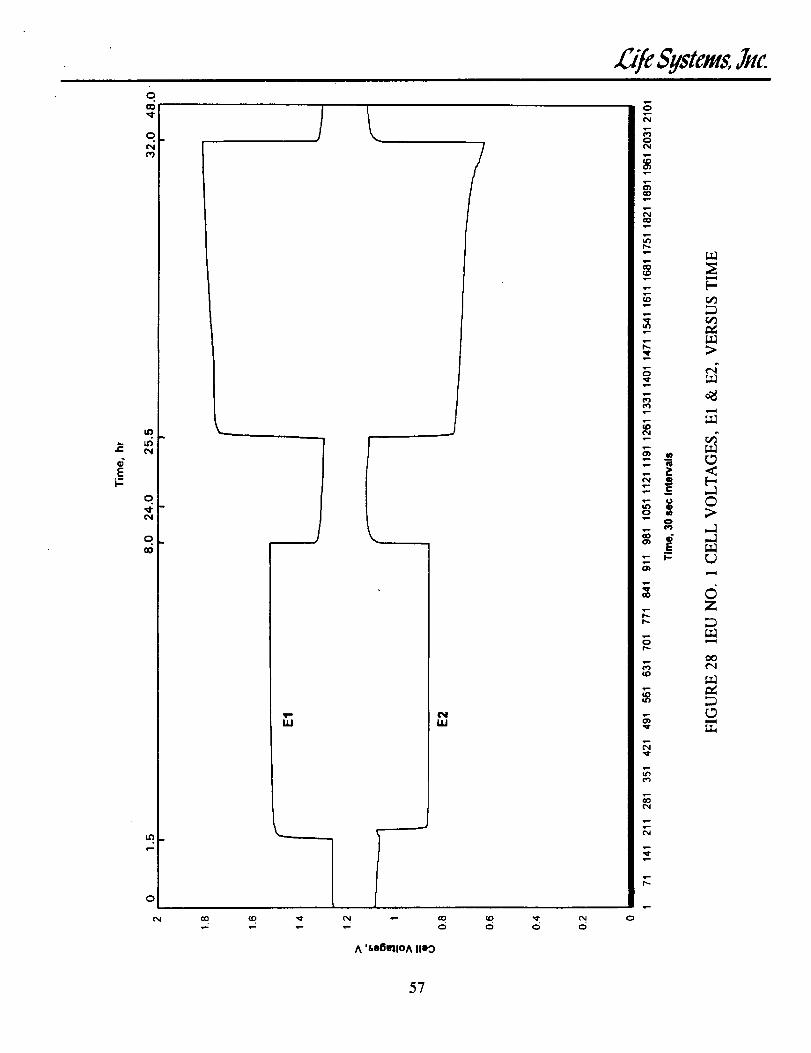
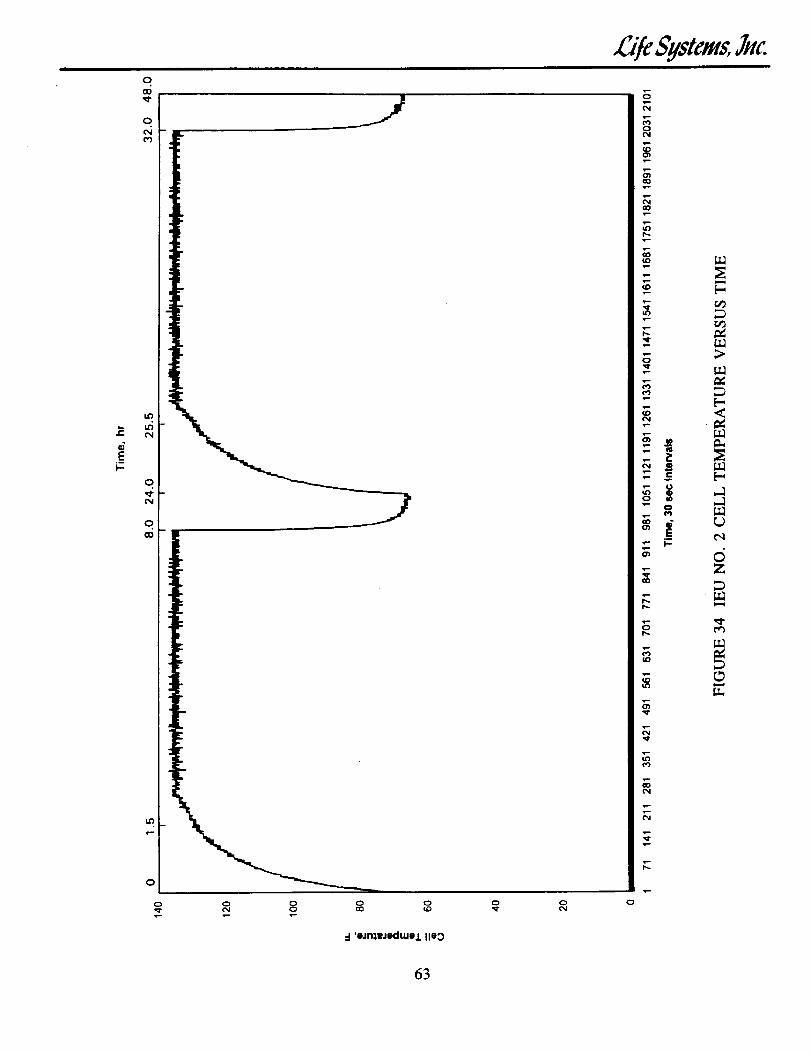
A two-day operational test was performed as a part of the Acceptance Test. The cell
voltage, current, temperature and accumulator positions of the IEU's are presented in
Figures 28 through 39. Figure 40 represents the air outlet temperature date during the two-
day test.
Flight Experiment
The flight experiment of the EPICS on STS-69 Endeavor was activated at the Mission
Elapsed Time (MET) of 4:09 on September 7, 1995. Discussed below are the results and
analysis of the flight experiment operation data of the three IEUs:
IEU1
Approximately 22 min into the initial warmup period on the first day, IEU1 went into a safe
automatic shutdown. Post-flight analysis of flight data, verification tests and investigation of
anomaly at components level determined that the automatic shutdown was caused by a
defective temperature sensor, T4.
This temperature measurement falsely indicated that the cell had exceeded the high cell
temperature limit of 150 degrees F, when it was actually 116 degrees F. The SDSU detected
this incorrect temperature measurement and terminated power to the heater. The unit then
went into a safe shutdown due to a preprogrammed low-temperature shutdown.
IEU2
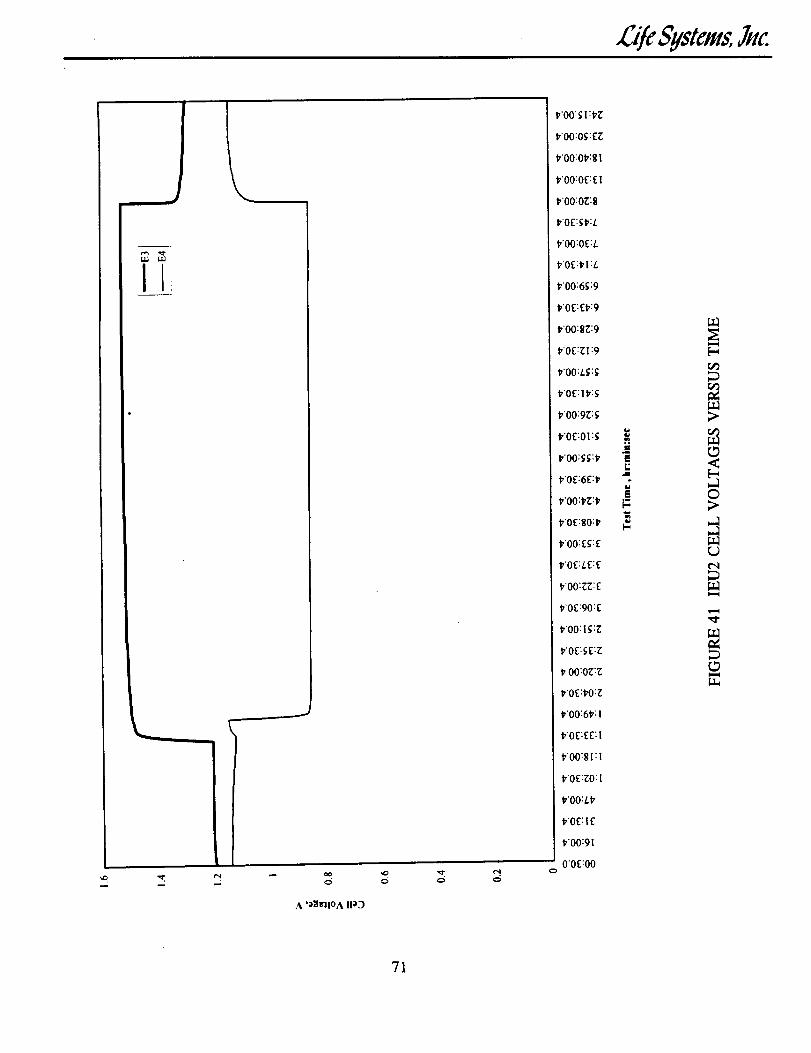
Testing of IEU2 continued successfully through the first day of operation at 2A (37 ASF),
into the 16-hr quiescent period and into the warmup period for the second day of operation at
7A. The performances of both the electrolyzer cell and recombiner cell were nominal, at
1.53 volts nd 0.8 volts, respectively. Approximately 24 min into the second day warmup
period, IEU2 went into a safe automatic shutdown. Post-flight data analysis and tests
determined that the shutdown was caused by an erroneously enabled fault detection during
the warmup period sensing the electrolyzer cell voltage lower than 1.3V, a voltage which isnormal for an open circuit mode.
The low electrolyzer cell voltage fault detection should not have been enabled during the
warmup period. Inspection of the computer software code determined that this shutdown was
caused by a missing line of software code. The missing code would have disabled the
electrolysis mode low voltage shutdown during the warm-up phase. The low voltage limit of
1.3 V was not reached during pre-flight ground testing, and the missing line of software code
was not detected. The shutdown was recreated during post-flight testing by simulating a low
cell voltage input during the second warmup phase.
56
.E
EI--
0
0
0
qa0
o
/
U.I
a0 co ,_.
UJ
d
Q
A '.so6_IOA lion)
o 0 c_
£t_ Systems,]ttc.
57
0
T,-
_n
e4
.. c
_ 6Z
p_
.e _.,
N
N
P,d
__ $_stcms..Inc.
0
8
V"
"41"
r_ O_m t"4
r,
r.,,.
o
o
58
_5"/eSHstems.:#c.o
o
i:0
o
m
•4 'oJn_eJed,,,O.L lied
0
m
,_ E"
E
o Z
_ m
r_N _
N
N
O,I
r,
59
oCO
0
c_CO
u_
£°_I--
o.c_
oQ)
U_
0
L
% 'UOll,!SOd JO;Ulnmnooy
__ Systems,Jnc.
5
v-.
,e=
.e-
E dZ
N
F, ,-q_
N
N
N
O
6O
.E
EI-
o
o
o
U_
v-
oJ ,I
ILl
/I
CN
A 'e6_lOA lie:)
ILl
I
0
q
_D
0
q
0
C_
0
_7c @stous,]Hc
61
0
0rsl
oO
cosr_
r._
0
m
0
T- m
o _0
6z
b,.
_,.
"It
0
E
Z
=
o,@e_
o
GO "
.0
I q I I _ I
_0
62
_fc SHstcms.JHc
0
N
v-
v-
T-
v-
T-
v-
Z
,- _=
I-
0
0
EI.-
o
00
o
(v)
0
o
o
0
-I 'eJn),wJedLUe I. IleO
0 0_" ('M
63
£tB SHs/e_s,;.c.
Q
0
§ °o ,-.t
i z
N
N
N
__ Systems,JHc.
.E
0
0
0
o 0 0 0 0 0
% 'UOll!SOd JO;Wlnwnoov
P
-" F-
v-
s __ _ rj
_ <
r. dZ
N
N '-co
N
o
64
o
00
0
CO
ti3
E
o
o
00
L_
o
\
W
_o _
W
0
A 'Og_lOA IleO
0 0 0
_ Systemz]Hr.
65
0
0
F_
0
oOv-
F_
v-
v-
(--
_o u@
E•- F-
_D
W_
F_
e_
_o
0co
0C_
t_
oeq
0
1.0
v-
o
Lt)
__ Systems.JHc.
¢qoA_
0fq
l"v-
0
66
EJ--
0
:I 'eJnlPdedtuej. 11o:3
67
._/c Systems.JHc
0
0
ao
CO
p_v-
cO
(%1
e- __
0
Z
¢q_D
Cq
0
I--
0
o0_r
o_
o.r4_
;
0
o0
u_m
0
>-
% 'uoBISOd aO;Ulnmnooy
__ Systems,]Hc.
P
_d
o
g
<
6Z
L_
_r
o
68
0
0
E
0
0
0
0 o 0O o_ coqr-
0 0 0 0 _ 0 0
d 'eJmeJed,,,eJ.
69
_/e @stems.;uc.
0
Po0
T..
q..
p..
q..
§ . r-
b,.
N
N
N
N
0
SHstcms.:#c.
IEU3
Testing of IEU3 continued successfully through the first day of operation at 2A (37 ASF),
into the 16-hr quiescent period and into the warmup period for the second day of operation at
7A. Approximately 25 rain into the warmup period, IEU3 went into a safe automatic
shutdown. Post-flight data analysis and tests determined that the shutdown was caused by thesame reason as that for IEU2.
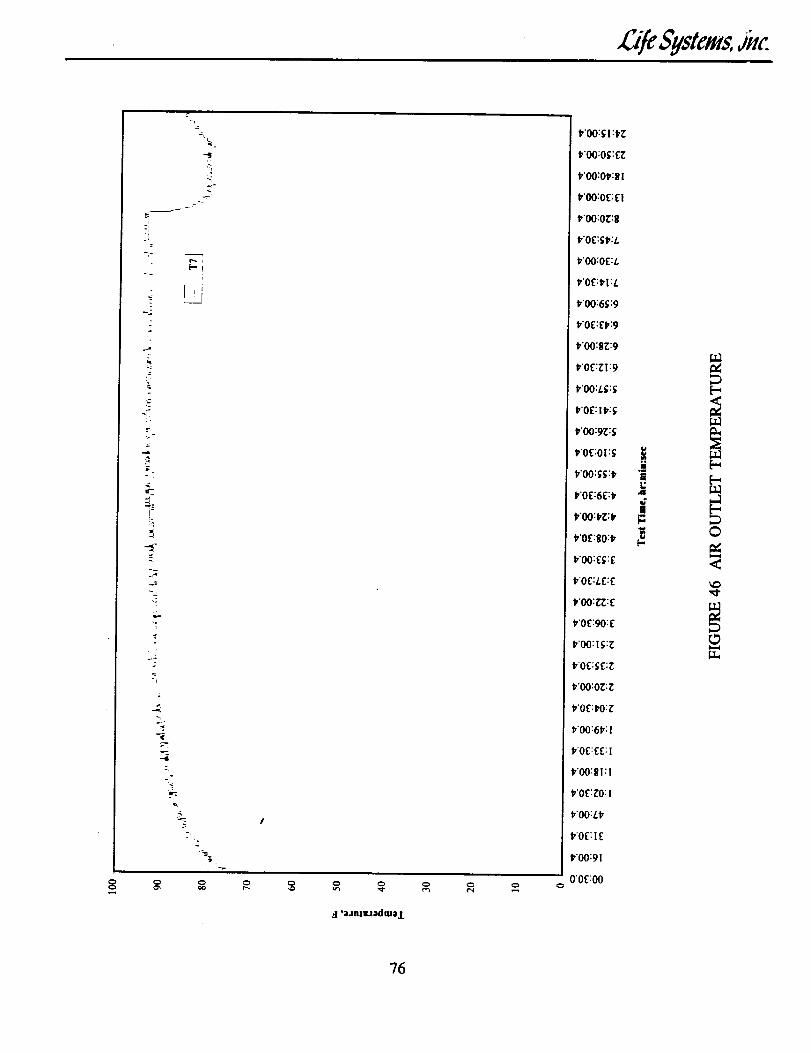
Flight Experiment
The results of the flight experiment during the first day of operation at 2A (37 ASF) areshown in Figures 41 through 46.
CONCLUSIONS
Based on the work performed and reported herein the following conclusions have beenreached:
.
.
.
.
.
The electrolysis cell concept of the SFE technology can successfully generate
hydrogen and oxygen in a microgravity environment.
Performance improvements, both in power consumption and heat load generationwere observed which are considered attributable to beneficial effects of the
microgravity environment. A 3 to 6% reduction in power and 30 to 60%
reduction in heat load were observed at the operating current density of37 amps/ft 2.
The two failure tolerant design concepts incorporated in to the EPICS resulted in
safe on-orbit operation and shutdown protection.
A first ever demonstration of the unitized regenerative fuel cell concept for
potential energy storage application was successfully demonstrated by consuming
water generated by the electrochemical reactions of a fuel cell and producingpower by consuming reactants generated by the electrochemical reaction of the
electrolysis cell.
Inhibits and shutdown protection implemented via software must be verified on
an individual basis for all phases of experiment operation to avoid inadvertentunwanted shutdowns.
RECOMMENDATIONS
1. Refly the EPICS experiment at the earliest opportunity.
2. Replace failed temperature sensor on IEU1 with verified device.