Page 1
STATUS OF THESIS
Title of thesis Hydroformylation of Higher Olefins Using Radium Phosphite Complex Catalyst
I, MAIZATUL SHIMA SHAHARUN
hereby allow my thesis to be placed at the lnfonnation Resource Center (IRC) of Universiti Teknologi PETRONAS (UTP) with the following conditions:
I, The thesis becomes the property ofUTP
2, The IRC ofUTP may make copies of the thesis tor academic purposes only,
3, This thesis is classified as
c Confidential
~ Non-confidential
If this thesis is confidential, please state the reason:
The contents of the thesis will remain confidential for _____ years,
Remarks on disclosure:
Signature of Author
Permanent address:
29, Persiaran Perdana 13, Taman Pinj i Perdana, 3 I 500 Labat, Perak
~ _.'
Endorsed by 'i', '
K J)cJPi-
Date: _1_/_~~/_0 '1 __ _ Date : _ 1__:_/_,&/'--0-'-1 __
ii
Page 2
UNIVERSITI TEKNOLOGI PETRONAS
HYDROFORMYLA TION OF HIGHER OLEFINS USING RHODIUM PHOSPHITE
COMPLEX CATALYST
by
MAIZATUL SHIMA SHAHARUN
The undersigned certify that they have read, and recommend to the Postgraduate Studies
Programme for acceptance this thesis for the fulfilment of the requirements for the degree
stated.
Signature:
Main Supervisor:
Signature:
Co-Supervisor:
iii
Page 3
UNIVERSITI TEKNOLOGI PETRONAS
HYDROFORMYLATION OF HIGHER OLEFINS USING RHODIUM PHOSPHITE
COMPLEX CATALYST
by
MAIZATUL SHIMA SHAHARUN
A Thesis
Submitted to the Postgraduate Studies Programme
as a Requirement for the Degree of
DOCTOR OF PHILOSOPHY IN
CHEMICAL ENGINEERING
UNIVERSITI TEKNOLOGI PETRONAS
BANDAR SERI ISKANDAR,
PERAK
AUGUST2009
IV
Page 4
DECLARATION OF THESIS
Title of thesis Hydroformylation of Higher Olefins Using Rodium Phosphite Complex Catalyst
I, MAIZATUL SHIMA SHAHARUN
hereby declare that the thesis is based on my original work except for quotations and
citations which have been duly acknowledged. I also declare that it has not been
previously or concurrently submitted for any other degree a\.\JTP or other institutions.
Signature of Author
Permanent address: 29, Persiaran Perdana I 3, Taman Pinji Perdana, 31500 Lahat, Perak
Date : __ '1,_/<c_.(_o_t __ _
v
/ \ '•
f \, .."_, __ --;~, Witnessed \?5' / I
;: -:; / ,i
1' ·'r-~· '
\,./"{! '~/
Signature of Supervisor
Name of SuBrvisor f?..-A ' w, ~ "'{! (j
Date:
Page 5
Incompliance the terms of the Copyright Act 1987 and the IP Policy of the university,
the copyright of this thesis has been reassigned by the author to the legal entity of the
university,
Institute of Technology PETRONAS Sdn Bhd.
Due acknowledgement shall always be made of the use of any material contained in,
or derived from, this thesis.
© N arne of candidate, Year of Thesis submission
Institute of Technology PETRONAS Sdn Bhd
All rights reserved
VI
Page 6
ACKNOWLEDGEMENT
Praise and gratitude to the almighty, Allah, the creator and governor of the universe and
his prophet Mohammed, peace upon him.
I wish to express my deepest gratitude and appreciation to my respectful supervisor,
Prof. Dr. Binay K Dutta for his invaluable guidance, patience, support and enthusiasm
throughout this research work. It was a great pleasure to conduct this research under his
constructive comments. I would like to express my sincere appreciation to Assoc. Prof.
Dr. Hilmi Mukhtar who provided an inspiration, motivating and critical atmosphere
during the course of my study. The merit also goes to Mr. Bobby Ho ofHisco (Malaysia)
Sdn. Bhd., AP Dr Suzana Yusup and Prof. Duvvuri Subarao for their warm cooperation
and assistance in providing me the technical guidance to operate the high pressure
reactor. I am also grateful to Prof. Dr. Subash Bhatia and AP Dr Saikat Maitra, for their
criticism, suggestions and stimulating discussions in the improvement of my journal
papers.
My special acknowledgement to Universiti Teknologi PETRONAS and Ministry of
Science, Technology and Innovation, under the Research Project No.03-02-02-SF0019:
Development of a green process for the production of higher aldehydes from olefins by
hydroformylation for the financial support that made this work possible. A special thank
you also goes to the technicians, Mr. Jailani Kasim, Mr. Fauzi Abu Bakar and Mr. Yusoff
Mohd for their assistance and useful discussions, in the use of the instrumentation of GC
FID, GC-MS and AAS respectively. Finally but definitely not the least, I also wish to
express my appreciation to all technicians, colleagues and countless individuals who have
contributed directly or indirectly towards accomplishment of my research work.
Dedication of this thesis is given with deepest appreciation to my late father,
Shaharun bin Ashaari and my beloved family for their endless love, understanding,
prayers, trust, encouragement and continued support morally, for which I'm forever
indebted.
" ....... .it was Your light that raised me,"
for my beloved children, husband, father and mother.
vii
Page 7
ABSTRACT
Hydroformylation of olefins with CO and Hz at total pressure of IS to 50 bar and
temperature of 80 to l20°C, in presence of rhodium (Rh)-based homogeneous catalysts
for production of aldehydes has demonstrated high yields and selectivity. Rh-based
catalysts are expensive and the commercial viability of a process that uses such catalysts
substantially depends on the efficiency of catalyst recovery and product separation. In
this work, a novel temperature dependent multi-component solvent (TMS) or
'thermomorphic solvent' system has been used as the reaction medium to investigate
hydroformylation of two higher olefins - 1-octene and 1-dodecene - to synthesize the
corresponding aldehydes at a lower pressure of 15-25 bar and temperature of 80 to
100°C. Such a solvent mixture changes thermally from biphasic to monophasic with
distribution of the products and of the catalyst in the non-polar and polar phases thus
simplifying the process of separation and recycling of the catalyst.
A TMS- system consisting of three components - propylene carbonate (PC), n
dodecane and 1,4-dioxane was used in this study. The presence of 1,4-dioxane imparts
the thermomorphic character to the solvent mixture. For a gas-liquid reaction, the
solubility of the reactant gas in the liquid medium is an important parameter required for
the interpretation of reaction kinetics. Therefore experimental measurement of solubility
of the gaseous reactants - CO and Hz - in the individual components of the solvent as
well as in their mixtures was performed up to a pressure of 1.5 MPa and temperature
range of 298-343 K. The effects of solvent composition, partial pressures of the gaseous
reactants - CO and Hz, reaction temperature and catalyst loading on the rate, yield and
selectivity of the linear aldehydes were also investigated. At a reaction temperature of
363 K and total pressure of 1.5 MPa and 0.68 mM HRh(CO)(PPh3)3, the conversion of 1-
octene and the yield of aldehyde were 97 % and 95 %, respectively. The aldehyde
product was recovered in the non polar phase whereas the catalyst remained in the polar
phase with low catalyst loss of 3 %. With a reaction-time of 2 h and a selectivity of 89 %,
this catalytic system can be considered as highly reactive and selective. The rate was
found to be first order with respect to catalyst, 1-octene and PH, . The rate vs. Pco
resembled a typical case of substrate inhibited kinetics.
viii
Page 8
The solubility data have been correlated using three models - an empirical model
based on the Henry's law, the regular solution theory with Yen and McKetta modification
and the modified UNIF AC model. The accuracy of prediction with the second model
without any adjustable constant was within 11.0 % whereas the UNIF AC model offered a
better accuracy of 8.5 %. In the kinetic study a mechanistic rate model for the
hydroformylation of higher olefins using Rh-based catalyst in a homogeneous system
was developed by using ab initio technique of quantum chemical computation to identifY
the rate-controlling steps in the reaction pathways. Computations were done for three
olefins- 1-decene, 1-dodecene and styrene- by the restricted Hartree-Fock method at the
second order Moller-Plesset level of perturbation theory and basis set of 6-31++G(d,p)
using the GAMESS Pro 11.0 program package. Three generalized mechanistic rate
models were developed on the basis of the reaction path analysis and experimental
findings available in the literature. The rate model with oxidative H2-addition as the
controlling step predicted the conversion of the three alkenes quite satisfactorily with an
average deviation of±7.6 %. The UNIQUAC and UNIFAC models were used to model
the catalyst and product recovery (at 298 K) of the hydroformylation of 1-octene. The
average deviation of the calculated mole fractions from the experimental values for the
UNIQUAC and UNIF AC method was ±6.5 % and ±8.2 %, respectively.
The work done has established the potential of the thermomorphic solvent system and
the rhodium phosphite complex catalyst for the hydrofonnylation of 1-octene and 1-
dodecene. In the range of conditions employed, the rate and selectivity calculated using
the developed mechanistic rate model and selectivity model were in good agreement with
experimental result. The work also concluded that the novel TMS system can be used to
produce valuable fine chemicals from syngas and olefin at a lower operating cost.
ix
Page 9
ABSTRAK
Hidroformilasi olefin dengan tindakbalas karbon monoksida dan hidrogen pada
tekanan 15-50 bar dan suhu pada 353-393 K dengan kehadiran mangkin homogen
berasaskan rodium (Rh) untuk pengeluaran alkanal telah menunjukkan hasil dan
selektiviti yang tinggi. Mangkin berasaskan rodium (Rh) berharga tinggi dan daya hidup
komersial sesuatu proses yang menggunakan mangkin tersebut bergantung kepada
kecekapan pemulihan mangkin dan pengasingan produk. Di dalam penyelidikan ini,
sistern multikomponen pelarut yang bergantung pada suhu (TMS) ataupun pelarut
termomorfik telah digunakan sebagai media tindak balas untuk mengkaji tindak balas
hidroformilasi menggunakan dua olefin berat - 1-oktena dan 1-dodekana - untuk
menghasilkan alkanal pada tekanan yang lebih rendah 15-25 bar dan suhu pada
353-373 K Bergantung kepada suhu, campuran pelarut tersebut berubah daripada dua
fasa kepada satu fasa, dan pengasingan produk serta mangkin berlaku dalam fasa tidak
polar dan polar. Keadaan ini memudahkan proses pengasingan dan kitar semula mangkin.
Sistern TMS yang mengandungi tiga komponen - propenakarbonat (PC), n-dodekana
dan 1,4-dioksana telah digunakan di dalam penyelidikan ini. Kehadiran 1,4-dioksana
mernberi sifat termomorfik kepada campuran pelarut tersebut. Untuk tindak balas gas
cecair, keterlarutan gas reaktan di dalam media cecair adalah salah satu parameter
penting yang diperlukan untuk mentafsirkan tindakbalas kinetik. Oleh itu sukatan
kelarutan gas reaktan - CO dan H2 - di dalam setiap komponen pelarut termasuk juga
campuran pelarut telah diperolehi melalui eksperimen sehingga ke tekanan 1.5 MPa dan
suhu dalam lingkungan 298-343 K. Kesan parameter proses seperti komposisi pelarut,
tekanan reaktan gas - CO and H2, suhu tindak balas dan pengisian mangkin terhadap
kadar tindak balas, hasil tindak balas dan selektiviti n-alkanal juga telah dikaji. Pada suhu
tindak balas 363 K, tekanan 1.5 MPa dan 0.68 mM HRh(CO)(PPhJ)J, penukaran 1-
oktena dan hasil alkanal masing-masing adalah 97% dan 95%. Produk alkanal telah
dipulihkan dalam fasa tidak-polar manakala, mangkin terkumpul dalam fasa polar
bersama kehilangan mangkin yang rendah iaitu sebanyak 3%. Dalam tindak balas se!arna
2 jam hasil eksperimen menunjukkan selektiviti sebanyak 89% dan sistem pemangkin ini
boleh dianggap sebagai reaktif dan selektif. Kadar tindak balas didapati bertertib satu
X
Page 10
terhadap mangkin, 1-oktena dan tekanan hidrogen. Kadar tindak balas terhadap tekanan
karbon monoksida menyamai kinetik perencatan substrat.
Data keterlarutan telah dihubungkaitkan menggunakan tiga models - model empirikal
berdasarkan hukum Henry, teori larutan biasa bersama ubahsuai Yen dan McKetta dan
model ubahsuai UNIF AC. Dengan menggunakan model kedua tanpa penyelarasan
konstan, ketepatan penganggaran adalah sekitar lingkungan ±11 %, manakala model
UNIFAC memberi ketepatan yang lebih baik iaitu sekitar ±8.5%. Di dalam kajian
kinetik, model kadar mekanistik untuk hidroformilasi olefin berat menggunakan mangkin
berasaskan-Rh di dalarn sistem homogen telah dihasilkan menggunakan teknik ab initio
secara pengiraan kuantum kimia bagi mengenalpasti langkah penentu kadar di dalarn
mekanisme tindak balas. Komputasi dijalankan untuk tiga olefin - 1-dekena, 1-dodekena
dan stirena - menggunakan kaedah Hartree-Fock pada tahap Moller-Plesset tertib kedua
daripada teori pertubasi dan set asas 6-31 ++G( d,p) menggunakan pakej program
GAMESS Pro 11.0. Tiga model kadar mekanistik dihasilkan berasaskan analisa
mekanisme tindak balas dan penemuan eksperimen yang tercatat dalarn penerbitan.
Model kinetik berasaskan oksidatif H2-tarnbahan sebagai langkah penentu kadar
manganggarkan perubahan ketiga-tiga olefin agak memuaskan dengan purata perbezaan
±7.6 %. Model UNIQUAC dan UNIFAC telah digunakan untuk mentafsirkan proses
pengasingan mangkin dan produk untuk hidroformilasi 1-oktena menggunakan sistem
TMS. Dengan menggunakan model UNIFAC, ketepatan penganggaran adalah sekitar
lingkungan ±8.2 %, manakala model UNIQUAC memberi ketepatan yang lebih baik iaitu
±6.5%.
Hasil keija ini telah membuktikan bahawa sistem TMS bersarna kompleks mangkin
Rh-fosfit mempunyai potensi untuk tindak balas hidroformilasi 1-oktena dan 1-dodekana.
Di dalam lingkungan keadaan yang digunakan, kiraan kadar tindakbalas dan selektiviti
menggunakan model kadar mekanistik dan model selektiviti menyamai dengan keputusan
eksperimen. Hasil keija ini juga telah merumuskan bahawa sistem TMS boleh digunakan
bagi menghasilkan produk kimia bemilai tinggi daripada tindak balas singas dan olefin
dengan kos operasi yang rendah.
Xl
Page 11
TABLE OF CONTENTS
PAGE STATUS OF THESIS n
APPROVAL PAGE m
DECLARATION OF THESIS v
ACKNOWLEDGEMENT vn ABSTRACT vm ABSTRAK x TABLE OF CONTENTS xn LIST OF TABLES xv1 LIST OF FIGURES xvm NOMENCLATURE xx
CHAPTER 1: INTRODUCTION 1 1.1. Hydroformylation of Olefins I 1.2. Recent Technological Developments 6
1.2.1. Aqueous Biphasic Catalysis 6 1.2.2. Non-aqueous Catalysis 7
1.3. Problem Statement 9 1.4. Objectives of the Study 10 1.5. Scope of the Study II
1.5.1. Development of a novel temperature dependent multi-component 11 solvent (TMS) system
1.5 .2. Study on the Effect of Operating Conditions 12 1.5.3. Development of Kinetic Models 13 1.5.4. Liquid-liquid equilibrium (LLE) Behavior and Distribution 13
CHAPTER 2: LITERATURE REVIEW 14 2.1. Hydroformylation Catalyst 14 2.2. Mechanism ofHydroformylation 15
2.2.1. Unmodified Catalyst 16 2.2.2. Phosphine Modified Catalysts 17
2.3 Kinetic Study 20 2.4. Influence of Process Parameters 29 2.5. Solubility and Reaction Rate of Linear a-Olefin in Water. 30 2.6. Solubility Study and Thermodynamic Modeling 32 2.7. Liquid-liquid Equilibrium Study 33 2.8. Summary 36
CHAPTER 3: DEVELOPMENT OF THE MECHANISTIC RATE 37
3.1 MODEL USING AB INITIO CALCULATION
Kinetic Models 3 .1.1. Developing Empirical Models 3.1.2. Developing Mechanistic Models
xu
37 37 38
Page 12
3 .1.3. Empirical versus Mechanistic Models 3.2. Approaches to Kinetic Modeling 3.3. Molecular modeling
3 .3 .1. Electron Correlation Methods 3.3.1.1. Meller-Plesset Perturbation Theory 3.3.1.2. Density Functional Theory
3.3.2. Geometry Optimization 3.4. The ab Initio Molecular Orbital Calculation 3.5. The Reaction Pathways 3.6. Computational Methodology
3.6.1. Test Calculation 3. 7 Results and Discussion
3. 7 .1. Quantum Chemical Calculation 3. 7 .1.1. Alkene Insertion 3.7.1.2. Formation of Acyl Complex 3. 7 .1.3. Hz Oxidative Addition 3. 7 .1.4. The Potential Energy Profile
3.7.2. Development of the Mechanistic Rate Equation 3. 7.3 Determination of the Rate Parameters
38 39 40 43 44 45 46 47 50 53 56 58 58 58 59 60 62 64 67
CHAPTER 4: MATERIAL AND METHOD 78 4.1. Materials 78 4.2. Development ofthe TMS-system 79
4.2.1. Composition of the TMS- Systems 79 4.2.2. Determination of the Gas Solubility 80
4.2.2.1. Pressure Test 82 4.2.2.2. Purging and Evacuation 82 4.2.2.3. Solubility Experiment 82
4.3. Pararneteric Study of Reaction Variables and Kinetic Study 85 4.3.1. Pressure Test 88 4.3.2. Reaction and Kinetic Measurement 89 4.3.3. Solubility Measurement 89
4.4. Liquid-liquid Equilibria 90 4.4.1. Distribution Coefficient 91
4.5. Analytical Techniques 91 4.5.1. Gas Chromatography 91 4.5.2. Atomic Absorption Spectroscopy 92
CHAPTER 5: RESULTS AND DISCUSSION 93 5.1. Development of the TMS- System 93
5.1.1. TMS-systerns: PC+Dodecane+1,4-Dioxane 93 5 .1.2. Solubility Data 94 5 .1.3. Empirical Modeling 98 5.1.4. Thermodynamic modeling 99
5.1.4.1. Prediction of Hz and CO Solubility by the RST- based 100 Model
xiii
Page 13
5.1.4.2. Prediction of H2 and CO Solubility by the Modified I 02 UNIFAC Group Contribution Model
5.1.4.3. Results of the Thermodynamic Modeling 106 5.2. Parametric Study of Reaction Variables I 09
5.2.1. Selection of Solvent Composition 109 5.2.2. Effect of Reaction Parameters 112
5.2.2.1. Effect of Catalyst Concentration 112 5.2.2.2. Effect of Temperature 115 5.2.2.3. Effect of the Total Pressure of Syngas 117 5.2.2.4. Effect of CO/H2 Ratio 118 5.2.2.5. Effect of Ligand to Catalyst Ratio 119 5.2.2.6. Effect of 1-0ctene Concentration 122
5.3. Kinetic Study 123 5.3 .I. Solubility of CO and H2 123 5.3.2. Kinetics 124
5.3.2.1. Effect of Catalyst Concentration 125 5.3 .2.2. Effect of 1-0ctene Concentration 126 5.3.2.3. Effect of Hydrogen Partial Pressure 127 5.3.2.4. Effect of Carbon Monoxide Partial Pressure 128
5.3 .3. Kinetic Modeling 129 5.3.3.1. Empirical model 129 5.3.3.2. Mechanistic model 134
5.4. Liquid-liquid Equilibrium Study 143 5.4.1. Liquid-liquid equilibrium data 144 5.4.2. Thermodynamic modeling 150
5.4.2.1. UNIQUAC (UNiversal QUAsi-Chemical) model 151 5.4.2.2. The UNIFAC (UNIQUAC Functional Group Activity 152
Coefficients) model 5.5. Additional Validation ofUNIQUAC and UNIFAC Model 161
CHAPTER 6: CONCLUSION AND RECOMMENDATIONS 6.1. Conclusion 6.2. Recommendations for Future Work
REFERENCES
APPENDIX A Key Structures Involved m the Catalytic Cycle of Hydroformylation of 1-Decene and Selected Parameters
APPENDIXB Key Structures Involved m the Catalytic Cycle of Hydroformylation of 1-Dodecene and Selected Parameters
APPENDIXC Key Structures Involved m the Catalytic Cycle of Hydroformylation of Styrene and Selected Parameters
APPENDIXD Kinetic Data for Hydroformylation of Higher Alkenes in Homogeneous System
XIV
162 162 164
166
181
185
188
191
Page 14
APPENDIXE Estimated Rate Parameters 199 APPENDIXF Derivation of the Rate Equation 201 APPENDIXG Solubility of CO and Hz at Different Pressure and 202
Temperature APPENDIXH Effect of Reaction Conditions on the Conversion and 210
Selectivity APPENDIXJ Kinetic Data 212 APPENDIXK AAS Standard Calibration Curve 221 APPENDIXL Experimental Tie-Line Data 222
APPENDIXM Papers Published/Presented 224
XV
Page 15
1.1. 2.1. 2.2. 3.1. 3.2.
3.3. 3.4.
3.5. 4.1. 4.2. 4.3. 5.1.
5.2. 5.3. 5.4. 5.5. 5.6.
5.7. 5.8. 5.9. 5.10. 5.11. 5.12. 5.13. 5.14. 5.15.
5.16.
LIST OF TABLES
Commercial application of hydroformylation of olefins. A summary of kinetic studies involving hydroformylation reaction. Variation of a-alkenes. Description of the catalytic cycle in Fignre 3.1. Optimized parameters for the .u-acyl complex A'(Mo) at the RHF/6-310( d,p) level. Activation energies calculated at MP2 level of theory. Range of experimental conditions used for development of the mechanistic rate equation. Estimated Ml kinetic model parameters with 95% confidence limits. Physical properties of the pure components. Critical properties and acentric factors used in the PR EoS. Range of variables studied in the present work. Parameters in Eq (5.1) for hydrogen and carbon monoxide solubilities at a partial pressure and temperature of 101.3 kPa and 298-343 K, respectively. Parameters for modeling with RST model. UNIF AC parameters rand q of the components. Modified UNIF AC group interaction parameters. Effect of the composition ofTMS-systems. Typical results on conversion of 1-octene, selectivity and yields.
Solubility of Hz and CO in TMS-system of PC/dodecane/1 ,4-dioxane. Constants in polynomial fitting nonanal concentration vs. time. Estimated kinetic model parameters with 95% confidence limit. Estimated Al kinetic model parameters with 95% confidence limits. Distribution coefficients of species in TMS- system. UNIF AC parameters r and q of the components. Binary interaction parameters ofUNIQUAC equation. Interaction parameter ajk of the UNIFAC equation. The average deviation (%) of the experimental data from the calculated mole fractions using UNIQUAC and UNIFAC model. Experimental and predicted distribution of 1-octene, nonanal and HRb(CO)(PPh3)3.
xvi
PAGE 2
21 31 52 57
62 68
71 79 85 86 99
102 105 106 111 118
123 130 131 142 149 155 156 157 157
160
Page 16
LIST OF FIGURES
PAGE 1.1. Two phase catalysis in the presence of water soluble rhodium complex. 4 1.2. Biphasic thermomorphic hydroformylation system 8 2.1. Catalytic cycle ofhydroformylation for unmodified cobalt catalysts. 17 2.2. Initial equilibria forming the active species, L = PPh3 or TPPTS. 18 2.3. Catalytic cycle ofhydroformylation for phosphine modified rhodium 19
catalysts. 2.4. Effect of phosphine/rhodium (PPh3/HRh(CO)(PPh3)3) ratio on reaction 30
rate and selectivity 2.5. Dependence of reaction rate on chain length of alkenes 32 3.1. Plausible steps for rhodium catalyzed hydroformylation in the presence 51
oflow concentration of phosphine ligand. 3.2. Flowchart illustrating the steps involved in quantum chemical 55
calculations of molecular structures. 3.3. Optimized structure of the the ,u-acyl complex A'(Mo) as an intermediate 57
in hydroformylation using a hetero-bimetallic complex catalyst. 3.4a Selected geometrical parameters of optimized structures (A) of the 59
transition state TS-1 (El/Fl) for the 1-dodecene insertion at RHF level. 3.4b Optimized Bond lengths (A) of transition state TS-2 (Hl/Jl) for the CO 60
insertion at the RHF level (1-octene) 3.4c Optimized structures (A) of the transition state TS-3 (Jl/Nl) for the Hz 61
oxidative addition at the RHF level (1-dodecene). 3.5a. The potential energy profile of 1-decene hydroformylation reaction. 63 3.5b. The potential energy profile of 1-dodecene hydroformylation reaction 63 3.5c. The potential energy profile of styrene hydroformylation reaction 64 3.6. Flowchart illustrating the steps involved in kinetic modeling 70 3.7. Experimental and predicted initial reaction rates vs. concentration of 72
olefin, at temperature of 323 K. 3.8. Experimental and predicted initial reaction rates vs. concentration of 72
olefin, at temperature of 333 K. 3.9. Experimental and predicted initial reaction rates vs. concentration of 73
olefin, at temperature of 343 K. 3.10. Experimental and predicted concentration of 1-dodecene and CO or Hz 74
as a function of contact time at temperature of323, 333 and 343 K. 3.11. Parity plots of the model predictions of the rate of hydroformylation of 74
styrene, 1-octene, 1-decene and 1-dodecene in homogeneous system. 4.1. Schematic of the high pressure solubility cell unit 81 4.2. Photograph of the high pressure solubility cell unit 81 4.3. Reaction products ofhydroformylation of 1-octene 86 4.4. Schematic of the experimental setup 87 4.5. Photograph ofthe Parr high pressure reactor 88 4.6. GC signal for hydroformylation of 1-octene 92 4.7. GC signal for hydroformylation of 1-dodecene 92 5.1. Phase diagram of the solvent system PC+dodecane+ 1,4 dioxane 94
xvii
Page 17
5.2. Experimental solubility of gases in PC, biphasic PC+dodecane mixture 95 (1:1) and TMS-systems ofPC/dodecane/1,4-dioxane
5.3. Experimental and predicted solubility of gases in PC, biphasic 96 PC+dodecane mixture and TMS- systems ofPC/dodecane/1,4-dioxane
5.4. Experimental solubilies of Hz at partial pressure of 101.3 kPa as a 96 function of temperature.
5.5. Experimental solubilies of CO at partial pressure of I 01.3 kPa as a 97 function of temperature.
5.6. Solubility of CO and Hz in TMS-systems PC/dodecane/1 ,4-dioxane at 107 partial pressure of I 01.3 kPa.
5.7. Solubility of CO and Hz in biphasic PC/dodecane mixture at partial 107 pressure of I 01.3 kPa.
5.8. Solubility of CO and Hz in propylene carbonate at partial pressure of 108 101.3 kPa.
5.9. Parity plots of the model predictions of the solubility of CO and Hz. 109 5.10. Phase diagram of the solvent system PC/dodecane/1 ,4 dioxane 110 5.11. An organic solvent mixture composed of PC/dodecane/1 ,4-dioxane 112
(0.3/0.1/0.6) formed the biphasic system at 298 K. 5.12. A: Time evolution of the yield of total aldehyde at different 113
concentration ofHRh(CO)(PPh3)3 catalyst; B: Effect ofHRh(CO)(PPh3)3 concentration.
5.13. Expanded GC signal for the formation for C9-aldehyde isomers 114 5.14. Expanded GC signal for the octene isomers and octane 115 5.15. A: Time evolution of the yield of total aldehyde at different reaction 116
temperatures; B: Effect of temperature. 5.16. A: Yield of total aldehyde as a function of reaction time at different total 117
syngas pressure; B: Effect of total pressure 5.17. A: Yield of total aldehyde as a function of reaction time at different 119
CO !Hz pressure ratio; B: Effect of CO/Hz ratio 5.18. A: Yields of total aldehyde as a function of reaction time at different 120
ratio ofligand to catalyst concentration. B: Effect ofP(OPh)3/ HRh(CO)(PPh3)3 ratio.
5.19. HRh(CO)(PPh3)3 dissociation equilibrium 121 5.20. A: Yield of total aldehyde as a function of reaction time at different 1- 122
octene concentrations; B: Effect of 1-octene concentration. 5.21. Effect of partial pressure of Hz and CO on solubility 123 5.22. Effect of agitation speed on the rate of reaction in hydroformylation of 1- 124
octene and 1-dodecene. 5.23. Effect of catalyst concentration on the rate of reaction. 125 5.24. Effect of 1-octene concentration on the rate of reaction. 126 5.25. Effect of partial pressure of Hz on the rate of reaction. 127 5.26. Effect of partial pressure of CO on the rate of reaction. 128 5.27. Typical plot of concentrations of 1-otene, nonanal and 2-methyloctanal 130
versus reaction time. 5.28. Parity plot of the experimental and calculated reaction rates. 133
xviii
Page 18
5.29. Parity plot of the experimental and calculated selectivity (n/iso). 134 5.30. Plausible steps for rhodium catalyzed hydroformylation in the presence 135
of excess concentration of P(OPh)31igand. 5.31. Effect of partial pressure of CO on the rate ofhydroformylation of 1- 139
octene (A) and 1-dodecene (B). 5.32. Effect of partial pressure ofH2 on the rate ofhydroformylation of 1- 140
octene (A) and 1-dodecene (B). 5.33. Effect of concentration of 1-olefin on the rate ofhydroformylation of 1- 140
octene (A) and 1-dodecene (B). 5.34. Effect of concentration of catalyst on the rate of reaction: 1-octene (A) 141
and 1-dodecene (B). 5.35. Parity plot of the model predictions of the rate ofhydroformylation of 1- 141 octene and 1-dodecene in TMS-systems ofPC/dodecane/1,4-dioxane. 5.36. LLE ternary diagram for PC+dodecane+ 1 ,4-dioxane at 298.15 K. 144 5.37. LLE ternary diagram for PC+dodecane+1,4-dioxane at 313.15 K. 145 5.38. LLE ternary diagram for PC+dodecane+1,4-dioxane at 333.15 K; 145 5.39. LLE ternary diagram for PC+dodecane+1,4-dioxane at 353.15 K; 146 5.40. Distribution coefficient D ofnonanal as a function of the mass fraction x 147
of nonanal in non polar phase. 5.41. Distribution coefficient D ofHRh(CO)(PPh3)3 catalyst as a function of 148
the mass fraction x ofHRh(CO)(PPh3)3 in non polar phase. 5.42. Distribution coefficient D of 1-octene as a function of the mass fraction x 148
of 1-octene in non polar phase. 5.43. LLE ternary diagram for ternary (TMS+nonanal+ 1-octene) systems at 159
298.15 K. 5.44. LLE ternary diagram for ternary (TMS+nonanal+ 1-octene) systems at 159
308.15 K. 5.45. Parity plots ofthe model predictions of the LLE data ofTMS+ l
octene+nonanal+triphenylphosphite+HRh(CO)(PPh3)3 system at temperature of298 K.
xix
161
Page 19
NOMENCLATURE
A pre-exponential factor, units will be identical to the rate
constant a
An, Bnm A,B,C [alkene] b Bi CL,l
CL,2
[Cald] [catalyst] [CO] D Ea Ene Exc ea ee
fz0
~~ fzL
F g H
H !JH f1Hv [Hz] tz i,j, k J
K
K
K
k
attraction parameter modified UNIF AC interaction parameter between groups
m and n, Eq. (5.14) parameters in Eq. (5.14) parameters in Eq. (5.1) concentration of alkene in the reaction mixture
van der Waals covolume interaction potential solute concentration in liquid at the interface solute concentration in bulk liquid concentration of aldehyde concentration ofHRh(CO)(PPh3) 3 in the reaction mixture concentration of carbon monoxide in the reaction mixture
distribution coefficients activation energy for rate constant electron-nuclear attraction functional exchange correlation functional one ligand in equatorial and the other in apical positions coordinating groups (L, CO) are in equatorial positions fugacity of pure gas at atmospheric pressure
fugacity of a hypothetical pure liquid
fugacity of hypothetical liquid solute at atmospheric
pressure F ock operator number of various groups in the mixture Henry's law constant Hamiltonian operator heat of reaction heat of vaporization concentration of hydrogen in the reaction mixture
Planck's constant component identifications Coulomb integral which reflects the average interaction potential of electron i due to all other electrons equilibrium constants for the elementary steps in the
catalytic cycle exchange integral characteristic constant in Eq. ( 4.9)
reaction rate constant, units will be specific to the form of
XX
UNIT
kmol·m·3
kmol·m·3
kmol·m·3
kmol·m·3
kmol·m·3
MPa
MPa
MPa
kJ·mor1
J·mor1
kmol·m·3
J·s
Page 20
MRSS n n!iso N NX795 [octene] p pv
PC
Pea
PH '
Po Q)
q; R r;
r SEE L1S sc t T Tb Tc Ts TS TMS TON TOF v
Vki
Vuq Vgas X;
Y; z z
8 t5 ¢
p
PL
the rate expression mean residual sum of squares number of moles linear to branched number of components 2,2, 4-trimethyl-1 ,3 -pentanediolmono(2-methylpropanoate) concentration of 1-octene in the reaction mixture total pressure vapour pressure of pure solvent propylene carbonate partial pressure of CO
partial pressure of Hz
initial partial pressure acentric factor van der Waals surface area of component i gas constant: 0.08206 dm3·atm-K·1-mo1"1; 8.314 J·mor1-K-1
van der Waals volume of component i distance from the nucleus to the electron average standard error of estimation entropy of reaction supercritical time absolute temperature normal boiling temperature critical temperature kinetic energy functional transition state temperature dependent multi-component solvent turnover number turnover frequency molar volume content of the group kin molecules of component i volume of liquid volume of gas mole fraction of component i in the liquid phase mole fraction of component i in the gas phase compressibility factor nuclear charge
GREEK SYMBOL solubility parameter average solubility parameter
surface area fraction
density molar density
xxi
mol
kmol·m·3
MPa MPa
MPa
MPa
MPa
m3
pm %
J r1 K"1 ·mo ·
s K K K
h-1
m3-mor1
m3 m3
g·cm·3
mol·dm-3
Page 21
a a,~, y, 8 (1)
rm rciJ
m
fi
infinite dilution activity coefficient of the gas
activity coefficient of component i objective function segment fraction volume fraction
scaling factor defined by Eq. (4.5) parameters in Eq. (5.21) acentric factor activity coefficient of group m in the mixture
activity coefficient of group m in pure compound i
function of group fraction
interaction parameter effective nuclear charge eigenvalues wave function
Subscript and superscripts G gas L liquid c critical property exp experimental calc calculated
xxii
Page 22
CHAPTER!
INTRODUCTION
Homogeneous catalysis has traditionally been exploited for reactions in a single phase
system. It is now an area rich with opportunities for the implementation of commercial
reactions and processes in multiphasic solvent systems as well with the unique advantage
of catalyst recovery and product separation. One of the examples of such cases is the
temperature dependent multi-component solvent (TMS) or thermomorphic solvent
system. This chapter summarizes the available information on hydroformylation m
general and the use of thermomorphic solvent system as the reaction medium m
particular. The limitations of hydroformylation of higher olefins using current industrial
processes are also highlighted. The material presented here is intended as a general
review for the subsequent chapters. More details specific to the chapter topics are
addressed therein.
1.1 Hydroformylation of Olefins
Hydroformylation or the oxo reaction has provided a versatile route for the synthesis of a
vast array of bulk and specialty chemicals. The hydroformylation products prepared on
the largest scale are butyraldehyde and ethylhexanol (Bohnen and Cornils, 2003). Both of
these are produced from propylene which is derived from natural gas. Either rhodium or
cobalt phosphine complexes are employed as the catalyst. The second largest industrial
application of hydroformylation is the production of Cs-C2o range alcohols which are the
basic material of biodegradable detergents. This process starts with ethylene
oligomerization, olefin isomerization and olefin metathesis, followed by
hydroformylation. Collectively the olefin synthesis steps are referred to SHOP for Shell
Higher Olefin Process (Weissermel and Arpe, 1997).
In hydroformylation, reactions occur at the olefinic double bond with synthesis gas
(carbon monoxide and hydrogen) in the presence of transition metal catalyst (rhodium or
cobalt) to form linear (n) and branched (iso) aldehydes containing an additional carbon
atom as primary products. The overall reaction can be represented by Eq. (1.1 ).
I
Page 23
R~+H2 +CO 0 R HYO
-R-h-/C_o_c_a-ta-ly--<st~ R ~H + ~ n-product iso-product
side reactions ~R_. ••. ---· ·····-- . .,. ~R
alkene isomerization alkene hydrogenation (1.1)
The most important hydroformylation products are in the range C3-C19- The economic
importance of hydroformylation synthesis is mainly based on butanal with a share of
73 % of overall hydroformylation capacity. The n-butanal is converted to 2-ethylhexanol
which is used in the production of dioctyl phthalate (DOP), a plasticizer that is used in
the polyvinylchloride (PVC) applications. Until the mid 1970s, cobalt was used as
catalyst in commercial processes (e.g., by BASF, Ruhrchemie, Kuhlmann). Because of
the instability of cobalt carbonyl (HCo(C0)4) catalyst, the reaction conditions were
significantly high with the pressure range of 20.0-35.0 MPa to avoid decomposition of
the catalyst and deposition of the metallic cobalt. The ligand modification introduced by
Shell researchers was a significant progress in hydroformylation (Johnson, 1985). The
replacement of carbon monoxide with phosphines enhanced the selectivity towards linear
aldehyde (n/iso) and the stability of cobalt carbonyl catalyst, leading to a reduction of the
required carbon monoxide pressure. Table 1.1 shows the commercial hydroformylation
catalyst systems.
Table 1.1: Commercial Hydroformylation Catalyst Systems (Master, 1977)
Company Catalyst System Temperature Pressure Selectivity n!iso Metal/olefin Typical
(K) (MPa) (%) (!-olefin) (%) olefin
Shell Co2(CO)(PBu3)z 433--473 5.0-30 80 6-8/1 0.5-1.0 C2-{;12
Union HRh(CO)(PPh3)3 353-393 1.5-2.5 96 10-14/1 0.01 C2-{;4
Carbide
Ruhrchemie HRh(CO)(TPPTS)3 353-403 4.0-5.0 99 19 0.2 C2-C4
2
Page 24
The HCo(CO)J(PR1) catalyst system is only used by Shell. It is tightly coupled to
Shell's Higher Olefins Process (SHOP) that produces a C4 through C20 blend of linear,
internal alkenes for hydroformylation to detergent grade alcohols. The electronic effect of
substituting an electron donating alkylated phosphine for one of the carbonyl ligands to
produce HCo(CO)J(PR3), results in stronger Co-CO bonding. The use ofHCo(C0)3(PR3)
catalyst system operates at 5.0-10.0 MPa of pressure, and could be rnn at higher
temperatures without any decomposition of catalyst to cobalt metal. Therefore, the
catalyst and product are separated by distillation under reaction conditions. The electron
donating phosphine ligand also increases the hydridic nature of the hydride ligand and
dramatically increases the hydrogenation capabilities of the HCo(CO)J(PR3) catalyst.
Therefore the aldehydes produced are subsequently hydrogenated by HCo(CO)J(PR3) to
produce alcohols. The better hydrogenation ability, however, also results in increased
alkene hydrogenation side-reactions producing alkanes that can range from 10-20 % of
the product distribution (depending on the phosphine and reaction conditions). Because
of the aldehyde hydrogenation step, the syngas (H2/CO) ratios of 2:1 (or slightly higher)
are typically used. In addition, this catalyst is less active than HRh(CO)(PPh3)J and
therefore higher reaction temperatures are used in conjunction with longer reaction times
and larger reactor volumes. From a steric viewpoint the bulkier trialkylphosphine ligand
favors formation of linear products with regioselectivities of 6-8: I. There is a phosphine
cone angle cut-off at about 132°, after which the phosphine ligand's steric effects do not
effects do not increase the product linear regioselectivity any further.
During 1974-1976 Union Carbide Corporation (UCC) and Celanese increase the
product linear regioselectivity any further. Corporation, independently, introduced
rhodium-based catalysts, specifically, HRh(CO)(PPh3)3 on an industrial scale (Cornils
and Herrmann, 2002). These processes combined the advantages of ligand modification
with the use of rhodium as a catalyst metal. The rhodium catalyst is modified by ligands
to form an active catalyst complex; phosphine ligands used in industry have been
P(C6Hs) and P(C4H9), and triphenylphosphine oxide (TPPO) for homogeneous systems.
Since the reaction conditions were much milder, the process was called 'low-pressure
oxo' (LPO) process. Then low-pressure oxo (LPO) processes took the leading role and
despite the higher price of rhodium, cobalt catalysts for the hydroformylation of propene
3
Page 25
P(Ph-m-S03 ~a+)3 (TPPTS), a highly water soluble catalyst IS generated:
HRh(CO)[P(Ph-m- S03 ~a l3h· In aqueous solution the catalyst essentially has a -9
charge, making it totally insoluble in all but the most polar organic solvents. The use of a
water soluble catalyst system brings substantial advantages for industrial practice,
because the catalyst can be considered to be heterogeneous. The separation of catalyst
solution and reaction products, including high-boiling by-products, is achieved by phase
separation technique. Separation relies upon the fact that the product is insoluble in the
catalyst phase and the two phases can be easily separated without exposing the system to
any unnecessary thermal stress, which may lead to catalyst decomposition. The drive for
this development arose from the wish to implement Rh catalysed hydroformylation,
which is well documented as having greater reactivity under milder conditions than the
commonly used process using cobalt catalysts. The success of this plant and more plants
that have been built since, is shown in the volume of their output, over 500 000 tons per
year of C4 products. The aqueous biphasic method shows low ligand and rhodium
leaching from the aqueous phase; this along with the low cost of solvents made it an
industrially attractive process.
The optimised process uses a P:Rh ratio of at least 60/1 and by continuous addition of
fresh ligand, to replace any oxidised phosphane, the catalyst lifetime can be prolonged.
Excess TPPTS ligand is required for good n:iso selectivities, as with conventional
Rh/PPh3 catalysts. The only drawback of the aqueous biphasic process is the poor
solubility of higher olefins in water, resulting in lower activities for these substrates and
thereby limiting the RCH/RP process to C3 and C4 substrates (Beller et a!, 1995). In order
for the reaction to occur, the alkenes must have appreciable water solubility to migrate
into the aqueous catalyst phase. Remigration of the aldehyde product· back into the
organic phase allows easy phase separation of product from catalyst. The reaction is
never homogeneous even with C3 and C4 alkenes and it is unclear whether the reaction
occurs on dissolved alkene within the water droplets or only at the interface. Good
mixing merely increases the area of the liquid-liquid interface and improves the transport
of the alkene into the aqueous phase. Rather high linear to branched regioselectivities of
16-19:1 for propylene can be obtained via this water soluble catalyst. Rates are slower
than with conventional Rh/PPh3 catalysts due to lower alkene concentrations in the water
5
Page 26
phase. The process is limited to the shorter chain alkenes (Cz-C4). Alkenes higher than 1-
pentene are not soluble enough in water. Celanese-Ruhrchemie currently operates several
hydroformylation plants based on this water soluble rhodium catalyst technology.
In its present form, the RCH/RP process is unsuitable for the hydroformylation of
alkenes greater than C4, due to the limited solubility of such molecules in the aqueous
catalyst phase. Some attempts have been made to adjust this process for the
hydroformylation of higher olefins, in order to overcome their low solubility. Additives
can be included in the reaction, such as alcohols and glycols (Purwanto and Delmas,
1995). However, these only add to the cost of the process, as an extra separation step is
required to remove them from the product. Alternatively increasing the organic solubility
of the catalyst may increase the hydroformylation rates, but it is also likely to increase the
loss ofRh and ligand to the organic phase. It seems more probable that a different solvent
system or immobilisation (heterogenisation) of the catalyst would provide the desired
results.
1.2 Recent Technological Developments
1.2.1. Aqueous Biphasic Catalysis
Several techniques have been proposed to overcome the solubility and mass transport
limitations that are typical in the conventional aqueous biphasic system for the
hydroformylation of higher alkenes. Concerning two phase hydroformylation of higher
olefins in an aqueous-organic reaction system, the different approaches can be
categorized as follows:
1. The use of water-soluble ligands with amphiphilic properties which will either
improve the solubility of the higher olefins via formation of micelles or increase
the reaction rate by preferential concentration of the catalyst complex close to the
interface of the aqueous and the organic phase (Chen et a!., 1999; Karakhanov,
1996)
ii. Modification of the Rurhchemie/Rhone-Poulenc system with co-solvents such as
polar, alcoholic solvents or by use of detergent cations, modified cyclodextrins
and surfactants (Baumann eta!., 2002; Zhang eta!., 2002; Purwanto and Delmas
6
Page 27
1995; Monteil eta!. 1994) to enhance the mutual solubility and the mobility of the
components across the boundary.
111. The principle of thermoregulated phase-transfer catalysis (TRPTC), originally
developed by Bergbreiter et a!. (1998), which has been applied to two-phase
hydroformylation by Jin et a!. (1997), Zheng et a!. (1998) and Liu et a!. (2003),
which is based on a temperature-controlled switch of the catalyst system from the
aqueous phase to the organic phase.
IV. Immobilization of umnodified rhodium catalyst (i.e., without ligands) in the
aqueous phase by using resin, polymeric, oligomeric water-soluble or mineral
supports (Diwakar eta!., 2005; Chen and Alper, 1997; Terreros eta!., 1989).
v. Supported aqueous-phase catalysis (SAPC) that involves absorption of an
aqueous solution of a catalytic active organometallic complex onto a high surface
area hydrophilic support material. (Riisager et a!., 2003; Zhu et a!., 2003;
Jauregui-Haza et a!., 2001; Arhancet et a!., 1990)
1.2.2. Non-aqueous Catalysis
Non-aqueous approaches toward biphasic hydroformylation have been demonstrated by
Horvath and Rabai (1994) with the use of a fluorous biphasic system containing a
rhodium catalyst having partially fluorinated "ponytail" ligands. The technique is based
on the limited miscibility of fluorinated solvent and fluorinated ligand in hydrocarbon. A
biphasic system is mixture which has two phases or distinct layer. For example, a
biphasic hydroformylation catalyst system was developed to take advantage of the
unusual solvent characteristics of perfluorocarbons combined with typical organic
solvents. Fluorous mixtures such as perfluoromethylcyclohexane (PFMCH/toluene) are
immiscible at ambient temperature but become a single phase solution at an elevated
temperature (Scott, 1948; Hildebrand and Cochran, 1949; Dorset, 1990). However, it is
doubtful whether the fluorous biphasic would achieve any breakthrough in the large-scale
industry, because of the toxicity of perfluorous solvents and ligands and risks related to
ozone depletion (Liu eta!., 2002; Kollhofer and Plenio, 2003). Bianchini (1995) describe
an alternative to fluorous biphasic systems using new ligand Na03S(C6H4)CH2C(CH2-
PPhz)J(sulphos) dissolved in light alcohols (methanol, ethanol). The hydroformylation
7
Page 28
reaction of 1-hexene gives c7 alcohols in an alcohol/hydrocarbon system and c7 aldehydes in an alcohol-water/hydrocarbon system. All rhodium is recovered in the polar
phase at the end of the catalytic reactions.
Reaction Temperature
R_/ co
@ H2 CO _IP pduct phase
@ R H2
R_/ @ H2 co
fl2 R_/
co @ co c talyst phase
R_/ H2 co
H2 R_/
t 8 recycle
Reduced/Room Temperature
0 0
R)lH ;-H R_/ -
0 )l 0
;-H R H R_/
@ @ -@ @
I
phase separate
-complete m1xmg
-easy product and catalyst separation
-high reaction rates
-works even if the olefin has low solubility in the polar phase
Figure 1.2: Biphasic thermomorphic hydroformylation system
In the recent time, a novel solvent system that itself reversibly changes from biphasic to
monophasic as a function of temperature and known as a thermomorphic biphasic or
temperature-depending multicomponent solvent (TMS) system has gained interest as the
reaction medium. The use of TMS system allows performing a reaction in a single-phase
at a high reaction temperature followed by a phase split at a lower temperature. The TMS
systems consist of a polar solvent (sl) and nonpolar solvent (s2). In one of these
components the catalyst is dissolved and the other one acts as extraction agent for the
8
Page 29
reaction products. A semi-polar solvent (s3) operates as mediator for the two other
solvents. Dependent on the composition and the temperature a mixture ofsl, s2, and s3 is
either homogeneous or heterogeneous (Behr et a!., 2005a, 2005b; Behr and Roll, 2005;
Behr and Fagenswisch, 2003). This new concept is especially suitable for reactions which
have to be operated in single phase because of low solubilities of the reactants in the
phase containing the catalyst. As illustrated in Figure 1.2, in these TMS-systems the
reaction takes place in a single phase at an elevated reaction temperature, while lower
temperatures (room temperature for example) cause the liquid to split up in two separate
phases again. The catalyst remains in one of two phases and can be reused by simple
phase separation. This concept combines the advantages of a reaction in a single phase
system with the advantages of the catalyst recycling of a two-phase system. The TMS
system was applied to a liquid phase peptide synthesis by using a cyclohexane-soluble
platform in cyclohexane and typical organic solvents in a temperature range of288 to 338
K (Chiba et a!., 2002). Behr and Miao (2004) used TMS- system for the rhodium
catalyzed co-oligomerization of sunflower fatty acid methyl ester (SFAME) and ethylene
with PC/SFAME/dioxane solvents system and in the absence of any tagged ligand.
Similarly, the TMS- system was used in the hydroaminomethylation of 1-octene using
PC/dodecane/morpholine solvent system (Behr and Roll, 2005). The isomerizing
hydroformylation of trans-4-octene in the TMS-system of PC/dodecane/p-xylene has
been carried out producing a very high conversion (about 99%) of the trans-4-octene and
offering very attractive selectivities of n-nonanal ranging from 79 to 90% (Behr et a!.
2005b), but a strong rhodium leaching as high as 47% was reported. On the other hand,
Tijani and Ali (2006) has developed a thermomorphic biphasic rhodium system using an
inexpensive and conventional ligand such as P(OPh)3 to catalyze the hydroformylation of
higher olefins (>C6). However, neither kinetic nor thermodynamic data on the
hydroformylation of higher olefins in the TMS-system are available in the literature.
1.3 Problem Statement
The catalytic hydroformylation of higher olefin faces several challenges. In the
homogeneous process, the rhodium catalyst tends to undergo decomposition at the
temperatures required for product separation through distillation. On the other hand, in
9
Page 30
the biphasic process, the low solubility of the olefin reactant in the aqueous phase renders
the reaction rates too low for commercialization purposes. In addition, both processes are
limited by syngas solubility in the reaction phase (Master, 1977). Consequently, higher
olefin hydroformylation is typically carried out in homogeneous organic solvents with
inexpensive Co-based catalysts, whose activities are three-orders of magnitude lower
than the Rh-based catalysts. In practice, as shown in Table 1.2, more severe conditions
particularly high operating pressure and temperature are required to activate the cobalt
catalysts and intensify the reaction. This leads to the high capital and maintenance costs.
Further, the recovery and regeneration of cobalt catalysts during higher olefin
hydroformylation are rather expensive and tedious due to large quantities of acid and
alkaline solutions are involved in the demetalization step to recover the catalyst (Cornils
and Hermann, 2002; Garton et a!, 2003). Therefore, the energy- and material-intensive
nature of these processes poses both economical and environmental concerns.
For this reason a biphasic process for the hydroformylation of higher olefins with
more selective rhodium catalysts, which allows for a catalyst recycling by phase
separation, would be highly desirable with lower operating pressure up to 20 bars. In
addition the use of Rh catalyst offers significant reduction of capital, operating and
maintenance cost. Since the Rh catalyst is an expensive material, the recovery and
recycling of the catalyst would be a better option to reduce the operating cost. However,
no catalytic system has been found which yields sufficiently high conversion rates and
yet brings about a complete catalyst separation by decantation. Hence it is our hope that
the desired process will contain features such as high catalyst activity, facile catalyst
recovery, enhanced mass transfer, relatively mild operating conditions, and, above all,
economic viability.
1.4 Objectives of the Study
The objectives of this research work are given as follows:
1. To develop a novel temperature dependent multi-component solvent (TMS)
system for the hydroformylation of higher olefins using Rh-phosphite catalyst.
n. To study the effect of reaction conditions for the hydroformylation of 1-octene
usmg Rh-phosphite catalyst m a TMS-system of propylene
10
Page 31
carbonate/dodecane/1 ,4-dioxane by investigating the effect of total pressure,
partial pressure of CO and Hz, temperature and concentration of 1-octene,
phosphite ligand and catalyst on the total conversion of 1-octene and
selectivity (nli).
111. To determine the optimum process condition for the hydroformylation
reaction of 1-octene using Rh-phosphite catalyst in a TMS-system of
PC/dodecane/1 ,4-dioxane by evaluating the formation of total yield of
aldehyde and selectivity to linear aldehyde (n ).
IV. To develop the mechanistic and empirical rate model for the hydroformylation
of higher olefins using Rh-based catalyst in a homogeneous system and fitting
of the available experimental data.
v. To study the liquid-liquid equilibrium (LLE) behavior and distribution of 1-
octene, nonanal, HRh(CO)(PPh3)3 catalyst and P(OPh)J in TMS-systern of
PC/dodecane/1 ,4-dioxane.
1.5 Scope ofthe Study
The scope of this research is divided into the following section:
1.5.1. Development of a novel TMS-system
The TMS-systems consist of a polar and a non-polar solvent. The third solvent which is
semi-polar acts as a mediator between the polar and the non-polar solvent. Dependent on
the composition and temperature, a mixture of the polar, non-polar and semi-polar
solvent is either homogeneous or heterogeneous. In this work, PC was chosen as the polar
solvent because of the low solubility of alkenes in PC. Furthermore, PC was found to
increase the activity of the Rh-catalyst to conversions of 95% as well as the selectivity to
the linear aldehyde up to 95 % (Behr et a!., 2005b ). In addition, we have chosen long
chain hydrocarbon, dodecane as the non-polar solvent as it poorly dissolves the catalyst
but perfectly the reaction products. The TMS-system of PC/dodecane/p-xylene has
proved to provide very high conversions (99%) of the trans-4-octene and a very attractive
selectivities of n-nonanal ranging from 79 to 90% (Behr et a!., 2005b ). However, via reP
investigations, a strong rhodium leaching of 47% was observed. The more p-xylene is
11
Page 32
used, the more rhodium is transferred into the nonpolar dodecane phase. With this basis,
I ,4-dioxane was chosen as the solvent mediator, because it has a greater polarity
compared to p-xylene and we anticipated that it might reduce the effect of the catalyst
leaching. In addition these solvents are preferred because of high boiling point, thermal
stability, and inert nature with respect to the homogeneous catalyst, olefin, hydrogen,
carbon monoxide and the hydroformylation products (Tijani and Ali, 2006; Behr et al.,
2005; Behr and Miao, 2004). The phase behaviour ofthe TMS-system (PC/dodecane/1,4-
dioxane) at different temperatures and composition was determined by the cloud point
method at 298, 353 and 373 K. The big miscibility gap of this solvent system facilitates a
good operating range for the hydroformylation.
Solubilities of Hz and CO in pure solvent and solvent mixtures relevant to the
hydroformylation process were also studied in this work, particularly in the TMS-systems
involving propylene carbonate, dodecane and I ,4-dioxane. Isothermal gas solubility data
(P-x data) for H2 and CO in propylene carbonate (PC), biphasic PC+dodecane mixtures,
1:1 (v/v), and temperature dependent multi-component solvent (TMS)- system
(PC/dodecane/1,4-dioxane) were determined over the temperature and pressure range of
298-343 K and 0.1-1.5 MPa, respectively. The measured solubilities were tested against
activity coefficient models based on the regular solution theory (RST) with Yen and
McKetta extension for polar solvents and with UNIFAC group contribution method.
1.5.2. Parametric Study of Reaction Variables
Synthesis of n-nonanal, a commercially important fine chemical, by the hydroformylation
reaction of 1-octene using a homogeneous catalyst consisting of HRh(PPh3)J(CO)
catalyst precursor and P(OPh)3 in a TMS- system containing propylene carbonate (PC),
dodecane and 1 ,4-dioxane was investigated. HRh(PPh3)J(CO) and P(OPh)J were chosen
as the complex catalyst because polar phosphite ligands will favourably partition in the
polar phase and therefore facilitating the catalyst recovery process. The easy availability
of such phosphite ligands also provided a valuable and straightforward route to rhodium
complexes. In addition, by using phosphite-modified catalyst, less reactive olefins such as
1-octene and 2,3- dihydrofuran, are hydroformylated at much higher rates compared to
those achieved with phosphine-modified catalysts Beller et a!., (1995). In determining the
12
Page 33
optimum process condition, the effect of total pressure, partial pressure of CO and H2,
temperature, concentration of 1-octene, catalyst loading, catalyst to ligand ratio on the
selectivity (n/i), total conversion and yield of total aldehyde were identified. The detailed
kinetics ofhydroformylation of two higher olefins (1-octene and 1-dodecene) using the
above catalyst and reaction medium were also studied. The effect of concentration of the
olefins, catalyst loading, partial pressure of CO and Hz and temperature on the rates of
both reactions have been studied at three temperature- 353, 363 and 373 K.
1.5.3. Development of Kinetic Models
The present work uses ab initio quantum chemical computations to determine the
energetics and reaction pathways of hydroformylation of higher alkenes using a rhodium
complex homogeneous catalyst. The ab initio calculations of fragments of the potential
energy surfaces of the HRh(CO)(PPhJ)J-catalyzed hydroformylation of 1-octene, 1-
decene, 1-dodecene and styrene were performed by the restricted Hartree-Fock method,
at the second-order Moller-Plesset (MP2) level of perturbation theory, and basis set of 6-
31 ++G( d,p ). Generalized rate models were developed on the basis of above reaction path
analysis and experimental findings available in the literature. The kinetic and equilibrium
parameters of the models were estimated by nonlinear least square regression of available
literature data. This forms to basis of application of the rate models for the experimental
hydroformylation rate data in a TMS- system.
1.5.4. Liquid-liquid equilibrium (LLE) Behavior and Distribution
Four different temperatures (298, 313, 333 and 353 K) at atmospheric pressure were
selected to study the ternary equilibrium system of the TMS- system (PC+l ,4-
dioxane+dodecane) in order to observe the binodal (solubility) curves and tie-lines.
Understanding how the TMS- system affects the distribution of catalyst, reactants and
products in terms of phase equilibrium thermodynamics is of utmost importance.
Therefore, the distribution of 1-octene, nonanal, and HRh(CO)(PPh3)J catalyst in this
system was measured at atmospheric pressure and two different temperatures (298 and
308 K) to model the extraction efficiency for a typical reaction, the hydroformylation of
1-octene.
13
Page 34
CHAPTER2
LITERATURE REVIEW
A review of the kinetic study of hydroformylation reaction is presented in this
chapter. An overview of the mechanism of reaction and solubility of the gaseous reactant
- CO and H2 - illustrates the development of the mechanistic rate equation and factors
that influence solvent selection. Following that, a review of liquid-liquid equilibrium and
solute distribution studies highlights the considerations necessary for the
hydroformylation reaction in the selected TMS- system. The material presented here is
intended as a general reference for the subsequent chapters. More details specific to the
chapter topics are addressed therein.
2.1. Hydroformylation Catalyst
Compounds of several transition metals catalyze hydroformylation to some extent, but
the major interest lies in catalysis by cobalt or rhodium compounds. On the other hand,
platinum and ruthenium catalysts are mainly subjects of academic interest, not thoroughly
investigated by industrial researchers. The generally accepted order of hydroformylation
activity for umnodified monometallic catalysis is as follow (Comils and Herrmann,
2002):
Rh ~Co> Ir, Ru > Os > Pt > Pd >Fe> Ni
A typical hydroformylation catalyst can be represented by the formula
HxMy(CO)z~
where M and L are metal atom and ligand, respectively. When n = 0, the catalyst is called
umnodified. Coordination of the metal center by ligands other than CO or hydrogen are
designated modified. For a modified catalyst, n is an integer of from I to 3. Huge number
ofligand applications appear in the area ofhydroformylation, however the only classes of
ligands used in industrial hydroformylation plants are substituted phosphines PRJ (R =
C6H5, n-C4H9), triphenylphosphine oxide (TPPO) and phosphites, P(OR)J (Comils and
Herrmann, 2002). Nitrogen substituted ligands have attracted some interest in oxo
14
Page 35
research. Shell has patented the rhodium catalyzed hydroformylation of 2-propen-1-ol
and 3-buten-2-ol using phosphinoarnines (Drent and Jager, 1995). However, in general
nitrogen containing ligands such as amines, amides, or iso-nitriles showed low reaction
rates due to their strong coordination to the metal center. Rhodium-triphenylphosphine
oxide (TPPO) is used in the production of iso-nonanol by hydroformylation of octenes
(Onada, 1993). This is the only example known of an oxidized phosphine ligand for an
industrial application. Rhodium catalysts with phosphites are used in the
hydroformylation of long-chain olefins due to their high catalytic activity (van Leeuwen
et al., 1991).
In the mid-1960s, Wilkinson and co-workers discovered that phosphine modified
rhodium catalysts gave better selectivities to the desired linear aldehyde product and
activities for alkene hydroformylation under lower temperatures and pressures than the
common cobalt catalysts (Osborn et al., 1965). They also produced fewer by-products
such as isomerised alkenes, alcohols esters and acetals than are produced with a cobalt
catalyst. Generally, the industrial process operates with a high concentration of
triphenylphosphine, for instance, the Union Carbide process for hydroformylation of
propene operates with a P/Rh ratio of 106 (Foster et al, 2002). This high loading of
phosphine leads to increase selectivity to the linear aldehyde product as the increased
amount of PPh3 leads to more heavily substituted Rh complexes and increases the steric
hindrance to the formation of branched products.
In the triphenylphosphine modified rhodium catalysed hydroformylation, low
phosphine concentration results in a low linear to branched ratio (approximately 3:1),
similar to that of unmodified cobalt reaction and so industrial processes which utilize this
catalytic system operate under a very high concentration of phosphine (Cornils and
Herrmann, 2002; Cotton and Wilkinson, 1988). However, with the perfluorinated triaryl
phosphine ligand, high selectivity can be achieved (6.3: I) at relatively low ligand
concentrations (Rh: P(C6H4C6F 13)3 = 1: I 0).
2.2. Mechanism of Hydroformylation
Mechanism of the hydroformylation reaction is still poorly established and has not been
clarified in every detail (Matsubara, 1997). Several differences in hydroformylation
15
Page 36
mechanism are observed between modified and unmodified catalyst systems. Therefore it
will be useful to discuss them separately.
2.2.1. Unmodified Catalysts
The mechanism for cobalt catalyzed hydroformylation was developed by Heck and
Breslow in the early 1960s (van Leeuwen and Roobek, 1983). The mechanism can also
be applied to unmodified rhodium complexes as well. Catalytic cycle of
hydroformylation with unmodified cobalt catalyst is shown in Figure 2.1. The
hydroformylation cycle consists of six elementary steps:
Step 1: Coz(CO)s react with hydrogen to form two equivalents of the hydridometal
carbonyl species HCo(C0)4.
Step 2: Dissociation of CO to generate the unsaturated species HCo(C0)3 and
coordination of an alkene.
Step 3: Coordination of CO and hydride migration results in the formation of alkyl metal
carbonyl species
Step 4: Insertion of CO to give the Co(I)-acyl complex
Step 5: Addition of hydrogen to the unsaturated Co(I)-acyl complex
Step 6: Hydride migration results in the formation of aldehyde and the catalytic cycle is
completed with the regeneration of active species HCo(C0)3.
Kinetic studies support the HCo(C0)4 mechanism with a general rate expression
given in Eq. (2.1).
d(aldehyde) -l ----'--d-
1 "---'- = k[alkene ][catalyst][H zl[ CO] (2.1)
The rate determining step was Hz addition to the Co(!)-acyl species, step 5. The inverse
dependence on CO pressure is consistent with the mechanistic requirement for CO
dissociation from the various saturated 18e species to open up a coordination site for
alkene or Hz binding (Natta eta!., 1954). When using a 1:1 ratio ofHz/CO, the reaction
rate is essentially independent of pressure due to the opposing orders of H2 and CO.
16
Page 37
Increasing the Hz/CO ratio is of limited use for increasing the overall reaction rate
because HCo(C0)4
is only stable under certain minimum CO partial pressures at a given
temperature.
0 0 Ill q, Ill c c c H
I ~~ O=C-Co-Co-C=O
I c"'o o=c-co·''' ~ l'c~o c
1
'~ b c Ill Ill .---------~ (!j 0 o o [y.
H~R H11,~r.:::R H.,.....l...,..co
c 0
+ H21~ Rate _ CO 5 Determining Step
111 "-CO 0
2 ~+alkene
R H )I 1 c"'o 11-Co~~ I c~o c Ill 0 anti-Markovnikov
hydride addition
11 to C=C bond to give
3 ~ + CO linear alkyl
+CO
4
Figure 2.1: Catalytic cycle ofhydroformylation for unmodified cobalt catalysts (van
Leeuwen and Roobek, 1983).
2.2.2. Phosphine Modified Catalysts
Introduction of phosphine ligand into catalytic system brings some critical changes.
HRh(CO)(PPh3)3 is believed to be the precursor of the active hydroformylation species.
Model studies with this hydride complex provide explanation for different reaction
behavior and indicated extensive dissociation of this complex. This means equilibrium
exists between various substituted rhodium complexes before the catalytic cycle occurs
as shown in Figure 2.2. Each catalytic species is assigned an individual reaction rate and
17
Page 38
a characteristic product distribution. For example high phosphorus rhodium ratio and low
partial pressure of carbon monoxide favor HRh(CO)(L)z complex which is assumed to
give high linear aldehyde ratio (n/iso) as a result of steric effects. The mechanism for
hydroformylation developed by Heck and Breslow (1961) for unmodified cobalt catalyst
is valid with minor modification for phosphine modified rhodium catalysts. The catalytic
cycle for phosphine modified rhodium catalysts was established by Wilkinson with two
possible pathways - the associative and the dissociative mechanisms (Brown and
Wilkinson, 1970). Both mechanisms start with five coordinated bisphosphine complex
HRh(CO)z(PPhJ)z, but differ as regards to the primary reaction step, coordination of
olefin to the rhodium center as shown in Figure 2.3. In associative mechanism (route A),
olefins attach directly to the bisphosphine species, and after hydride migration step,
alkylrhodium complex is obtained which is an intermediate of dissociative mechanism as
well.
+CO -L HRh(CO)L2
il -CO
linear product branched product
Figure 2.2: Initial equilibria forming the active species, L = PPh3 or TPPTS.
In dissociative mechanism (route D) two different coordinatively unsaturated
complexes HRh(CO)(PPh3)2 and HRh(CO)z(PPhJ) can be formed by dissociation of CO
or phosphine. Addition of alkene to this unsaturated complex (step I) is followed by
hydride migration (step 2). After coordination of CO (step 3), insertion of CO (step 4)
occurs to give a rhodium acyl complex. The unsaturated rhodium acyl complex
undergoes hydrogenolysis (step 5) and completes the catalytic cycle with the regeneration
of active species and the production of either the linear or the branched aldehyde.
18
Page 39
HRh(CObL2
~ D ~~ A R~
HRh(CObL HRh(CO)L2
R~~ R
R~~ R R
Figure 2.3: Catalytic cycle of hydroformylation for phosphine modified rhodium
catalysts (Brown and Wilkinson, 1970).
Dissociative mechanism is generally accepted under industrial operating conditions
(Evans et a!., 1968). The active species in this mechanism are unsaturated rhodium
complexes containing one or two coordinated phosphine (HRh(C0)2(PPh3) or
HRh(CO)(PPh3)2) formed by dissociation of phosphine or CO. It is widely believed that
the n!iso ratio of the reaction is largely controlled by the competitive reaction of olefin
with these unsaturated complexes. As a result of steric effect the species
HRh(CO)z(PPh3) would be responsible for the formation of the branched aldehyde
whereas HRh(CO)(PPh3)2 would be responsible for the formation of linear aldehyde.
However, remarkable differences were observed between the catalytic activity and the
19
Page 40
selectivity of the water soluble catalyst HRh(CO)(TPPTS)3 and organic soluble one
(Horvath 1991). In the hydroformylation of propene, the latter shows much lower activity
with an increased selectivity to linear products. This is explained by the high dissociation
energy (30 kcal mor1) ofTPPTS from HRh(CO)(TPPTS)3 (Horvath 1991). This energy
is about 10 kcal mor1 higher than that necessary for dissociation of PPh3. The lower
catalytic activity might be due to higher dissociation energy. On the other hand because
of high dissociation of TPPTS, the equilibrium between active species shifts towards
unsaturated complex with two phosphine ligand, thus leading higher linear to branched
aldehyde ratio (nliso ).
2.3. Kinetic Study
The kinetics of the hydroformylation reactions is often represented by non-linear rate
equations, some purely empirical and some are based on proposed mechanisms. A
summary of kinetic studies in hydroformylation reaction is presented in Table 2.1.
Kinetic modeling of hydroformylation of propylene and cyclohexene was studied by
Natta et al. (1954) using Co-carbonyl catalyst. The reaction was found to be first order
with olefin, catalyst and hydrogen but negative order dependent with CO. At constant
PH , the rate increases with increasing Pco up to about I 0 atm but decreases with higher '
Pco. Gholap et al. (1992) reported rate equations to represent kinetics of formation of
both n- and isa-butyraldehyde in Co-carbonyl catalyzed hydroformylation of propylene.
Deshpande and Chaudari (1988) investigated detailed kinetics of hydroformylation of 1 •
hexene using HRh(CO)(PPh3)3 catalyst. The important observations were a strong
substrate inhibition with respect to CO and a mild substrate inhibition with respect to
olefins and requirement of a critical catalyst concentration. A similar kinetic model was
also developed by Bhanage et al. (1997) to describe the kinetics of the HRh(CO)(PPh3) 3
catalyzed hydroformylation of I -dodecene. The reaction is first order with respect to
concentration of catalyst and partial pressure of hydrogen. However the partial pressure
of CO inhibits the reaction above a threshold value. The kinetic order for I -dodecene is
one in the lower concentration range while at higher concentration range, a zero order
dependence was reported. In all these cases, the rate models proposed were empirical in
spite of a reasonably well-understood mechanism for hydroformylation.
20
Page 41
Table 2.1: A summary of kinetic studies involving hydroformylation reaction
Reference Substrate Catalyst Rate Equation Remarks
Natta eta!. propylene HCo(C0)4 k[substrate ][catalyst][H 2 ] • Reaction condition: T = 383-388 K; Pco r= = 0.3-5.4 MPa; PH1= 2.7-11 MPa; in (1954) [CO] toluene.
Deshpande and 1-hexene HRh(CO)(PPh3)3 k[H 2] [CO][ catalyst][ substrate] • Reaction condition: T = 303-323 K; Pco r=
(1 + K1 [substrate ])2·1(1 + K2 [ C0])2·5 = 0.074-1.693 MPa; PH1= 0.611-1.693 Chaudari (1988) MPa; in ethanol.
• The E. was higher compared to the homogeneous system using toluene as solvent and as well as in biphasic system, 117.3 kJ ·mor1
• Existence of a critical concentration of catalyst
Gholap et a!. propylene Co2(CO)s k[H 2 ]055 [CO][catalyst]0·75 [substrate] 0·8 • Reaction condition: T = 383-423 K; P =
(1992) r= (1 + K 1 [C0])2
3.5-10.0 MPa; Pco = 1-7.5 MPa; PH1= 2.5-7.5 MPa; in toluene.
• The n/iso ratio was found to increase with increases in catalyst concentration
and in the P co and PH, , but decreased
with Increase Ill propylene concentration.
• The E,: n-butyraldehyde = 54 kJ·mor' ; isobutyraldehyde = 82 kJ·mor1
•
Divekar et a!. 1-decene HRh(CO)(PPh3)3 k[ H 2]1·5 [CO] [ cata/yst]12[ substrate] • Temperature range: 323-343 K r • The Ea was found to be 49.3 kJ·mor1
(1993) (1 + K1[C0])3(1 + K 2[substrate])
and Equation (2.2) ~- ------
21
Page 42
Table 2.1 (Continue)
Reference Substrate Catalyst Rate Equation Remarks
Purwanto and 1-octene [RhCl(l ,5-COD))z k[ H 2 ][ CO] [catalyst][ substrate] • Used biphasic system; aqueous phase: 2.0xl04
r= (1 + Kl [C0])
2 (1 + K 2 [H2 ])
m3; organic phase: 0.5 x 10⁴ m3 (octene/octane Delmas (1995) with TPPTS ligand
= 3/7). • Reaction condition: T = 333-343 K; P = 1.5-2.5 MPa; Cr/CRh = 8 in presence of ethanol as a cosolvent. • Selectivity to linear aldehyde=- 80%.
Deshpande et al. 1-octene [RhC1(1,5-COD))z k[H 2][ CO][ catalyst] [substrate] • Reaction condition: Pco = 0.5-1.5 MPa; PHr r
l+K1[C0])2 +K2[H2] +K3[H2][CO] 0.5-1.5 MPa; [1-octene]= 0.0055 to 0.0278 (1996) with TPPTS ligand kmolm-3
; T= 323-343 K; Cr/CRh=8, in the presence of ethanol as co-solvent • E, was found to be 65.8 kJ·mol"1
Bhanage et al. 1-dodecene HRhCO(PPh3) 3 k[ H 2 ] [CO][ catalyst] [substrate] • Reaction condition: Pco = 0.17-2.04 MPa; r
(1 + K 1 [C0])2 (I+ K 2 [substrate]) Pl!l= 0.68-1.7 MPa; [1-dodecene]= 0.18 to 2.2 (1997) kmolm-3
; T= 323-343 Kin toluene. • E, was found to be 57.12 kJ·morl
Nair et al. (1999) styrene HRhCO(PPh3)J Equation (2.2) • Reaction condition: Pco = 0.3--4.12 MPa; Pl!l= 1.03--4.12 MPa; [styrene]= 0.92 to 6.89 kmolm-3
; T= 333-353 Kin toluene. • Rate was independent of [styrene] because of the higher concentration of styrene used. • Ea was found to be 68.802 kJ·mor'
Palo and Erkey 1-octene HRh(CO)[P{p- k[H ]0.48[ I 1o.84[ 1o.s 2 cata yst octene • Reaction condition: T=333 K; P=27.3 MPa
(1999) (scCOz) CF3C6R,)3h r I+ K 1 [C0]2·2
22
Page 43
Table 2.1 (Continue)
Reference Substrate Catalyst Rate Equation Remarks
Kiss et al. ethylene Rh(acac)(CO)z/PPh3 TOF- •Reaction conditions: Pco = 0.0081-0.56 (1999) k (Pe H /[PPh3 ]) MPa; PH2= 0.29-0.75 MPa; T= 353-383 K,
1 2 4 Pethylene = 0.072-0.38 MPa, Cr./CRh = 3-50.
1 + K1 (Pea I[PPh3 ]) + K 2 ([PPh3 ]! Pea) •Ethane selectivity increases with increasing T, indicating that the E, for olefin hydrogenation lS higher than ydroformylation.
•The aldehyde hydrogenation selectivity is very low.
• TheE, was found to be in the range of 76.3-80.0 kJ·mol"1
•
Zhang et al. 1-dodecene RhCl(CO) (TPPTS)z Equation (2.3) • Reaction condition: T= 353-373 K, P = 0.9-
(2002) 1.3 MPa. (with CTAB) •A semi -empirical rate equation was
developed, combining mechanisms of homogeneous reaction with interfacial reaction of biphasic hydroformylation.
• TheE, was found to be 72.8 kJ·mol"1•
Yang et al. 1-dodecene RhCl(CO)(TPPTS)2 [ r • Reaction condition: T= 373 K; P= l.lMPa k k k v 4
(2002a) (with CTAB)
r = AoN 1 [eTAB] 2 [substrate] 3 V: • CT AB was used to enhance the reaction rate oflong chain olefm and the ratio of n/iso ..
• The extent of emulsification had a positive effect on conversion and a negative effect on regioselectivity, and consequently on the separation of the aqueous catalyst phase from the organic phase.
··-- ·--
23
Page 44
Table 2.1 (Continue)
Yang eta!. propylene RhCI(CO)(TPPTS)2 Equation (2.4) and (2.5) •Reaction conditions: T = 363-383 K, p =
(2002b) (with CTAB) 3.1MPa,pPropylene = 0.7MPa, Cr/CRh = 60-30.
•The E, was found to be in the range of 75 to 85 kJ·mor1
•
•Molar ratio of normal/isomeric aldehyde varied from 3.9 to 56.1.
• Plausible reaction pathway was proposed.
Di wakar et a!. 1-hexene Rh-TPPTS (SAPC) kP P [substrate ] •Reaction condition: Pco = 0.34-5.52 MPa;
(2005) H
2 co
PH1= 0.69-3.45 MPa; [1-hexene]= 0.25 to 1.0 r =
(l+KbP~0 J kmolm-3
; T= 353-373 K. • The E, was found to be higher compared to
homogeneous system, 84.37 kJ·mol'1.
Rosales et a!. 1-hexene Rh( acac )(CO )2( dppe) K1 K
2K
3 [Rh][substrate ][CO] • Reaction condition: 353 K, 0.1-0.7 MPa H2
(2007a) r= [CO]+ K
1K
2 [substrate]
and 0.1-0.7 MPa CO in toluene. •Linear to branched ratios were in the range 2-
2.6 and independent of the reaction conditions, except when the syngas and CO pressure were increased, where a slight reduction of the n/iso ratio was observed.
Rosales et a!. 1-hexene [Rh(COD)(PPh3) 2]PF6 K1K
2Kl
4 [Rh][substrate][H
2] •Reaction condition: P = 0.2-0.5 MPa and T=
(2007b) r= 333 K for Rh and 373 K for Ir in toluene. [CO]+ K
1 [H
2] • n/iso= 3.0 and 3.7 for Rh and -2 for Jr.
• Plausible reaction pathways were proposed. Although similar in the main features, the two systems display notable differences in the values of the constants of the equilibria involved.
24
Page 45
Nair et al. (1999) and Divekar et al. (1993) derived a rate equation of Equation 2.2
considering the mechanism proposed by Evans et a!. (1968) for HRh(CO)(PPh3)3
catalyzed hydroformylation of styrene and 1-decene, respectively. In deriving the
mechanistic model, the elementary steps involve in the catalytic cycle were simplified.
The rate models, derived assuming oxidative addition of hydrogen to Rh-acyl species as
the rate determining step, were:
r = kK1K2[H2 ][CO][catalyst][substrate] (2.2)
I+ K2[CO] + K1K2[CO][substrate] + K1K2K3[C0] 2[substrate] + K1K2K3K4[cohsubstrate]
This model predicted the negative order dependence with CO, a unique feature of kinetics
of olefin hydroformylation. However, the physical meanings of the rate coefficients in the
denominator were not discussed. Kiss et a!. (1999) also reported a mechanistic model for
kinetics of ethylene hydroformylation using Rh(acac)(C0)2/PPh3 catalyst with unusual
observations of first order with ethylene at higher PPh3 concentration. The complex
kinetics and change in reaction orders have been explained as a result of shift in rate
determining step under different conditions.
The kinetics of biphasic hydroformylation of 1-dodecene catalyzed by
RhCl(CO)(TPPTS)2 has been investigated in the presence of cationic surfactant,
cetyltrimethyl ammonium bromide (CTAB) by Zhang et a!, (2002). The molar ratio of
linear to branched aldehydes in the reaction product is rather high (up to 20) and the
reaction rate was also significantly enhanced by the surfactant. In contrast to the earlier
reports using homogeneous catalysts, in this case, substrate inhibition with CO was not
observed. This is due to the lower range of dissolved CO concentrations as a result of its
lower solubility in aqueous catalyst phase. An orthogonal experimental design was
performed for analyzing the effects of catalyst, 1-dodecene and surfactant, ligand
concentration as well as the volume ratio of organic phase to aqueous phase and
temperature on the reaction rate and regioselectivity. The optimal reaction conditions are
suggested by the margin and variance analyses of experimental data according to the
reaction rate with suitable compromise of the ratio of normal/isomeric aldehydes and
hydroformylation selectivity to aldehyde. A semi-empirical rate equation was developed,
25
Page 46
combining the mechanism of homogeneous hydroformylation with interfacial reaction of
biphasic hydroformylation:
3.806x10¹⁸ exp(-8755 I T)p H Pco[catalyst][subtrate]WtrAB(V0 IV w)-1.44 1(1 +0.03423([P]I[Rh])) r 2 (2.3)
(1 + 2657 exp(-25581T)p H )(1 + 1.672pcol(1 +3307[catalyst])(1 + 1.646[substrate])(1-44.26W CTAB) 2
This model indicates that the exponents of reactants (Hz, CO, 1-dodecene) are fractional
for the initial reaction rate. The surfactant has important influence on the mechanism,
hence on the reaction rate. Furthermore, the liquid-liquid dispersion and interfacial area
are also greatly influenced by the surfactant and impose effects on reaction rate. The
effect of co-solvent on kinetics of biphasic hydroformylation of 1-octene has been
reported by Deshpande eta!. (1996) and by Purwanto and Delmas (1995) for a catalyst
prepared from a precursor [Rh(COD)Cl]z and TPPTS ligand. Due to enhancement of
solubility of CO in presence of the co-solvent, ethanol, a substrate inhibition with CO
was observed as expected. However, ethanol reacts with nonanal to form acetals during
the reaction. The formation of acetals were avoided by adding a buffer solution of sodium
carbonate and bicarbonate (pH = 10). A mechanistic rate equation derived assuming the
addition of olefin to the active catalyst as a rate-determining step was found to fit the data
satisfactorily. A thermodynamic analysis concerning the solubilities of octane and gases
in the reaction medium was studied by Purwanto and Delmas (1995) and a semiempirical
kinetic model was used to describe the rate of reaction.
Yang et a!. (2002a) investigated the effect of reaction engineering factors on biphasic
hydroformylaton of 1-dodecene. Novel agitator configurations have been reported to be
effective in promoting interphase mass transfer rate in the gas-liquid-liquid
hydroformylation system, thus increasing the initial rate and improving the n!iso ratio of
products. High initial rate and regioselectivity were achieved with increase in olefin and
CTAB concentrations, and that high agitation speed or organic/aqueous phase volume
ratio increased the initial reaction rate but inhibited linear aldehyde formation. An
empirical macro-kinetic equation for the initial rate and the correlation of
normal/isomeric aldehyde ratio was proposed to represent the kinetics.
26
Page 47
Yang et a!. (2002b) studied the kinetics of RhCl(CO)(TPPTS)z/TPPTS catalyzed
hydroformylation of propylene using an orthogonal experimental design method. The
effects of several process variables on the initial rate of reaction were determined by
margin and variance analysis. The rate was found to be in positive order with respect to
hydrogen partial pressure and rhodium catalyst concentration, while higher CO,
propylene partial pressure and TPPTS concentration showed substrate-inhibited kinetics.
A power rate equation and a semi-empirical rate equation were presented:
=1286 10s (-76.78)P. 0.251Sp -0.6403p -0.9808C 0.9789C -1.188 r . x exp RT H, co P Rh L (2.4)
(2.5)
Further verification was performed on the applicability of the empirical models. Eqs.
(2.4) and (2.5) were used to predict the pressure drop in the autoclave during
hydroformylation runs. Both models represent well at the initial period of
hydroformylation only and were not directly applicable to the circumstances with
decreased total pressure in the autoclave.
Palo and Erkey (1999) reported kinetics of hydroformylation of 1-octene in
supercritical COz with HRh(CO)[p-CF3C6H4hh as a catalyst at 323 K and 27.3 MPa
pressure. The reaction order was found to be 0.5 with both Hz and 1-octene, 0.84 with
catalyst and a negative order with CO. The catalyst solubility in supercritical COz is
reported to be higher than that in organic solvents and the critical catalyst concentration
was not observed as in the conventional homogeneous catalyst. The main advantage of
supercritical COz is the higher solubility of Hz, CO and catalyst, but for
hydroformylation, the higher CO concentration is not desirable due to rate inhibition with
CO and hence it is necessary to optimize the Hz/CO ratio for achieving higher rates in
supercritical medium.
Diwakar et a!. (2005) studied the kinetics of hydroformylation of 1-hexene using
Rh/TPPTS complex exchanged on anion exchange resin to Amberlite IRA-93. The rate
was found to be first order dependent on catalyst, 1-hexene concentrations and hydrogen
27
Page 48
partial pressure. The inhibition in rate with enhanced CO pressure was observed.
However, the inhibition is not as strong as that observed in other homogeneously
catalyzed reaction, particularly in ethanolic solvent. A reasonable explanation for this
behaviour was not provided. The hydroformylation of the isomerized hexenes was not
favored over this catalyst, which was due to hindered access for 2-methylheptanal. The
catalyst was also stable and could be recycled with no loss in activity or selectivity for
five recycles.
A mechanistic model representing the kinetics of the homogeneous hydroformylation
of 1-hexene using rhodium catalyst formed by addition of I equiv. bidentate ligand of
1,2-bis(diphenylphosphino)ethane (dppe) to Rh(acac)(C0)2 under mild reaction
conditions (353 K, 0.1-0.7 MPa Hz and 0.1-0.7 MPa CO) in toluene was developed
(Rosales et a!., 2007a). The reaction rate was found to be first-order in dissolved
hydrogen concentration at pressures below 3 atm, but independent of this parameter at
higher pressures. In both regimes (low and high Hz pressure), the initial rate was first
order with respect to the concentration of Rh and fractional order with respect to 1-
hexene concentration. Increasing CO pressure had a positive effect on the rate up to a
threshold value above which inhibition of the reaction was observed; the range of
positive order on CO concentration is smaller when the total pressure is increased. The
kinetic data and related coordination chemistry are consistent with a mechanism
involving RhH(CO)(dppe) as the active species initiating the cycle, hydrogenolysis of the
acyl intermediate as the rate-determining step of the catalytic cycle at low hydrogen
pressure, and migratory insertion of the olefin into the metal-hydride bond as rate limiting
at high hydrogen pressure. This catalytic cycle is similar to the one commonly accepted
for HRh(CO)(PPh3)3. Rosales et a! (2007b) performed kinetic and mechanistic studies
using rhodium and iridium complexes of the type [M(COD)(PPh3)2]PF6 (M = Rh, Ir) as
catalyst precursors for the hydroformylation of 1-hexene under mild pressures (0.2-0.5
MPa) and temperatures (333 K for Rh and 373 K for Ir) in toluene solution. For both
complexes, the reaction proceeds according to the rate law
K,K,K3k4 [M ][substrate ][H,][co] r = -;-~-'---'';--'~"-7-----'-=;c-=-=-""-c;;c-"""
[co]' + K, [H,][co ]+ K,K2K 3 [substrate ][H,] (2.6)
28
Page 49
The experimental data are consistent with the proposed general mechanism in which the
transfer of the hydride to a coordinated olefin promoted by an entering CO molecule is
the rate-determining step of the catalytic cycle. The kinetics of 1-hexene
hydroformylation catalyzed by the iridium precursor are first order with respect to the
catalyst and substrate concentrations and fractional order with respect to dissolved CO
concentration, which tends to a highly negative order at high CO pressure. However, in
contrast to the Rh pre-catalyst, the reaction rate varies in accord with a saturation curve
with respect to hydrogen concentration, that is, a first order kinetics at low hydrogen
concentration, which tends to zero order at high H2 concentration (P > 0.3 MPa).
2.4. Influence of Process Parameters
The effects of the major process parameters - namely, the olefin concentration, catalyst
concentration, ligand concentration, total pressure, gas composition and temperature on
the rate and selectivity have been reported (Bhaduri and Mukesh, 2000; van Leeuwen and
Claver, 2000). Effect of temperature is almost similar for all type of catalysts
(unmodified and modified cobalt and rhodium). The rate of the oxo synthesis increases
with temperature. The n/isa ratio decreases for almost all olefins toward higher
temperatures. The decrease of the n!isa ratio is more pronounced with modified rhodium
catalysts. This tendency is inversed for a-olefins bearing a functional group which is
directing the regioselectivity toward linear products (van Leeuwen and Claver, 2000).
Raising the hydrogen partial pressure increases the reaction velocity and to some
extent the n/isa ratio. However, hydrogen partial pressure has no significant effect on the
n/isa ratio at high Pm (>60 bar). Increasing the carbon monoxide partial pressure has
negative effect on the reaction rate at high Pea whereas positive effect at low Pea
(Bianchi et a!., 1977). These are true for both unmodified and modified catalysts.
Following equilibrium may be proposed for ligand modified catalyst:
HM(CO)x + y PR3 ~ HM(CO)x-y(PRJ)Y + yCO
29
Page 50
The equilibrium shifts to the right handside at low Pco and formation of linear aldehyde
is favored. The n/iso ratio decreases with increasing Pco. At higher partial pressures the
species HM(C0)4 becomes dominant, thus favoring the linear product again (Piacenti et
al., 1970). The increasing ligand/metal ratio increases the n/iso ratio in general whereas
the catalytic activity varies in a nonlinear fashion as a function of phosphine
concentration (Figure 2.4). Reactivity reaches a maximum at a point where the selectivity
of the reaction remains constant.
14 80 ~
12 ~ 75 ~
" ~~ ]: M ~ 10 ·s " 70
0 ~ .§ 8 a ~ " 65 ~ .s 0 - 6 ...l
Pi B 60 .r 4 " " ·~ ~
" 55 > 2 " 0 u
0 50 0 10 20 30 40 50 60 0 10 20 30 40 50 60
[PPh3]/[HRh(CO)(PPh3)3] [PPh3]/[HRh(CO)(PPh3) 3]
Figure 2.4: Effect of phosphine/rhodium (PPh3/HRh(CO)(PPhJ)J) ratio on reaction rate
and selectivity (Comils and Herrmann, 1996).
2.5. Solubility and Reaction Rate of Linear a-Olefin in Water.
Under the conditions of the Ruhrchemie/Rhone-Poulenc process, the space-time yield of
the hydroformylation reaction decreases with increasing chain length of the substrate.
Table 2.2 summarizes the results of the batchwise hydroformylation of different a-olefin
at 30-80 bar syngas pressure (Bahrmann eta!., 2004). Generally all substrate provide high
selectivity toward linear products whereby the nliso ratio ranging from 94:6 to 100:0.
However, the rate decreases by two orders of magnitude with the increasing chain length
of the substrate from C5 to C 12·
30
Page 51
80 --- k (1-pentene) ~ 6.00645 min- 1
70 - k (1-hexene) ~ 0.00245 min-1
~ ~ ... k (1-dodecene) ~ 0.00001 min- 1
..,. ,-~ 0 60 ...... ~
" + 1-pentene ,- .It " ., .... £ 50 II 1-hexene " ... ~ & 1-dodecene /
40 if B .. " ~/ 0
30 '1!] ... " ., ~ 20 /' 0 u
' 10 ,. lr __ .... _..... -....----· -
0 --·----0 50 100 150 200
Time (min)
Figure 2.5: Dependence of reaction rate on chain length of alkenes (Brady et a!. 1982)
2.6. Solubility Study and Thermodynamic Modeling
For a gas-liquid reaction, the solubility of the reactant gas in the liquid medium is an
important parameter required for the interpretation of reaction kinetics and for reactor
design. The simplest method of estimation of gas solubility is to use the Henry's law if
the Henry's law constant is known or can be found out by fitting experimental solubility
data. In the absence of sufficient and reliable data, thermodynamic models or techniques
have proved to be useful for estimation of gas solubility. So far as the solubility of
syngas (Hz/CO) in a hydroformylation solvent is concerned, all the above techniques
have been used with varying degree of success. The regular solution theory (RST) has
been used by several workers to interpret the solubilities of Hz and CO in different
hydroformylation solvents (Still et a!., 2006; Jauregui-Haza et a!., 2004; Breman and
Beenackers, 1996; Purwanto eta!., 1996; Radhakrishnan eta!., 1983). The average error
of prediction has been less than 10% in most cases. Fredenslund eta!. (1977) proposed
the UNIFAC group contribution method to predict the solubility of a gas in liquid.
Antunes and Tassios (1983) used a modified Universal Functional Activity Coefficient
(UNIFAC) model for prediction of Henry's constant for methane, nitrogen, and oxygen
in alkane solvents and in water. Sander et a!. (1983) presented the UNIFAC
thermodynamic parameters and results for the promising method developed by Mathias
32
Page 52
and 0-Connel to predict the solubility of methane, ethane, ethylene, acetylene, hydrogen,
oxygen, nitrogen, hydrogen sulphide, carbon monoxide and carbon dioxide in pure
solvent and solvent mixtures. The method was found to be applicable at low pressures
and temperature ranging from 210-475 K and to both polar and nonpolar solvents. Fahim
and Elkilani (1991) predicted the solubility of hydrogen in naphtha reformate over a
temperature range of 423 to 473 K by the UNIF AC method with an accuracy of± I 0 %.
However, one of the principal limitations of the UNIF AC method is that group
interaction parameters needed for solubility estimation may not always be available.
Solubilities of Hz and CO in pure solvent and solvent mixtures relevant to the
hydroformylation process are studied in this work, particularly in the temperature
dependent multi-component solvent (TMS)-systems involving propylene carbonate,
dodecane and 1 ,4-dioxane. These solvents are preferred because of high boiling point,
thermal stability, and inert nature with respect to the homogeneous catalyst, olefin,
hydrogen, carbon monoxide and the hydroformylation products (Tijani and Ali, 2006,
Behr et al., 2005, Behr and Miao, 2004). However, neither experimental data nor any
theoretical model on solubilities for CO and Hz in the TMS-system are available in the
literature.
2.7. Liquid-liquid Equilibrium (LLE) Study
The issue of solvent selection for extraction or for use as a reaction medium has received
increase interest in the recent time (Palo and Erkey, 1999; Behr et a!., 2005).
Multicomponent solvent systems have been explored in order to achieve desired
extraction properties while eliminating hazardous components making it relatively
benign. Besides, a solvent system should be inexpensive, and easily recoverable, a good
solvent should be relatively immiscible with feed components other than solute and have
a different density from the feed to facilitate phase separation. Also, it must have a very
high affinity for the solute, from which it should be easily separated by distillation or
other simple separation processes. For instance, propylene carbonate (PC) is widely used
as an extractant of aromatic hydrocarbons, in the petrochemical industries (Zaretskii, et
a!., 2008). Therefore, we anticipate that PC will enable an effective extraction of the
HRh(CO)(PPh3)3 catalyst and P(OPh)3 ligand due to the presence of the aromatic or
33
Page 53
phenyl groups. Several models are available to correlate the LLE experimental data.
Some are empirical such as those proposed by Margules and Van Laar (Novak et a!.,
1987); others, use the local composition concept, such as Wilson (1964) and NRTL
(Renon and Prausnitz, 1968); still some others, such as UNIQUAC (Abrams and
Prausnitz, 1975), have a more rational theoretical basis; and finally, a few such as ASOG
(Kojima and Tochigi, 1979); and UNIFAC (Fredenslund 1989), use the group
contribution method, in which the activity coefficients are calculated from the
contributions of the various groups making up the molecules of the solution.
A few LLE studies on the PC, dodecane and I ,4-dioxane have been reported and the
more relevant ones are presented herein. In order to simulate the extraction of aromatics
from reformate, Annesini et a!., (1985), studied the liquid-liquid equilibria for ternary
systems paraffin-aromatic hydrocarbon-propylene carbonate at 20°C. The experimental
data were correlated by means of the Non-Random Two Liquid (NRTL) and Universal
Quasi-Chemical Activity Coefficients (UNIQUAC) models. Generally the NRTL
equation gives root mean square values slightly lower than those of the UNIQUAC
equation but the difference is not significant. Liquid-liquid equilibria for the ternary
systems ( octane+toluene+propylene carbonate), (2,2,4-trimethylpentane+ethylbenzene+
propylene carbonate), (methylcyclohexane+benzene+propylene carbonate), and (1-
decene+toluene+propylene carbonate) were measured by Fahim and Merchant (1998)
over a temperature range of 293 K to 348 K. The results were used to estimate the
interaction parameters between each of the three compounds present in each system for
the NRTL and the UNIQUAC equations and between each of the main groups of
hydrocarbons (CH2, C=C, ACH, and ACCH2) and propylene carbonate for the UNIF AC
model as a function of temperature. Among the three methods NRTL and UNIQUAC
gave the best fit with root-mean-square deviation (rrnsd) of 1.3%. Recently, Chernyak
(2008) studied the liquid-liquid equilibria of water/PC and water/butylene carbonate
systems at atmospheric pressure and T of 280.65 to 293.15 K using analytical sampling
techniques. The main method of composition analysis employed in this study was based
on the samples' density measurements using vibrating tube densimeter. The experimental
data were correlated with a NRTL model and the deviations between experimental and
predicted values, were less than 0.15 %.
34
Page 54
Liquid-liquid equilibria involving I ,4-dioxane was reported by Katayama (1999). The
ternary systems methanol-cyclohexane and I ,3-dioxolane or I ,4-dioxane of cyclic ether
compounds were measured in the range of277.79-308.64 K. His results indicate that the
expanses of the two-liquid phase were related to the magnitude of the solubility
parameters of the ethers. The results were well correlated by the UNIQUAC equation
through minimizing the objective function with weighting factors. As for dodecane, the
LLE data for the ternary mixtures of (methanol + aniline + n-octane) and (methanol +
aniline+ n-dodecane) at T= 298.15 K and ambient pressure were reported to study the
extraction efficiency of methanol or ethanol to recover aromatic hydrocarbons from
refinery process streams (Mohsen-Nia et a!., 2008). The UNIQUAC and NRTL activity
coefficient models satisfactorily correlated the LLE experimental data of the studied
systems. It was found that the efficiency of methanol for the extraction of aniline from
(aniline + n-dodecane) mixtures is higher than that for the extraction of aniline from
(aniline + n-octane) mixtures.
Robbins et a! (2007) presented the liquid-liquid equilibrium data that relates to the
hydroformylation reaction. The LLE of the aqueous biphasic solvent system and the
distribution of 1-octene and nonanal in four ternary systems: the n-hexane + THF +
water, n-hexane + acetonitrile + water, n-hexane + 1 ,4-dioxane + water, and ethyl ether +
1,4-dioxane +water were studied. The LLE and distribution were modeled using both the
UNIQUAC and NRTL gE models. The ternary LLE results were accurately predicted for
each system with both equations while only the UNIQUAC model was successful in
predicting the product distribution coefficients. Lee and Peters (2004) used UNIF AC
method to predict equilibrium phase partitioning behavior of a coso! vent in a two-phase
nonaqueous phase liquid (NAPL)-water system. The work demonstrated how the
UNIFAC model could be used to predict coso1vent-enhanced NAPL solubilization as
well as co-solvent partitioning into the NAPL phase that could lead to alterations in
volume, density, and viscosity of the phase. Although a number of research papers have
appeared on the LLE of a multi-component solvent system, the experimental LLE data
and thermodynamic modeling related to the TMS- system are not available in the
literature.
35
Page 55
2.8. Summary
The most important applications of higher hydroformylation products are plasticizer
alcohols in the Cs-Cil range and synthetic detergent alcohols in the C12-C18 range, with a
worldwide consumption of 1.5 million tons and 1.2 million tons in 1995, respectively
(Comils and Herrmann, 2004). Compared with cobalt, rhodium as catalyst metal is
favorable with respect to the raw material economy and the energy balance in the
hydroformylation of higher olefins. Since the use of a temperature-dependent multi
component solvent (TMS) process, in which a catalyst is designed as a residue in one of
the liquid phases and the product in the other liquid phase, can be an enabling approach
for a commercial application of the hydroformylation process with high selectivity,
efficiency, and ease of product recovery (Behr et al., 2005), it was proposed to perform
experimental studies to develop the process of hydroformylation in TMS- systems
involving the use of commercially available Rh-based catalyst, phosphite ligands and
solvents. The challenge is to identify the appropriate solvent mediator since a correlation
between the amount of the solvent mediator and the amount of catalyst leaching has been
reported (Behr et al., 2005). The complex multistep mechanism also represents a
challenge in the development of the mechanistic model. As a proof of concept, studies on
the solubilities of the gaseous reactants, kinetics and distribution of solutes in the TMS
system involving hydroformylation of higher olefins have been performed.
36
Page 56
CHAPTER3
DEVELOPMENT OF THE MECHANSITIC RATE MODEL USING AB INITIO
CALCULATIONS
Molecular simulation is a very powerful toolbox in modern molecular modeling, and
enables us to follow and understand structure and dynamics with minute detail - literally
on scales where motion of individual atoms can be tracked. This chapter highlights the ab
initio quantum chemical computations on the intermediates formed at different steps of a
hydroformylation reaction pathway in a homogeneous solvent system using rhodium
phosphite catalyst. The ab initio computational methodology is found to be a reliable tool
for arriving at the reaction energetics and pathways for this class of reactions. These
information together with experimental data proves to be effective in developing
macroscopic practically useful rate models.
3.1. Kinetic Models
Kinetic model for a chemical reaction is an equation which links the reaction rate with
concentrations or pressures of reactants and constant parameters (normally rate
coefficients and partial reaction orders). They can be used in the design or modification
of chemical reactors to optimize product yield, more efficiently separate products, and
eliminate enviroumentally harmful by-products and process economics study. There are
two main approaches to developing kinetic models which are empirical or data based
modeling and mechanistic or building models based on the mechanism of the reaction.
The following will discuss differences between the two approaches.
3.1.1. Developing Empirical Models
An empirical model can be described as a model where the fitting capacities are the only
criterion used. The aim is to describe the observed data as well as possible, using a
convenient mathematical relationship without any knowledge about chemical processes
or underlying mechanism (Costa and Kristbergsson, 2009). Therefore, empirical
modeling much depends on the availability of representative data for model building and
37
Page 57
validation. Apart from cause-and-effect between variables, not much else is required in
terms of process knowledge and a trial and error approach is adopted
3.1.2. Developing Mechanistic Models
The development of mechanistic models uses fundamental knowledge of the interactions
between reaction variables to define the model structure. Mechanistic modeling therefore
does not require much data for model development, and hence is not subject to the
idiosyncrasies in data. However, it requires a fundamental understanding of the physics
and chemistry governing the process and therefore can be very time consuming. Very
often, a model can be a combination of some mechanistic and empirical components
which is called semi-empirical. Most researchers agree that semi-empirical models are
inherently superior to empirical models as they give a better understanding of the
chemical reaction.
3.1.3. Empirical versus Mechanistic Models
When available, mechanistic models can provide more realistic predictions, and more can
be done with it in terms of analyses. For example, the details contained within a
mechanistic model offer the opportunity to test the sensitivities of the process to
meaningful entities such as activation energies; substrate inhibition effect, catalyst
poisoning, etc. With very few exceptions, the parameters of data based models are just
numbers encapsulating combined effects. Therefore, it is very difficult to attach physical
meaning to them, and hence such sensitivity studies cannot be performed. Another
comparison that is always made between the two modelling approaches is that of cost.
Due to the complexity of many processes, mechanistic modelling is indeed very
expensive in terms of human effort and expertise. As the mechanistic modelling approach
forces a detailed examination of fundamental process behaviour, some of the cost is
recovered in terms of increased 'deep' knowledge of process behaviour. Such benefits are
intangible though, and are often discounted. In practice, empirical modeling can be
expensive as well. It requires large amounts of 'representative' data, and in many
instances, these can only be acquired by perturbing the process via planned experiments.
Inevitably production will be disrupted, and the lost revenue can exceed the cost of hiring
38
Page 58
someone to develop a mechanistic model. The advantage with empirical modelling lies in
the fact that empirical modelling will deliver some form of working model in a much
shorter time.
3.2. Approaches to Kinetic Modeling
Kinetics of industrially important hydroformylation of higher olefins have been reported
by several workers. The kinetics of homogeneous hydroformylation of higher olefins
using Rh-based catalyst has been studied by Palo and Erkey (1999), Bhanage et a!.
(1997), Divekar et a!. (1993) and Deshpande and Chaudari (1988). However, the rate
equations proposed were essentially empirical. Palo and Erkey (1999) studied the kinetics
of hydroformylation of 1-octene in supercritical carbon dioxide (scC02) with
HRh(CO)[P(p-CF3C6H4)3]3 at 50°C and 273 bar. The observed kinetic behaviour differs
from the conventional systems using HRh(CO)(PPh3)3 in organic solvents. This may be
due to several factors - scC02 solvent effects, the modified phosphine ligands, and the
increased H2and CO concentrations relative to conventional systems. Chaudhari and co
workers developed kinetic rate expressions using several different substrates (1-hexene,
1-decene and 1-dodecene in organic solvent) and calculated the rate parameters and
activation for each system (Bhanage eta!. (1997), Divekar eta!. (1993), Deshpande and
Chaudari (1988). A mechanistic model was also proposed for the hydroformylation of
styrene by Nair eta!. (1999) but was not used to develop a general kinetic equation for
the hydroformylation of olefins. Details of the kinetic models are presented in Section
2.3. Summarizing the observations reported in literature, it can be stated that the kinetic
rate of hydroformylation has been found to be influenced positively by increasing the
concentration of catalyst and hydrogen, whereas increased carbon monoxide exerted a
negative effect. The apparent activation energy required for aldehyde formation has been
found to be in the range from 30 to I 00 kJmor1•
In this work we make the first contribution to the study of the kinetics of
hydroformylation of higher olefins, using a first principle method such as ab initio. The
most widely used ligand in a homogeneous hydroformylation process 1s
triphenylphosphine (PPh3). In the rhodium-PPh3 catalyzed hydroformylation, it has been
established that hydridocarbonyl-tris(triphenylphosphine)rhodium (I) (HRh(CO)(PPh3)3)
39
Page 59
is a direct catalyst precursor. In spite of the connnercial importance of the rhodium-PPh3
catalyst, only limited data have been published on the kinetics of the hydroformylation
reaction under the industrial operating conditions (T= 343-393 K, CO partial pressure=
5-25 bar, H2 partial pressure = 5-25 bar, Rh loading = 1 mM and olefin concentration =
0.1-2 M). The ab initio technique of quantum chemical computation was used to obtain
the energetics and to identify the reaction pathways of Rh-catalyzed hydroformylation of
higher olefins (1-octene, 1-decene, 1-dodecene and styrene) using low concentration of
phosphine ligand. Since the available computational tools did not allow prediction of the
kinetic parameters of the systems under study, the mechanistic model was developed
based on the mechanism and pathways given by the ab initio calculation. Several
simplifying assumptions were made to develop a generalized kinetic model based upon
the well-documented mechanistic steps in homogeneous hydroformylation of olefins
using Rh-based catalyst. It is assumed that
1. the reaction has reached a steady-state,
11. all but one of the reaction steps are in equilibrium,
iii. the starting intermediate species at the reaction interface IS the complex
HRh(COh(L)2, and
IV. the total rhodium concentration remams constant and the catalyst is uniformly
distributed over the cross section of the reactor,
v. the concentration of dissolved CO and H2 is constant in the reaction mixture - this
assumption is justified because the syngas is continuously added to a well-mixed
reaction mixture (Ollis and Turchi, 1990).
The kinetic constants were evaluated by fitting experimental hydroformylation data at
different process conditions. The resulting activation energies matched remarkably well
with that predicted by the quantum chemical method thereby validating its applicability
to this class of homogeneous catalytic reactions.
40
Page 60
3.3. Molecular modeling
Molecular modeling based on quantum mechanical computations is emerging as a useful
and reliable strategy of predicting energetics and kinetics of chemical reactions (Saeys et
a!., 2005; Cavallotti et a!., 2007). The strategy has three major ramifications - the ab
initio electronic structure and molecular orbital (MO) calculations, semi-empirical
methods and molecular mechanics. Of the three, ab initio molecular orbital methods are
the most accurate and consistent because they provide the best mathematical
approximation to the actual system (Le Bris and Defranceschi, 2000). The term ab initio
implies that the computations are based on the laws of quantum mechanics, the masses
and charges of the electrons and atomic nuclei, and the values of fundamental physical
constants (Hehre eta!., 1986). Virtually no conceptual approximations are involved. On
the other hand, semi-empirical methods are based on the Hartree-Fock theory, using
empirical corrections in order to improve performance (Streitwieser, 1961 ). The method
is very important in computational chemistry for treating large molecules where the
Hartree-Fock method without the approximations is too expensive. The use of empirical
parameters appears to allow some inclusion of electron correlation effects into the
methods. Within the framework ofHartree-Fock calculations, some pieces of information
(such as two-electron integrals) are sometimes approximated or completely omitted. In
order to correct for this loss, semi -empirical methods are parameterized, whereby results
are fitted by a set of parameters, normally in such a way as to produce results that best
agree with experimental data, but sometimes to agree with ab initio results. The term
molecular mechanics refers to the use of Newtonian mechanics to model molecular
systems. A group of molecules is treated as a collection of balls and springs rather than a
quantum collection of electrons and nuclei. The potential energy functions and the
parameters used in molecular mechanics are known as "force fields" (Roat-Malone,
2002). Molecular mechanics can be used to study small molecules as well as large
biological systems or material assemblies with many thousands to millions of atoms.
Molecular orbital methods deal with solution of the Schrodinger' s equation
H '¥ ( ) = •tz 8'¥ mol (f) mol mol t l
8t (3.1)
41
Page 61
where His the Hamiltonian operator representing the sum of kinetic and potential
energies, n is Planck's constant, i is the imaginary unit, 'Fmit) is the wave function,
which is the probability amplitude for different configurations of the system and tis time.
For a chemical system a 'basis set' of functions is used that satisfy a series of rigorous
mathematical approximations (Bell et a!., 2007). Improvement in calculations is obtained
by the use of triple-split-valence basis sets, of which the only important one is 6-3110.
Here there are 6 Gaussians for the core basis functions and the valence functions are split
into three sets, comprising three, one, and one Gaussians, respectively. In general
electronic structure calculations are often improved by adding functions corresponding to
orbitals with a higher angular momentum than those that are occupied. For example p
functions may be added to hydrogen, d functions to C, N, 0, and so forth, andjfunctions
to transition metals. These are denoted by adding an asterisk to the basis set or specifying
p, d functions, and so forth, for example,
6-310* or 6-31G(d): Adds d functions to 2nd row elements (C, N, 0, etc.).
6-310** or 6-31G(d,p): Adds d functions to 2nd row elements (C, N, 0, etc.) andp
functions to H.
For anions and atoms with lone pairs it may be that there is some electron density far
from the nuclei. This can be handled by the addition of diffuse functions, which are broad
Gaussian functions (small a coefficient) that are not readily calculated for isolated atoms,
but are chosen by well-established rules of thumb. These functions are represented in the
basis set specification by a + or ++ sign. Experience shows that the addition of
polarization and diffuse functions to H atoms is not usually necessary, for example,
6-31 +G: Adds diffuse functions to 2nd row elements (C,N, 0, etc.).
6-31 ++G: Adds diffuse functions to 2nd row elements and H.
Calculations involving the heavier atoms, for example, transition metals, can be very
time-consuming owing to the large numbers of electrons involved and the fact that larger
42
Page 62
basis sets are not available for heavier atoms. The problem can be reduced in size by
restricting the full calculation to the valence electrons only and including the core
electrons simply as an effective core potential (ECP). A number of these have been
proposed, of which probably the most popular is the Los Alamos ECP (Bell et a!., 2007).
In combination with double-zeta functions for the valence electrons, the Los Alamos ECP
is used in the "LanL2DZ" basis set, which is often employed in calculations on molecules
involving transition metals.
Ab initio molecular orbital calculations are specified by 'model chemistry' (Hehre et
a!., 1986). The accuracy and computational time depend upon the choice of the method
and the basis set, the general structure and electronic state of the molecular system under
study (e.g., charge and spin states), and the treatment of electron spin. Reasonable
accuracy in moderate computer time may be achieved for larger molecules (n-1 0-30
atoms) only by using the basic theory with minimal basis sets (i.e., H-F or Hartree-Fock
approximation), whereas calculations on chemical reactions between simple diatomic
molecules can be performed with the state-of-the-art model chemistries. For very large
systems (n-50 atoms or more), an excessive computational time may be avoided with
less sophisticated models, like semi-empirical methods and molecular mechanics (De Paz
and Ciller, 1993). A brief review of the computational theories are given here.
3.3.1. Electron Correlation Methods
The major deficiency of the Hartree-Fock Self-Consistent Field (HF-SCF) method is that
it treats each electron as moving under the influence of the average effect of all other
electrons. A SCF approach to treating electron correlation was described in terms of an
adjustable parameter, ~, in place of the nuclear charge, Z, in the one-electron
wavefunction:
( 1 Jj:213 ¢b = ..[;; ., exp( -~ r) (3.2)
where ~represents the effective nuclear charge interacting with one electron due to the
presence of another and r, the distance from the nucleus to the electron (Shaik and
43
Page 63
Hiberty, 2007). The Hamiltonian that describes this approximation (called the Fock
operator) is given by:
(3.3)
where F is the Fock operator, J (called Coulomb integral) reflects the average interaction
potential of electron i due to all other electrons, K is a second integral (called the
exchange integral) and Z, the nuclear charge. Finding the Hartree-Fock one-electron
wavefunctions is now equivalent to solving the eigenfunction equation:
(3.4)
Within this model, the interaction between solute and solvent is represented by an
interaction potential, Bi, which is treated as a perturbation to the Hamiltonian hi of the
solute molecule in vacuum. The interaction potential and eigenvalues e; are called orbital
energies. Since \j/i is part of B, the solution is obtained iteratively whereby a set of \j/i are
initially guessed, from which Bi is computed. The Fock operator is then used to solve for
a new \j/i, which is used to compute a new Bi. This process is repeated until 'f/i becomes
constant. However, this approach fails to account completely for Coulombic interactions
between electrons causing them to repel each other. In other words motion of the
electrons are said to be correlated, and electron correlation causes electrons to be further
apart than as described by the HF-SCF approach. Electron correlation can be handled in
quantum chemical calculations using Moller-Plesset perturbation theory or density
functional theory.
3.3.1.1. Moller-Plesset Perturbation Theory
Perturbation theory is a well-established method in quantum mechanics for the solution
of the Schriidinger equation, where the Hamiltonian can be represented by the addition of
a small perturbation to one for which solutions are known. Simple examples of
applications of perturbation theory are given in most introductory texts on quantum
chemistry, where it is shown that improvements can be achieved by taking the
44
Page 64
perturbation to successively higher orders. Electron correlation can be treated by a
perturbation approach, since the problem that we are trying to solve is similar to the HF
SCF solution. Moller and Plesset used a perturbation theory method to determine the
correlation energy correction, following an HF-SCF calculation (Bell et a!., 2007). The
perturbation can be truncated at second order (MP2), third order (MP3) or even higher
orders (MP4 and MPS). This procedure is computationally intensive, especially for
higher orders and even for small molecules can require several gigabytes of disk space
for temporary storage of the integrals that are generated. Nevertheless, the effort is
rewarded by results that give a much closer fit to experimental data than the HF-SCF
method.
3.3.1.2. Density Functional Theory
Density functional theory (DFT) provides an alternative approach to electron correlation.
The basis of this theory, developed by Hohenberg and Kohn in 1964, is the proof that the
ground-state electronic energy is determined completely by the electron density, p. The
aim of DFT methods is to design functionals connecting electron density with the energy.
A functional equation is an equation where the unknown is a function itself. Thus
although a wavefunction is a function, an energy depending on a wavefunction or
electron density is a functional. A generalized DFT expression is (Bell et a!., 2007)
Eorr[p ]=Ts[p ]+En,[p ]+ J[p ]+Ex,[p] (3.5)
where Ts is the kinetic energy functional (S denotes that the kinetic energy is obtained
from a Slater determinant), Ene is the electron-nuclear attraction functional, J is the
Coulomb part of the electron-electron repulsion functional, and Exc represents the
exchange correlation functional. The dependence of each of these terms on the electron
density, p, is represented by p in brackets following each term. In practice, it is customary
to use hybrid SCF-DFT methods in which the exchange energy is calculated by the HF
method. A wide variety of hybrid methods are available, the one used most frequently is
B3-LYP, which incorporates Becke's three parameter exchange functional (B3) (Becke,
1993) with the Lee, Yang, and Parr correlation functional (LYP) (Lee et a!., 1988).
45
Page 65
Hybrid DFT -SCF methods, in general, are particularly attractive because they are only
marginally more computationally intensive then HF-SCF, yet provide results that are
comparable with those obtained using the much more demanding MP perturbation
method.
3.3.2. Geometry Optimization
In any quantum chemical calculation the first step requires optimization of the molecular
geometry. Model building may be done using molecular visualization software, such as
the Gaussian graphical interface GaussView, or by the ChemBio3D. Even when
experimental structures are available it is still necessary to optimize the geometry at the
level of theory we are using before attempting calculations of molecular properties (Le
Bris and Defranceschi, 2000). Geometry optimization involves the mathematical
procedure called nonlinear optimization, for which several algorithms have been
developed. The energy and wavefunctions are computed for the initial guess of the
geometry which is then modified iteratively until (i) an energy minimum has been
identified and (ii) forces within the molecule become zero. ChemBio3D uses the
Eigenvector Following (EF) routine as the default geometry optimization routine for
minimization calculations. The EF approach minimise a Rayleigh-Ritz ratio
,1_(y) = y'Hy y'
(3.6)
with respect to the vector y, where superscript t denotes the transpose. Therefore, /..(y)
becomes the smallest eigenvalue of the Hessian H and y becomes the corresponding
eigenvector. The numerical second derivative of the energy is used as an approximation
to /..(y}, with E(Xo) the energy at pointXo in nuclear configuration space and s<l'::l:
E(X0 +9' )+E(X0 -9')-2E(X0 }
,1_(y)"' (9')' (3.7)
Differentiating (Equation 3.7) gives
i:JA VE(X0 +9')-VE(X0 -9') =
8y (9')'
2Ay 2 .
y (3.8)
46
Page 66
In the present EF approach, the eigenvector obtained by minimising the above Rayleigh
Ritz ratio was used as the direction of uphill search, and minimise in the tangent space
using a gradient-based approach. The present calculations allowed a maximum of 10
iterations in the variational calculation of the smallest Hessian eigenvalue and the
corresponding eigenvector. There is no need to converge the eigenvector accurately at the
beginning of a search (convergence only becomes important close to the transition state).
Therefore, since the previous eigenvector is used as the starting point after the first step, a
small number of iterations are most efficient. No tangent space minimizations were
performed until the smallest non-zero eigenvector became negative and converged in two
iterations or Jess. The variational calculation was deemed to be converged when the root
mean-square gradient specified by Equation (3.5) fell below 0.15 eV A-3. The EF step
size along the eigenvector obtained variationally was set to 0.16 A until the
corresponding eigenvalue became negative. Each stationary point optimization was
deemed to be converged when the root -mean-square gradient fell below about
0.001 eV A-1.
This can often be difficult for non rigid molecules, where there may be several energy
minima, and some effort may be required to find the global minimum. Since an optimized
geometry should result in zero forces within the molecule, all principal force constants
should be positive and therefore not result in any imaginary vibrational frequencies. If
there are one or more imaginary frequencies, then the geometry optimization has ended in
a transition state rather than an energy minimum (Schlegel and Yarkony, 1994). The
eigenvectors of the imaginary frequencies will then help to point in the direction of the
structure corresponding to an energy minimum. Finding transition states is, of course, a
necessary part of using quantum chemical methods to model reactions.
3.4. The ab Initio Molecular Orbital Calculation
The quantum mechanical description of chemical bonds is given by a space and time
dependent probability distribution: the molecular wavefunction, '¥mot(!), defined by the
Schriidinger equation (Eq. 3.1). For systems of more than two interacting particles, the
Schriidinger equation cannot be solved exactly. Therefore, all ab initio calculations for
molecules involve some level of approximation and indeed, some level of empirical
47
Page 67
parameterisation. The standard MO treatment for most closed-shell molecules involves a
spin-restricted Hartree-Fock self-consistent field (HF-SCF) calculation. HF-SCF
calculations generally yield accurate molecular structures but are less successful at
predicting molecular energies. The main source of error in HF calculations is neglect of
electron correlation, which results in systematic overestimates of molecular energies.
Different tools of varying complexities have been developed to enhance accuracy (Saeys
et a!., 2002; Zhang et a!., 1999).
Ab initio MO studies require a basis set of mathematical functions to solve the wave
equation. Standard ab initio software packages provide a choice of basis sets that vary
both in size and in their description of the electrons in different orbitals. Quantitative
accuracy improves with the size of basis sets, since larger basis sets contain more
adjustable parameters and thus offer better approximations of the true molecular wave
functions. In general, ab initio MO studies on complex systems should begin with
calculations using small basis sets, to obtain a qualitative assessment of molecular
properties. For general use, the smallest standard basis set is recommended in the
Gaussian 98 is 6-31G(d) package. A number of quantities such as molecular orbital
energies, total energy from electronic and nuclear repulsion, heat of formation, dipole
moment are obtainable from molecular orbital calculations.
In exploring a potential energy surface for a reaction, normally the first step is to
optimize the geometry of the relevant stationary points, i.e. the reactants, transition
structure and products. To confirm a reaction mechanism, it may be necessary to prove
that the particular transition structure found in the optimization connects the desired
reactants and products. This can be done by following the path of steepest descent
downhill from the transition structure toward the reactants and toward the products.
Following the reaction path can also show whether the mechanism involves any
intermediates between reactants and products. Although the path of steepest descent
depends on the coordinate system, a change in the coordinate system does not change the
nature of the stationary points and does not alter the fact that the energy decreases
monotonically along the reaction path from the transition structure toward reactants or
products. Thus any coordinate system can be used to explore the mechanism of a
reaction. One system, the mass-weighted Cartesian coordinates, has special significance
48
Page 68
for reaction dynamics, and the path of steepest descent in this coordinate system is called
the intrinsic reaction coordinate (IRC) (Schlegel, 1994).
It will be pertinent at this point to refer to the reported applications of the
methodology to the study of energetics and kinetics of non-catalytic and catalytic
reactions, both homogeneous and heterogeneous. Saeys et a!. (2005) developed a
Langmuir-Hinshelwood-Hougen-Watson (LHHW) kinetic model for the hydrogenation
of toluene based on the first-principles density functional theory calculations for the
hydrogenation of benzene over Pt catalyst. The LHHW model is able to capture the main
trends in the reaction pathways and rates. Rocha et a!. (2001) has performed a theoretical
study on the homogeneous catalysis of isomerization of p-pinene, a hydroformylation
precursor. The isomerization was investigated at three different levels of theory, HF,
MP2 and MP4(SDQ), using 4 different size of basis set, 6-31 G, 6-31 G( d), 6-31 +G( d) and
6-311++0( d,p) provided in the computational package. It was reported that the use of
different basis set and the inclusion of the electron correlation effects had little influence
on the relative stability of the p-pinene isomers but the effect on the energy barrier for the
process was significant. Another theoretical study on the mechanism of the isomerization
of !-butene catalyzed by Rh-complex has been reported by Luo et a!. (2005). The
quantum mechanical calculations were carried out in the density functional theory
framework to evaluate the potential energy profile and the reaction mechanisms involved.
Rocha (2004) studied the reaction mechanisms involved in the last step of the catalytic
cycle of the hydroformylation of alkene promoted by Pt-Sn catalyst, which is the
hydrogenolysis process. Very recently, Cavallotti et a!. (2007) reported ab initio
computational studies on cyclohexane oxidation leading to kinetic parameters of primary
reactions. These results together with available experimental data were used to formulate
and test a detailed kinetic model.
The quantum approach still assumes a reaction scheme and then ab initio calculates
the potential energy of intermediates and transition states. In this way the outline of a
kinetic model with a sound theoretical basis is built that can be used to predict the
macroscopic parameters of the process and to compare directly with experiment (a kind
of benchmarking). In some cases it may be possible to predict the outcome of new
chemical processes.
49
Page 69
3.5. The Reaction Pathways
The tentative reaction pathways for ab initio computation is shown in Figure 3.1
(computations are confined to the reactions within the box). Qualitative reasoning and
some available experimental observations form the basis of the scheme. According to
van Leeuwen and Claver (2000), hydroformylation reactions are quite sensitive to
experimental conditions such as the concentrations of catalyst, carbon monoxide,
hydrogen, olefin and added ligand. At low Rh concentration, using HRh(PPh3)3CO as the
catalyst precursor without addition of additional PPh3 ligands, substantial dissociation
can occur with the formation of mono-phosphine or phosphine-free catalysts. Therefore,
it is anticipated that at a high CO pressure of 20-40 bar and low PPh3 concentration, the
PPh3 ligand of the catalyst precursor of HRh(PPh3)3CO (species A) can exchange with
carbon monoxide to form B and C (Figure 3.1). The 31P NMR magnetization transfer
experiments described by Brown and Kent (1987) also indicated that PPh3 dissociation
from the RhL2 [L = ligand] complex B could occur at a significantly slower rate than the
corresponding PPh3 dissociation from tris-triphenylphosphine complex, A. In addition,
spectroscopic experiments have revealed that under hydroformylation conditions,
rhodium tri(o-t-butylphenyl)phosphite complex is coordinated by only one phosphite,
HRh[P(OAr)J](CO)J (Jongsma eta!., 1991). van der Veen eta!. (2000) claimed that the
rate of hydroformylation is two orders of magnitude slower than the rate of carbon
monoxide exchange of isomers of type B. The relative concentrations of these
intermediates are controlled by the PPh3 and CO concentrations. Thus, we may conclude
that the initiation of the catalytic cycle by dissociation of CO and PPh3 should not be rate
determining since it has been found to be fast on the time-scale ofhydroformylation.
Wilkinson suggested that species C, formed at a low concentration of PPh3, leads to a
lower selectivity for linear aldehyde (linear: branched = 4: I) compared to
hydroformylation reaction with additional amount of PPh3 (van Leeuwen, 2004). The
overall steric hindrance at the rhodium metal of species B is low because two relatively
small carbonyl ligands are coordinated next to two bulky triphenylphosphine, PPh3.
50
Page 70
R
.. -· -·-· -· -· -· -· -·~ H . H '
Lh, I L l L;,,,_ I ! L ''Rh-CO ~ Rh-CO~
oc ...... I co : L ..... I : co co 2 ; co ; 1
' ' c~,--·- __ "-,t~ __ c_ ___ -·--·-A- __ -·-:
C . R !
H ~ H : R I L,,,,_l ,--,,
OC-Rh-CO ...... Rh~/ 1 s oc I .
L CO '
D
OHC~R~ n-produqt ; 13 ! Hz
R '
~i.' L-Rh-CO
~ iYR ~-Rh-CO
: I ; co I ! G '
~-Rh-CO R s11 CO i 9 1' CO ; I ~ ! ~ R
; co ~ ·v i J c~ k,,, I , L;,, ; ''Rh-CO , '"Rh-CO Qc ...... l ' L ..... l ! CO I co I
' ' ' ' ~ - -·- -·-·-·-·-·-·-·-·---·~·-·- -·-·-·-·-·-·-·-·-·-·j 111~
oc-{,-{-"
co 0
0 12 F 0
M
K
Q
1 14
• CHO R-< iso-product
Figure 3.1: Plausible steps for rhodium catalyzed hydroformylation in the presence of
low concentration of phosphine ligand.
51
Page 71
Table 3.1: Description of the catalytic cycle in Figure 3.1.
Step Description
For PPh3 as the ligand (L), the starting complex is HRh(CO)(PPh3) 3 (complex A),
which in the presence of carbon monoxide forms diphosphine intermediate,
containing the phosphine ligands in equatorial positions ( ee) or one in an apical
position and the other ligand in an equatorial position (ae). Brown and Kent
(1987) found a preference for the "ee" isomer (i.e., complex B). The other possible
isomer (ae) of the complex is not shown.
2 At low Rh concentration, using HRh(CO)(PPh3) 3 as the precursor without addition
of PPh3 ligand, substantial dissociation will occur to form monophosphine
catalyst, complex C (Evans eta!., 1968). fu addition, according to Jongsma eta!.
(1991), complex B may undergo exchange of ligand to form single coordinated
PPh3 ligand, C, at high CO pressure.
3 and 4 Reversible adclition/elimination of either Lor CO from B or C leads to the square
planar intermediate D.
5 Complex D associate with olefin to give complex E which eventually gives rise to
the product aldehyde (n-or iso-) through a number of steps that follow.
6 and 7 Complex E undergo a migratory insertion step to give square planar alkyl
complexes F or G. Complex E can undergo ~-hydride elimination, thus leading to
isomerization especially when higher alkenes are used (step 7). Wilkinson
suggested that formation of species F, lead to higher linear aldehyde selectivity
(n:iso = 20: 1), and that species G, containing only one phosphine, lead to a lower
selectivity for linear aldehyde (n:iso = 4: I) (Evans eta!., 1968).
8 and 9
10 and
II
12
13 and
14
Complex F (and also G) react further with CO to form trigonal bypiramidal
complexes H (and also K).
Complex H (and also K) undergo the second migratory insertion of the alkyl
ligand to form acyl complexes J (and also Q).
Complex J can react further with CO to give the saturated acyl intermediate M,
which have been observed spectroscopically (Jongsma eta!., 1991).
Complexes J (and Q) reacts with H2 to give the aldehyde product and gives back
the unsaturated intermediate D. The reaction with H2 involves presumably
oxidative addition and reductive elimination.
52
Page 72
The rhodium center containing two weak phosphine donors and strongly electron
withdrawing carbonyl ligands is predictably electron deficient. As a result, the carbonyl
ligands are strongly bound and the fast dissociation of phosphine (structure C) and
subsequent olefin addition results in high reaction rates. Hydride migration in a latter step
results in the formation of the linear or branched rhodium alkyl complex, F and G (Figure
3.1). The isomerization reaction is often ignored in developing the rate equation. Under
the reaction condition, the rhodium alkyl complexes F and G can undergo either
migratory insertion forming the rhodium acyl complex or ~-hydride elimination. As for
the primary rhodium alkyl F, the ~-hydride elimination will lead to the initial substrate.
However the secondary rhodium alkyl complex, G can form the !-alkene and a by
product, internal 2-alkenes, by ~-hydride elimination. Since ~-hydride elimination is
faster for the secondary rhodium alkyl than for the primary rhodium alkyl complex, high
isomerization rates will reduce the formation of the branched rhodium acyl to a larger
extent than the linear rhodium acyl. Another possible side reaction is the formation of the
inactive tricarbonyl rhodium species M, from the addition of CO to the unsaturated
rhodium acyl complex, J (Nair eta!., 1999; Musaev eta!., 1995). Further details of the
reaction pathways are given in Table 3.1. It is also to be noticed that species N and P,
which are not included in Figure 3.3 are dihydride acyl species and aldehyde-coordinate
intermediate, respectively. Since, the transition state which involve aldehyde reductive
elimination step was not selected for detailed study in our work, species N and P are not
included in the catalytic cycle in Figure 3.1. However, the X-Y-Z structures of the
species are provided in Appendices A, B and C.
3.6. Computational Methodology
A tentative mechanism of the reaction pathways is a pre-requisite of the ab initio
computation (Matsubara, 1997). The quantum-chemical calculations at the Restricted
Hartree-Fock (RHF) level may then be performed with the GAMESS (General Atomic
Molecular and Electronic Structure System) Pro 11.0 program package and ChemBio3D
11.0 as a frontend graphical user interface (GUI). ChemBio3D 11.0 allows building
molecular species from atoms, and provides a means to generate or convert input files for
the GAMESS program package. All geometries of transition states as well as
53
Page 73
The rhodium center containing two weak phosphine donors and strongly electron
withdrawing carbonyl ligands is predictably electron deficient. As a result, the carbonyl
ligands are strongly bound and the fast dissociation of phosphine (structure C) and
subsequent olefin addition results in high reaction rates. Hydride migration in a latter step
results in the formation of the linear or branched rhodium alkyl complex, F and G (Figure
3.1 ). The isomerization reaction is often ignored in developing the rate equation. Under
the reaction condition, the rhodium alkyl complexes F and G can undergo either
migratory insertion forming the rhodium acyl complex or ~-hydride elimination. As for
the primary rhodium alkyl F, the ~-hydride elimination will lead to the initial substrate.
However the secondary rhodium alkyl complex, G can form the !-alkene and a by
product, internal 2-alkenes, by ~-hydride elimination. Since ~-hydride elimination is
faster for the secondary rhodium alkyl than for the primary rhodium alkyl complex, high
isomerization rates will reduce the formation of the branched rhodium acyl to a larger
extent than the linear rhodium acyl. Another possible side reaction is the formation of the
inactive tricarbonyl rhodium species M, from the addition of CO to the unsaturated
rhodium acyl complex, J (Nair et a!., 1999; Musaev et a!., 1995). Further details of the
reaction pathways are given in Table 3.1. It is also to be noticed that species N and P,
which are not included in Figure 3.3 are dihydride acyl species and aldehyde-coordinate
intermediate, respectively. Since, the transition state which involve aldehyde reductive
elimination step was not selected for detailed study in our work, species N and P are not
included in the catalytic cycle in Figure 3.1. However, the X-Y-Z structures of the
species are provided in Appendices A, B and C.
3.6. Computational Methodology
A tentative mechanism of the reaction pathways is a pre-requisite of the ab initio
computation (Matsubara, 1997). The quantum-chemical calculations at the Restricted
Hartree-Fock (RHF) level may then be performed with the GAMESS (General Atomic
Molecular and Electronic Structure System) Pro 11.0 program package and ChemBio3D
11.0 as a frontend graphical user interface (GUI). ChemBio3D 11.0 allows building
molecular species from atoms, and provides a means to generate or convert input files for
the GAMESS program package. All geometries of transition states as well as
53
Page 74
intermediates were optimized at the restricted Hartree-Fock (RHF)/6-31 G( d,p) level. For
the energetics, the electron correlation calculations were performed with the frozen-core
second-order Moller-Plesset (MP2) perturbation method, using basis sets 6-31++0( d,p)
(Luo et al., 2005). We used two basis sets, basis set I for the RHF geometrical
optimization and basis set II for the MP2 energy calculation and higher level calculations.
The vibrational analysis and internal reaction calculations (IRC) were also performed to
verify the transition states. The path of a chemical reaction can be traced from the
transition state to the product(s) and/or to the reactant(s) using the IRC technique. The
IRC describes the path of steepest descent from the transition state down to the local
energy minimum. The path is computed in small steps simultaneously optimizing all
atomic coordinates orthogonal to it thus constituting a sequence of constrained
optimization subproblems. Vibrational frequencies were also calculated at the RHF/6-
31 G( d,p) level. Calculation of the harmonic vibrational frequencies for the transition state
(TS) species revealed that each contained the single imaginary frequency required to
classify it as a true TS. In all cases, electronic correlation was taken into account at the
second order Moller-Plesset level in the frozen core approximation. A scaling factor of
0.937 was used (Merrick et al., 2007). In addition, zero point energy (ZPE), which a
quantum system possesses at 0 K in contrast to a classical system, was also calculated.
The contribution of the ZPE that arises out of the residual vibration, to the reaction
enthalpy and Gibbs free energy may sometimes be significant. Since ab initio ZPE
calculations yield slightly higher values than actual, a scaling factor of 0. 89 was used
(Pople et al., 1981 ). The contribution of ZPE to the PE was around 5% for most of the
species involved in this study. Possible formation of isomers was taken into account in
potential energy calculations. The equilibrium geometries of each species were first
determined by optimizing the structures by ab initio RHF method using a 6-31 G( d,p)
basis set.
54
Page 75
no
START
~ Input method, basis set, molecular
geometry - initial guess, charge spin and spin multiplicity
Trial wavefunction estimated from semi·empirical calculations ~----,
SCF calculation of energy and improved wavefunstions
(Equation 3.2)
Output: optimized molecular geomtery, energy and wavefunctions
Optimize to transition state (IRC)
pes Output: optimized molecular
geomerty and potential energy at transition state
• END
determine a better guess of the molecular
geometry
no
no
Figure 3.2: Flowchart illustrating the steps involved in quantum chemical calculations of
molecular structures.
55
Page 76
A conformational analysis was carried out on the optimized geometries (ae or ee
geometric isomers) by rotating the torsional angles of the ligands in steps of 30". The
resulting conformers (a maximum of about 10,000) were further optimized by energy
minimization. A conformer was retained if its energy varied by less than 2 kJmor1 from
that of the most stable conformer. Thus, only the most stable conformers with lowest
energy were selected. Figure 3.2 shows a flowchart for the steps involved in geometry
optimization.
Activation energies were calculated for the five transition structures of Rh-catalyzed
hydroformylation of ethylene identified by Matsubara et al. ( 1997) (alkene insertion, H
insertion onto alkene ligand, CO insertion, H2 oxidative addition and aldehyde reductive
elimination). However, only three transition states with the three highest energy barrier
(alkene insertion, CO insertion and Hz oxidative addition) were selected for detailed
study. Structure of PH3 is chosen to mimic the organic phosphorus ligand PPh3 to avoid
excessive computational time without appreciable loss of accuracy (Luo et al., 2005;
Musaev, et al., 1995).
3.6.1. Test Calculation
Coutinho et al. (1997) reported experimental studies on hydroformylation of phosphino
alkenes with hetero-bimetallic complex catalyst, (C0)4M(~-t-PPhz)zRhH(CO)(PPh3),
where M = Cr, Moor W. They isolated a few intermediates in the reaction process and
determined their structural parameters by spectroscopic and X-ray diffraction. Later on,
Tang et al. (2007) reported a computational studies of the reaction steps and
intermediates using Gaussian 03 package and compared some of their computed results
with the experimental structural data of Coutinho et al (1997). Therefore in this work, the
structural parameters (bond length and bond angle) of an 11-acyl intermediate [called
A'/(Mo) in Tang et al., 2007] at MP2/6-31G(d,p) level were computed and compared
with the Tang's computed data and Coutinho's experimental data obtained by X-ray
crystallography. The structure of the 11-acyl intermediate and the comparison of
calculated and experimental values are shown in Figure 3.3 and Table 3.2, respectively.
The above comparison validates the accuracy of the above computed results at RHF
MP2/6-3l(d,p) level.
56
Page 77
~·
fl Figure 3.3: Optimized structure of the the ,u-acyl complex A'(Mo) as an intermediate in
hydroformylation using a hetero-bimetallic complex catalyst.
Table 3.2: Optimized parameters for the .u-acyl complex A'(Mo) at the RHF/6-31 G( d,p)
level (present work), computed results of Tang eta!. (2007) and Coutinho's experimental
data obtained by X-ray crystallography.
Bond length ("A)/ Calculated Calculated Experimental
Bond angle (degree) (Present work) (Tang eta!, 2007) (Coutinho eta!., 1997)
Rh-Mo 2.79 2.85 2.78
Rh-P(2) 2.34 2.40 2.32
Rh-P(3) 2.35 2.41 2.34
Rh-C(ll) 2.05 2.06 2.05
Rh-P(5) 2.34 2.34 2.29
Mo-P(2) 2.49 2.52 2.47
Mo-P(3) 2.47 2.51 2.49
Mo-O 2.28 2.32 2.25
Rh-Mo-P(2) 52.2 52.8 52.1
Rh-Mo-P(3) 52.3 52.8 52.4
Rh-Mo-0 66.0 65.0 66.4
P(2)-Mo-P(3) 104.0 105.3 103.9
P(2)-Mo-O 78.8 78.5 78.7
Rh-Mo-C(ll) 72.0 72.2 71.9
57
Page 78
3. 7. Results and Discussion
3.7.1. Quantum Chemical Calculation
As stated before, quantum chemical calculations are confined to the reactions within the
dashed box in Figure 3 .1. The main reaction mechanism involves eight elementary steps,
three of which pass through transition states (TS): (i) alkene insertion (step D to F), (ii)
formation of acyl complex (step F to J), (iii) Hz oxidative addition (step J to N). These
three reactions will be examined individually, and at the end the overall potential energy
profile will be analyzed.
3.7.1.1. Alkene Insertion:
In this step, alkene ligand inserted into the Rh-H bond to generate an unsaturated Rh
alkyl complex F (or G). The MP2 optimized geometry of the alkene insertion transition
states TSl originating from Hz-alkene adducts El was displayed in Figure 3.5a. In
proceeding from the Hz-alkene adducts to insertion transition states, the alkene ligand
must rotate out of the equatorial plane and shifted upward in order to favor its alkene
group to align with the axial hydride. As seen in Figure 3.5a, the alkene ligand in the
transition states oriented itself intermediary between a perpendicular and parallel
alignment. Simultaneously, the axial hydride bent toward the incoming alkene ligand to
expedite insertion. Alkene insertion transition states TSl(El/Fl) and TSl(E2/F2) were
located at the MP2 level: TSl(El/Fl) originating from the ee Hz-alkene adduct, along
with TS 1 (E2/F2) originating from ea H2-alkene adduct. Vibrational frequency
calculations confirmed that all two species are indeed transition states containing a single
imaginary frequency. In each case animation of the normal mode for the single imaginary
frequency displayed the desired nuclear displacements required for alkene insertion into
the Rh-H bond. For evidence from the structures of the TSl(El/Fl) and TSl(E2/F2)
confirmed by calculation of the IRC, TS 1 (E 1/F 1) generated the trans Rh-alkyl insertion
product (Fl), while TSl(E2/F2) leads to the cis Rh-alkyl insertion product (F2).
58
Page 79
Figure 3.4a: Selected geometrical parameters of optimized structures (A) of the
transition state TS-1 (El/Fl) for the 1-dodecene insertion at RHF level.
3.7.1.2. Formation of Acyl Complex:
Along the reaction coordination, the axial alkyl ligand is bended toward the equatorial
CO ligand before the three-member ringed, trigonal bypirimidal-like transition structure
was formed as shown in Figure 3.4b. This distortion was coupled with a bending of the
oxygen atom of the CO ligand away from the incoming alkyl group in order to decrease
the steric and electronic repulsion. The bond angle Rh-C-0 changes from 178° in Hz to
163° in TS 2(H2/J2) which indicated that the CO ligand also bent slightly to align with
the incoming alkyl ligand. In the TS 2 structures the Rh--C(alkyl) bond was about 0.03
nm longer than its value in species H while the C(alkyl)-C(CO) distance became shorter
by about 0.2 nm. On the other hand, analysis on the bond orders also illustrate that the
Rh-C (alkyl) bond was weakened while C (alkyl)-C(CO) was strengthened in the process
and this conclusion accorded with the change of bond length. Additional, Rh-C (CO
59
Page 80
insertion) bond is shortened by about 0.014 nm along the process from H to TS2, which
demonstrates bond strengthening. However, the length ofRh-C (CO insertion) bond was
elongated by about 0.015 nm from TS2 to insertion product J according to the much more
decrease of bond order along this proceeding. The product of CO insertion had two
isomers, Jl and J2. Obviously, J2 is a more stable isomer by a preferred energy in the
range of6.7 to 7.5 kJ mor1 of II and these were confirmed by IRC calculations.
Figure 3.4b: Optimized Bond lengths (A) of transition state TS-2 (HIIJI) for the CO
insertion at the RHF level (1-octene ).
3.7.1.3. H2 Oxidative Addition:
The third transition state considered in this work was oxidative addition of H2 to the
unsaturated four-coordinated complexes J to give rise to a dihydride acyl species N.
Calculated at the MP2 level, the H2 addition step for all three substrates was predicted to
be endothermic in the range of21.0 to 37.5 kJ mor1. There were two possible attacking
paths, one is when H2 molecular closed to the center metal parallel to P-Rh-C(CO) in J
forming transition state TS3(J1/N1), the other was H2 molecular along with C(CO)-Rh
C(CO) moves up to rhodium to give rise to TS3(J2/N2). TS3(Jl/N1) and TS3(J2/N2)
60
Page 81
gave rise to oxidative addition products Nl and N2, respectively. The three-membered
ring transition states TS3(Jl/Nl) and TS3(J2/N2) consisted of two hydrogen and
rhodium, in which the H-H bond was elongated apparently than in free H2 molecular but
not broken is shown in Figure 3.4c. The bond order of it decreased from 0.78 in free H2
molecular to 0.5 in TS3 that also indicated the H-H bond was sharply weakened.
Calculated at MP2 level of theory, the energy barrier for TS 3(J2/N2) was a little lower
than the other pathway through TS3 (Jl/Nl ), therefore the reaction with H2 attacking
along the C(CO)-Rh-C(CO) was regarded as the better one of the two possible paths.
Calculation using 1-octene, 1-dodecene and styrene as substrate, the energy barrier for
the two paths was in the range of 52.9 to 66.2 kJmol-1• Finally, H-H bond was broken
completely along with the two Rh-H bond formations and six coordinated species Nl
and N2 are formed. Accordingly, the bond order of H-H was close to zero while that of
Rh-H bond increased from about 0.24 to 0.39 in the transition state TS3 .
...--1.606
-H, 1.122
Figure 3.4c: Optimized structures (A) of the transition state TS-3 (Jl/Nl) for the H2
oxidative addition at the RHF level (1-dodecene).
The activation energies for the above three reaction steps of the alkenes were obtained
from the potential energy values calculated by considering higher electron spin number
(triplet). It may be mentioned that use of this higher spin number yielded more consistent
values of the potential energy compared to those obtained by using the spin number 1 in
our initial calculations. The tabulated values (Table 3.3) show that if both the
coordinating groups (L, CO) are in equatorial positions (ee), the activation energy is
generally less than that for the case of one ligand in equatorial and the other in apical ( ea)
61
Page 82
positions. The variations in the activation energies for the transition states of the three
alkenes can be explained in terms of steric hindrance or steric crowding of the alkyl
ligands (van Rooy et al., 1996). Styrene, which has a bulky phenyl group, has the highest
activation energy among the three olefins for all the transition states. The activation
energy of the reactions of 1-dodecene are higher than the corresponding values of 1-
decene and can be explained on the same basis. X-Y-Z structures of the species at
stationary points are provided in Appendices A, B and C.
Table 3.3: Activation energies calculated at MP2level of theory
Substrate Activation energy (kJ mor1)
Olefin insertion Acyl complex formation Hz oxidative addition ee (1) ae (2) ee (1) ae (2) ee (1) ae (2)
1-Decene 39.0 41.4 39.4 40.3 52.9 59.6
1-Dodecene 41.6 42.5 43.5 41.0 57.7 62.3
Styrene 56.4 57.4 48.3 46.8 63.2 66.2
3.7.1.4. The Potential Energy Profile:
The potential energy profile of the hydroformylation of 1-decene, 1-dodecene and styrene
are presented in Figures 3.5a, b and c, respectively. The reaction coordinate represents
the progress along the reaction pathway. The active catalyst which mediates the catalytic
cycle, is considered to be HRh(CO)z(PPh3) [Bin Figure 3.1]. The transition state of the
insertion of alkene into Rh-complex (TS-1 ), formation of acyl complex (TS-2) and
oxidative addition of Hz (TS-3) were optimized by the ab initio MO method to determine
the potential energy surface of the intermediates. The Hz oxidative addition (TS- 3) were
found to be endothermic and the alkene insertion (TS- 1) and CO insertion reaction (TS-
2), are exothermic. Similar results were reported for the hydroformylation of ethene by
Musaev, et al. (1995). The largest barrier is the Hz oxidative addition step, in agreement
with the experimental proposal that the Hz oxidative addition is rate determining.
62
Page 83
60
40
20
~
-~ s 0 g BI+CO+ ki 1-decene
-20 +H,
-40
TS I (E2!F2) +48.1
EI/FI +44.5
F2
Fl -40.3
TS 2 (H2/J2) +16.2
Jl -42.
Reaction coordinate
TS 3 (JI/NJ) +10.3
-22.2 Dl+ aldehyde
Figure 3.5a: The potential energy profile of 1-decene hydroformylation reaction
60
40
20 82 -~ +5.9 ·-o s 0 ~ Bl +CO ~
ki + 1-dodecene
+H, -20
-40
TS I (El/F2) +49.1
El/FI +47.5
F1 -39.2
H2 -21.3
TS 2 (H2/J2) +22.2
Hl/JI +16.5
J1
Reaction coordinate
TS 3 (JI/NI) +16.2
PI -21.0
Figure 3.5b: The potential energy profile of 1-dodecene hydroformylation reaction
63
Dl+ aldehyde -31.8
Page 84
80
60
40
20 ..,~
0 s 0 ~ ~
~-20
-40
-60
-80
82 E2 +4.7
+3.1
81 +CO +2.1
+styrene
+H,
1S 1 (E2/F2) -1{;2.1
F1 -49.0
1S 2 (H2/J2) +15.2
Hl/J +9.5
J1 -55.0
Reaction coordinate
1S 3 (J1/N1) +10.3
Figure 3.5c: The potential energy profile of styrene hydroformylation reaction
3.7.2. Development of the Mechanistic Rate Equation
D1+ aldehyde -47.6
Mechanistic rate equations for higher olefins were developed based on the reaction
pathways depicted in Figure 3.1 using the conventional pre-equilibrium and quasi-steady
state approximations. Three rate equations (M1, M2 and M3) have been developed
corresponding to the three transition states identified by quantum chemical calculations.
The following reaction steps are considered.
kt, -1
B +CO '<"' C kz, -2
C..:D+CO
Bk'',J D k,, -4
D + RCHCH2 '<"' F + CO ks, -5
D + RCHCH2 '<"' G k,;, -6
F +CO '<"' J
64
(3.9)
(3.10)
(3.11)
(3.12)
(3.13)
(3.14)
Page 85
k, J +Hz -> RCHzCHzCHO + D
J +COks#s M
(3.15)
(3.16)
The Equations (3.9) to (3.16) and the simplifying assumptions were used to derive
relationships between the rate of reaction and experimental parameters (i.e.
concentrations of olefin, catalyst, dissolved CO, as well as H2).
If the Hz oxidative addition is rate-controlling, the rate of reaction is given by
(where k is the rate constant) (3.17)
Considering the conservation ofthe catalytic species, the overall balance at steady state is
described by
[catalyst]= [B ]+ [c ]+ [D ]+ [F ]+[a]+ [J]+ [M] (3.18)
where [catalyst] is the concentration of catalyst loaded. The concentration ofB, C, D, F,
G and M are expressed in terms of J,
[B]- J - KlK2K4K6[alkene]
[J][co] [c] K2K4K6[alken~
[a]= KS[Jj K4K6
[D)= [J] K4K6[alkene]
(3 .19)
(3.20)
(3.21)
(3.22)
65
Page 86
[F]- [J] - K6[co] (3.23)
[M] = KB[J][CO] (3.24)
and hence [catalyst],
[catalyst] [1](1 + Ki [cO]+ Kz[co]
2 + K3[alkene]+ K:[co}alkene]+ K5[coJa!kenel)
*[ I J (3.25) K Leo alkene
Equation (3 .25) is rearranged to obtain the expression for [ J] and in tum substituted in
Equation (3 .17) to give the rate model (M I) of the following form:
k[catalyst ][co ][alkene ][H2 ]
Rate = I+ Kt [co]+ K; [co ]2 + K; [alkene]+ K; [co ][alkene]+ K; [co )2 [alkene] (3
·26
)
where k is the reaction rate constant of the rate determining step and Kt - K; are constants
derived from the equilibrium constants of the reactions 3.9-3.16. This model is similar to
the empirical model proposed by Bhanage et al. (1997), van Rooy et al. (1995), Divekar
et al. (1993) and Deshpande and Chaudhari (1988).
The second kinetic model (M2) was proposed considering the migration insertion of
the alkene into R-H, as a rate limiting step (Eq. (3.12)). Therefore, the rate law is given
by
Rate = k4 [D ][olefin ] (3.27)
Following the derivation outlined previously, the corresponding rate equation is
Rate= k[catalystJcoJalkene]
I+ Kt[cO]+ K;[co]2
+ K;[alkene]+ K;[coJalkene] (3.28)
66
Page 87
Similarly, considering the formation of the acyl complex is rate-controlling (Eq. 3.14).
The rate law is given by
Rate = k6 [F ][co] (3.29)
and the final form of the rate equation is
Rate= k[catalyst!co!alkenelH2 ]
1+ Kt[co]+ K;[co]2 + K;[a!kene]+ K;[coJalkene]+K;[H2 ] (3.30)
Models Ml, M2 and M3 are called 'generalized models' corresponding to the three rate
determining steps indicated by the quantum calculations and are independent of any
particular olefin. The proposed rate equation (Ml) is also consistent with the
experimental observations, indicating a first-order dependence on [H2] and [catalyst], first
order in CO at low pressure and negative order at high pressures and fractional order in
olefin concentration. The negative order with respect to CO concentration at high
pressure may be explained by the accumulation of species M, which are outside of the
cycle under these conditions and therefore should inhibit the rate of the reaction (Rosales
eta!., 2007a).
3. 7.3 Determination of the Rate Parameters
Experimental hydroformylation rate data extracted from the published literature were
used to evaluate the kinetic and equilibrium constants (k and K's) of each of the three 1-
alkenes. The data sources and the ranges of the process parameters (pressure,
concentration, temperature) are listed in Table 3.4. The kinetic data used in the kinetic
modeling is shown in Appendix D. The HRh(CO)(PPh3)3 catalyst in an organic solvent
was used for the alkene substrates except for 1-octene for which HRh(CO)[P(p
CF3C6Ic4)Jh was used as catalyst in supercritical carbon dioxide (scCOz) solvent. Since
no side reactions were reported by the researchers under the stated experimental
conditions, the rate data represented the overall hydroformylation of an alkene to the
corresponding aldehyde (Nair et al, (1999); Bhanage eta!. (1997); Divekar eta!. (1993)).
67
Page 88
Table 3.4: Range of experimental conditions used for development of the mechanistic
rate equation
Experimental conditions Bhanage et al. Divekar et al. Palo and Erkey Nair et al. (1997) (1993) (1999) (1999)
Substrate olefm 1-Dodecene (C12) 1-Decene (C10) 1-0ctene ( c,) Styrene (C6)
Cone. of catalyst (mol/m3) 1.0-8.0 0-1.0 0.63-2.54 0.131-1.01
Initial cone. of !-alkene 0.18-2.2 0-1.0 0-1.0 0.92-6.89 (kmol/m3
)
Pm (MPa) 0.68-1.7 0-1.38 5-13.8 1.03-4.12 Pea (MPa) 0.17-2.04 0-8.11 5-13.8 0.3-4.12 T('C) 50-70 50-70 50 60-80 Reaction volume (mL) 25 not available not available 25
Solvent toluene benzene scco, toluene
Non-linear least square regression based on the criterion of minimization of the mean
residual sum of squares (MRSS) was performed to determine the kinetic parameters using
the Solver in Microsoft Excel2007.
N
L (Reale - R expt Y MRSS = ..!:;-"'1------ (3.31)
where Nexpt is the number of experimental data, Npannn is number of model
parameters, Reale and Roxpt represent calculated and experimental rates, respectively.
Experimental rate data are available at different temperatures, partial pressures of CO and
H2 as well as concentrations of the olefin and of the catalyst (Table 3.4). The kinetic and
equilibrium constant values can be estimated by optimizing the objective function given
by the Equation (3.31) on a set of constant temperature rate data. Alternatively, a global
error minimization can be done by considering all the available rate data at different
temperatures and process conditions for a particular olefin. The second method is
recognized as a robust technique that avoids the possible pitfalls of ending the
optimization process at a local minimum. 'Temperature centering' is a tested strategy of
estimating temperature-dependent parameters by global optimization over the entire
temperature range (Pant and Kunzru, 1997; Wojciechowski and Rice, 2003; Patel and
68
Page 89
Pant, 2007). In this technique the activation energy of the rate-controlling reaction step
and the pre-exponential factor were obtained from the Arrhenius equation with
'temperature centering'.
[-E(1 1)] k, = A1 exp -jf- T - Tm (3.32)
Here Tm is introduced for temperature centering. It is usually chosen at the middle of the
temperature range (it is Tm = 333 K in this study). An 'equilibrium constant', K, was
similarly determined as a function of temperature using the van't Hoff equation also with
temperature centering.
, [t:.S Mf [I I )] K, = exp -:--Jt T- Tm (3.33)
Suitable initial guess values are required for application of non-linear regression for
parameter estimation using Equation (3.31) which, otherwise, may converge to local
minima (Wojciechowski and Rice, 2003; Routray and Deo, 2005). In order to arrive at a
suitable set initial guess values for global optimization over the entire experimental
temperature range, isothermal rate data at individual temperatures were first fitted and the
Arrhenius plots were done to make a judgment about the initial guess and the suitability
of a model. The Arrhenius parameters from these plots were then used as the starting
values for an "all up" fit of rate expression. A summary of the computational procedure
is given in Figure 3.6.
The error estimate gtven by Equation (3 .31) together with thermodynamic
consistency of the calculated activation energy or negative kinetic parameter, if any, were
used as the criteria of discrimination among the three macroscopic rate models (Patel and
Pant, 2007; Hurtado et a!., 2004; Pengpanich et a!., 2002). Model M2 was rejected
because of a high average standard error estimate ranging from 7% to 26% as shown in
Appendix E. Model M3 displayed a non-linear Arrhenius plot besides a large error
estimate (7% to 56%), therefore it was also rejected.
69
Page 90
START
t Input isothermal kinetic data (reaction rate vs. concentration of olefin, catalyst, partial pressure of H2 and CO) and proposed kinetic models (Eq. 3.36, 3.28 and 3.30)
Set initial guess, i for all parameters J..---~
Using nonlinear regression, minimize MRSS (Eq. 3.31) subject
to the constraint; k;o,O and K;o,O
Output: optimized rate parameters and activation energy
END
Set new initial value i(new) = i(old) +I
no
no
no
Figure 3.6: Flowchart illustrating the steps involved in kinetic modeling
70
Page 91
Table 3.5: Estimated Ml kinetic model parameters with 95% confidence limits.
Substrate T k K' K; K' K; (K)
1 3
1-dodecene 323 3.Ixi04 1.24x 10³ 2.5x10³ 18.0 I.5xi04
*3.4x104
c" 333 6.0x10⁴ 500 1.5x10⁵ 5.0 1.1x103
*5.8x104
343 10.0xi04 202 0.5x10⁵ 2.2 9.4x103
*9.9x104
1-decene 323 3.9xl04 99.7 2.5x10⁵ 19.9 63.4 *1.1x1013
Cto 333 6.5x10⁴ 161 ].3x105 24.5 80.0 *1.4xi013
343 l.lx105 447 8.0x 10⁴ 33.5 93.0 *2.8x1013
styrene 333 4.7x10⁴ 13.7 3.9x10⁴ 5.2 3.0x104
*1.6 c, 343 9.8x10⁴ 9.0 9.0x10² 11.4 3.5x 104
*3.1 353 21.3x10⁴ 5.0 3.0x10² 13.0 3.7x104
*6.6 1-octene 323 2.2xi05 2.0x10³ 3.0x10⁵ 18.0 I.5x104
c, *0.10
(kmol, m3, s units)
*Activation energy and rate constant value reported in open literature: 'Bhanage et al. (1997) "Divekar et al. (1993) 'Nair et al.(l999)
K' 5 SEE
9.0xi03 11.5
4.0xi05
3.0x10⁵
l.05x 105 13.0
l.IOxi05
1.40x 10⁵
2.59x10⁵ 2.0
2.65x10⁵
2.95xl05
8.0x10⁵ 4.0
Ea (kJ.mo1"1
)
69.7
*57.1'
46.2
*49.2b
63.0
*68.8'
The rate model Ml is able to describe tbe experimental data reasonably well over the
whole range of pressure, olefin concentration and temperature. The estimated parameters
as well as tbe activation energy and error estimates are presented in Table 3.5. These
results suggest that a mechanism of reaction featuring oxidative addition of H2 to
acylrhodium intermediate species as rate determining is appropriate for describing the
hydroformylation of all the substrates. Rates ofhydroformylation of the olefins have been
calculated for different concentrations and temperature using the generalized rate
equation and estimated parameters. Comparisons of these calculated values with
experimental data reported in the literature as well as the predictions of the reported
empirical models shown in Figures 3.7, 3.8 and 3.9 appear to be satisfactory.
71
Page 92
1.4
1.2
~ .. , ~:.s
1 0.8
0 0.6 ~
~
! 0.4
0.2
0
0
t. 1-oetene • 1-deeene 4 1-dodeeene -Modeled (Eq. 3 .26) ----Modeled (Literature)
••
•.•••• -4
0.5 I 1.5 2 2.5 3 Cone. of 1-alkenes (kmolm-3
)
Figure 3.7: Experimental and predicted initial reaction rates vs. concentration of olefin,
at temperature of 323 K. *References to experimental data: 1-octene, Palo and Erkey
(1999); 1-decene, Divekar eta!. (1993); 1-dodecene, Bhanage eta!. (1997).
2 ---Modeled (Literature)
1.8 Modeled (Eq. 3 .26) • 4 1-dodeeene
1.6 • 1-deeene .,~ 1.4 + styrene
"' "s 1.2 ~ c
.0 ~
3j 0.8 of ~
"' 0.6 p::
0.4
0.2
0
0 0.5 I 1.5 2 2.5 3 3.5
Cone. ofl-alkenes (kmolm-3)
Figure 3.8: Experimental and predicted initial reaction rates vs. concentration of olefin,
at temperature of 333 K. *References to experimental data: styrene, Nair et al.(1999); 1-
decene, Divekar eta!. (1993); 1-dodecene, Bhanage et a!. (1997).
72
Page 93
3r---------------------------.
0 2
J. 1-dodecene • 1-decene + styrene -Modeled (Eq. 3.26) ----Modeled (Literature)
3 4 5
Cone. of !-alkene (kmolm.3)
6
Figure 3.9: Experimental and predicted initial reaction rates vs. concentration of olefin,
at temperature of343 K. *References to experimental data: styrene, Nair et al. (1999); 1-
decene, Divekar et al. (1993); 1-dodecene, Bhanage et al. (1997).
Since the concentration history of 1-dodecene during hydroformylation reaction IS
reported by Bhanage et al. (1997), we could check the capability of the generalized model
M1 to predict the concentration transient. The derivation of the rate equation that links
concentrations of reactants with time is presented in Appendix F. The results presented
in Figure 3.10 for three different temperatures further establish the accuracy of the
proposed model. As a final check, we plotted the calculated and experimental rate data
of all the olefins at different process conditions in the form of a parity diagram shown in
Figure 3.11. The average prediction error is 7.6% while the maximum error is 13.0%.
73
Page 94
100
90 <> 1-dodecene
' • COorH2
~ 80 lo -Modeled (Eq. 3.26
~8 ' ' 0 70 ' • ~ ' ' ~0 60 ' - ' ~ ' u 50 ' c ' u
u v ' 'C 40 0 .... 'C .... .... .... 0 .... d 30 .... c 'o-0 u 20
10
0
0 100 200 300 400
time(min)
Figure 3.10: Experimental and predicted concentration of 1-dodecene and CO or H2 as a
function of contact time at temperature of 323, 333 and 343 K. References to
experimental data: Bhanage et al.(1997).
5 ~~-s~cyT_e_n_e'(N~arr~et~a'l.~l~9~99")----------~
+ 1-dodecene (Bhanage et al. 1997) 0 1-decene (Divekar et al. 1993) :;--
'oo 4 • 1-octene (Palo and Erkey 1998)
"s ~ c 3 b ';;!
"' ~f 2 ~
0
0 2 3 4
Experimental rate, Rx104 (kmol m·3 s 1)
5
Figure 3.11: Parity plots of the model predictions of the rate of hydroformylation of
styrene, 1-octene, 1-decene and 1-dodecene in homogeneous system.
74
Page 95
The rate parameter values were determined at 95% confidence interval. Since the
confidence interval is narrow, the sample mean may be considered to be reasonably
accurate estimates of the population mean values. In addition, the values of rate
parameters in the denominator of the kinetic rate expression versus temperature (ln K vs
1/1) yielded good correlation (R2) ranging from 0.97 to 0.99. The parameters K,' in the
denominator of Equation (3 .26) relate to the equilibrium constants of elementary steps in
the reaction mechanism. The magnitudes of the parameters, that vary over a wide range,
are representative of the importance of the different steps of the overall reaction. For
instance, the large value of K; implies that the rate of dissociation and association of
ligand, step 2 and 4 are high. However, the value of I<; suggests that step 3 occurs at 3
orders of magnitude slower compared to step 4. On the other hand, difference of two
orders of magnitude lower in the rate constant of the alkene insertion step (step 5 and 6)
with respect to step 2 was also observed and reported in open literature (van Leeuwen et
al., 2000). From the regressed value of~' the rate of the carbonyl insertion step (step 8)
was found to be greater by one order of magnitude compared to the alkene insertion step.
The rate constant, k, is close to the value reported by Bhanage et al ( 1997).
Furthermore, comparing the regressed values of the rate constant, kat 333 K, the values
ofk increase in the order of styrene (4.7xlO'), 1-dodecene (6.0 x 10⁴) and 1-decene (6.5
x 1 04) which are also supported by our calculated activation energies for Hz oxidative
addition. On the other hand the rate constant ofhydroformylation of 1-octene (2.2xl05 at
323 K) in scC02 is found to be greatest due to the rate enhancing effect of C02 (Koeken
et al., 2006).
A negative order with respect to Pco has been observed experimentally, and therefore
the concentration term of CO is expected to appear raised to a higher power in the
denominator than in the numerator (Helfferich, 2001). The regressed values of K; andK;
for all four substrates are relatively large and suggest that the effect of the Pco inhibition
on the rate of reaction is highly significant. The values of Kt' and K; are larger for 1-
dodecene, than for 1-decene, which in turn is larger than styrene. As P co increases the
denominator increases significantly compared to the numerator leading to a rapid decline
75
Page 96
in the reaction rate. It is also to be noticed that at high concentration of alkene and low
PPh3 or CO concentrations leads to zero order in alkene, which has been observed
experimentally for the high alkene/low PPh3 case. According to Helfferich (200 I), the
rate equation giving an order between zero and plus one contains the respective
concentration ([alkene]) as a factor in the numerator and in some but not all terms of the
denominator, as it is seen in model M1, M2 and M3 [Eq.( 3.23), (3.25) and (3.27)].
The values of the rate constant for 1-dodecene, was found to be 2.5 times higher, than
that of styrene, which confirms the good intrinsic reactivity of 1-dodecene in spite of its
large molecular size. van Rooy et a!. (1995) also reported similar results whereby, the
hydroformylation of styrene using Rh(C0)2(acac) as the catalyst precursor and tris(2-tert
butyl-4-methylphenyl) phosphite as the ligand (T=40-100°C, Pco=2.5-44 bar, PH2 = 2.5-
50 bar, toluene as a solvent), the rate is three times lower than that of 1-octene. For the
hydroformylation of 1-dodecene, the activation energy of 57.7 kJ·mol·1 (ee species) was
obtained for the rate determining step, which is close to that reported by Bhanage et a!.
(1997), 57.1 kJ·mol"1. The average deviation of predictions is 11.5 %. As for 1-decene, an
activation energy of 52.9 kJ·mo1"1 (ee species) was obtained, which is higher than that
obtained from the empirical kinetic model (49.2 kJ-mol"1) reported by Divekar et a!
(1993). The average deviation of prediction is 13.0 %. However the rate equation predicts
the rate of hydroformylation of styrene in toluene and 1-octene in scCOz with high
accuracy. An activation energy of 63.2 kJ·mol"1 (ee species) was obtained, which is
lower than that obtained from the mechanistic model, (68.8 kJ·mol"1) reported by Nair et
a!. (1999). The mechanistic equation reported by Nair eta!. (1999) was derived from the
catalytic cycle described by Evans et a!. (1968) and the error between the predicted and
experimental rate data was within ±5 %. On the other hand, the predictions of the rate
data by using model M1 were found to be within a maximum error of ± 2.4 %. The
relatively small error compared to 1-dodecene and 1-decene is probably due to the
presence of the aromatic ring and shorter alkyl chain of styrene. The compact molecular
structure of styrene has reduced the occurrence of the isomerization reaction compared to
the long carbon chain of 1-dodecene and 1-decene. As for the rate of hydroformylation of
1-octene in scC02, the average deviation in the predicted and observed rates was found to
be in the range of± 4 %. This result also demonstrates that model M1 is able to predict
76
Page 97
the rate of hydroformylation of higher alkenes in both organic solvent and scC02
although several major differences exist between the conventional organic solvent-based
system and the scCOz system. According to Palo and Erkey (1999), the major differences
are the higher concentration of Hz and CO in the scCOz compared to those in organic
solvent, higher total pressure of the scC02 system and significantly different fluid
densities (p of scCOz = 0.2-0.9 g·cm·3 ) from those of organic systems (p ~ 0.7 g·cm·\
Besides the rate-determining step of TS-3 which is corroborated by experimental rate
data for all the four higher alkenes, further match between the quantum chemical
calculation results and the experimental data is evident from the magnitudes of the
activation energies. The calculated (range of 52.9-59.6, 57.7-62.3 and 63.2-66.2
kJ.mor1) and experimental (49.2±6, 57.1±8 and 68.8±5 kJ-mor1
) relative energy of the
third transition structure (TS 3) or the activation energy for the hydroformylation of 1-
decene, 1-dodecene and styrene, respectively are in reasonable agreement (Nair et a!.,
1999; Bhanage et al, 1997; Divekar, eta!., 1993). However, the ab initio computational
approach overestimate the activation energy for the hydroformylation of 1-dodecene and
1-decene although the activation energy values are close to the actual values obtained
experimentally. The activation barrier relative to HRh(CO)(PPh3)3 catalyst is larger for
styrene, than for 1-dodecene, which in tum is larger than 1-decene. This suggests that the
observed reactivity seems to be influenced by the increased steric hindrance of the alkyl
group ofthe alkene substrate.
77
Page 98
CHAPTER4
MATERIAL AND METHOD
This chapter covers the details of the various experiments conducted as part of this
work. The first section describes all the chemicals and gases used. Section 4.2 discusses
the development of the TMS-system by performing the gas solubilities experiments. In
Section 4.3 the reactor set-up and experimental procedure to study the effect of process
parameters on the yield and selectivity of the linear aldehydes as well as the rate of
reaction are described. The liquid-liquid equilibrium and solute distribution experiments
are discusses in Section 4.4. Finally the analytical techniques are outlined in Section 4.5.
4.1. Materials
The following chemicals (supplier, purity) were used as received without further
purification: propylene carbonate (Acros, 99.5%), dodecane (Acros, 98.0%), I ,4-dioxane
(Fischer Scientific, 99.5%), 1-octene (Acros, 98.0%), 1-dodecene (Acros, 98.0%),
nonanal (Acros, 98.5%), tridecanal (Acros, 98.0%) and triphenylphosphite (Acros,
99.0%). Gas chromatograph (GC) analysis did not detect any appreciable peaks of
impurities. The catalyst, HRh(CO)(PPh3)3 was purchased from ABCR, Germany, with
purity of 98.0 %. Gas chromatographic analysis did not indicate any notable peaks of
impurities. Hydrogen, carbon monoxide, nitrogen and syngas (I: I, I :2, I :3, 2: I, 3: I
CO/H2) were supplied by Malaysian Oxygen (MOX), with purity of99.99 %.
Densities of the solvents used in solubility study were measured with Mettler Toledo
densimeter (model Densito 30P) and are given in Table 4.1, along with the literature
values (Lide, 2005). The densimeter measures the density of solvent by the oscillating
body method. After loading in the cell, the liquid was allowed to equilibrate until a steady
reading was obtained in about I minute to a resolution of 0.0001 g cm-3. The densimeter
was calibrated against distilled water.
78
Page 99
Table 4.1: Physical properties of the pure components at T=298.15 K and P=101.325
kPa.
Compound
Propylene carbonate Dodecane 1,4-Dioxane
4.2. Development of the TMS-System
Expt. Lide (2005)
1.2000 1.200 0.7510 0.751 1.0311 1.034
Solubilities of Hz and CO in pure solvent and solvent mixtures relevant to the
hydroformylation process are studied in this work, particularly in the temperature
dependent multi-component solvent (TMS)-systems involving propylene carbonate,
dodecane and 1 ,4-dioxane. These solvents are preferred because of high boiling point,
thermal stability, and inert nature with respect to the homogeneous catalyst, olefin,
hydrogen, carbon monoxide and the hydroformylation products (Tijani and Ali, 2006;
Behr et a!., 2005; Behr and Miao, 2004). However, neither experimental data nor any
theoretical model on solubilities for CO and Hz in the TMS-system are available in the
literature. In the above context, the objectives ofthis work are to:
1. experimentally determine solubilities of CO and Hz in different types of solvent
systems which include single phase propylene carbonate (PC), biphasic mixture of
PC+ dodecane, and TMS-system of PC+dodecane+l ,4-dioxane at temperature range
of298-343 K,
n. determine the Henry's law constant for solubility by data fitting, and
iii. predict the gas solubilities by thermodynamic modeling using the regular solution
theory (RST)-based model and the modified UNIF AC model and compare with the
experimental data.
4.2.1. Composition of the TMS- Systems
The appropriate compositions of the TMS-system (PC+dodecane+1,4-dioxane) for the
solubility study at different temperatures were determined by the cloud point method in
an equilibrium glass cell. All mixtures were prepared by weighing with a Mettler balance
79
Page 100
accurate to within ±104 g. A mixture of PC and dodecane (1.0 g; 5:1, 3:1, 1:1, 1:3, 1:5
wt. ratio) was transferred into a 5 mL centrifuge tube and immersed in a silicone oil bath
that was controlled within 1 K, under a stirring speed of 900 rpm. After having reached
the desired temperature (298 K, 353 K and 373 K), a heterogeneous mixture of PC and
dodecane was titrated with 1,4-dioxane until a homogeneous phase is formed. The
transition from a heterogeneous mixture to a clear liquid phase was determined visually.
The reliability of the method depends on the precision of the micro burette which had an
accuracy of ±0.005 cm3, and is limited by the visual inspection of the transition across the
apparatus. The accuracy of the visual inspection of the transition is achieved by waiting
approximately 5 minutes at the transition point and observing the heterogeneity. All
visual experiments were repeated at least three times in order to ensure reproducibility.
4.2.2. Determination ofthe Gas Solubility
The solubilities of pure H2 and CO in PC, biphasic mixture of PC+dodecane and TMS
systems of PC+dodecene+l,4-dioxane were measured by the absorption method as a
function of the gas pressure (1-15 bar) and temperature (298-343 K) in a 300 mL capacity
high pressure gas solubility cell (SOLTEQ model BP 22). As shown in Figure 4.1, the
equipment consists of a gas mixing vessel and an equilibrium cell, each immersed in a
heating jacket. A PTFE coated magnetic stir-bar placed within the cell in conjunction
with an external magnet is used to stir the liquid phase inside the cell. Other supporting
components include the vacuum pump, thermostat heating bath, liquid feed pump, and
instrumentations such as mass flow controllers, pressure and temperature indicators. High
accuracy pressure sensors and platinum RTD sensors are used for high accuracy pressure
and temperature measurements. Figure 4.2 shows the photograph of the high pressure
solubility unit.
80
Page 101
~o:nt H2 ~
'"~~~ _() P2 kJ_vent
FIC-1 Y 1 1:>. P1 (5) V9
co ~ kJ V3L_j'V (1- ~ N2 1::- vJ V10 FIC-3
FIC-2 V2 V5 I l~uidfeed ~
V6 Vll
V12
<f) p (2) I (2) CD(1) (1
liquid drain
(4)
(3)
Figure 4.1: Schematic of the high pressure solubility cell unit: 1- thermocouple; 2-
pressure transducer; 3- mixing vessel;4- equilibrium cell; 5- pressure relief valve
Figure 4.2: High pressure solubility cell unit
81
Page 102
4.2.2.1. Pressure Test
After closing all valves, the gas solubility cell was tested for leakage by using SNOOP
liquid leak detector (SNOOP, Swagelok). The unit was pressurized with N2 by opening
valves V5, V6 and VlO until the pressure reading reads 6.0 MPa. When visible bubbles
were observed, the equipment was de-pressurised before the lose connection was
tightened to stop the gas leakage. When the pressure stabilized within 15 minutes, the
pressure release valve was set at 3.0 MPa.
4.2.2.2. Purging and Evacuation
The unit was purged with Nz gas and fully evacuated before carrying out each solubility
experiment. Purging was carried out before evacuation to avoid residue gas or liquid from
passing through the vacuum pump during evacuation. Both the mixing vessel and the
equilibrium cell were purged by allowing Nz gas to flow through the unit for
approximately 10 minutes by setting the flow rate at FIC-3 to 8 NL/min. Opening valves
V5, V7 and V8, the mixing vessel and an equilibrium cell were then evacuated using a
turbomolecular vacuum pump (Model DCU-200, Pfeiffer Vacuum). A pressure
transducer (Model DPI 150, Druck) having a precision of ±lx104 bar was used to
measure the pressure in the gas reservoir and in the equilibrium cell.
4.2.2.3. Solubility Experiment
After achieving the specified level of vacuum, which is approximately 1 x 10⁻³ mbar, the
temperature of the heating bath was set at a desired value and the bath circulation was
allowed to start. The temperature of the liquid in the mixing cell and equilibrium cell
were controlled within ±0.01 K and the temperature is measured by a digital
thermometers (Model 7563, Yokogawa). Using the maximum flow rate, the gas was
charged into the mixing vessel by opening the valves at the mass flow controller.
Immediately the air drive supply was turned on to the gas booster Pl. The gas booster is
air driven, and therefore the air pressure was regulated to control the boosting speed.
Once the pressure of the mixing vessel has reached the desired pressure, the air drive
supply to the gas booster was turned off and valve V4 was switched towards the bypass
line. After thermal equilibrium was attained, the pressurized gas in the mixing vessel was
82
Page 103
charged into the equilibrium cell up to the desired pressure by slowly opening valve V6.
When the pressure and temperature of the mixing vessel and equilibrium cell are
equalized, the solvent (200 mL) was then quickly introduced into the cell using a liquid
feed pump, P3. The contents were stirred at 1000 rpm for about 1 hr to equilibrate the
liquid phase with the gas. A few preliminary experiments showed that this time was
sufficient for equilibriation. The total pressure change due to absorption was recorded on
line as a function of time till it attained a steady and constant value, indicating saturation
of the liquid phase.
From the initial and final pressure readings, the solubility was calculated in mole
fraction as:
(4.1)
where Xg represents the mole fraction of the solute gas in the liquid phase, P; and Pt are
the initial and final pressure readings in the equilibrium cell; p" is the vapour pressure of
the solvent; Vg and VL are the volumes of the gas and liquid phases, respectively; R is the
gas constant; Tis the absolute temperature; and PL is the molar density of the liquid. The
volume of the gas in the cell above the liquid is calculated by subtracting the measured
volume of the liquid from the total volume of the cell. Within the temperature range of
this study, propylene carbonate and dodecane have negligible vapour pressure. The
vapour pressure of pure 1 ,4-dioxane was calculated with the Antoine equation
log (P/kPa) =A - B/( C + TI"C) (4.2)
where Pis the vapor pressure (kPa), T, the temperature ("C) and A, B and Care constants,
which are 6.5564, 1554.679 and 240.337, respectively (Romero eta!., 2005). In order to
ensure the applicability of the ideal gas law in Equation 4.1, the H2 and CO fugacity
coefficients, were calculated using the Peng-Robinson equation of state (PR Ei:>S)
ln¢1 = _b; (Z -1)-ln(Z -B)--A--,= 1
bm 2BJ2
83
Page 104
(4.3)
where Z is the compressibility factor and can be written as following:
Z3 -(1-B)Z2 +(A-3Ji2 -2/J)Z-(AB-Jil -If) =0 (4.4)
where Z is commonly defined as Z = (PV!RT)
To calculate fugacity coefficient, ¢/using Equation (4.3) or the compressibility
factor, Z using Equation (4.4), pure component parameters a; and b; were found from
Equations (4.5) to (4.9), using critical properties in Table 4.2 where M is the molecular
weight (g mor\ T,, the critical temperature, P,, the critical pressure and w, the acentric
factor.
a; (T) = a; (T,) x a (T,, w)
where at critical point temperature
a, (TJ = 0.45724 R'r,; pci
and
K; =0.37464+1.54226v; -0.2699?ml
(4.5)
(4.6)
(4.7)
(4.8)
(4.9)
84
Page 105
Table 4.2: Critical properties and acentric factors used in the PR EoS
Component M(gmoT) Tc(K) Pc(MPa) OJ Ref.
Hz 2.016 32.98 1.293 -0.217 Phiong and Lucien
(2002)
co 28.00 132.9 3.499 0.066 Chapoy (2004)
The value of the hydrogen and carbon monoxide fugacity coefficient, <l>;, calculated
through the PR EoS is close to one (for example at 343.15 K and 1.5 MPa, <I>H, = 0.998
and <I> co = 1.004). Hence, according to Peng and Robinson (1976), the vapour phase can
be considered as an ideal gas. Here it is also assumed that under the equilibrium
conditions the amount of dissolved gas in the liquid has negligible contribution to the
liquid volume.
4.3. Parameteric Study of Reaction Variables and Kinetic Study
In the present work, the synthesis of n-nonanal and n-tridecanal, two commercially
important linear aldehydes, by the hydroformylation reaction of 1-octene and 1-dodecene
using a homogeneous catalyst consisting of HRh(PPh3)3(CO) and P(OPh)J in a TMS
system composed of propylene carbonate, dodecane and 1 ,4-dioxane was studied. The
reaction scheme for hydroformylation of 1-octene is shown in Figure 4.3. In the above
context, the specific objectives of this work are to:
(i) experimentally determine the effects of reaction parameters of the
hydroformylation of 1-octene with HRhCO(PPh3)3/P(OPh)3 catalyst in TMS
system ofPC/dodecane/1,4-dioxane over a temperature range of353-383 K,
(ii) study the kinetics of the hydroformylation of 1-octene and 1-dodecene with the
above catalyst and reaction medium,
(iii) develop empirical as well as mechanistic rate models of the reaction and evaluate
the rate parameters by fitting experimental data, and
(iv) assess the validity and quality of the developed mechanistic rate model by fitting
experimental hydroformylation data.
85
Page 106
A+ H2 +CO
,....--_.. B
----------~--~~c HRh(CO)(PPh)3
P(OPh)3 .__ _ _,. D
A= 1-octene; B= nonanal C= 1-methyloctene; D= 2-octene
Figure 4.3: Reaction products ofhydroformylation of 1-octene
The reaction proceeds via catalytic addition of H and formyl (CHO) groups across
the double bond of olefin to give aldehydes. The main steps in the catalytic cycle follow
the Heck and Breslow mechanism developed for the cobalt-catalyzed oxo reaction (van
Leeuwen, 2004). The kinetics ofthe reaction has been investigated at three temperatures -
353, 363 and 373 K. The initial rates of hydroformylation were determined under the
range of condition shown in Table 4.3. Since the reaction occurs in the liquid phase but
two of the reactants are supplied as gas, mass transfer limitation may influence the rate of
reaction. This was tested by conducting the reaction at different stirrer speeds under
unchanged experimental conditions.
Table 4.3: Range of variables studied in the present work
1-octene 1-dodecene
Cone. of catalyst (kmohn ·3) 8.66x1o·5- 6.78xl04 8.66xlo-s- 3.46xl04
Cone. of 1-olefins (kmolm-3) 0.21-4.2 0.20-3.0
PH(MPa) 0.3-1.5 0.3-1.5
Pea (MPa) 0.3-1.5 0.1-1.5
T(K) 353-383 353-383
Reaction volume (mL) 240 220
Hydroformylation of 1-octene and 1-dodecene were carried out in a 1.8 L stirred high
pressure reactor (model: Parr 4843). A schematic and photograph of the experimental set
up are shown in Figure 4.4 and Figure 4.5, respectively. The design of the reactor has
been taken into account the safety features and sampling considerations such as to avoid
syngas leakage and protection against high pressure gas. The experimental work was
86
Page 107
carried out at maximum pressure and temperature of 2.5 MPa and 383 K, respectively,
therefore the equipment was designed to withstand the above conditions. The top of the
reactor was connected tightly to a tree carrying needle valves to secure gas and liquid
sampling, pressure release valve and pressure gauge by means of a union using Teflon
tape around the threads. The reactor was equipped with an automatic temperature control
system, which included an external electric heating jacket and an internal cooling loop. A
pressure transducer-monitor system with high precision was also connected to the reactor
for on-line measurement of reactor pressure in the course of semi-batch hydroformylation
reaction.
1 2 5
Figure 4.4: Schematic of the experimental setup: (I) nitrogen; (2) syngas (CO/Hz); (3)
cooling water in; (4) cooling water out; (5) high pressure reactor; (6) stirrer; (7) sampling
valve; (T) thermocouple; (P) pressure gauge; (PT) pressure transducer; (PI) pressure
indicator; (TI) temperature indicator.
87
Page 108
Figure 4.5: Parr high pressure reactor
4.3.1. Pressure Test
Since the gaseous reactant, carbon monoxide is a highly toxic gas with a threshold limit
value (TL V) of 25 ppm, the pressure test was performed regularly to verify leak-tightness
of piping and components of the reactor (Silk, 1975). After closing all valves, the reactor
was tested for leakage by using a liquid leak detector (SNOOP, Swagelok). The reactor
was pressurized with Nz until the pressure reading reads 7.0 MPa. When visible bubbles
were observed, the equipment was de-pressurised before the lose connection was
tightened to stop the gas leakage. When the pressure stabilized within 15 minutes, the
pressure release valve was set at 5.0 MPa. A portable CO gas detector was also placed
adjacent to the reactor, for detecting CO leaks.
88
Page 109
4.3.2. Reaction and Kinetic Measurement
The feed mixture with the catalyst (220 mL) was taken in the PTFE holding vessel within
the preheated reactor. Before starting the run, the reactor was purged with nitrogen and
syngas successively, and then adjusted to the desired temperature. It was then pressurized
with a mixture of CO and H2 to a desired total pressure gradually in avoiding the feed
mixture from spilling out from the liner. The total pressure was monitored regularly and
maintained constant during the whole run by using the pressure regulator. When over
pressure was observed, some gas was released by opening the venting valve. The stirrer
was set at 450 rpm while the reaction continued. Liquid samples (each less than 1 mL)
were withdrawn at regular time intervals to follow the progress of the reaction. The
reaction was stopped quickly by cooling down the mixture to the room temperature. The
gas was vented out and the biphasic mixture was left to separate overnight (24 hr) using a
separatory funnel. The recovery of the catalyst and product was determined by collecting
samples from the nonpolar and polar phases. The analysis of reactants and products was
carried out by a gas chromatographic method. Each type of experiment was repeated
three times to check for reproducibility. Measurements are, in general, reproducible
within a maximum of 10 % but often within a few per cent.
4.3.3. Solubility Measurement
The solubilities of pure H2 and CO in TMS-systems of PC/dodecene/1,4-dioxane with
composition of 0.30/0.10/0.60 were measured by the absorption method at different
pressures (0.1-2.5 MPa) and temperatures (353-373 K). Requisite volume of the solvent
only was taken in the reactor which was then quickly pressurized. The contents were
stirred at 450 rpm for about 1 hr to equilibrate the liquid phase with the gas. A few
preliminary experiments showed that this time was sufficient for equilibriation. The total
pressure change due to absorption was recorded on-line as a function of time till it
attained a steady and constant value, indicating saturation of the liquid phase. From the
initial and final pressure readings, the solubility was calculated in kmolm·3 as:
[P; -(PI- pv)]Vg
RTVL (4.1 0)
89
Page 110
where CL represents the concentration of the solute gas in the liquid phase, Pi and P1 are
the initial and final pressure readings in the reactor; p' is the vapour pressure of the
solvent; Vg and VL are the volumes of the gas and liquid phases, respectively. In order to
ensure the applicability of the ideal gas law in Eq. ( 4.1 0), the H2 and CO fugacity
coefficients, were calculated using the Peng-Robinson equation of state as outlined in
section 4.2.2.3. The reproducibility of the experimental measurement was checked by
repeating a particular experiment 3 times. It was observed that the error in solubility
values obtained was within 2-3 %.
4.4. Liquid-liquid Equilibria
Four different temperatures (298.15, 313.15, 333.15 and 353.15 K) at atmospheric
pressure were selected to study the ternary equilibrium system of the TMS- system
(PC+l,4-dioxane+dodecane) in order to obtain the binodal (solubility) curves and tie
lines. The binodal (solubility) curves were determined by the cloud point method which
is outlined in Section 4.2.1. The major central part of the solubility curves was obtained
by titrating heterogeneous mixtures of PC and dodecane (1.0 g) with 1,4-dioxane until the
turbidity has disappeared. End-point determinations of the tie-lines ofPC+dodecane+ 1,4-
dioxane were based on the independent analysis of the conjugate phases that were
regarded as being in equilibrium. For this purpose, 1.5 g mixtures of known masses of the
component lying within the heterogeneous phase were introduced into a sealed glass tube
and were stirred vigorously by a magnetic stirrer for at least 5 hr and then left for 5 hr to
settle down into raffinate (polar phase) and extract (nonpolar) layers. After phase
equilibrium has been reached, samples of two layers were withdrawn with a syringe and
their compositions were analyzed gas chromatographically. The HRh(CO)(PPh3)3
catalyst concentration was analyzed by Atomic Absorption Spectrophotometer (AAS)
with air-acetylene flame. All experiments were repeated at least two times as a check for
accuracy.
90
Page 111
4.4.1. Distribution Coefficient
The distribution coefficients for 1-octene, nonanal, triphenylphosphite and
HRh(CO)(PPh3)3 catalyst in the ternary systems were obtained at temperature of 298 K
and 308 K. End-point determinations of the tie-lines of PC+dodecane+ 1,4-dioxane+ 1-
octene, PC+dodecane+ 1 ,4-dioxane+nonanal, PC+dodecane+ 1 ,4-dioxane+ 1-
octene+nonanal, PC+dodecane+ 1,4-dioxane+HRh(CO)(PPh3)3, PC+dodecane+ 1,4-
dioxane+ l-octene+nonanal+triphenylphosphite+HRh(CO)(PPh3)3 were determined by
the same procedure as described for the TMS- system.
4.5. Analytical Techniques
4.5.1. Gas Chromatography
The reaction products were determined by Shimadzu GC 2010 using BPX5 capillary
column and flame ionization detector. The length and inner diameter of the column and
the film thickness was 30 m, 0.25 mm and 0.25 J.tm, respectively. The column used is a
non polar column, so the polar compounds are eluted quicker than non polar compound.
Since the analysis involved non-polar and polar compounds thus, the polarity of the
solvents would affect the retention time. The non-polar components in a mixture are
separated according to their boiling points with a substance of lower boiling point being
detected first. Helium was used as a carrier gas. For the separation of the organic
products a heating program was applied. The initial temperature of the colunm was
adjusted to 323 K and kept constant for 2 min, then the colunm was heated with a rate of
293 K/min until 523 K and kept again constant at this temperature for 5 min. Products
were identified by comparison of the retention times and spectral characteristics with
authentic standard samples. Figures 4.4 and 4.5 show GC signal for hydroformylation of
1-octene and 1-dodecene, respectively.
91
Page 112
u)':xl ,000,000)
5. 9: 1 2 3
4 2. s:
0. ri ~ 0.0 2.5 s.o 7.5 mm
Figure 4.6: GC signal for hydroformylation of 1-octene (1: 1 ,4-dioxane, 2: 1-octene, 3:
dodecane, 4: nonanal).
u\(x1 000 000) ' '
3. 0: 1 2
4 5 2. 0: 3
1. 0:
0. r: w u • • A
2'.s s'.o 7'.s 10.0 h-I in
Figure 4.7: GC signal for hydroformylation of 1-dodecene (1: 1,4-dioxane, 2: dodecane,
3: 1-dodecene, 4: 2-methyldodecanal, 5: tridecanal
4.5.2. Atomic Absorption Spectroscopy
Rhodium concentrations in both polar and non polar rich phases were determined after
phase separation. Analysis was carried out by Hitachi ZSOOO. The measurement
conditions were as follow: 343.5 nm wavelength, 0.2 nm gap, 0.4 air/acetylene ratio. The
calibration curve of the Rh standard is presented in Appendix H.
92
Page 113
CHAPTERS
RESULTS AND DISCUSSION
This chapter presents the results and discussion of the experimental work conducted.
The first section focuses on the solubility of gaseous reactants - CO and H2 - in the
individual components of the solvent as well as in their mixtures, and provides insight on
how the different properties of the various gases and the solvent affect the solubility.
Section 5.2 discusses the effect of reaction variables on the selectivity, conversion and
yield of total aldehyde. Subsequently, section 5.3 presents the kinetics and modeling of
the hydroformylation reaction of 1-octene and 1-dodecene using a homogeneous catalyst
consisting ofHRh(PPh3)3(CO) and P(OPh)3 in a TMS- system composed of PC, dodecane
and 1,4-dioxane. Finally, Section 5.4 provides the liquid-liquid equilibrium (LLE)
behavior of the TMS system as well as the distribution of the reaction species in the non
polar and polar phases.
5.1. Development of the TMS- System
5.1.1. TMS-systems: PC+Dodecane+1,4-Dioxane
The phase diagram of this solvent system obtained by cloud titrations at 298, 353 and
373 K are shown in Figure 5.1. The isothermal 3-component phase diagram
(PC+dodecane+ 1,4-dioxane) shows a closed loop at all studied temperature. The big
miscibility gap of this solvent system facilitated a good operating range for the
hydroformylation. The miscibility gap or heterogeneous sphere of the system seems to
decrease with increasing temperature. The possible operating points are defined by the
area between the two binodal curves at the temperatures of298 K and 373 K. This point
is located in the single-phase regime when the reaction temperature is above the phase
separation temperature. Cooling down the reaction mixture to room temperature leads to
the separation of the single phase into two phases. Therefore, the composition of the
TMS-system selected for the solubility study was 1.31/1.29/7.40 weight ratio (point 1 in
Figure 5.1). At this composition, the ternary mixture dissolved into a single phase at
temperature range of298-343 K with the highest amount of 1,4-dioxane.
93
Page 114
• 298K X 353 K V 373 K
0~----~--~~--~~--~~--~ PC 0.8 0.6 0.4 0.2 0 dodecane
Figure 5.1: Phase diagram of the solvent system PC+dodecane+ 1,4-dioxane
5.1.2. Solubility Data
Figure 5.2 shows a plot of pressure vs. the mole fraction solubility of CO and Hz in PC,
biphasic PC+dodecane mixture and TMS-system of PC+dodecane+ 1 ,4-dioxane. Within
the temperature and pressure ranges of this study, the equilibrium pressure was found to
be almost linear in the liquid phase mole fraction for all the systems, conforming to
Hemy's law. Therefore the data are presented as equilibrium liquid phase mole fractions
at 0.10325 MPa (1 atm) pressure of the gas. PC and TMS-systems have a considerably
higher affinity for CO and Hz compared to the biphasic solvent mixture. Figure 5.2 also
shows that the TMS-system, particularly, 1 ,4-dioxane, has a higher affinity for carbon
monoxide compared to hydrogen, whereas hydrogen is more soluble in PC. The biphasic
mixture which contains higher amount of non-polar dodecane contributed to the lower
solubility of CO and Hz gas. Furthermore, the solubility of carbon monoxide in the three
solvent systems does not vary significantly compared to hydrogen. Typical solubility data
at 298 K for the three solvent systems are shown in Figure 5.2.
94
Page 115
1.6 1.6 •TMS •TMS 0 • • 1.4 IJ. • 1.4 D biphasic DBiphasic 0 • • 1.2 D. • 1.2 • •PC •Pc 0 •• o•
•• I • "" "" •• ~ 0.8 a• ~ 0.8 0 •• ~ ~ 0 •
"' • "' • 0.6 p. 0.6 0
• 0.4 0.4 o• rJ• 0
• 0.2 ~
0.2 II
0 0 0 0.005 O.QJ O.QJ5 0.02 0.025 0 0.005 O.QJ O.Ql5 0.02 0.025
mole fraction, x 2 mole fraction, x 2
Figure 5.2: Experimental solubility of gases in PC, biphasic PC+dodecane mixture (I: 1)
and TMS-systems ofPC+dodecane+1,4-dioxane (1.31:1.29:7.40) at 298 K. (A) CO; (B)
H2.
As it is seen in Figure 5.2 all liquids exhibit a relatively higher affinity for CO compared
to H2, which is an expected behavior since solubility increases with increasing molecular
weight of the solute. The attractive forces between the gas and solvent molecules
involved in this study are mainly of the London dispersion type, which increases with
increasing size and mass of the gas molecules (Fogg and Gerrard, 1991). In Figure 5.3,
the solubility of CO and H2 in the solvent systems increases moderately with respect to
temperature over the range of operating conditions, except for CO-propylene carbonate
system. According to Le Chatelier's principle, an increase in the solubility with
temperature indicates that the solution process is endothermic, and that the solubility is
driven by the increase of disorder in the system. This phenomenon is common for gases
having low solubilities (Prausnitz et a!., 1999). Similar results have been reported for
other oxygen containing solvents (Still et a!., 2006; Deshpande et a!., 1996; Fogg and
Gerrard, 1991) and nonpolar solvents (Nair eta!., 1999; Divekar eta!., 1993; Miller eta!.,
1990).
95
Page 116
>;:
0.002
... • 0.0016
~
0.0012
0.0008
D Biphasic 0.0004 + TMS
..._PC
•
-modeled (Eq. 5.1)
• •
A
0+--,---r--r--r--~--
290 300 310 320 330 340 350
Temperature (K)
>;:
0.002 ~------------,
0.0016
:=:: !=* 0.0012
~ 0.0008
0.0004 D Biphasic + TMS ..._PC -modeled (Eq. 5.1)
0
290 300 310 320 330 340 350
Temperature (K)
Figure 5.3: Experimental and predicted solubility of gases in PC, biphasic PC+dodecane
mixture and TMS-systems of PC+dodecane+1,4-dioxane (1.31:1.29:7.40) at a partial
pressure of 101.3 kPa. (A) CO; (B) Hz.
0.002 ..---------------.,
0.0016
0.0012
0.0008
0.0004
• • •
• •
• •
): ): ): X): X X
• • • • +++++++++
• D .l
o+----r----~------~_j 290 310 330 350
Temperature (K)
.lPC
+TMS
D Biphasic
.l hexadecane
): naphtha reformate
XNX795
• cyclohexane
+benzene
Figure 5.4: Experimental solubilities of Hz at partial pressure of 101.3 kPa as a function
of temperature. References to experimental data: NX 795, Still et a!. (2006); naphtha,
Fahim and Elki1ani, (1991); n-hexadecane, Hu and Xu, (1985); cyclohexane, Hu and Xu,
(1985); benzene, Hu and Xu, (1985).
96
Page 117
o.ooz 0 0
o n -hexadecane 0 • • • • • 0.0016 D D
t TMS • II Iii • • D
X X D Biphasic
0.0012 X X
>< .i. PC
0.0008 XNX795 x:IOK X X X
X * 2-methyl-l-propanol
0.0004
Z90 300 310 3ZO 330 340 350 360
temperature (K)
Figure 5.5: Experimental solubilies of CO at partial pressure of I 01.3 kPa as a function
of temperature. References to experimental data: NX 795, Still et a!. (2006); n
hexadecane, Hu and Xu, (1985); 2-methyl-1-propanol, Sander eta!., (1983).
Figures 5.4 and 5.5 compares the solubility of Hz and CO from the current work with
other organic solvents in open literature. The most notable attribute seen in these two
figures is that CO is more soluble in non-polar solvent compared to Hz. Anthony (2004)
reported that CO solubilities are not governed by its polarizability, even though CO has
significant quadrupole moments. A reasonable explanation for this behaviour was not
provided. On the other hand, the solubility of Hz is greatest in PC. The large dipole
moment of PC as well as specific interactions between Hz and the carboxyl group are
likely the governing forces leading to such high solubilities. The biphasic mixtures of
PC+dodecane and n-hexadecane have basically the same solubility, although the biphasic
mixture appears more soluble at higher temperature. The solubility of Hz in TMS-systems
ofPC+dodecene+ 1,4-dioxane is higher compared to other non-polar solvents (naphtha, n
hexadecane, cyclohexane and benzene) and polar solvent of 2,2,4-trimethyl-1,3-
pentanediolmono(2-methylpropanoate) (NX 795). This suggests that the interactions
governing the higher solubility of Hz in TMS-systems are influenced by the presence of
97
Page 118
the ether group of 1 ,4-dioxane. Within the studied temperature range the solubility of Hz
increases with temperature in all cases. The maximum solubility (x2) values for CO and
Hz in TMS-system are 0.0210 and 0.0172, respectively at temperature of 343 K. The
TMS-system also shows high affinity for CO and Hz, which is comparable to the single
phase propylene carbonate. The solubility data of the present work are compiled in
Appendix G.
5.1.3. Empirical Modeling
The solubility data were fitted to the empirical equation (Fogg and Gerrard, 1991) at 1
atm pressure using the following equation,
B inx2=A+-+CinT
T (5.1)
where xz represents the mole fraction of the solute gas in the liquid phase, T is the
absolute temperature and A, B and C are empirical constants. The accuracy of the
empirical model is given by R2 that quantifies the goodness of fit and was calculated as
follows:
L:(y expt - Y P"d Y L~ expt - Y expt )'
(5.2)
where Yexpt is the experimental value, Ypred is the predicted value and Yapt is the mean of
the experimental values. Plots of experimental and predicted solubility versus
temperature are shown in Figure 5.3. It is found that the logarithmic empirical model is
able to describe the experimental data with good accuracy over the whole range of the
operating pressure and temperature except for Hz-PC and CO-PC systems. Table 5.1
summarizes the values of the parameters A, Band C of Equation (5.1) and the parameter
R2• Still et al. (2006) also reported a good fit of Equation (5.1) for their solubility data on
Hz-CO-NX795 system. The values of the optimized parameters are consistent with that
reported in the literature. (Still et a!., 2006). The empirical model caunot be used to
explain the behavior of a system. Nevertheless, such a model can be very useful to
98
Page 119
predict the solubility within limited ranges of pressure and temperature. Thermodynamic
models, on the other hand, are expectedly more robust and flexible than purely empirical
models. Thermodynamic models also provide insights into the system being modeled.
Table 5.1: Parameters in Equation (5.1) for Hz and CO solubilities at a partial pressure
and temperature of 101.3 kPa and 298-343 K, respectively.
Gas-Liquid System A B c R
CO-PC 0.129 -300.0 -0.9833 0.802
CO-biphasic 10.000 -1000.0 -2.3128 0.992
CO-TMS systems 12.949 -1015.0 -2.7952 0.995
CO-NX 795 *17.413 *-1398.4 *-3.4190 *0.985
Hz-PC 17.486 -1200.0 -3.5218 0.750
Hz-biphasic 4.994 -1050.0 -1.4912 0.998
Hz-TMS systems 9.008 -1025.0 -2.1659 0.987
Hz-NX 795 *10.972 *-1466.0 *-2.3931 *0.955
*Values of the parameters A, B, C and R2 reported by Still et al. (2006) for H2-CO-NX 795 system
5.1.4. Thermodynamic modeling
The regular solution theory (RST)-based model and the modified UNiversal Functional
Activity Coefficient (UNIF A C) model are used to correlate and interpret the experimental
solubility data. The regular solution model predicts activity coefficients from solubility
parameters and the UNIFAC model uses the functional groups present on the molecules
that make up the liquid mixture to calculate activity coefficients. By utilising interactions
for each of the functional groups present on the molecules, as well as some binary
interaction coefficients, the activity of each of the solutions can be calculated. The
important advantage of RST is that its parameter is calculable without resorting to
activity coefficient measurements. However, the parameters obtained may not be as
accurate as those fitted to experimental data. On the other hand, the main advantages of
the modified UNIFAC method are a better description of the real behavior in the dilute
99
Page 120
region and that it can be applied more reliably for systems involving molecules of very
different in size (Gmehling et a!., 1993). A comparison is then made of the prediction
accuracy of the models.
5.1.4.1. Prediction of H2 and CO Solubility by the RST- based Model
A regular solution is a solution that diverges from the behavior of an ideal solution only
moderately. In contrast to ideal solutions, regular solutions possess an enthalpy of mixing
and the volumes are no longer strictly additive but must be calculated from the partial
molar volumes that are a function of x. Two major assumptions were made in proposing
the Regular Solution Theory (RST):
1. The change in entropy and volume of mixing were considered to be negligible,
u. The molecular interaction was primarily due to London Dispersion Forces (LDF).
Solubility predictions of highly polar compounds based on solubility parameter
difference were inconsistent due to the second assumption. The experimental solubility
data for H2 and CO in the three solvent systems were compared with the theoretical
predictions using the equations suggested by Prausnitz and Shair (1961) and Yen and
McKetta (1962). Since modeling according to the RST is essentially limited to
dissolution of nonpolar gases in nonpolar, non-assoaciating solvents, the modification to
the RST by Yen and McKetta (Still et a!., 2006) was applied in order to extend the RST
to polar solvents, such as PC and 1 ,4-dioxane. The activity models are presented below in
the way they were used for the solubility calculations:
RST:
(5.3)
RST withY en and McKetta correction:
100
Page 121
(5.4)
In Equations (5.3) and (5.4), the subscripts 2 and 1 represent the gas and liquid (solvent),
respectively; x2 is the mole fraction of the dissolved solute in the solvent at atmospheric
pressure (0.10325 MPa); f 2G(MPa) and J/(MPa) are the fugacities of pure gas and
hypothetical liquid solute at atmospheric pressure, respectively; ¢ and tA are the volume 1 2
fraction of solvent and gas, respectively; v2 (m3·mor1) is the molar volume of gas, and
51 and <52 are the solubility parameters (J.m"3)
112 for the solvent and the solute gas,
respectively, R is the gas constant and Tis the absolute temperature. The regular solution
theory also states that the solubility parameters and molar volume of solutes are
independent of temperature. The o-values were obtained from Katayama and Nitta
(Purwanto et a!., 1996). The quantity J!: was determined according to Prausnitz and
Shair (1961).
The solubility parameter ( 01) for PC, dodecane and 1 ,4-dioxane were calculated from
the heat of vaporization as proposed by Hildebrand and Scott (1948)
(5.5)
where Ml, represents the heat of vaporization and v2 the molar volume of the solvent.
The heat of vaporization is generally reported at the normal boiling temperature (Tb). The
correlation proposed by Reid and Prausnitz (1987) was used to calculate Ml, at the five
chosen temperatures of study:
Ml -Mf 1-T, ( )
0.375
v,T- v,Tb 1- (T,)Tb (5.6)
where Tc is the critical temperature of the solvent. The solubilities of CO and H2 in pure
PC, dodecane and 1 ,4-dioxane were further used for calculating the solubilities of these
101
Page 122
gases in a mixture of solvents by using the method proposed by Prausnitz and Shair
(1961), and given by the following expression:
I fz" (v,(o,-6)') -= --exp x 2 f 2G RT
(5.7)
where t5 is the average solubility parameter defined as
(5.8)
The liquid molar volumes, v2 and solubility parameters t5used in the modeling are listed
in Table 5.2.
Table 5.2: Parameters for modeling with RST model
Compound v2 (cm3 mor1) t5(MPa~'') Tc (K) Pc (MPa)
at 25 oc at 25 oc
Carbon monoxide 32.la 7.386 132.921 3.4991
Hydrogen 37.3• 7.84b 33.18f 1.300f
Propylene carbonate 84.82c 21.30d 778.10°
Dodecane 84.07c 17.91 d 658.30[
1,4-Dioxane 226.82° 21.33d 588.15[
"Not required in modeling; 'Purwanto et al., (1996); bY en and McKetta (1962); °Calculated from
molecular mass and density; dCalculated from Eq. (5.5); "Kolar et al., (2005); 'Washburn (2003)
5.1.4.2. Prediction of Hz and CO Solubility by the Modified UNIFAC Group
Contribution Model
The UNIF AC group-contribution model has been extensively used to predict activity
coefficients for nonelectrolytic liquid mixtures. The method has become a reliable tool
for the prediction of vapor-liquid equilibrium (VLE) as well as gas-liquid equilibrium
(GLE) data (Gmehling et a!., 1982; Hartounian and Allen, 1988; Fahim and Elkilani,
1991) for systems for which little or no experimental information is available. UNIF AC
102
Page 123
assumes that a physical property of the fluid is the sum of the contributions made by the
functional groups of the molecule. In the model, molecules are broken down into
functional groups and the mixture is treated as a mixture of groups. The properties of
each group are assumed to be independent of the rest of the molecule to which it is
attached.
For a gas (component 2) dissolved in a solvent or solvent mixture (component 1) the
gas phase fugacity becomes equal to the liquid phase fugacity at equilibrium.
(5.9)
The gas phase fugacity coefficients for Hz and CO calculated using the Peng-Robinson
equation of state (PR-EoS) and were found to be close to unity and the gas-phase was
assumed ideal.
(5.10)
where P is the total pressure and .Yz is the mole fraction of gas in the gas phase. For non
volatile liquids such as dodecane and propylene carbonate, the mole fraction of the solute
in the gas phase is unity. Liquid phase non-ideality can be taken into account through the
activity coefficient. The fugacity of the solute in a solution can be written as
(5.11)
where xz and }'2 are the mole fraction and activity coefficient of the gas in the solution,
while / 2° represents the fugacity of a hypothetical pure liquid whenever the temperature
is greater than the critical temperature of the gas. The quantity fi cannot be determined
experimentally (Wilhelm, 1986). So the expression may be modified in terms of the
Henry's law constant for the solute in a 'reference solvent' as follows (Sander et al.,
1983):
(5.12)
103
Page 124
where r ~' is the infmite dilution activity coefficient of the gas in the reference solvent
and H,_, is the Henry's law constant of the gas in the reference solvent. n-Propanol was
selected as the reference solvent in this work. Equations (5.9) to (5.12) are used to obtain
the mole fraction ofthe solute gas in the solution.
YzP Xz = H ro
2,rY 2,r
(5.13)
The activity coefficients may be determined by the UNIF AC group contribution method.
Since UNIFAC model deals with functional groups present in the components, the
application of the model requires all the interaction parameters between the groups
present in the liquid and gas phase as function of temperature. Two modifications of
UNIF AC have been used in this work. The first modification expresses interaction
parameters as a linear function of temperature given by Equation (5.14). A constant
enthalpy of solution is assumed.
anm = Anm + Bnm (T- 273.15) (5.14)
The second modification, suggested by Kikic et a!. (see Fahim and Elkilani, 1991), is
concerned with the combinatorial activity coefficient according to the following
expresswn
where
I c lnll'i nyi = 5
lnq>i q , (B, +1-.pi)/Bi (xi+l-II'Yxi
x.r.l/3
lfli = "" I I 2/3 ; L..X .r. j J 1
X·Y· ff'i ::;:; I I
L:x .y. j j J
(5.15)
(5.16)
The van der Waals relative volume and surface of the components (rand q), needed for
UNIFAC calculations, are listed in Table 5.3.
104
Page 125
Table 5.3: UNIFAC parameters rand q of the components
Compound r q References
Carbon monoxide 2.094 2.120 Li et al., 1997
Hydrogen 0.832 1.141 Li eta!., 1997
Propylene carbonate 3.282 2.736 Ali et a!., 2003
Dodecane 17.092 14.192 Sander et a!., 1983
1,4-Dioxane 3.185 2.640 Bandres et a!., 2007
However, the UNIFAC parameters for the interaction between H2, CO and the functional
groups present in the solvents (PC and 1,4-dioxane) as a function of temperature are not
available in the literature. Therefore, it has been necessary to estimate these parameters
before the suitability of the model can be tested. These parameters for the systems
studied have been estimated by using one-half of the experimental solubility data set. In
fact, the alternate data points of gas solubility (xz against pressure) were used for
UNIF AC parameter estimation and the rest were used to test the applicability of the
model. The Henry's law constant for hydrogen and carbon monoxide in the reference
solvent (n-propanol),~, were calculated (Sander eta!., 1983) and subsequently the ratio
(r; lr;;)"P was calculated from Equation (5.13). The following objective function was
used to minimize the errors in the estimation ofUNIFAC interaction parameters between
the gas (2) and the functional group
r:p · =L[ln(y./y~)exp-ln(y./y~) 1 ]2 mm n 1 1,r 1 I,r ca c
(5.17)
where r:p min is the objective function to be minimized, n is the number of data points and
y; is the activity coefficient of the solute gas calculated by using modified UNIF AC. By
using the new predicted interaction parameters presented in Table 5.4, the gas solubility
in liquid and liquid mixtures can be calculated from Equation (5.13). The quality of the
UNIF AC correlation, obtained as a result of the parameter regression, was also compared
with the remaining data set.
105
Page 126
Table 5.4: Modified UNIFAC group interaction parameters for Equation (5.14).
anm Anm Bnm aco,Pc -339.4 -1.24
apc,co 858.6 1.86
acO,dioxane -363.1 1.45
a dioxane, CO 490.6 6.37
aH2,PC -440.1 0.57
aPC,H2 1201.9 -3.96
a H 2 ,dioxane -1747.5 6.00
adioxane,H2 300.0 -3.47
5.1.3.3. Results of the Thermodynamic Modeling
The experimental and predicted solubilities based on the RST and UNIF AC model are
plotted and compared in Figures 5.6-5.8. As Figures 5.6, 5.7 and 5.8 displayed
convincingly, the UNIF AC activity coefficient model leads to the best description of the
experimental results. The mean relative deviation between experimental and predicted
mole fraction solubilities is not more than 7.8 %. The RST and UNIFAC predictions for
Hz in all three solvent systems were satisfactory with an average error 8.2 % and 5.8 %,
respectively. UNIF AC also gave a fairly good prediction of the solubilities of CO in the
three systems studied with an average deviations of 7.2 %. However, the RST based
predictions for CO in pure PC and binary mixture PC/dodecane were found to agree
within± 6.7 %, except for the tertiary TMS (PC+dodecane+l,4-dioxane) system which
predicted with a maximum error of 14.8 %. This suggests that the regular-solution
assumption, whereby the change in entropy and volume of mixing were considered to be
negligible cannot be applied to the tertiary multi-component TMS system due to the large
differences in size or molar volume between components. Still et al. (2005) and Cuevas et
al. (1995) incorporated the Flory-Huggins entropy of mixing into the RST model and
good agreement is observed with experimental data. In addition the RST based model did
not give as good description compared to UNIF AC model, which is most likely due to the
polarity of CO and the polarity of PC and 1 ,4-dioxane.
106
Page 127
0.002 .---------------,
o.oo16 • c~-<-- •-- .. --... -· •· .-· ·•
• H,___ -----•···-·• ~- -·· 0.0012 ~---
0.0008
0.0004
290 300 310 320 330 340 350
temperature (K)
Figure 5.6: Solubility of CO and Hz in TMS-systems PC+dodecane+1,4-dioxane at a
partial pressure of 101.3 kPa. Experimental (• •), modeled with regular solution theory
(RST) with Yen and McKetta extension for polar solvent(-), and UNIFAC model(---).
0.002 ,--------------, • co
I"' -----·--·--· .... ............. -0.0016
H, 0.0012 . --- ..
_ ..• -----· ........ 0.0008
0.0004
0+--.--.---.--.-~-~
290 300 310 320 330 340 350
temperature (K)
Figure 5.7: Solubility of CO and Hz in biphasic PC+dodecane mixture at partial pressure
of 101.3 kPa. Experimental (• •), modeled with regular solution theory (RST) with Yen
and McKetta extension for polar solvent(-), and UNIF AC model ( ---).
107
Page 128
0.002 ..,-------------, • co
0.0016 L ....................... . 0.0012
0.0008
\;·····•·····•·····•·····• • H,
0.0004
0+--.---,----.---.---.--~
290 300 310 320 330 340 350
temperature (K)
Figure 5.8: Solubility of CO and H2 in propylene carbonate at partial pressure of 101.3
kPa. Experimental (•, +), modeled with regular solution theory (RST) with Yen and
McKetta extension for polar solvent (-), and UNIFAC model ( ---).
Figure 5.9 shows the comparison of experimental and predicted values of solubility ofH2
and CO in the studied solvent systems. The theoretical predictions of solubility by using
modified UNIF AC were found to be within a maximum error of± 8.5 %, whereas RST
with the extension of Yen and McKetta (1962) predicts within ±11.0% error. Modeling
also showed that the RST based model can be used for prediction of CO and H2 gas
solubilites in the studied solvent systems except for CO-TMS system. On the other hand,
the UNIFAC model is able to describe the experimental data with a better accuracy over
the whole range of the operating pressure and temperature.
108
Page 129
0.02 0.02 ' ' ,'R ' x, '~ ., ' 0.016 0.016 ' X ' ,it.- '
' It
"" 0.012 0.012 "' ~
~ 1;i :3 :3 ~ <..>
B '" u 0.008 u 0.008
0 0.004 0.008 0.012 0.016 0.02 0 0.004 0.008 0.012 0.016 0.02
Experimental &perimenta1
Figure 5.9: Parity plots of the model predictions of the solubility of CO and H2 in PC,
biphasic PC+dodecane mixture and TMS-systems PC+dodecane+ 1 ,4-dioxane at
temperature range of 298-343 K. (A) UNIF AC model; (B) RST based model.
5.2. Parametric Study of Reaction Variables
5.2.1. Selection of Solvent Composition
Figure 5.10 shows the phase diagram with the corresponding working points obtained by
cloud-point titration. The hydroformylation of 1-octene has been carried out in
PC/dodecane/1,4-dioxane with varying compositions, A, B, C and D listed in Table 5.10.
At a reaction temperature of 90°C and syngas pressure of 1.5 MPa and 0.17 mM catalyst
concentrations, the conversion of 1-octene and the yield of total aldehyde were 53 % and
47 %, respectively. With a reaction-time of 2 h and a selectivity of approximately 90 %,
this catalytic system can be considered as highly reactive and selective.
109
Page 130
1,4-Dioxane I 0 • 298 K
+ 353 K v 373 K ~operating points
of this work
0~-----*----~~----~-----*----~ PC 1 0.8 0.6 0.4 0.2 0 Dodecane
Figure 5-10: Phase diagram of the solvent system PC/dodecane/1,4 dioxane
The total turnover number was 600 while the turnover frequency was 400 h-1• The
turnover number (TON) is the number of moles of product obtained by the number of
moles ofRh catalyst used:
TON= molesofaldehydeproduct moles of catalyst
(5.18)
The TON is a measure of the efficiency of a catalyst. Particularly in using expensive
catalysts, the TON should be as high as possible to reduce the final production cost. On
the other hand, the turnover frequency (TOF), is for describing the activity of the catalyst
and is defined as:
TOF=_3_ neal . t
(5.19)
110
Page 131
where n, is the moles of converted starting material, t is the time for conversion and neat is
moles of catalyst. The TOF allows an evaluation of the performance between different
catalytic systems.
Upon reaction completion, the solution is phase separated by cooling to form the
polar rich phase, PC and non-polar rich phase, dodecane. Gas chromatographic analysis
of the two liquid phases obtained at the end of the reaction showed that the product
preferentially remained in the nonpolar phase. The percentage yield of nonanal
distributed into the non polar phase was found to be in the range of 67 to 85 %. Table 5.5
shows that the n-selectivity increases at a higher PC concentration in the TMS-system.
Similar results on the effect of PC concentration were reported by Behr et a!. (2005) for
the hydroformylation of trans-1-octene using Rh(acac)(CO)z]/BIPHEPHOS catalyst.
From the calculated turnover frequency (TOF), the TOF was well above 300 h·', showing
high catalytic activity although significantly less concentration of catalyst was used
compared to the amount of catalyst loading in industrial hydroformylation processes. The
TOF obtained are comparable with the biphasic system for hydroformylation of 1-
dodecene (Zhang et a!., 2002). The solvent composition according to the operation point
A (PC/dodecane/1,4-dioxane: 0.30/0.10/0.60) given in Table 5.5, was selected as a
practical one for further study.
Table 5.5: Effect of the composition ofTMS-systems.
Serial PC/dodecane/1 ,4-dioxane Yield of total n/iso TON TOF,h. Rh loss,%
[wt %] aldehyde [%]
A 30.0/10.0/60.0 47.5 10.5:1 600.5 404.0 2.8
B 25.5/13.5/61.0 47.0 9.7:1 574.9 383.3 3.0
c 21.8115.8/62.4 47.9 9.5:1 463.2 308.8 6.3
D 17.8/18.2/64.0 50.6 8.5:1 618.3 412.2 10.4
Reaction conditions: P ~ 1.5 MPa, YHiYco ~ 1/1, HRh(CO)(PPh3) 3 ~ !.7xl04 kmol·m·3, 1-octene ~ 1.9
kmol·m·3, P(OPh),!HRh(CO)(PPh3h ~ 12, temperature~ 363 K, reaction-time~ 2 h.
Ill
Page 132
298 K 343 K
Figure 5.11: An orgamc solvent mixture composed of PC/dodecane/1,4-dioxane
(30.0/10.0/60.0) formed the biphasic system at 298 K (a lower PC layer was colored due
to the presence of the catalyst).
As shown in Figure 5.11, the catalyst remained in the propylene carbonate phase giving it
a light yellow colour. However, the catalyst loss into the product or nonpolar phase was
found to be within 2.8 to 10.4 % and it could be correlated to the polarity and the
solubility of the solvent mediator in the product phase. 1,4-Dioxane proved to be a better
solvent mediator with low catalyst loss of 3 % only compared top-xylene which caused a
higher rhodium leaching of about 4 7 % (Behr et al, 2005b ).
5.2.2. Effect of Reaction Parameters
5.2.2.1. Effect of Catalyst Concentration
Industrial hydroformylation processes carried out in a single phase solvent using rhodium
catalyst generally require high catalyst loadings, up to I mM HRh(CO)(PPh3)3. In this
study, a significantly less amount of catalyst was found to give satisfactory conversion
and selectivity. In Figure 5.12, at catalyst concentration of 0.68 mM, the conversion of 1-
octene increased with time until it reached a plateau at 98 % conversion and reaction time
of 2.0 h, indicating the end point of the reaction. The initial rate and conversion increased
with the concentration of the HRhCO(PPh3)3 catalyst. After 2.0 h, conversion of 1-octene
to C9-aldehyde increased from 50.0 to 95.3 % for a change of catalyst concentration from
0.0866 to 0.68 mM. The yield of total aldehyde in nonpolar phase, dodecane increased
112
Page 133
steadily from 0.0866 mM concentration of catalyst until it reached equilibrium at 0.68
mM of catalyst concentration. The catalyst also increases the rate at which equilibrium is
achieved. The rate of reaction decreases as the percent completion increases until the
point where the system reaches dynamic equilibrium. The high rates of total reaction and
yields of aldehydes may be due to the addition of excess P(OPh)3 ligand. According to
Beller et a!., (1995), by using phosphite-modified catalyst, even less reactive olefins such
as 1-octene, 2,3- and 2,5-dihydrofuran, !-butene and 2-butene are hydroformylated at
much higher rates compared to those achieved with phosphine-modified catalysts.
Similar observation was reported before in the case ofhydroformylation of 1-octene at 10
bar and 353 K, where the addition of excess ligand (PPh3:Rh = 5:1 molar ratio)
systematically led to high rates of hydroformylation and selectivity with reduced rates of
isomerization and hydrogenation of the olefin (Huang eta!., 2004).
100 100 10
90 ' '
9
80 ' '
80 8 ~
.. - ,' 'd' ' ' '
;ft. ' .(!( ~ 70 ' ' ' 7 " "' .. -:.-- ' § "" "
60 f 60 -- e>' 6 0 0 -a ' -' ' ~ - ' ::1 '""' 50 - ' B 5 0
A 3 ' ' c " ' ~ ' .s 40 catalyst concentration
0 ' 4 - 40 ~
4-< il 0 > ~ " --.-0.0866 mM 30 • Yield in dodecane 3 0
u ·~
---0.18mM >< Yield in PC 20 20 · · • · - n!iso in dodecane 2
-+-0.35mM • • <> • · n!iso in PC
_..,_0,68 mM 10
0 0 0
0 20 40 60 80 100 120 140 0.0866 0.18 0.35 0.68
Reaction time (min) Concentration ofHRh(CO)(PPh3) 3, mM
Figure 5.12: A: Time evolution of the yield of total aldehyde at different concentration of HRh(CO)(PPh3)3 catalyst; B: Effect of HRh(CO)(PPh3)3 concentration on the yield of total aldehyde and selectivity. Reaction conditions: P = 1.5 MPa, YmiYco = 111, T = 363 K, 1-octene = 1.9 kmol·m·3, P(OPh)3/HRh(CO)(PPh3)3 = 12, PC/dodecane/1,4-dioxane= 0.30/0.10/0.60.
113
Page 134
Similarly, the regioselectivity for linear aldehyde increased with the increase of
catalyst loading. The n-product was favoured under all conditions studied even though
the regioselectivity to n-nonanal decreased with time. This could be attributed to the ratio
of phosphite ligand (L) to rhodium metal affecting the coordination equilibrium of
catalytic active species. According to the catalytic cycle of hydroformylation, with the
increase of the ratio of phosphite ligand to rhodium metal, the rhodium metal complex
converted from HM(CO)zL to HM(CO)L2 and then to HM(CO)L3, among which
HM(CO)L2 was the main active species most favorable for the coordination and
dissociation of reactants, exhibiting higher catalytic activity and selectivity. With 0.68
mM HRh(CO)(PPh3)3, the conversion of 1-octene and the yield of total aldehyde were
97% and 95 %, respectively. The n/iso aldehyde ratio was 8.4 and formation of only 1.6
%of the 2-octene and 0.5 % of !-octane were observed after 2.0 has shown in Figure
5.13 and 5.14. A comparison of conversion and selectivity ofhydroformylation reported
in the literature for a few systems with that achieved in the present work is presented in
Appendix H. The percentage yield of aldehyde distributed into the nonpolar phase was
found to be in the range of 89.5 to 93.3 %.
hromatogram
2 5.0
4.0
3.0
1 2.0
1.0
7.7 7.8 7.9 8.0 8.1 8.2 8.3 min
Figure 5.13: Expanded GC signal for the formation for C9-aldehyde isomers (1: 2-
methyloctanal, 2: nonanal)
114
Page 135
1.75 hromatogram 2
!.50
1.25 3
1.00 1
0.75
0.50
0.25
0.00
min 4.00 4.25 4.5 4.75
Figure 5.14: Expanded GC signal for the octene isomers and octane (1: 1-octene, 2: 2-
octene, 3: octane)
5.2.2.2. Effect of Temperature
The reaction temperature significantly influences the converston as well as the
distribution of products due to enhanced isomerization of the double bonds and the
dissociation of ligand from the catalytic complexes at higher temperature (van Leeuwen,
2004). From the collision theory, an increase in temperature is accompanied by an
increase in the reaction rate. Temperature is a measure of the kinetic energy of a system,
so higher temperature implies higher average kinetic energy of molecules and more
collisions per unit time. A general rule of thumb for most (not all) chemical reactions is
that the rate at which the reaction proceeds will approximately double for each 10 K
increase in temperature. Once the temperature reaches a certain point, the chemical
species may be altered (e.g., decomposition ofligands and denaturing of proteins) and the
rate of the chemical reaction will reduced.
As it is seen in Figure 5.15, an increase in temperature from 353 to 373 K, increases
the initial rate of the reaction. This suggests that an increase of temperature from 353 to
373 K accelerated the formation of catalytic active species and enhanced the reaction
activity. At a higher temperature of 383 K, the initial rate dropped thereafter which might
be caused by the partial ligand degradation, leading to decrease of conversion of 1-octene
and selectivity for aldehyde. Although the rate of reaction increases with temperature up
115
Page 136
to 3 73 K, the percentage yield of aldehyde dropped significantly from 90 % to 72 % with
respect to an increase of temperature from 363 K to 373 K. In addition at the higher
temperature (3 73 K) an orange colour develops in the reaction mixture due to the
decomposition of the triphenylphosphite ligand which simultaneously affects the activity
and stability of catalyst (van Leeuwen and Claver, 2000). After 2.0 h, the total yield of
aldehyde was as high as 95 % and the ratio of n/iso aldehydes was 8.4. Thus, a higher
temperature increases the rate of the hydroformylation but decreases the n/iso ratio. The
isomerization of 1-octene into other internal octenes are favorable at higher temperature
and subsequently the concentrations of the branched octenes are enhanced, and hence
lower n/iso ratio. The optimal temperature of 363 K was observed, offering the highest
initial rate and reasonably high selectivity (n/iso = 8.8-9) for aldehyde. The percentage
yield of aldehyde distributed into the nonpolar phase was found to be in the range of 84.2
to 84.9 %.
100 -.-----------, 90 14
80 12
80 70 . ~
~ ~
u '0 60 ,., -§ '0 '@
'Ei s
g; . • • • • 10
,; 60 ·s::-, ]- . . .. : .•..... u 8 0
"" 50 ., -.; 'G •••••• '" ... ] "' 0 40 6 ~ -4-<
'B 40 '0 ] A :><
0 B "" ~
30 • Yield in dodecane 4 Yield in PC
...-Tat353K 20 -A-Tat363K
...-Tat373K
20 · · * · · n/i in dodecane · · 0 · ·n/i in PC
10 2
_._Tat 383 K 0 0
0
0 20 40 60 80 100 120 140 353 363 373 383
Reaction time (min) Temperature, K
Figure 5.15: A: Time evolution of the yield of total aldehyde at different reaction temperatures; B: Effect of temperature. Reaction conditions: P = 1.5 MPa, YH21Yco = 111, HRh(CO)(PPh3)3 = 6.8x10⁴ kmol·m·3, 1-octene = 1.9 kmol·m·3,
P(OPh)3/HRh(CO)(PPh3) 3 = 12, PC/dodecane/1,4-dioxane=0.30/0.1 0/0.60.
116
Page 137
5.2.2.3. Effect of the Total Pressure of Syngas
The effect of total pressure (ymiYco = 1/1) on the conversion of 1-octene, total yield of
aldehyde and the selectivity are presented in Figure 5.16. An increase in the total pressure
increased the rate and. conversion of 1-octene but the total yield of aldehydes were in the
range of 88-90 % and did not vary significantly. However, with the increase of the total
pressure, a decrease in selectivity of the linear aldehyde was observed. The n/iso ratio
decreased from 7.7 at total pressure of 1.5 MPa to 3.8 at 2.5 MPa. Typical experimental
results on conversion and selectivity are given in Table 5.6.
100 90 9
80 8
80 70 ' 7
"" "" .;
"" .; 60 ..2 "" 0 60 E "" 0 50 -;; "" -;; 3 A -;; 0 ~ 40 ~ 0 ....
40 ~
0 .... ""
0
" "" 30 :;:: Ol :;:: ____. 1.5MPa 20
20 ---2.0MPa
' ' '
B ' ·,., ' ...
•• k ••••••
G, '··- ...... . -
--.-Yield in dodecane --Yield in PC ... ,. ... n/i in dodecane
6
5 0 -~
4 ~ 3
2
--*-2.5MPa 10 · -- e-- · n/i in PC 1
0 0
0 20 40 60 80 100 120 140 1.5 2 2.5
Reaction time (min) Total Pressure (MPa)
Figure 5.16: A: Yield of total aldehyde as a function of reaction time at different total syngas pressure; B: Effect of total pressure. Reaction conditions: ymiYco = 1/1, HRh(CO)(PPh3)3 6.8x10⁴ kmol·m·3, 1-octene 1.9 kmol·m·3, P(OPh)3/HRh(CO)(PPh3)3 = 12, PC/dodecane/1,4-dioxane=0.30/0.10/0.60, temperature= 363 K.
The catalyst was found to be more stable at higher concentrations of dissolved CO
and Hz (gas pressure = 2.0-2.5 MPa), and the initial light colour of the reaction mixture
sustained. Deshpande et a!. (1992) reported that a higher partial pressure of CO could
prevent the formation of inhibiting species that led to catalyst deactivation. Wilkinson
117
Page 138
also reported the formation of orange dirhodium species, Rh2(CO)sLJ at a low partial
pressure ofH2 and high Rh catalyst concentration (van Leeuwen and Claver, 2000). Since
the formation of dirhodium species is a reversible process, at a high partial pressure of
Hz, the active rhodium hydrides (HRh(CO)zLz) are regenerated and might be another
cause for the positive rate response to increase in the total pressure of the syngas. The
increase of total pressure led to an increase of catalytic activity. However, side
hydrogenation and isomerization of 1-octene also increased at a pressure above 1.5 MPa,
which made the selectivity for nonanal drop correspondingly.
Table 5.6: Typical results on conversion of 1-octene, selectivity and yields.
Temperature [catalyst] [1-octene] p Conversion of Yield of n/i K mol/m3 kmol/m3 atrn 1-octene aldehyde
% % 353 0.68 1.90 15.0 95.3 60.0 10.5 363 0.68 1.90 15.0 97.2 95.0 8.4 373 0.68 1.90 15.0 98.6 83.0 7.5 383 0.68 1.90 15.0 99.1 68.0 7.0 363 0.086 1.90 15.0 50.0 48.2 3.0 363 0.18 1.90 15.0 53.0 47.0 5.0 363 0.35 1.90 15.0 93.0 89.7 7.7 363 0.35 1.90 20.0 95.3 89.0 5.5 363 0.35 1.90 25.0 98.8 88.2 3.8
Reaction conditions: H,!CO =I, reaction time= 2 h, catalyst:P(OPh)3 = 5:1 molar ratio
5.2.2.4. Effect of CO/H2 Ratio
The effect of composition of syngas on the conversion of 1-octene, total yield of
aldehyde and the selectivity are presented in Figure 5.17. A decrease in the partial
pressure of CO increased the rate and selectivity of the linear aldehyde but a decrease in
the total yield of aldehydes was observed. A sudden increase of the total yield of
aldehydes was observed when equimolar ratio of CO/H2 was used. The negative-order
dependence with CO in a certain range of partial pressures appears to be a common
feature in hydroformylation reaction, using HRh(CO)(PPh3) as a catalyst. As proposed by
Evans eta!. (1968) the inhibition in the hydroformylation rates at higher CO pressures is
mainly due to the formation of (RCO)Rh(C0)2(PPh3)2 and/or (RCO)Rh(CO),(PPh,)
species which are unreactive toward hydrogen. These species are likely to be formed by
118
Page 139
equilibrium reactions, thus reducing the effective concentration of the active catalytic
species. The equilibrium leading to the formation of umeactive species will be more
pronounced at higher pressures of CO causing a sharp decrease in the total yield of
aldehydes and rate of reaction as observed in this work. At lower partial pressures of CO,
the formation of these species is expected to be negligible, and therefore a positive-order
dependence of the rate on Pco is observed. We also observed an increase in the rate of
reaction with partial pressure of Hz. Regeneration of rhodium hydrides from dormant
rhodium species formed by impurities is another cause for the positive rate response to
raising the Hz pressure.
60
50 ~
~ ~
~ 40
i ., " A T;i
30 Pco!PH2 £
"'" 0 ., 20 -+-0.3 " :;:: __..,_I
10 --+-2 -+-3
0 20 40 60 80 100 120 140
Reaction time (min)
60
50
~
~ 40
~ E ~ 30
" ~ 0 ~ 20 4-< 0 ., ~ 0)
:;:: 10
~------------------r 12
B
G.
· ·e .... ·G- - - - -o -Yield% in dodecane ___.Yield% in PC • · 0 · ·n/iso in PC - - -l>r - • n/iso in dodecane
• • • •
10
8
6~
4
2
0 +---+---+--+---+ 0
0.3 I 2 3
Partial pressure (CO/H2) (MPa)
Figure 5.17: A: Yield of total aldehyde as a function of reaction time at different CO/Hz pressure ratio; B: Effect of CO/H2 ratio. Reaction conditions: p = 1.5 MPa, HRh(CO)(PPh3)3 2.1x10·4 kmol·m·3, 1-octene 1.9 kmol·m·3, P(OPh)3/HRh(CO)(PPh3)3 = 12, PC/deodecane/1,4-dioxane=0.30/0.I0/0.6017, temperature= 363 K.
5.2.2.5. Effect of Ligand to Catalyst [P(OPhh/HRh(CO)(PPh3h) Ratio
On the basis of the above catalytic results in 1-octene hydroformylation, an excess of
P(OPh)3 was added to HRh(CO)(PPh3)3, and the effects of P(OPhh at 15 bar
(Hz/CO =I) and 363 K was investigated. It is clearly seen from Figure 5.18 that addition
119
Page 140
of excess P(OPh)3 systematically leads to great increases in the rates of hydroformylation
and in the ratio of nliso aldehydes when the molar ratio of P(OPh)3:Rh is in the range of
10-12 and eventually dropped thereafter. The need for excess ligand (L) arises from the
facile Rh-L dissociation equilibrium shown in Figure 5.19 (van Leeuwen and Claver,
2000). As the concentration of P(OPh)3 increases, the formation of inactive catalyst
HRhL3 lowers the total yield. In addition, at high P(OPh)3 concentrations, where the
catalyst resting state is (P(OPh3)J)Rh(CO)H, phosphite dissociation must occur to form
the coordinatively unsaturated intermediates. This dissociation is suppressed by increased
P(OPh3)3 concentration, which serves to reduce the concentration of active Rh species in
the catalytic cycle.
60,-------------------,
~ ~
;!!. ;/.
60 -.-----------------,- 9
50 ...................
• • G •••••••
8
7
'G)" 40 ~
.g 40 6 "0
i "0 "il
~ ~
<;..< 0
"0
~
i "0 "il TS
A B Ligand/Catalyst 4<
0 20 il -+--10 :;::
_..,.__ 12
----14
-+--16
30
20
10
B ~---..s
• Yield% in dodecane ~~Yield% in PC · · * · · n/iso in PC · · 0 · · n/iso in dodecane
4~ 3
2
0 0 0 0 20 40 60 80 100 120 140 10 12 14 16
Reaction time/min Ligand P(OPh)3/HRh(CO)(PPh3) 3
Figure 5.18: A: Yields of total aldehyde as a function of reaction time at different ratio of ligand to catalyst concentration. B: Effect of P(OPh)3/HRh(CO)(PPh3)3 ratio. Reaction conditions: p = 1.5 MPa, HRh(CO)(PPh3)3 = 2.1xl0·4 kmol·m·3, 1-octene = 1.9 kmol·m·3, P(OPh)J/HRh(CO)(PPh3)3 = 12, PC/deodecane/1,4-dioxane=0.30/0.10/0.60, temperature = 363 K.
With HRh(CO)(PPh3)3 concentration of 2.1x10"4 kmol·m·3 and P(OPh)3/Rh =12, the
yield of total aldehyde went up to 48.0 %, the n!iso aldehyde ratio reached 8.0 after 2 h.
The observations in catalytic behaviour of a phosphite-containing rhodium complex can
120
Page 141
be interpreted in terms of electronic and steric factors of donor ligands.
HRh(CO)(P(OPh)3) contains the strong electronegativity of the oxygen. Electron
withdrawing ligands lead to a decrease of the back-donation to CO ligands via the
rhodium by rc-back donation. Consequently, the Rh-CO bond is weaker in
HRh(CO)(P(OPh)3)2 than in HRh(CO)(PPh3)2 so that the former can be catalytically
more active than the latter for hydroformylation. This will affect the formation of species
J (in Figure 5 .29), such that the rate of formation, or the equilibrium concentration
mcreases.
PPh3 +CO
PPh3 +CO co +CO co I -PP1l3 I -PPh3 I -PP!J3 I
Ph P-Rh-H OC-Rh-H OC-Rh-H OC-Rh-H 3 I +PP!J3 I +PP/13 I +PPh3 I
PPh3 -CO PPh3 -CO PPh3 -CO co
Inactive Selective C3talyst active. but not highly 3Ctive, very selective not selective
Figure 5.19: HRh(CO)(PPh3)3 dissociation equilibrium
Alkene complexation, giving complexes E, may also be accelerated or become more
favored thermodynamically. Migratory insertions are not particularly sensitive to
electronic properties of the ligand, but it is important to note that oxidative addition will
slow down when electron-withdrawing ligands are used (Broussard et a!., 1993).
HRh(CO)(P(OPh)3)2 presents a greater steric hindrance than PPh3 for the coordination of
1-octene to the rhodium center and thus can lead to lower rates of the 1-octene reactions.
The greater steric hindrance relatively favours anti-Markownikov addition (van Leeuwen
and Claver, 2000), which can produce more nonanal than 2-methyloctanal and 2-octene.
The addition of excess PPh3 makes a significant impact on the enhancement of catalytic
activity and selectivity of rhodium complexes for 1-octene hydroformylation (Deshpande
et al., 1993). Consistent with the results reported with other rhodium complex systems for
1-octene hydroformylation, our catalyst systems in the presence of excess P(OPh)J
(P(OPh)3:Rh = 12:1 molar ratio) show a marked increase in the n/iso aldehyde ratio and
great decreases in the activities for the formation of 2-octene and n-octane. The increase
121
Page 142
in the nliso aldehyde ratio and the suppression of the side reactions of 1-octene are
mainly due to strong steric effect of P(OPh)J. However, the increase in the activity for the
formation of aldehydes by addition of excess PPh3 or P(OPh)3 remains unclear.
5.2.2.6. Effect of 1-0ctene Concentration
As shown in Figure 5.20, a higher concentration of 1-octene increases the rate of the
hydroformylation but the n/iso ratio in the product or non-polar phase was in the range
6.0-6.5 and did not vary significantly. An increase in the 1-octene concentration resulted
in a higher reaction rate and conversion of 1-octene, while the linear aldehyde selectivity
remains unaffected. The increase in olefin concentration will predictably cause an
increase of the addition of olefin to the active catalyst species B in Figure 5.29, to form
the alkyl complex and hence will cause enhancement in the rates of reaction as observed.
100 70 7
A -----··•·-. 1-octene concentration 60
. .•. -- . 6
80 --o.2M
~· -+-1.5M
~ -+-2.4M
... -···X· ..
50 . . X. 5 "' - ---
0 <1J __._3.9M ., ,., "" 60 <1J ., -;; -;; -0 -""' 40 0 ., 0 :;:;
"" .,
f 40 4 B
c "§ ·~ s 30 3';:' 4-< 0
~ -Yield in dodecane
20 Yield in PC 2 · · * · · n/iso in dodecane 20 · · * · · n/iso in PC
10 I
0 0
0 20 40 60 80 100 120 140 0.2 1.5 2.4 3.9
Reaction time (min) Concentration of 1-octene, M
Figure 5.20: A: Yield of total aldehyde as a function of reaction time at different 1-
octene concentrations; B: Effect of 1-octene concentration. Reaction conditions: p = 1.5
MPa, YH21Yco =Ill, HRh(CO)(PPh3)3 = 1.73xl04 kmol·m·3, P(OPh)3/ HRh(CO)(PPh3)3 =
12, PC/dodecane/1 ,4-dioxane=0.30/0.l 0/0.60, temperature= 363 K.
122
Page 143
5.3. Kinetic Study
5.3.1. Solubility of CO and H2 in TMS-system
For the kinetic study, a knowledge of the solubility of gaseous reactants in the reaction
medium is essential. Therefore, the solubilities of Hz and CO in TMS-system of
PC/dodecane/1 ,4-dioxane (0.30/0.1 0/0.60) were determined using the high pressure
reactor over the temperature and pressure range of 353-373 K and 0.1-2.5 MPa,
respectively. The solubility of Hz and CO in the TMS system is linearly dependent on
the pressure in the pressure range of 0.1 to 2.5 MPa as illustrated in Figure 5 .21.
2 co -;;;-
~ ';;' 1.5 s 00 00 ~ ~
"' 1 0..
•373 K 0.5
&363 K
+353 K
0
0 0.1 0.2 0.3 0.4
Liquid phase concentration (kmol/m3)
Figure 5.21: Effect of partial pressure of Hz and CO on solubility
Table 5.7: Solubility of Hz and CO m TMS-system of PC/dodecane/1,4-dioxane
(0.30/0.1 0/0.60).
Temperature (K)
353 363 373
Henry's law constant (m3·MPa·kmo1"1)
Hz CO 10.13 8.05 9.98 7.88 9.79 7.56
123
Page 144
The plots are linear with a high correlation coefficient (>0.995). Henry's law constants
for solubilities of CO and Hz in TMS system of PC/dodecane/1,4-dioxane with
composition of 0.30/0.10/0.60 are presented in Table 5.7. These values were used in the
calculation of the concentrations of dissolved CO and Hz in the reaction medium.
However, the temperature of 353 to 373 K has no significant effect on the solubility of
both Hz and CO in TMS-system.
5.3.2. Kinetics
The initial rates of hydroformylation were determined under the range of condition
shown in Table 4.3. Since the reaction occurs in the liquid phase but two of the reactants
are supplied as gas, mass transfer limitation may influence the rate of reaction. The
common technique to apply in order to avoid external mass transfer limitations is by
conducting the reaction at increasing agitation speeds under unchanged experimental
conditions. Once this variable does not affect the reaction rate, it can be concluded that
external mass transfer effect is negligible and the reaction rate is in the chemical or slow
kinetic regime. As shown in Figure 5.22, increase of the agitation speed above 430 rpm
had no effect on the rate of reaction and existence of the kinetic regime was confirmed.
3r---------------------,
::2.5 / : : ) 2 ....11-r---------g
0.5 -+- 1-octene
---- 1-dodecene
0+---~--~----~--~--~
350 400 450 500 550 600
I]Jm
Figure 5.22: Effect of agitation speed on the rate of reaction in hydroformylation of 1-octene and 1-dodecene. Reaction conditions: p = 1.5 MPa, ymiYco = 111, HRh(CO)(PPh3)3 1.73x10⁴ kmol·m·3, 1-olefins = 1.9 kmol·m·3, P(OPh)3/HRh(CO)(PPh3)3 = 12, PC/deodecane/1,4-dioxane=0.30/0.10/0.60, temperature = 363 K.
124
Page 145
5.3.2.1. Effect of Catalyst Concentration
Initial reaction rate as a function of catalyst concentration for the TMS system is plotted
in Figure 5.23. The plots are linear with a high correlation coefficient (0.990). Therefore,
the reaction rate shows a first order rate dependence on the concentration of catalyst over
the concentration range studied. The studies conducted by Brown and Wilkinson (1970)
and Chaudhari and co-workers (Deshpande et al., 1988,1992; Bhanage et al., 1997;
Divekar et al., 1993; Nair et al., 1999) using HRh(CO)(PPh3)3 catalyst showed first-order
rate dependence on catalyst concentration in benzene, toluene, or ethanol for several
different unsaturated substrates. However, when vinyl acetate or 1-hexene was the
substrate, Chaudhari noted a critical catalyst concentration ( C*) of 0.2-0.4x 10⁻³ kmolm-3,
below which no reaction was observed. Beyond C*, the dependence on catalyst
concentration was first order (Deshpande et al., 1988, 1989). The inactivity at low
catalyst concentrations was attributed to a high substrate/catalyst ratio, leading to
catalytically inactive dimer formation. This dimer formation probably involves the
species F and G of Figure 5.30 (Palo and Erkey, 1999). The data lie on a curve that
passes through the origin, indicating that there is no critical catalyst concentration in the
TMS system using HRh(CO)(PPh3)3/P(OPh3)3 as catalyst when 1-octene is the substrate.
3 Temperature
• 353 K 2.5 • 363 K _,
"' 373 K ~ 2
"'.§ 0
] 1.5 ~
~ 0 ~
~
0:: I 2 ~
0.5
0
0 0.2 0.4 0.6 0.8
Catalyst concentration, c X I 03 (kmolm "3)
Figure 5.23: Effect of catalyst concentration on the rate of reaction. Reaction conditions: P = 1.5 MPa, YH21Yco = 111, 1-octene = 1.9 kmol·m-3, P(OPh)3/HRh(CO)(PPh3)3 = 12, PC/dodecane/1 ,4-dioxane=0.30/0.1 0/0.60.
125
Page 146
5.3.2.2. Effect of 1-0ctene Concentration
Initial reaction rate as a function of 1-octene concentration for the TMS system is plotted
in Figure 5.24.
!.8 Temperature
!.6 • 353 K .i. 363 K
!.4 +373K {"' M
00 !.2 -Modeled (Eq. 5.21)
11 0
] ~
b 0.8 ~
"' "' 0.6
"' "' ,: 0.4
0.2
0
0 2 3 4 5
Concentration of 1-octene (kmolm"3)
Figure 5.24: Effect of 1-octene concentration on the rate of reaction. Reaction conditions: P = 1.5 MPa, YH21Yco = 111, HRh(CO)(PPh3)3 = 1.73x10⁻³ kmol·m-3, P(OPh)3/HRh(CO)(PPh3)3 = 12, PC/dodecane/1 ,4-dioxane=0.30/0.1 0/0.60.
The reaction rate shows a first order rate dependence on the concentration of catalyst over
the concentration range studied. Substrate inhibition was absent over the range of
substrate and catalyst concentrations selected, where the substrate/catalyst ratio varied
from 580 to 2300. This may be due to several factors - solvent effects, the phosphite
ligands, and the increased H2 and CO concentrations relative to conventional systems
(Shaharun et a!., 2008). The parametric effect on the reaction kinetics was found to be
similar to that observed for a homogeneous hydroformylation system under industrial
operating conditions (van Leeuwen and Claver, 2000). The studies conducted by Brown
and Wilkinson (1970) and Chaudhari and co-workers (Deshpande et a!., 1988,1992;
Bhanage et a!., 1997; Divekar et a!., 1993; Nair et a!., 1999) using HRh(CO)(PPh3)3
catalyst showed first-order rate dependence on catalyst concentration in benzene, toluene,
or ethanol for several different unsaturated substrates. However, when vinyl acetate or 1-
hexene was the substrate, Chaudhari noted a critical catalyst concentration ( C*) of 0.2-
126
Page 147
0.4x 10⁻³ kmolm-3, below which no reaction was observed. Beyond C*, the dependence on
catalyst concentration was first order (Deshpande et a!., 1988, 1989). The inactivity at
low catalyst concentrations was attributed to a high substrate/catalyst ratio, leading to
catalytically inactive dimer formation. This dimer formation probably involves the
species F and G of Figure 5.30 (Palo and Erkey, 1999). The data lie on a curve that
passes through the origin, indicating that there is no critical catalyst concentration in the
TMS system using HRh(CO)(PPh3)3/P(OPh3)3 as catalyst when 1-octene is the substrate.
5.3.2.3. Effect of Hydrogen Partial Pressure
Initial reaction rate as a function of partial pressure of hydrogen for the TMS system is
plotted in Figure 5.25.
1.4 Temperature
1.2 • 353 K & 363 K
., + 373K 00
"'s -Modeled (Eq. 5.21) 0
v~ 0.8
0 ->< 0.6
"' B' "' 0.4 ~
0 0.5 I 1.5
P 82 (MPa)
Figure 5.25: Effect of partial pressure of H2 on the rate of reaction. Reaction conditions: Pea = 10 atm, 1-octene = 1.9 kmol·m-3, HRh(CO)(PPh3)3 = 1.73x10⁴ kmol·m-3,
P(OPh)3/HRh(CO)(PPh3)3 = 12, PC/dodecane/1 ,4-dioxane=0.30/0.l 0/0.60.
The plots are also linear with a high correlation coefficient (0.995). Therefore, the
reaction rate shows a first order rate dependence, which is commonly observed in
conventional solvent system. It is important to note that, a first order rate dependence was
observed, although the solubility of H2 is higher in the TMS system compared to the
127
Page 148
conventional non polar solvent system. Such first-order dependency is commonly
interpreted to mean that the oxidative addition of Hz (step II in Figure 5.30) is the rate
determining step (Nair et al., 1999; Deshpande et al 1998; Bhanage et al., 1997). This
result illustrates the usefulness of the TMS-system not only as an alternative solvent, but
also as a mechanistic tool for investigating kinetic behavior over a much wider range of
conditions than normally employed.
5.3.2.4. Effect of Carbon Monoxide Partial Pressure
Initial reaction rate as a function of partial pressure of carbon monoxide for the TMS
system is plotted in Figure 5.26.
' 00 M ·s
] 0
~ " '" ~
1.4 -,----------------,
1.2
I .
0.8
0.6
0.4
0.2
0
0
Temperature
• 353 K .1. 363 K + 373 K -Modeled (Eq. 5.21)
0.2 0.4 0.6
Pea (MPa)
0.8 1.2
Figure 5.26: Effect of partial pressure of CO on the rate of reaction. Reaction conditions: PH, = 10 atrn, 1-octene = 1.9 kmol·m·3, HRh(CO)(PPh3)3 = 1.73x10⁴ kmol·m·3,
P(OPh)3/HRh(CO)(PPh3)3 = 12, PC/dodecane/1 ,4-dioxane=0.30/0.1 0/0.60.
The rate was found to be inversely dependent on the CO partial pressure in the range of
4.0 to 11.5 atm. Increasing Pco had no positive effect on the reaction rate at all, which is
explained by the high initial concentration of CO in the reactor. The conventional system
exhibits positive dependence on [CO] only at very low concentrations [(0-17)x 10·3
128
Page 149
kmolm-3] and shows drastic rate inhibition at higher concentrations, due to the formation
of inactive species M as illustrated Figure 5.30. These species are coordinatively
saturated, so oxidative addition of Hz cannot take place, preventing aldehyde formation.
Since the TMS system is performed at [CO] values of at least 0.046 kmol·m-3, the purely
negative rate dependence on [CO] is expected. Generally, the parametric effects were
found to be similar to that of kinetics in homogeneous system under the industrial
operating conditions. According to van Leeuwen (2004), under the "standard" catalytic
conditions (1.0-3.0 MPa, temperature 343-393 K, [Rh] = ;::;J0-3 kmol·m-3, [alkene]= 0.1-2
kmol·m-3, [L] depending on complex stability) the rhodium phosphite catalyzed reaction
is first order in the concentration of alkene, first order in the rhodium concentration, first
order in hydrogen, and the reaction shows a negative order in ligand concentration
(phosphine or CO, or both).
5.3.3. Kinetic Modeling
5.3.3.1. Empirical Model
A comparison of the experimental rates of reaction and those predicted by the developed
kinetic model of M1, M2 and M3 showed high average standard error estimate ranging
from 15% to 45% besides having negative kinetic parameters. This result suggests that a
different mechanism is operating when excess ligands are presence in the reaction
system. Hence a new empirical and mechanistic model were developed for the
hydroformylation of 1-octene and 1-dodecene in the TMS system of PC/dodecane/1,4-
dioxane using HRhCO(PPh3)3/P(OPh)3 catalyst for the ranges of process conditions listed
in Table 4.2. Figure 5.27 is a typical profile obtained at 363 K and initial concentrations
of 1.9 kmol·m-3 1-octene and 0.17 mol·m-3 HRh(CO)(PPh3)3. Similar profiles were
obtained for 353 and 373 K. In each case, the reaction was allowed to proceed until the
nonanal concentration was asymptotic to its equilibrium value.
The concentration-time profiles of nonanal and 2-methyloctanal were curve fitted by
a cubic polynomial ofthe form
(5.20)
129
Page 150
where [ Cald] is the concentration of aldehyde (kmol·m-3) and tis the time (s), to determine
the reaction rate of the formation of nonanal and 2-methyloctanal at the initial time.
Values of the constants u, p, and y which were found are given in Table 5.8. The
polynomials were subsequently differentiated to give reaction rates (in kmol·m·3·s-1) as a
function of time to produce initial reaction rates for fitting against those predicted by a
suitable model.
2
1.8
1.6
1.4
0.§ 1.2
0 g ~ 0.8
0.6
0.4
0.2
0
0
--1-octene
--+- nonanal
__.._ 2-methyl-octana~I...---
W ~ W W 100 1W 1~
Time(min)
Figure 5.27: Typical plot of concentrations of 1-octene, nonanal and 2-methyloctanal
versus reaction time.
Table 5.8: Constants in polynomial fitting nonanal concentration vs. time'
T(K) ax 102 P X 105 y X 109 R
(kmol·m-3) (kmol·m·3s-1
) (kmol·m-3s-2)
353 1.02 2.73 -2.57 0.985
363 1.33 4.48 -4.34 0.987
373 1.63 5.07 -4.64 0.980
*Reaction conditions: P- 1.5 MPa, YH21Yco- Ill, 1-octene- 1.9 kmol·m·3, HRh(CO)(PPh3) 3 ~ 1.73x!0"3
kmol·m·3, P(OPh),!HRh(CO)(PPh3), ~ 12, PC/dodecane/1,4-dioxane='0.30/0.10/0.60.
130
Page 151
In order to validate the model, the rate versus concentration data was then used to
determine the parameters by fitting with the experimental rate. The non-linear least
square regression based on the criterion of minimization of the statistical parameter mean
residual sum of squares ( tP) was performed to determine the selectivity and kinetic
parameters. Activation energy was obtained by means of Arrhenius equation with
'temperature centering' as outlined in Section 3.7.3. In the present study Tm = 363 K was
used for temperature centering and parameter estimation. The following models were
found to best fit the data at all the temperatures studied.
k[ octene] [catalyst JPcoPH Rate= '
(I + KcoPco )m
Selectivity= 0.75 [octener0·15 [catalyst] 0·
26 Pco -1.2 PH - 0·77 T"1.3 (LIR) 0
·25
2
(5.21)
(5.22)
where [octene] is the concentration of 1-octene; [catalyst] is the concentration of
HRh(CO)(P(OPh)J)J in the reaction mixture; Pco is the partial pressure of CO; PH2 is the
partial pressure of H2; T is the absolute temperature and LIR is the ratio of
P(OPh)J/HRh(CO)(PPh3)J. Table 5.9 summarizes the values of the optimized parameters
and the average standard error of estimation (SEE) and tP values of the non-linear
regression analysis for the empirical rate model (Equation (5.21)) at 353, 363 and 373 K.
Table 5.9: Estimated kinetic model parameters with 95% confidence limit
T k Kco m tPmin SEE
(K) m3 kmor1 MPa·2 s·1 (MPa.1) (xlO"ll) (%)
353 5.5 0.52 1.72 1.54 5.97
363 11.1 1.18 1.60 5.00 6.35
373 19.7 2.24 1.36 3.79 4.26
131
Page 152
The rate constant, k increased with increasing temperature from 353 to 373 K. Generally,
the rate constant doubled with every ten degree increase in temperature. However, the
optimized values of the rate parameter, Kco. suggests that the effect of inhibition of CO
on the rate of reaction increases with a change of temperature from 353 to 373 K. The
optimized values of the rate parameter m (1.36 to 1.72) also suggests that the inhibition of
CO in the TMS-system is comparatively lower compared to those in conventional organic
solvent based system, biphasic system and scCOz which is probably due to the lower
solubility of CO in the TMS- system (Palo and Erkey, 1999; Deshpande et a!., 1996;
Divekar eta!., 1993; Deshpande and Chaudhari, 1988).
The selectivity model (Equation (5.22)) describes the dependence of selectivity
(n/iso) on the concentration of 1-octene and catalyst, partial pressure of Hz and CO and
also the ratio of ligand to catalyst. The regressed values of the parameter for PH is -0.77 2
which means that the formation of branched aldehyde is more favoured at increasing Hz
pressure. Similar findings were reported by van Rooy et a!. (1995) for the
hydroformylation of styrene using Rh(CO)z(acac) as the catalyst precursor and tris(2-tert
butyl-4-methylphenyl)phosphite as the ligand (T = 353 K, [Rh(CO)(acac)] = 0.25
mol·m·3, P/Rh = 20, [styrene]= 0.89 kmol·m·3 in 20 mL of toluene). The regressed values
of the parameter for Pco suggests that increases in Pco have a detrimental effect on the
n:iso ratio. Mechanistically, increases in [CO] enhance the formation of the active species
F over against the active species G (Figure 5.30). Since the CO ligand is much less
sterically demanding than the phosphine, selectivity decreases as the [G]/[F] ratio
increases. [1-0ctene]o does not significantly affect the final n:iso ratio. However, it was
observed that selectivity decreased slightly over the course of the reaction for each
experiment in this study. Similar results were observed for the hydoformylation of 1-
octene in scC02 solvent system (Palo and Erkey, 1999). However, in an aqueous biphasic
solvent system, high selectivity was achieved with increase in olefin concentration (Yang
et a!., 2002), whereby the reported parameter was 0.156. Catalyst concentration also had
a direct effect on the n:iso ratio of the aldehyde products. Such selectivity dependence on
catalyst concentration is typical of rhodium/phosphine systems and is related to the
degree of phosphine dissociation from B in solution. The selectivity dependence on the
ratio ofligand to catalyst concentration follows the same trend. The isomerization step is
132
Page 153
slightly suppressed towards high ligand/metal ratios in homogeneous and microemulsion
systems (Unveren, 2004 ). Under such conditions the metal center presents a more
sterically hindered environment to the alkene and the formation of linear alkyl and acyl
species are favored. As only the branched alkyl rhodium species will form internal
alkenes, the amount of the internal alkenes diminish. With the ligand/metal ratio of 20,
the internal octenes that are formed via isomerization are not hydroformylated as the 1-
octene conversion begins to decrease. As in the hydroformylation of other substrates such
as styrene and cyclohexene in conventional solvent system, an increase in temperature
leads to a considerable decrease of selectivity toward the linear aldehyde (van Leeuwen
and Claver, 2000).
A comparison of the experimental rates of reaction and selectivity and those predicted
by the model are presented in Figures 5.28 and 5.29, respectively, for all the
temperatures, which show a good agreement.
2.0 .,~
1.8 •353 K M
00
:.s 1.6 •363 K
0
] •373K ~ 1.4 " '§ 1.2 c 0
1.0 ·p <.)
"' e 0.8 ""' %1 0.6 :; ~ 0.4 <.)
" 0.2 ~
0 ~
0.0
0.0 0.2 0.4 0.6 0.8 In 1.2 1.4 1.6 1.8 2n
104 x experimental reaction rate (kmolm.3s1)
Figure 5.28: Parity plot of the experimental and calculated reaction rates using Eq .( 5.21 ).
133
Page 154
12
10
c
~ 8
~ 6 " ·~ " ~ 4
2
0
0 2 4 6 8 10 12
Calculated n!iso
Figure 5.29: Parity plot of the experimental and calculated selectivity (n/iso) using
Equation (5.22).
The prediction of the selectivity by using Equation (5.22) was found to be within ±3.2%
error, whereas the rate equation predicts within ±5.5 % error. The activation energy was
found to be 69.8 kJ.mor', which lies in the range of activation energy values (66-75
kJ·mor1) reported by other workers for the hydroformylation of 1-octene with different
Rh-complexes by homogeneous, biphasic and supported aqueous phase catalysis, SAPC
(Jauregui-Haza et al., 2001; Deshpande eta!., 1996; Hermann eta!., 1992; Arhancet et
al., 1991).
5.3.3.2. Mechanistic model
In this work, a model based on key mechanisms is also proposed. The main objective is
to establish a molecular mechanism for the hydroformylation of !-olefin in the presence
of excess P(OPh)3 ligand. Experimental results have shown that the hydroformylation
reaction is sensitive to experimental conditions. Therefore, the plausible reaction pathway
described in Figure 5.30, for the hydroformylation reaction in the presence of excess
ligand and Rh-catalyst is different than the one proposed in Chapter 3.
134
Page 155
H H H L I/, I L LIt, I __!::..__
''Rh-CO ~ 'Rh-CO-L,~,_ I
'Rh-L L ...... l OC ..... I co L ...... I co
co 2 co 1 co c B A
H
I L-Rh-L
I 4 co
OHC~RfD n-product
11 H 2 ~~ L-Rh-L
E
"Y ~'Yo '·Rh-CO 12 L-Rh-L
L ...... l I co co
M J
I co F
71l co
'~ ''Rh-CO L ...... l
co H
6\::0 YR
L-Rh-CO
I co G
8 1l co
LYR
..,..:Rh-CO oc 1
co K
10 1~
oc-~•-<-" co 0
N
1 13
y CHO R-< iso-prod uct
Figure 5,30: Plausible steps for rhodium catalyzed hydroformylation in the presence of
excess concentration ofP(OPh)J ligand (L =ligand).
135
Page 156
Qualitative reasomng and some available experimental observations as outlined in
Section 3.5, form the basis of the scheme (van Leeuwen, 2004; van der Veen eta!., 2000;
Musaev eta!, 1995; Jongsma et al., 1991; Brown and Kent, 1987). In the presence of
excess ligand, the dissociation of phosphite ligand to form monophosphite catalyst is less
feasible. According to van Leeuwen and Claver (2000), at moderate P(OPh)3
concentrations, the resting state of the catalyst is B, which undergoes P(OPh)3
dissociation to form selectively 4-coordinate intermediate D. Since the reaction was
carried out using excess P(OPh)3 ligand, the complexes shown in Figure 5.30 contain at
least two coordinated P(OPh)3 ligands. The reaction pathways depicted in Figure 5.30
was used to develop mechanistic rate equations using the conventional quasi -steady state
formalism.
Assumptions used in Chapter 3 to develop the mechanistic model for the
hydroformylation of higher olefins in homogeneous system were also applied. Three rate
equations (Model AI, A2 and A3) have been developed corresponding to the three
transition states identified by the quantum chemical calculations. The following reaction
steps (Figure 5.30) are considered.
B +CO """ C kz, -2
B """D + CO k,, .J
D + RCH=CHz """ F k,,..,
D + CO+ RCH=CHz """ G
F+ CO ~'f'
J +Hz ~ RCHzCHzCHO + D
(5.23)
(5.24)
(5.25)
(5.26)
(5.27)
(5.28)
Equations (5.23) to (5.28) and the simplifying assumptions were used to derive
relationships between the rate of reaction and experimental parameters (i.e.
concentrations of olefin, catalyst, dissolved CO, as well as Hz). Kinetic model (AI) has
been developed using the oxidative addition of hydrogen as a rate determining step
(RDS) (Equation (5.28)). Taking into account that the overall hydroformylation rate is
given by the rate of this step, the rate equation is expressed as
136
Page 157
(5.29)
The following expressions for the concentrations of the different intermediates can be
written in terms of the equilibrium constants of the reactions and intermediate J.
[B]= [J] K
2K
3K
5 [aiken~
(5.30)
[D]- [J] - K
3K
5[co][alkene]
(5.31)
[c] Kl [J] [co] K
2K
3K
5 [alkene]
(5.32)
[F] [J] (5.33)
K5
[co]
[G]= K4[J]
K3K5 (5.34)
An expression for the concentration of the species [ J] can be obtained from a total
catalyst balance at steady state.
[Catalyst] = [B] + [C] + [D] + [F] + [J] (5.35)
where [Catalyst] is the concentration of catalyst loaded and hence,
[1{1 + K;[co]+K;[co]Z + K;[alkene]+ K;[alkene][coJ) [catalyst]= (5.36)
K*[co ][alkene]
137
Page 158
Equation (5.36) was rearranged to obtain the expression for [J] and in tum substituted in
Equation (5.Z9) to give the rate Model AI ofthe following form:
k[catalyst ][alkene][co J[ Hz J Rate= *
I+ K; [co]+ K; [coj2 + K3 [alkene]+ K; [co][alkene] (5.37)
where K * , K; -K; are constant derived from the equilibrium constants of elementary
steps in the reaction mechanism in Figure 5.30.
The second kinetic model (AZ) was proposed considering the migration insertion of
the alkene into R-H, is assumed as a rate limiting step (Equation (5.Z5)). The rate of the
reaction is given by
Rate = k3
[D ][alkene] (5.38)
The corresponding rate equation can be derived in the form (Model AZ)
k[catalyst][alkene][coJ[ Hz] Rate= . (5.39)
(1 + K;[coj2 + K;[a!kene]+ K;[co][alkenel)[ Hz]+ K;[co][a!kene]
Similarly, considering the formation of the acyl complex is rate-controlling (Equation
5 .Z7), the rate equation is expressed as
Rate= k 5 [F ][co] (5.40)
and the following rate equation (Model A3) was obtained
Rate k[catalyst ][alkene][co] [ H2 J
.,------------.,-------=----"--c,---------. (5.41) (1 + Kt[co] + K;[co]Z + K;[alkene]+ K;[co][alkeneJ)[ H2]+ K;[co][alkene]
138
Page 159
The 'equilibrium constant', K, was similarly determined as a function of temperature
using the van't Hoff equation also with temperature centering. The error estimate (SEE)
given by Equation (3.6) together with thermodynamic consistency of the calculated
activation energy or negative kinetic parameter, if any, were used as the criteria of
discrimination among the three rate models (Patel and Pant, 2007; Hurtado et a!., 2004;
Pengpanich et a!., 2002).
As shown in Table E-2, Appendix E, Model A3 showed high average standard error
estimate ranging from 7% to 15% besides having negative kinetic parameters. In addition
the obtained activation energies are lower than the range of activation energy values (57-
75 kJmor1) reported by other workers for the hydroformylation of 1-octene and 1-
dodecene with different Rh-complexes by homogeneous, biphasic and supported aqueous
phase catalysis, SAPC (Jauregui-Haza et a!., 2003; Bhanage eta!., 1998; Deshpande et
a!., 1996; Hermann et al., 1992; Arhancet eta!., 1991). On the other hand, Model A2 was
rejected because it displayed a non-linear Arrhenius plot. As it is seen in Figure 5.31-
5.34, the rate model AI is able to describe the experimental data reasonably well over the
whole range of pressure, concentrations of the olefins (1-octene and 1-dodecene) and
temperature.
l.2
~
-~
" .§ 0.8 0
] § 0.6
" " li ,::! 0.4
0.2
+ 353K " 363 K + 373K
A
--modeled (Eq. 5.37) 0~-~-~-~~~--~
0 0.2 0.4 0.6 0.8 l.2
0.5 ~-----------~
-~ "oo
0.4
~ 0 0.3 g
"b
0.1
• 353 K 4 363 K B • 373K
--modeled (Eq. 5.37)
0 0.2 0.4 0.6 0.8 l.2 1.4 1.6
Pea (MPa)
Figure 5.31: Effect of partial pressure of CO on the rate of hydroformylation of 1-octene (A) and 1-dodecene(B). Reaction conditions: PH, = 1.5 MPa, 1-olefins = 1.9 kmol·m-3
, HRh(CO)(PPh3) 3
= 1.73xl0-4 kmol·m-3, P(OPh)31HRh(CO)(PPh3) 3 = 12, PC/dodecane/1,4-dioxane=0.30/0.J0/0.60.
139
Page 160
1.4 1.2
• 353 K A • 353 K B 1.2 .1. 363 K .1. 363 K •
+373 K + 373 K ~
~
-Modeled (Eq. 5.37) ~ -Modeled (Eq. 5.37) .. ~~
~ 0.8 ·a 0 0
g 0.8 ~ ~ 0.6 0 v 0
-;:; 0.6 ~ "' " ~~ 0.4 o;
0.4 ~
0.2 0.2
0 0 0 0.3 0.6 0.9 1.2 0 0.2 0.4 0.6 0.8 1.2 1.4 1.6
P"' (MPa) PH2 (MPa)
Figure 5.32: Effect of partial pressure of H2 on the rate of hydroformylation of 1-octene (A) and
1-dodecene (B). Reaction conditions: Pea= 1.0 MPa, YH21Yco = 1/1, 1-olefins = 1.9 kmol·m"3,
HRh(CO)(PPh3)3 = 1.73x!0-4 kmol·m·3, P(OPh)3/HRh(CO)(PPh3) 3 = 12, PC/dodecane/1,4-
dioxane=0.30/0.l 0/0.60.
1.8 0.6
• 353 K • 353 K 1.6 .1. 363K
0.5 • ~ 1.4 • 373 K ~
~ --modeled (Eq. 5.37) "s 1.2 ~~ 0.4
0 ~ • s 0 c g v 0.3 0
? 0.8 0
"' ~ B ~
~~ "' 0.6 " 0.2 ~ o; ~
0.4 0.1
0.2
0 0
0 2 3 4 5 0 2 3 4 5
Cone. of I -oetene (kmolm'3) Cone. of I -dodecene (kmolm·3)
Figure 5.33: Effect of concentration of !-olefin on the rate of hydroformylation of 1-octene {A)
and 1-dodecene (B). Reaction conditions: P = 1.5 MPa, YH21Yco = Ill, HRh(CO)(PPh3) 3 =
1.73x!O"' kmol·m·3, P(OPh)3/HRh(CO)(PPh3) 3 = 12, PC/dodecane/1,4-dioxane=0.30/0.10/0.60.
140
Page 161
3~--------------------~
2.5
0.5
• 353 K .lo. 363 K • 373 K
---modeled (Eq. 5.37
A
o~~~~~~~~~~~~ 0 2 4 6 8
Cone. of catalyst, Cx104 (kmolm"3)
1.6 ~--------------------~
1.4
-" 1.2 ·~
"'s
l b 0.8 ~
>< ~ 0.6
~ 0.4
0.2
0
• 353K
.lo. 363K
• 373K
-modeled (Eq. 5.37)
2 3
Cone. of catalyst, Cx104 (kmolm-3)
4
Figure 5.34: Effect of concentration of catalyst on the rate of reaction: 1-octene (A} and 1-
dodecene (B). Reaction conditions: P = 1.5 MPa, YmiYco = 1/1, 1-octene = 1.9 kmol·m-3,
P(OPh)3/HRh(CO)(PPh3) 3 = 12, PC/dodecane/1 ,4-dioxane=0.30/0.l 0/0.60.
3
.,~ • 1-dodecene ~
"'s 2.5 • 1-octene 0 ]
2 ~
~ " 0
1.5 ·;::: 0
"' e ., B 1 "' '3
-¥ 0
0.5 >< ~
0 -0
0 0.5 1 1.5 2 2.5 3
104 x experimental reaction rate (kmolm-35 1)
Figure 5.35: Parity plot of the model predictions of the rate of hydroformylation of 1-
octene and 1-dodecene in TMS-systems ofPC/dodecane/1,4-dioxane (0.30/0.10/0.60).
141
Page 162
As Figure 5.35 displayed convincingly, the rate model Al describes the experimental
data of both substrates satisfactorily. The estimated parameters as well as the activation
energy and error estimates are presented in Table 5.1 0.
Table 5.10: Estimated Al kinetic model parameters with 95% confidence limits
Substrate T k K' K' K' K' SEE Ea I 2 3 4
(K) (%) (kJ moi"1)
1-octene 353 5.1x10 0.88 0 4.5 66.3
Cs 363 8.0x10³ 2.0x10² J.3x103 6.8x10·3 0 373 J.Ox104 2.3x10² 9.7xJ02 9.7xJ0·6 0
1-dodecene 353 7.1x10² 0.99 2.4x10³ 0.63 9.0x10·2 3.6 76.1 cl2 363 J.3x103 5.28 2.2x10³ 0.17 4.8xJ0·2
373 2.8x10³ 34.8 2.0x10³ 2.0x10·2 0.10
Since a negative order with respect to Pea is observed experimentally, the concentration
term of CO is raised to a higher power in the denominator than in the numerator
(Helfferich, 2001). The regressed values of K;' andK; for both substrates are relatively
large and suggest that the effect of the Pea inhibition on the rate of reaction is highly
significant. As Pco increases the denominator increases significantly compared to the
numerator leading to a rapid decline in the reaction rate. On the other hand, high
concentration of alkene in the presence of excess P(OPh3)J ligand leads to a first order
kinetic, and, in turn, the alkene-containing terms in the denominator is expected to have
insignificant effect on the rate of reaction.
Equation (5.37) explains the inverse order dependence of the reaction rate on
dissolved carbon monoxide concentration at high CO pressure. The rate parameters in the
denominator are derived from the equilibrium constants of elementary steps in the
reaction mechanism. Therefore, the regressed rate parameters can be used to estimate the
rate of the elementary steps. For instance, the large value of K; implies that the rate of
dissociation and association ofligand, step 2 in Figure 5.30 is high. However, the value
of Kt suggests that step 3 occurs at 3 orders of magnitude slower compared to step 2. On
the other hand, difference of two orders of magnitude lower in the rate constant of the
142
Page 163
alkene insertion step (step 5 and 6) with respect to step 3 was also observed and
consistent with the experimental value reported in open literature (van Leeuwen, 2000).
From the regressed value of(, the rate of the carbonyl insertion step (step 8) was found
to be greater by three orders of magnitude compared to the alkene insertion step.
Comparing the regressed values of the rate constant, k at 353, 363 and 373 K, the
values of k are higher for 1-octene than 1-dodecene. Activation energy of 66.3 and 76.1
kJ·mor1 were determined for the hydroformylation of 1-octene and 1-dodecene,
respectively. Generally, the results suggest that the activation energy of the
hydroformylation of higher olefins in the TMS-system is higher compared to the
conventional organic solvent based system (46.2 to 69.7 kJ·mor1). The average deviation
between experimental and calculated rate of reaction was found to be in the range of ±
4.0 %. Model AI seems to give a slightly better description compared to the empirical
model (±5.5 %) but this could be mainly attributed to the great flexibility arising from
their structure having five (model AI) instead of three (empirical model, Equation (5.22))
rate parameters. The results also support previous findings in demonstrating that under
the experimental conditions listed in Table 4.3, the acylrhodium complex is the resting
state and oxidative addition ofH2 is rate determining (van Leeuwen and Claver, 2000).
5.4. Liquid-liquid Equilibrium Study
This work presented the liquid-liquid ternary equilibrium data of a TMS-system
consisting of PC, dodecane and 1 ,4-dioxane, at atmospheric pressure and four different
temperatures (298.15, 313.15, 333.15 and 353.15 K). The distributions of 1-octene,
nonanal, triphenylphosphite ligand and HRh(CO)(PPh3)3 catalyst were measured at
atmospheric pressure and two different temperatures (298.15 and 308.15 K) to model the
extraction efficiency for a typical reaction, the hydroformylation of 1-octene. The liquid
liquid equilibria and solute distributions were also predicted using the UNIFAC and
UNIQUAC models.
143
Page 164
5.4.1. Liquid-liquid Equilibrium Data
The experimental binodal curves of the TMS-system obtained by cloud titrations at 298,
313, 333 and 353 K are shown in Figures 5.36, 5.37. 5.38 and 5.39, respectively. The
isothermal3-component phase diagram (PC+dodecane+l,4-dioxane) shows a closed loop
at all the experimental temperatures.
0.1~~~· 0~-*--¥--*--¥--*--¥--*--¥--¥~
PC I 0.9 0.8 0.7 0.6 0.5 0.4 0.3 0.2 0.1 0 Dodecane
Figure 5.36: LLE ternary diagram for PC+dodecane+l,4-dioxane at 298.15 K; (V)
experimental binodal curve; (•) experimental tie lines data;(---) calculated (UNIQUAC)
tie lines and (-) calculated (UNIFAC) tie lines.
144
Page 165
0.1 +-7<-*--7<-*--7<---c>E-"-*----cK-"--7< 0~~~~~~~~~-*-*-~-~~
PC I 0.9 0.8 0. 7 0.6 0.5 0.4 0.3 0.2 0.1 0 Dodecane
Figure 5.37: LLE ternary diagram for PC+dodecane+l,4-dioxane at 313.15 K; (V) experimental
binodal curve; (•) experimental tie lines data; (---) calculated (UNIQUAC) tie lines and (-)
calculated (UNIF AC) tie lines.
0.1 +-7<-*---7\~>E--7<-i~*---7~-7<.
0~-*~~~~~*--*~~~~~ PC I 0.9 0.8 0.7 0.6 0.5 0.4 0.3 0.2 0.1 0 Dodecane
Figure 5.38: LLE ternary diagram for PC+dodecane+J,4-dioxane at 333.15 K; (V) experimental
binodal curve; (•) experimental tie lines data; (---) calculated (UNIQUAC) tie lines and (-)
calculated (UNIF AC) tie lines.
145
Page 166
0.1 -K--7E---*-*--l<f--*-*--l<:---=
0~~--*-~--*-~--*--*--*--*~ PC I 0.9 0.8 0.7 0.6 0.5 0.4 0.3 0.2 0.1 0 Dodecane
Figure 5.39: LLE ternary diagram for PC+dodecane+1,4-dioxane at 353.15 K; (V) experimental
binodal curve; (•) experimental tie lines data; (---) calculated (UNIQUAC) tie lines and (-)
calculated (UNIF AC) tie lines.
The miscibility gap or heterogeneous sphere of the system decreased with increasing
temperature. The experimental tie-line compositions of the equilibrium phases at 298 and
308 K for the (TMS-system+1-octene), (TMS-system + nonanal), (TMS-system+1-
octene+nonanal), and (TMS-system+ 1-octene+nonanal+ triphenylphosphite+catalyst)
systems were summarized in Appendix J.To show the selectivity of the TMS-system in
extracting the reactant (1-octene), product (nonanal), ligand (triphenylphosphite) and
catalyst (HRh(CO)(PPh3)3), distribution coefficients (D;) for these compounds (1-octene,
nonanal, triphenylphosphite, HRh(CO)(PPh3)3) are defined as follows:
Weight fraction in nonpolar phase
Weight fraction in polar phase (5.42)
The distribution coefficients for each equilibrium system and temperature are given in
significantly decreases the distribution coefficient of 1-octene and nonanal. According to
Behr et a!. (2005), the addition of trans-4-octene into the ternary system of
146
Page 167
PC+dodecane+p-xylene does not affect the position of the binodal curve. On the other
hand, the addition of nonanal has a significant effect on the phase behavior of the solvent
system. The binodal curves at 298 K and 353 K move closer to each other. However, the
distributions of catalyst remain unchanged with or without the presence of 1-octene,
nonanal and triphenylphosphite. The minimum distribution coefficient for 1-octene and
nonanal are 1.33 and 1.75, respectively and on the other hand the maximum distribution
coefficient for HRh(CO)(PPh3)3 and P(OPh)3 are 0.034 and 0.23, respectively. These
results suggest that the extraction of 1-octene, nonanal, HRh(CO)(PPh3)3 and P(OPh)3 by
the TMS-system from a l-octene+nonanal+HRh(CO)(PPh3)3+P(OPh)3 mixture is
possible. The extraction capacity of the TMS- system at each temperature, plots D vs, x,
for 1-octene, nonanal and HRh(CO)(PPh3)3 are given in Figures 5.40-5.42, respectively.
25.--------------------.
• 298.15 K
• •308.15K 20
i 15 9
10
5
0+----.-----.----,----o.oo 0.10 0.20 0.30 0.40
X 1-octene in nonpolar phase
Figure 5.40: Distribution coefficient D of 1-octene as a function of the mass fraction x of
1-octene in the non polar phase.
147
Page 168
30
• 298.15K
25 • 308.15 K
20
.. 0 • 0 15 0 0
Q
10
• 5
0
0.00 0.10 0.20 0.30 0.40
Xnonanal
Figure 5.41: Distribution coefficient D of nonanal as a function of the mass fraction x of
nonanal in the non polar phase.
0.04
0.035 • 298.15
• 308.15 0
0.03 ~ ~ ~ • 0
0.025 ~
0 0 0
.5 :;:- 0.02 ~ 0. 0 0 O.Ql5 8 ;;! " 0.01 -Q •
0.005
0
0 0.2 0.4 0.6 0.8 1.2 4
X catalyst (x 10 }
Figure 5.42: Distribution coefficient D of HRh(CO)(PPh3)3 catalyst as a function of the
mass fraction x of HRh(CO)(PPhJ)J in the non polar phase.
148
Page 169
The capacity of the extraction of the TMS system towards 1-octene decreases with the
concentration of 1-octene in non polar phase at both 298 and 308 K. However, the data in
Table 5.11 shows that capacity of extraction of the TMS system towards nonanal and
HRh(CO)(PPh3)3 increases with the concentration of nonanal and HRh(CO)(PPh3)3 in the
nonpolar phase. The effect of temperature change on the distribution is expected because
the phase behavior of the TMS system is temperature dependent.
Table 5.11: Distribution coefficients of species in TMS- system
TMS+octene 298.15 13.05 7.78 4.12
308.15 8.33 7.04 3.70
TMS+nonanal 298.15 22.96 13.71 18.40
308.15 20.80 12.02 16.81
TMS+HRh(CO)(PPh3) 3 298.15 0.0188 0.0156 0.0301
308.15 0.0000 0.0167 0.0132
TMS+ 1-octene+nonanal 298.15 12.69 21.25 7.57 12.64 4.04 17.59 2.32 33.97 2.92 2.63
308.15 8.17 17.48 6.85 11.39 3.64 15.53 2.01 26.66 1.52 1.75
149
Page 170
According to Sorensen and Art! (Chafer et a!., 2008), PC+dodecane+ I ,4-dioxane
ternary system is a type-! system with only one liquid pair having very low miscibility
(PC+dodecane) and two liquid pairs being miscible (PC+ 1,4-dioxane and 1,4-dioxane+
dodecane). In this system, the non polar phase is on an average 78 wt% dodecane while
the polar phase contains up to 75 wt% 1,4-dioxane. From these results, a highly effective
extraction of the polar catalyst is expected, with nonpolar products easily extracted using
dodecane. The differences in organic partitioning arise mainly from differences in
polarity of the semi-polar solvent used in each system. I ,4-Dioxane has a non polar
backbone, which causes it to be soluble in nonpolar dodecane, but because 1 ,4-dioxane
has a compact chemical structure and polar ether bonds, it is partially soluble in the C12
nonpolar phase. The amphiphilic character of this molecule causes it to distribute
favourably in the polar phase. Although this property may not allow for effective product
extraction (Robbins eta!., 2007), it may be good for catalyst extraction.
5.4.2 Thermodynamic modeling
Liquid-liquid equilibrium (LLE) calculations were carried out by solving the
thermodynamic criteria and mass balance equation
2,x{ = 2,x[I =I i i
(5.43)
(5.44)
where I and II represent equilibrium phases and x is liquid phase mole fraction and y the
activity coefficient. Several models are available for the calculation of activity
coefficients. In the present work UNIQUAC and UNIF AC models were used to correlate
and interpret the experimental LLE data. The UNIQUAC and UNIF AC equations have
found wide application for the description of liquid phase excess properties, owing to its
sound theoretical background (Fredenslund, 1989; Robbins et a!., 2007; Fahim and
Merchant, 1998). However, LLE data are often fitted by UNIQUAC, because it provides
a satisfactory description for many typical mixtures and because it is relatively simple
!50
Page 171
with its only two adjustable parameters. Its wide range of applicability is also one of the
advantages. A comparison is then made of the prediction accuracy of the models.
5.4.2.1. UNIQUAC (UNiversal QUAsi-Chemical) model
Abrams and Prausnitz (1975) extended the quasi-chemical theory of liquid mixtures to
solutions containing molecules of different sizes. This extension is called the UNIQUAC
theory. The UNIQUAC model consists of two parts, the combinatorial part, which
describes the prominent entropic contribution and residual part, which is due to the
intermolecular forces that are responsible for the enthalpy of mixing. The combinatorial
part involves the sizes and shape of the molecules and requires only pure component
data. The residual part depends on the intermolecular forces and involves two adjustable
binary parameters. The UNIQUAC equation expresses the molar excess Gibbs energy as
a sum of a combinatorial part and residual part.
gE = gE (combinatorial) + gE (residual) (5.45)
The combinatorial part accounts for differences in the size and shape of the molecules,
whereas the residual contribution accounts for energetic interactions.
The UNIQUAC activity coefficient for multicomponent systems is given by
(5.46)
where
t, =G}cr,-q.)-Cr,-1) (5.47)
z is a co-ordination number(= 10 usually), B. and¢. are the volume fraction and the
surface area fraction of the component i, respectively and given by:
!51
Page 172
(5.48)
(5.49)
where r; is the molecular-geometric volume parameter of pure component, and q; is the
molecular-geometric surface parameter of pure component that can be estimated by the
Bondii's method.
The interaction parameter is given by
r .. =ex _Y {-G··J u T (5.50)
where the interaction parameter au is a temperature dependent function which is assumed
as
(5.51)
Thus, there are two binary parameters au and aji in the UNIQUAC model and these are
found by fitting LLE data.
5.4.2.2. The UNIFAC (UNIQUAC Functional Group Activity Coefficients) model
The group contribution method is more effective in predicting the activity coefficient of
the components compared to other methods. The effectiveness of this method depends on
the division of solution into number of interacting groups. As the mutual behavior of
interacting groups cannot be determined experimentally, only certain thermodynamic
model can be used, where the interaction parameters are determined from the behavior of
!52
Page 173
a real system. The group contribution method, namely UNIFAC has found wide
application in practice.
The UNIF AC model is also based on the assumption that the contribution to the
activity coefficient of component i can be separated into two parts, namely, combinatorial
part (molecular size contribution) and residual part (intermolecular forces):
lnr; =lnr( +lnr{ (5.52)
The size of a molecule is accounted in the combinatorial part and the actual interaction
between the groups is accounted in the residual part. The other assumption is that, the
contribution from interaction between molecular groups can be expressed as the sum of
the individual contributions of each solute group in the solution minus the sum of the
individual contributions ofthe pure molecular species:
lny{ = Ivm;{lnrm-lnr~l) m=l
(5.53)
where rm is the activity coefficient of group m in the mixture and r~> is the activity
coefficient of group min pure compound i. rm are functions of group fraction. The group
fraction is defined as
(5.54)
where Vk; is the content of the group k in molecules of component i, N the number of
components and g is the number of various groups in the mixture.
The combinatorial part of the UNIF AC equation can be expressed as follows:
(5.55)
where
!53
Page 174
(5.56)
(5.57)
q; and r; are proportional to the surface area and volume of molecule i, which were
estimated on the basis of Rk and Qk values of the corresponding individual groups in the
ith molecule, using the following relationship:
where Vk; is the number of k groups in the molecule of component i.
The residual part of the group activity coefficient was found using
where
(5.58)
(5.59)
(5.60)
(5.61)
Interaction parameter \f'jk is considered to be dependent on temperature as given below
(-a jk J
'I'jk =exp -y:- (5.62)
where parameters ajk were estimated on the basis of experimental data (Magnussen et a!.,
1981). The van der Waals relative volume and surface of the components (r and q),
needed for UNIQUAC and UNIF AC calculations, were estimated using group
!54
Page 175
contribution method and the required data were collected from Magnussen eta!. (1981)
and Bondi (1964). Since the study ofLLE systems contain a maximum of7 components,
the calculations of the residual component of the UNIQUAC and UNIFAC models
will be too complex. Therefore, PC, dodecane and 1 ,4-dioxane molecules are considered
to be one 'test' molecule which is called TMS. This has been assumed for simplicity. The
estimated components surface area (r) and volume (q) are given in Table 5.12.
Table 5.12: UNIF AC parameters rand q of the components
Compound r q
TMS (PC+dodecane+l,4-dioxane) 13.5629 12.790
HRh(CO)(PPh3)3 12.210 10.778
P(OPh)3 3.290 2.900
1-0ctene 4.715 3.875
Nonanal 6.620 5.576
Propylene carbonate 3.584 3.178
Dodecane 17.092 14.192
1,4-Dioxane 3.185 2.640
However, the UNIFAC and UNIQUAC parameters for the interaction between TMS
(PC+dodecane+l,4-dioxane), HRhCO(PPh3)J, P(OPh)J and other functional groups
studied are not available in the literature. Therefore, it has been necessary to estimate
these parameters before the suitability of the model can be tested. These parameters for
the systems studied have been estimated by using one-half of the experimental LLE data
set. In fact, the alternate data points were used for parameter estimation and the rest were
used to test the applicability of the model. The following objective function was used to
minimize the errors in the estimation of the interaction parameters where n denotes tie
lines k = 1 to n, phases j= 1 and 2, components i= 1 ,2 and 3, x•xp and xcal are the
experimental and calculated liquid phase mole fraction, respectively.
(5.63)
!55
Page 176
The interaction parameters of the UNIQUAC and UNIFAC model were estimated using
different initial guess values. Different sets of the interaction parameters were obtained
based on the different initial guess values with minimum error difference or for same
error in the calculated values. These results indicate the importance of the initial guess,
and the possibility of the multiple parameters sets resulting from the minimization
procedure of the UNIQUAC model. This may be due to the inter-correlation of the
interaction parameters. The estimated interaction parameters of UNIQUAC and UNIF AC
equations are given in Table 5.13 and 5.14, respectively.
Table 5.13: Binary interaction parameters ofUNIQUAC equation
Temperature (K) i-j UNIQUAC interaction parameters (K) ar G·i
298.15 K TMS-cata1yst -6934.9 468.9
TMS-1-octene 6131.3 -467.2
TMS-nonana1 310.9 -61.8
TMS-tripheny1phosphite -6013.1 -203.7
HRh(CO)(PPh3)r 1-octene -100.7 -1019.8
HRh(CO)(PPh3) 3-nonana1 -79.6 79.5
HRh(CO)(PPh3) 3- tripheny1phosphite 10.0 -486.4
1-octene-nonana1 -232.7 -126.0
1-octene-tripheny1phosphite 276.8 757.9
Nonana1-tripheny1phosphite 12.0 2760.8
308.15 K TMS-cata1yst -6934.9 400.3
TMS-1-octene 6131.3 -460.6
TMS-nonana1 335.6 -48.0
TMS-tripheny1phosphite -6013.1 -175.8
HRh(CO)(PPh3) 3-1-octene -311.7 -1019.8
HRh(CO)(PPh3) 3-nonana1 -411.8 79.5
HRh(CO)(PPh3) 3- tripheny1phosphite 10.0 -486.4
1-octene-nonana1 -142.2 -125.5
1-octene-tripheny1phosphite 276.8 808.4
Nonana1-tripheny1phosphite 12.0 2760.7
!56
Page 177
Table 5.14: Interaction parameter a1k of the UNIF AC equation
min CH3 C=C CHO 1MS P(OPh)3 HRh( CO )(PPh3) 3
CH3 0 76.54 158.1 4671.05 1001.03 -2909.55
C=C 292.3 0 -214.7 -293.92 -1141.79 1937.54
CHO 146.1 517 0 5782.18 1333.07 1575.04
TMS -9159.88 730.33 154.72 0 -2952.94 774.23
P(OPh)3 845.93 6988.01 2149.36 -36.81 0 -3191.55
HRh( CO )(PPh3) 3 -10.74 5207.96 1668.82 -566.36 -294.60 0
Table 5.15: The average deviation (%) of the experimental data from the calculated
weight fractions using UNIQUAC and UNIF AC model
LLE system Temperature
298.15 K 308.15 K
UNIQUAC model
TMS-1-octene 0.33 0.66
TMS-nonanal 0.26 0.55
TMS- HRh(CO)(PPh3)3 0.10 0.16
TMS+ 1-octene+nonanal 0.42 0.86
TMS+ 1-octene+nonanal+ 1.13 1.49
triphenylphosphite+ HRh(CO)(PPh3)3
UNIF AC model
TMS-1-octene 0.30 1.38
TMS-nonanal 0.81 1.95
TMS- HRh(CO)(PPh3)3 3.31 3.30
TMS+ 1-octene+nonanal 1.25 1.35
TMS+ 1-octene+nonana1+ 3.05 3.09
triphenylphosphite+ HRh(CO)(PPh3)3
157
Page 178
Using the estimated interaction parameters of the models, the tie line data at different
temperatures were predicted. The distribution coefficient of 1-octene, nonanal,
triphenylphosphite and catalyst was also measured. The average deviation of the
predicted results by UNIQUAC and UNIF AC methods were reported. The deviation is
defined by the following equation:
dev =...!._I Jx~• - x7xp J x I 00 N i=I
(5.64)
where N is the number of experimental points and the superscripts 'exp' and 'cal' denote
the experimental and calculated values, respectively. The average deviation of the
calculated mole fractions from the experimental values for the UNIQUAC and UNIF AC
method is shown in Table 5.15. The comparison of experimental tie line data of the
ternary PC+ I ,4-dioxane+dodecane and TMS+ 1-octene+nonanal system with those
calculated from the UNIQUAC and UNIFAC model is shown in Figure 5.36 to 5.39 and
Figure 5.43 to 5.44, respectively. Both models fit the data well in the both ternary system
at the given temperature. On the basis of the obtained deviations we conclude that both
UNIQUAC and UNIFAC methods can be satisfactorily used to predict all the LLE
system. However, UNIQUAC activity coefficient model leads to the best description of
the experimental results for all LLE system. The limitation of the UNIQUAC model is
the inability to explain the physical significance of the interaction parameters and their
values. On the other hand, multiple set of interaction parameters is able to predict the
LLE data equally good, hence the uniqueness of the interaction parameters was not there.
!58
Page 179
Figure 5.43: LLE ternary diagram for ternary (TMS+nonanal+ 1-octene) systems at 298.15 K; ( •)
experimental tie lines data;(---) calculated (UNIQUAC) tie lines and(-) calculated (UNIFAC)
tie lines.
0 TMS I 0.9 0.8 0.7 0.6 0.5 0.4 0.3 0.2 0.1 0 1-0ctene
Figure 5.44: LLE ternary diagram for ternary (TMS+nonanal+ 1-octene) systems at 308.15 K; (•)
experimental tie lines data;(---) calculated (UNIQUAC) tie lines and(-) calculated (UNIFAC)
tie lines.
!59
Page 180
While the predictions of the ternary behavior were similar for both UNIF AC and
UNIQUAC, there was a significant difference in predicting the distribution coefficients
as shown in Table 5.16. UNIQUAC predicted well the distribution coefficients in all LLE
system. For the UNIFAC model, the prediction of the distribution of the HRh(CO)(PPh3)3
catalyst deviated from the measured values by several orders of magnitude and
consistently over predicted the concentration of 1-octene, nonanal and HRh(CO)(PPhJ)J
catalyst in the polar phase. The deviations may be due to the limitations of the UNIF AC
model. One deficiency is the limited availability of information on functional groups. In
addition UNIF AC method only accounts for first-order structural differences and
therefore, cannot distinguish between isomers or account for group-proximity effects
within molecules. Therefore, further studies are required to better quantify the
interactions between functionalities, as well as the role of molecular structure in
multifunctional compounds.
Table 5.16: Experimental and predicted distribution of 1-octene, nonanal and
HRh(CO)(PPh1)3 in TMS+ l-octene+nonanal+P(OPh3)3+HRh(CO)(PPh3)3 system
Dl-octene Dnonanal lJrJRh(CO)(PPhJ)J
Expt UNJQUAC UNIFAC Expt UNIQUAC UNIFAC Expt UNIQUAC UNIFAC
298K
14.4 15.8 11.4 26.78 25.8 5.6 0.019 0.045 0.0036
7.9 9.6 5.6 13.08 18.7 3.5 0.015 0.016 0.0075
5.7 6.3 2.8 15.26 21.4 1.9 0.034 0.012 0.0014
2.6 3.7 2.1 18.67 28.7 1.3 0.024 0.010 0.0034
5.0 6.8 4.7 14.80 14.7 2.0 0.012 0.0097 0.0022
308K
8.2 9.9 6.1 24.93 29.3 5.2 0.016 0.025 0.0013
6.9 7.9 5.8 10.71 17.8 3.2 0.013 0.038 0.0008
3.6 4.3 2.7 12.49 16.2 1.7 0.033 0.052 0.0022
2.0 3.8 1.7 16.80 21.9 1.2 0.022 0.012 0.0019
1.5 2.7 0.6 9.50 13.5 1.9 0.009 0.0038 0.0021
160
Page 181
5.5. Additional Validation ofUNIQUAC and UNIFAC Model
Additional validation of the UNIQUAC and UNIFAC model was also performed to judge
the overall model performance and provides one indication of expected model accuracy.
The UNIFAC and UNIQUAC model were validated by comparing model predictions to
existing LLE data obtained from the semi-batch hydroformylation reactor. It should be
noted that the sample data used for model parameterization do not include reactor data
Therefore the validation represents a "fair test" of the model's predictive abilities given
the constraints of the data set. The experimental LLE data at temperature of 298 K were
compared with those predicted using the UNIQUAC and UNIFAC model. As it is seen in
Fignre 5.45, the theoretical predictions ofLLE data using UNIQUAC model were found
to be within a maximum error of ±6.5 %, whereas UNIF AC predicts within ±8.2 % error.
Modeling showed that the UNIF AC model can be used for prediction of solute
distribution in the studied solvent systems. However, UNIQUAC model is able to
describe the experimental data with a better accuracy over the whole range of the
operating conditions. The predicted LLE data using UNIQUAC model was close to that
obtained from reaction runs. The results also indicate that the UNIQUAC and UNIF AC
model can be extended to predict the distribution data of real catalytic systems.
1.0
• phosphite 0.9 • phosphite
0.9 IITMS IITMS
0.8 AI. 1-octene 0.8 .1.1-octene
" X nonanal " 0.7 x nonanal 0 0.7 ·£ ., ~ 0.6
)I( catalyst Jl 0.6 )I( catalyst
"' "' ·~ 0.5 ·~
0.5 ~ ~ 'C 'C
" " ~ 0.4 ~ 0.4
.,; u
0.3 .. 0.3 u u
0.2 A 0.2
B 0.1 0.1
0 0.0 0.0 0.2 0.4 0.6 0.8 1.0 0.0 0.2 0.4 0.6 0.8 1.0
Experimental weight fraction Experimental weight fraction
Figure 5.45: Parity plots of the model predictions of the LLE data of TMS+loctene+nonanal+triphenylphosphite+HRh(CO)(PPh3)3 system at temperature of 298 K. (A) UNIQUAC model; (B) UNIFAC model
161
Page 182
CHAPTER6
CONCLUSION AND RECOMMENDATIONS
6.1 Conclusion
In this work, a thermomorphic solvent (TMS) system composed of propylene carbonate
(PC), dodecane and I ,4-dioxane were developed for investigating hydroformylation of
two higher olefins - 1-octene and 1-dodecene, using a homogeneous catalyst consisting
of HRh(PPh3)3(CO) and P(OPh)J. The study began with the determination of the
solubilities of Hz and CO in pure solvent and solvent mixtures relevant to the
hydroformylation process, particularly in the TMS-systems involving PC, dodecane and
I ,4-dioxane. Findings indicated that PC and TMS-systems have a considerably higher
affinity for CO and Hz compared to the biphasic solvent mixture. The measured
solubilities were tested against empirical model and activity coefficient models based on
the regular solution theory (RST) withY en and McKetta extension for polar solvents and
the UNIF AC group contribution method. The logarithmic empirical model provided good
fit to the experimental data except for Hz-PC and CO-PC systems. The theoretical
predictions of solubility by using modified UNIF AC were found to be within a maximum
error of± 8.5 %, whereas RST based model predicts within 11.0 % error.
The effects of reaction condition including solvent composition, partial pressures of
the gaseous reactants- CO and Hz, reaction temperature and catalyst loading on the yield
and selectivity of the linear aldehydes were investigated. Experimental results show that
the shift of equilibria between various active species with varied reaction conditions
seems to be a determining factor in the hydroformylation reactions. Low ligand/metal
ratios and high syngas pressure lead to the formation of unmodified rhodium carbon
species with the characteristic of high reaction rates and low selectivities. Isomerization
and hydroformylation were in competition in the reaction of 1-octene. Hydroformylation
of isomerization products (2-octene, 3-octene) disturbs the initial linear aldehyde
selectivity. This disturbance should be taken into consideration for process improvement.
Moreover, the initial aldehyde selectivity seems to be affected by reaction conditions
such as temperature, total pressure of syngas, partial pressure of CO and ligand to catalyst
162
Page 183
ratio. No significant change was observed in the selectivity by varying the concentration
of the substrate, olefin. In addition, it is observed that the TMS- system leads to an
enhancement in the catalytic activity, which is also comparable with the one under
homogeneous conditions. In the hydroformylation of 1-octene using TMS-system of
PC/dodecane/1 ,4-dioxane, highest selectivity for n-nonanal with average activity is
observed at temperature of 363 K, equimolar of CO/Hz, total syngas pressure of 1.5 MPa,
ligand/catalyst ratio of 12 and TMS composition of 0.1/0.3/0.6. Although most of the
rhodium in the TMS- system can be separated by simple phase separation, the determined
rhodium loss (in the range of 0.6-6 ppm) is still not economically acceptable. Further
separation process is required accompanied by the phase separation for the complete
catalyst recovery. However, the thermomorphic solvent system proved to have potential
as a reaction medium in practical applications of the higher olefins hydroformylation.
Kinetic results obtained for the hydroformylation of 1-octene and 1-dodecene, are in
good accordance with each other. The hydroformylation activity using 1-octene seems to
be higher than 1-dodecene. The effects of concentration of the olefins, catalyst loading,
partial pressure of CO and Hz and temperature on the rate of reaction have been studied at
353, 363 and 373 K. The rate was found to be first order with respect to catalyst, 1-octene
and partial pressure of Hz. The rate vs. Pco shows a typical case of substrate inhibited
kinetics. The rate model with Hz-addition as the controlling step was found to represent
the rate data. The rate model predicted the conversion of the two alkenes satisfactorily
with an average absolute error of ±4.0 % only.
Experimental liquid-liquid equilibrium (LLE) data for the ternary system
PC+dodecane+ 1 ,4-dioxane at varying temperature and the distribution of 1-octene,
nonanal, and HRh(CO)(PPh3)3 catalyst in this system indicate that the TMS- system may
serve as a feasible reaction medium and could be useful in extracting products from
systems containing recyclable amphiphilic ligands and organometallic catalysts. The
experimental tie lines were compared to the values predicted by the UNIQUAC and
UNIFAC models. UNIQUAC predicted well the distribution coefficients in all LLE
systems. For the UNIF AC model, the predictions of distribution coefficient consistently
over predicted the concentration of 1-octene, nonanal and HRh(CO)(PPh3)3 in the polar
phase. The UNIFAC and UNIQUAC model were further validated by comparing model
163
Page 184
predictions to existing LLE data obtained from the semi-batch hydroformylation reactor.
The theoretical predictions of LLE data using UNIQUAC model were found to be within
a maximum error of ±6.5 %, whereas UNIF AC predicts within ±8.2 % error indicating
that both models can be extended to predict the distribution data of real catalytic systems.
Mechanistic studies of the hydroformylation of higher olefins using Rh-phosphine
catalyst were investigated using theoretical approaches. The ab initio computational
methodology is found to be a reliable tool for arriving at the reaction energetics and
pathways in the hydroformylation of higher olefins. These information together with
experimental data proves to be effective in developing macroscopic practically useful rate
models. Mechanism of reaction featuring oxidative addition of H2 to acylrhodium
intermediate species as rate determining is found to describe the hydroformylation of all
the four substrates - namely, 1-dodecene, 1-decene, 1-octene and styrene without the
addition of free phosphine ligand. The rate model predicted the conversion of all the four
olefins quite satisfactorily with an average deviation of 7.6 % and maximum deviation of
13 %. As for the potential energy surface fitting, the current approach is still limited to
small molecules. In this study, although the PPh3 was used in experiments, we had to use
PH3 due to the computational limitations. This limitation comes from the lack of efficient
representation of molecules, the complexity in computing the primary and secondary
invariants, and the cost in obtaining the high quality ab initio energies. Considering the
fast development of the computer techniques, it is still very promising to construct highly
accurate potential energy surfaces for large molecule systems.
6.2 Recommendations for Future Work
The capabilities of computational chemistry have expanded rapidly over the last 3 - 4
decades, as hardware has become orders of magnitude more powerful and software has
become more efficient and sophisticated. In this study, the kinetic and equilibrium
parameters of the kinetic models were estimated by nonlinear least square regression of
experimental data. In future work it will be interesting to determine the kinetic and
equilibrium parameters in the mechanistic model as well as the activation energy from
the first-principles calculations, in combination with statistical mechanics, although some
additional assumptions may be required to derive the pre-exponential factors. In order to
164
Page 185
evaluate the accuracy of this approach, the predictions of the first-principles based kinetic
model should be validated by comparison with experimental data for the
hydroformylation of higher olefins. Similarly, the approach should also apply to the
hydroformylation of higher olefins using Rh/P(OPh)3 catalyst in TMS- system.
According to Matsubara eta!., (1997), the coordinatively unsaturated intermediates in the
catalytic cycle are strongly coordinated and stabilized by a solvent olefin molecule, while
the transition states are not solvated. However, we believe that higher olefin coordination
to coordinatively unsaturated intermediates is less favourable kinetically because of the
size of the carbon chain which would sterically inhibit an olefin from solvating the
intermediate. Therefore, the role of solvation in hydroformylation of higher olefins
should be assessed and compared with lower olefins.
Developing a TMS-system with an efficient catalyst recycling capacity for
hydroformylation of higher olefins should be a realistic possibility. The simple and
efficient catalyst recycling concept gives the TMS-system the unique feature to perform
hydroformylation reaction at a lower operating cost. An important aspect for industrial
application is the complete recovery of the catalyst. Rhodium loss by organic phase after
phase separation is in a range of 0.6-6 ppm in the nonpolar phase, therefore additional
separation step is necessary for the total recovery of the expensive catalyst. Since basic
task of separating catalyst from product has already be achieved by the phase separation
additional membrane processes can enhance further work-up of the homogeneous
catalyst. The Rh-phosphite catalyst can be separated using a solvent resistant
nanofiltration (SRNF) membrane or a rugged inorganic membrane. For example, use of
asymmetric polyamide membranes have been investigated in the nanofiltration of phase
transfer catalysts and Wilkinson catalyst (chlorotris(triphenylphosphine)-rhodium(I),
from reaction mixtures (Luthra eta!., 2002; Scarpello et a!., 2002)
165
Page 186
REFERENCES
Abrams, D.S., Prausnitz, J.M. (1975). Statistical thermodynamics of liquid mixtures: A
new expression for the excess Gibbs energy of partly or completely miscible systems.
A!ChE J., 14, 135-144.
Annesini, M.C., Gironi, F. Marreill, L., K.ikic, I. (1985). Liquid-Liquid Equilibria for
Ternary Systems Containing Hydrocarbons and Propylene Carbonate J Chern. Eng.
Data, 30, 195-196.
Anthony, J.L. (2004). Gas solubilities in ionic liquids: experimental measurements and
applications. PhD thesis, Univ. of Notre Dame, p. 93.
Antunes, C., Tassios, D. (1983). Modified UNIFAC model for the prediction of Henry's
constants. Ind. Eng. Chern. Process Des. Dev. 22,457-462.
Arhancet, J.P., Davis M.E., Merola, J.S., Hanson, B.E. (1990). Supported aqueous-phase
catalysts. J Catal. 121, 327-339.
Bahrmann, H., Bogdanovic, S., Leeuwen, P.W.N.M.V. (2004). Aqueous-Phase
Organometallic Catalysis, seconded. Wiley-VCH, 391-395.
Bandres, I., Giner, I., Pera, G., Giner, B., Lafuente, C. (2007). Vapour-liquid equilibrium
of cyclic ethers with 1-chlorohexane: Experimental results and UNIFAC predictions.
Fluid Phase Equilib., 257, 70-77.
Becke, A.D. (1993). Density-functional thermochemistry. III. The role of exact exchange.
J Chern. Phys. 98, 5648.
Behr, A., Fangewisch, C. (2003). Rhodium-catalysed synthesis of branched fatty
compounds in temperature-dependent solvent systems. J Mol. Catal. A: Chern., 197:
115-126
Behr, A., Henze, G., Obst, D., Turkowski, B. (2005a). Selection process of new solvents
in temperature-dependent multi-component solvent systems and its application in
isomerising hydroformylation. Green Chern., 7, 645-649.
Behr, A., Obst, D., Turkowski, B. (2005b). Isomerizing hydroformylation of trans-4-
octene to n-nonanal in multiphase systems: acceleration effect of propylene carbonate.
J Mol. Catal. A: Chern., 226:215-219.
166
Page 187
Behr, A., Miao, Q. (2004). A new temperature-dependent solvent system based on
polyethylene glycol 1000 and its use in rhodium catalyzed co-oligomerization. J. Mol.
Catal. A: Chern., 222:127-132.
Behr, A., Roll, R. (2005). Hydroaminomethylation in thermomorphic solvent systems. J.
Mol. Catal A: Chern., 239:180-184.
Bell, S., Dines, T.J., Chowdhry, B.Z., Withnall, R. (2007). Computational chemistry
using modem electronic structure methods. J. Chern. Edu. 84, 1364-1370.
Beller, M., Comils, B., Frohning, C.D., Kohlpaintner, C.W. (1995). Progress m
hydroformylation and carbonylation. J. Mol. Catal. A, 104, 17-85.
Bergbreiter, D.E., Liu, Y.S., Osburn, P.L. (1998). Thermomorphic Rhodium(!) and
Palladium (0) Catalysts. J. Am. Chern. Soc., 120, 4250-4251.
Bhaduri, S., Mukesh, D. (2000). Homogeneous Catalysis: Mechanisms and Industrial
Applications. John Wiley and Sons, ISBN 0471372218, 9780471372219.
Bhanage, B.M., Divekar, S.S., Deshpande, R.M., Chaudari R.V. (1997). Kinetics of
hydroformylation ofl-dodecene using homogeneous HRh(CO)(PPh3)3 catalyst. J. Mol.
Catal. A Chern. 115,247-257.
Bianchi, M., Piacenti, F., Frediani, P., Matteoli, U. (1977). Hydroformylation of
deuterated olefins in the presence of cobalt catalysts ' : II. Experiments at low pressure
of carbon monoxide. J. Organomet. Chern., 137:361, 1977.
Bianchini, C.P., Semau, V. (1995). Zwitterionic Metal Complexes of the New
Triphosphine Na03S(C6H4)CHzC(CHzPPhz)3 in Liquid Biphasic Catalysis: An
Alternative to Teflon "Ponytails" for Facile Catalyst Separation without Water
Organometallics, 14: 5458-5459.
Bohnen, H., Comils, B. (2003). Hydroformylation of Alkenes: An Industrial View of the
Status and Importance. Chemlnform, 34, 17.
Bondi, A. (1964) van der Waals volumes and radii. The Journal of Physical Chemistry,
68,441-451.
Brady, C.J., Cunningham, J.R., Wilson, G.M. (1982). Water-hydrocarbon liquid-liquid
vapour equilibrium measurements to 530°F, Research report RR-62, Gas Processors'
Association, Provo, UT.
167
Page 188
Breman, B.B., Beenackers, A.A. (1996). Thermodynamic models to predict gas-liquid
solubilities in the methanol synthesis, the methanol-higher alcohol synthesis, and the
Fischer-Tropsch synthesis via gas-slurry processes. Ind. Eng. Chern. Res. 35, 3763-
3775.
Broussard, M.E., Juma, B., Train, S.G., Peng, W.J., Laneman, S.A., Stanley, G.G. (1993).
Science, 260, 1784.
Brown, C.K., Wilkinson, G. (1970). Homogeneous hydroformylation of alkenes with
hydridocarbonyltris-(triphenylphosphine)rhodium(I) as catalyst. J. Chern Soc. (A),
2753-2764.
Brown, J.M., Kent, A. G. (1987). Structural characterisation in solution of intermediates
in rhodium-catalysed hydroformylation and their interconversion pathways. J. Chern.
Soc., Perkin Trans. 2, 1597-1607.
Cavallotti, C., Rota, R., Faravelli, T., Ranzi, E. (2007). Ab initio evaluation of primary
cyclo-hexane oxidation reaction rates. Proceedings of Combustion Inst. 31, 201-209.
Chafer, A., de Ia Torre, J., Monton, J.B., Lladosa, E. (2008). Liquid-liquid equilibria of
the systems isobutyl acetate+isobutyl alcohol+water and isobutyl
acetate+isobutylalcohol+glycerol at different temperatures. Fluid Phase Equilibria,
265, 122-128.
Chapoy, A. 2004. Phase behaviour in water/hydrocarbon mixtures involved in gas
production systems. Ph.D. Thesis, Ecole Des Mines De Paris, p. 241.
Chen, H., Li, Y.Z., Chen, J.R., Cheng, P.M., He, Y.E., Li, X.J., (1999). Micellar effect in
high olefin hydroformylation catalyzed by water-soluble rhodium complex. J. Mol.
Catal. A, 149, 1-6.
Chen, J., Alper, H. (1997). A Novel Water-Soluble Rhodium-Poly(enolate-co-vinyl
alcohol-co-vinyl acetate) Catalyst for the Hydroformy1ation of Olefins. J. Am. Chern.
Soc., 119 (5): 893-895.
Chemyak, Y. (2008). Phase Equilibria in Binary Mixtures of Water with Cyclic Alkylene
Carbonates. J. Chern. Eng. Data, 53, 603-606.
Chiba, K., Kono, Y., Kim, S., Nishimoto, K, Kitano, Y., Tada, M. (2002). A liquid-phase
peptide synthesis in cyclohexane-based biphasic thermomorphic systems. Chern.
Commun., 1766-1767.
168
Page 189
Comils, B., Herrmann, W.A. (2004). Aqueous-phase Organometallic Catalysis; 2nd ed.
Wiley-VCH.
Comils, B., Herrmann, W.A. (2002). Applied Homogeneous Catalysis with
Organometallic Compounds, seconded. Wiley-VCH, pp. 31-103.
Costa, R., Kristbergsson, K. (2009). Predictive Modeling and Risk Assessment; Springer,
ISBN: 978-0-387-33512-4.
Cotton, F. A., Wilkinson, G. (1988). Advanced Inorganic Chemistry; 5th ed. Wiley
Interscience: USA.
Coutinho, K.J., Dickson, R.S., Fallon, G.D. Jackson, W.R., De Simone, T., Skelton,
B.W., White, A.H. (1997). Isolation and characterization of hydroformylation
'intermediates' from stoichiometric reactions between phosphinoalkenes and some
heterobinuclear complexes. J. Chern. Soc., Dalton Trans., 3193-3199.
Cuevas, R.M., Eustaquio-Rinc6n, R., Romero-Martlnez., A., Trejo, A. (1995).
Experimental liquid-liquid miscibility curves for binary systems: ethanenitrile and
butanenitrile with n-alkanes. Fluid Phase Equilibria, 107,201-212.
De Paz, J.L., Ciller, J. (1993). On the use of AMI and PM3 methods on energetic
compounds. Propellents, Explosives, Pyrotechnics, 18, 33-40.
Deshpande, R.M., Chaudari, R.V. (1988). Kinetics of 1-hexene using homogeneous
HRh(CO)(PPh3) 3 complex catalyst. Ind. Eng. Chern. Res. 27, 1996-2002.
Deshpande, R. M., Chaudhari, R. V. (1989). Hydroformylation of Vinyl Acetate Using
Homogeneous HRh(CO)(PPh3)3 Catalyst: A Kinetic Study. J. Mol. Catal., 57, 177.
Deshpande, R.M., Divekar, S.S., Bhanage, B.M., Chaudhari, R.V. (1992). Effect of
solvent on the kinetics of hydroformylation of 1-hexene using HRh(CO)(PPh3) 3
catalyst. J. Mol. Catal. 77, 113-117.
Deshpande, R.M., Bhanage, B.M., Divekar, S.S., Chaudhari, R.V. (1993). Solvent effects
in hydroformylation of 1-octene using HRh(CO)(PPh3)3: Effect ofPPh3 addition on the
rate of reaction. J. Mol. Catal. 78, L37-L40.
Deshpande, R.M., Purwanto, R.P., Delmas, H., Chaudhari, R.V. (1996). Kinetics of
Hydroformylation of 1-0ctene using [Rh(COD)Cl]2-TPPTS complex catalyst in a two
phase system in the presence of a cosolvent. Ind. Eng. Chern. Res. 35, 3927.
169
Page 190
Divekar, S.S., Deshpande, R.M., Chaudhari, R.V. (1993). Kinetics of hydroformylation
of 1-decene using homogeneous HRh(CO)(PPh3)3 catalyst: a molecular approach.
Catal. Lett., 21, 191-200.
Diwakar, M.M, Deshpande, R.M., Chaudhari, R.V. (2005). Hydroformylation of 1-
hexene using Rh/TPPTS complex exchanged on anion exchange resin: kinetic studies.
J. Mol. Catal. A: Chern., 232:179-186.
Dorset, D.L. (1990). Binary phase behavior of perfluoroalkanes. Macromolecules, 23:
894-901.
Drent, E and Jager, W.W. (1995). Shell Int. Res., GB 2.282.137.
Evans, D., Osborn, J., Wilkinson, G. (1968). Hydroformylation of alkenes by use of
rhodium complex catalysts. J. Chern. Soc. A. 3133-3142.
Fahim, M.A., Elkilani, AS. (1991). Prediction of the solubility of hydrogen in naphtha
reformate using the modified UNIF AC Group Contribution Method. Ind. Eng. Chern.
Res. 30, 255-259.
Fahim, M.A., Merchant, S.Q. (1998). Liquid-liquid equilibria of systems containing
propylene carbonate and some hydrocarbons. J. Chern. Eng. Data, 43, 884-888.
Fogg, P.G.T., Gerrard, W., (1991). Solubility of Gases in Liquids: A Critical Evaluation
of Gas/Liquid Systems in Theory and Practice. Wiley, Chichester.
Foster, D. F., Gudmunsen, D., Adams, D. J., Stuart, A. M., Hope, E. G., Cole- Hamilton,
D. J.; Schwarz, G. P.; Pogorzelec, P. (2002). Hydroformylation in perfluorinated
solvents; improved selectivity, catalyst retention and product separation. Tetrahedron,
58, 3901-3910.
Fredenslund, A. (1989). UNIFAC and related group-contribution models for phase
equilibria. Fluid Phase Equilibria, 52, 135-150.
Fredenslund, A., Gmehling, J., Rasmussen, P. (1977). Vapor-liquid equilibria using
UNIF AC. Elsevier, Amsterdam.
Garton, R.D., Ritchie, J.T., Caers, R.E. (2003). Hydroformylation process improvement
in catalyst recovery. PCT International Applications, WO 2003/082789 A2: 20.
Gholap, R.V., Kunt, O.M., Bourne, J.R., (1992). Hydroformylation of propylene using
unmodified cobalt carbonyl catalyst: Selectivity Studies. Ind. Eng. Chern Res., 31,
2446-2450.
170
Page 191
Gmehling, J., Li, J., Schiller, M. (1993). A Modified UNIFAC Model. 2. Present
Parameter Matrix and Results for Different Thermodynamic Properties. Ind. Eng.
Chem.Res.,32, 178-193.
Gmehling, J., Rasmussen, P., Fredenslund, A. (1982). Vapour-liquid equilibria by
UNIF AC group contribution: revision and extension 2. Ind. Eng. Chern., Proc. Des.
Dev., 21, 118-127.
Hartounian, H. and Allen, D.T. (1988). Group Contribution Methods for Coal-Derived
Liquids. Fuel, 67, 1609-1614.
Haumarm, M., Koch, H., Hugo, P., Schomacker, R. (2002). Hydroformylation of 1-
dodecene using Rh-TPPTS in a microemulsion. Applied Catal. A: General 225: 239-
249.
Heck, R.F. and Breslow, D.S. (1961). The reaction of cobalt hydrotetracarbonyl with
olefins. JAm. Chern. Soc., 83,4023-4027.
Hehre, W.J., Radom, L., Schleyer, P.V., Pople, A.J. (1986). Ab initio Molecular Orbital
Theory New York: John Wiley and Sons, ISBN: 9780471812418.
Helfferich FG. Kinetics of homogeneous multistep reactions. (2001). Elsevier Science,
Amsterdam, Netherlands. 38, pp.l67-168.
Herrmann, W.A., Kohlpaintner, C.W., Bahrmarm, H., Konkol, W. (1992). Water-soluble
metal complexes and catalysts Part 6. A new, efficient water-soluble catalyst for two
phase hydroformylation of olefins. J Mol. Catal., 73, 191-201.
Hildebrand, J.H., Cochran, D.R.F. (1949). Liquid-Liquid Solubility of
Perfluoromethylcyclohexane with Benzene, Carbon Tetrachloride, Chlorobenzene,
Chloroform and Toluene. JAm. Chern. Soc., 71:22-25.
Hildebrand, J.H., Scott, R.L. (1948). Solubility of electrolytes and non-electrolytes. J
Am. Chern. Soc. 424, 9.
Hohenberg, P., Kohn, W. (1964). Inhomogeneous Electron Gas. Phys. Rev. 136, B864.
Horvath, LT., Rabai, J. (1994). Facile Catalyst Separation Without Water: Fluorous
Biphase Hydroformylation ofOlefins. Science, 266,72-75.
Horvath, LT. (1990). Hydroformylation of Olefins with the Water Soluble
HRh(CO)[P(m-C6H4S03Na)3h in Supported Aqueous-Phase. Is it Really Aqueous?
Catal. Lett., 6, 43-48.
171
Page 192
Hu, Y. and Xu, Y. (1985). Molecular thermodynamics of gas solubility. Fluid Phase
Equilib., 23: 15-40.
Huang, L., He, Y., Kawi, S. (2004). Catalytic studies of aminated MCM-41-tethered
rhodium complexes for hydroformylation of 1-octene and styrene. J. Mol. Catal. A,
213,241-249.
Hurtado, P., Ordonez, S., Sastre, H., Diez, F.V. (2004). Development of a kinetic model
for the oxidation of methane over Pdf Ah03 at dry and wet conditions. Applied Catal.
B: Environmental. 51,229-238.
Jauregui-Haza, U.J., Dessoudeix, M., Ph. Kalck, Wilhelm, A.M., Delmas, H. (2001).
Multifactorial analysis in the study of hydroformyaltion of oct-1-ene using supported
aqueous phase catalysis. Catal. Today, 66, 297-302.
Jiiuregui-Haza, U.J., Pardillo-Fontdevila, E., Wilhelm, A.M., Delmas, H., (2004).
Solubility of hydrogen and carbon monoxide in water and some organic solvents. Latin
American Applied Research 34, 71-74.
Jin, Z.L., Zheng, X., Fell, B. (1997). Thermoregulated phase transfer ligands and
catalysis. I. Synthesis of novel polyether-substituted triphyenylphosphines and
application of their rhodium complexes in two-phase hydroformylation. J. Mol. Catal.
A: Chern., 116: 55-58.
Johnson, T.H. (1985). US Patent, 4.584.411.
Jongsma, T., Challa, G., van Leeuwen, P.W.N.M. (1991). A mechanistic study of
rhodium tri(o-t-butylphenyl)phosphite complexes as hydroformylation catalysts.
Organometal. Chern. 421, 121.
Karakhanov, E.A., Yu. S. Kardasheva, A. L. Maksimov, V. V. Predeina, E. A. Runova
and A.M. Utukin (1996). Macrocomplexes on the basis offunctionalized polyethylene
glycols and copolymers of ethylene oxide and propylene oxide: synthesis and catalysis.
J. Mol. Catal. A: Chem.,107, 235-240.
Katayama, H. (1999). Liquid-liquid equilibria of two ternary systems: methanol
cyclohexane including 1,3-dioxolane or 1,4-dioxane in the range of 277.79-308.64 K.
Fluid Phase Equilibria 164, 83-95.
172
Page 193
Kiss, G., Mozeleski, E.J., Nadler, K.C. Van Driessche, E., DeRoover, C. (1999).
Hydroformylation of ethene with triphenylphosphine modified rhodium catalyst:
kinetic and mechanistic studies. J. Mol. Catal. A: Chern. 138, 155-176.
Kojima, K and Tochigi, K. (1979). Prediction of vapor-liquid equilibria by the ASOG
method. Elsevier, Kodansha, Tokyo.
Kolar, P., Nakata, H., Shen, J.-W., Tsuboi, A., Suzuki, H., Ue, M. (2005). Prediction of
gas solubility in battery formulations. Fluid Phase Equilib .. 228-229, 59-66.
Kiillhofer, A., Plenio, H. (2003). Homogeneous Catalysts Supported on Soluble
Polymers: Biphasic Sonogashira Coupling of Aryl Halides and Acetylenes Using
MeOPEG-Bound Phosphine-Palladium Catalysts for Efficient Catalyst Recycling.
Chemistry-A European Journal, 9, 1416-1422.
Le Bris, C., Defranceschi, M. (2000). Mathematical Models and Methods for ab initio
Quantum Chemistry, Lecture Notes in Chemistry, vol. 74, Springer, Berlin.
Lee, C., Yang, W., Parr, R.G. (1988). Development of the Colle-Salvetti correlation
energy formula into a functional of the electron density. Phys. Rev. B, 37, 785.
Lee, K.Y. and Peters, C.A. (2004). UNIF AC Modeling of Cosolvent Phase Partitioning in
Nonaqueous Phase Liquid-Water Systems .. Envir. Engrg., 130, 478-483.
Li, J., Vanderbeken, I., Ye, S., Carrier, H., Xans, P. (1997). Prediction of the solubility of
gas-liquid equilibria for gas-water and light hydrocarbon -water systems at high
temperatures and pressures with a group contribution equation of state. Fluid Phase
Equilib., 131, 107-118.
Lide, D.R. (2005). CRC Handbook of Chemistry and Physics, Internet Version. CRC
Press, available from: http://www.hbconetbase.com
Liu, C., Jiang, J., Wang, Y., Cheng, F., Jin, Z. (2003). Thermoregulated phase transfer
ligands and catalysis XVIII: synthesis of N,N-dipolyoxyethylene-substituted-2-
(diphenylphosphino)phenylamine (PEO-DPPPA) and the catalytic activity of its
rhodium complex in the aqueous-organic biphasic hydrformylation of 1-decene. J. Mol.
Catal. A: Chern., 198, 23-27.
Liu, X., Li, H., Wang, Y., Jin, Z.J. (2002). Polyether phosphite for hydroformylation of
higher olefins in non-aqueous system and catalyst recovery. J. Organomet. Chern., 654:
83-92.
173
Page 194
Luo, X., Tang, D., Li, M. (2005). Quantum investigation on the mechanism of
isomerization of 1-butylene catalyzed by Rh-complex. J. Mol. Struc.: THEOCHEM.
731, 139-147.
Luthra, S.S., Yang, X., Freitas dos Santos, L.M., White, L.S., Livingston, A.G. (2002).
Homogeneous phase transfer catalyst recovery and re-use using solvent resistant
membranes. J. Membrane Science 201, 65-75.
Magnussen, T., Rasmussen, P., Fredenslund, A. (1981). UNIFAC parameter table for
prediction ofliquid-liquid equilibria. Ind. Eng. Chern. Process Des. Dev. 20,331-339.
Master, C. Homogeneous Transition Metal Catalysis, Chapman Hall, New York, 1977.
Matsubara, T., Koga, N., Ding, Y., Musaev, D. G. Morokuma, K. (1997). Ab Initio MO
Study of the Full Cycle of Olefin Hydroformylation Catalyzed by a Rhodium Complex,
RhH(CO)z(PH3)2. Organometallics 16, 1065-1078.
Merrick, J.P., Moran, D., Radom, L. (2007). Evaluation of harmonic frequency scale
factors. J. Phys. Chern. A, Ill, 11683-11700.
Miller, S.A., Ekstrom, A., Foster N.R. (1990). Solubility and mass transfer coefficients
for hydrogen and carbon monoxide in n-octacosane. J. Chern. Eng. Data 35, 125-127.
Mohsen-Nia, M., Nekoei, E., Mohammad Doulabi, F.S. (2007). Ternary (liquid+ liquid)
equilibria for mixtures of (methanol + aniline + n-octane or n-dodecane) at T =
298.15 K. J. Chern. Thermodynamics 40, 330-333.
Monteil, F., Queau, R., Kalck, P. (1994). Behaviour of water-soluble dinuclear rhodium
complexes in the hydroformylation reaction of oct-1-ene. J. Organomet. Chern. 480,
177-184.
Musaev, D.G., Matsubara, T., Mebel, A.M., Koga, N., Morokuma, K. (1995). Ab initio
molecular orbial studies of elementary reactions and homogeneous catalytic cycles with
organometallic compounds. Pure & Appl. Chern. 67, 257-263.
Nair, V.S., Mathew, S.P., Chaudhari, R.V. (1999). Kinetics of hydroformylation of
styrene using homogeneous rhodium complex. J. Mol. Catal. A: Chern. 143, 99-110.
Natta, G., Ercoli, R., Castello, S., Barbieri, F.H., (1954). The influence of hydrogen and
carbon monoxide partial pressures on the rate of the hydroformylation reaction, J. Am.
Chern. Soc., 76, 4049.
Novak, J.P., Mautous, J., Fick, J. (1987). Liquid-liquid equilibria. Elsevier.
174
Page 195
Ollis, D.F., Turchi, C., (1990). Heterogeneous Photocatalysis for Water-Purification -
Contaminant Mineralization Kinetics and Elementary Reactor Analysis.
Environmental Progress. 4, 229-234.
Onada, T. (1993). Staying ahead in hydroformylation technology. Chemtech, 23,34-37.
Osborn, J.A., Wilkinson, G., Young, J.F. (1965). Mild hydroformylation of olefins using
rhodium catalysts. Chern. Commun. (London), 2, 17.
Othmer, D.F., Tobias, P.E. (1942). Liquid -Liquid Extraction Data -Toluene and
Acetaldehyde Systems. Ind. Eng. Chern. 34, 690-692.
Palo, D.R., Erkey, C. (1999). Kinetics of the homogeneous catalytic hydroformylation of 1-
octene in supercritical carbon dioxide with HRh(CO)[P(p-CF3C6H.),],. Ind. Eng. Chern. Res. 38,
3786-3792.
Pant, K.K., Kunzru, D. (1997). Catalytic pyrolysis of n-heptane: Kinetic and modeling.
Ind. Eng. Chern. Res. 36, 2059-2065.
Patel, S., Pant, K.K. (2007). Experimental study and mechanistic kinetic modeling for
selective production of hydrogen via catalytic steam reforming of methanol. Chern.
Eng. Sc.62,5425-5435.
Peng, D.Y., Robinson, D.B. (1976). A new two parameters Equation of State. Ind. Eng.
Chern. Fundam. 15, 59-64.
Pengpanich, S., Meeyoo, V., Rirksomboon, T., Bunyakiat, K. (2002). Catalytic oxidation
of methane over CeOz-ZrOz mixed oxide solid solution catalysts prepared via urea
hydrolysis. Appl Catal. A: Gen. 234, 221-233.
Phiong, H.S. and Lucien, F.P. (2002). Solubility of Hydrogen in a-Methylstyrene and
Cumene at Elevated Pressure.!. Chern. Eng. Data, 47,474-477.
Piacenti, F., Bianchi, M., Benedetti, E., Frediani, P. (1970). Hydroformylation of propene
in the presence ofCoz(C0)6[P(C4H9) . .!. Organomet. Chern., 23:257-264.
Pople, J.A., Schlegel, H.B., Krishnan, R., DeFrees, D.J., Binkley, J.S., Frisch, M.J.,
Whiteside, R.A., Hout, R.F., Hehre, W.J. (1981). Molecular-orbital studies of
vibrational frequencies. Int . .!. Quantum Chem.Quantum Chern. Symp. 15, 269-278.
Praunitz, J.M., Lichtenthaler, R.N., de Azevedo, E.G. (1999). Molecular
Thermodynamics of Fluid-Phase Equilibria. 3rd ed., Upper Saddle River, NJ: Prentice
Hall.
175
Page 196
Prausnitz, J.M., Shair, F.H., (1961). A thermodynamic correlation of gas solubilities.
A!ChE J. 7, 682-687.
Purwanto, P., Delmas, H. (1995). Gas-liquid-liquid reaction engmeenng:
hydroformylation of 1-octene using a water soluble rhodium complex catalyst. Catal.
Today, 24, 135-140.
Purwanto, P., Deshpande, R.M., Chaudhari, R.V., Delmas, H. (1996). Solubility of
hydrogen, carbon monoxide, and 1-octene in various solvents and solvent mixture. J.
Chern Eng Data 41, 1414-1417.
Radhakrishnan, K., Ramachandran, P.A., Brahme, P.H., Chaudhari, R.V., (1983).
Solubility of hydrogen in methanol, nitrobenzene and their mixtures: experimental data
and correlation. J. Chern. Eng. Data 28, 1-4.
Reid, R.C., Prausnitz, J.M., (1987). The properties of gases and liquids. Mc-Graw-Hill,
4th Edition, 335.
Renon, H., Prausnitz, J.M. (1968). Local compositions m thermodynamic excess
functions for liquid mixtures. A!ChE J. 14, 135-144
Riisager, A., Eriksen, K.M., Hjortkjaer, J., Fehrmann, R. (2003). Propene
hydroformylation by supported aqueous-phase Rh-NORBOS catalysts. J. Mol. Catal.
A: Chern. 193, 259-272.
Roat-Malone, R.M. (2002). Bioinorganic chemistry: a short course. John Wiley and Sons.
ISBN 047115976X, 9780471159766
Robbins, G.P., Hallet, J.P., Bush, D., Eckert, C.A. (2007). Liquid-liquid equilibria and
partitioning in organic-aqueous systems. Fluid Phase Equilibria, 253, 48-53
Rocha, W.R. (2004). Hydrogen activation and aldehyde elimination promoted by
homogeneous Pt-Sn catalyst: a theoretical study. J. Mol. Struc.: THEOCHEM. 677,
133-143.
Rocha, W.R., Milagro, H.M.S., De Almeida, W.B. (2001). On the isomerization of~
pinene: a theoretical study. J. Mol. Struc.: THEOCHEM544, 213-220.
Romero, C., Villares, A., Haro, M., Giner, B., Lafuente, C. (2005). Experimental and
predicted vapor-liquid equilibrium of 1 ,4-dioxane with cycloalkanes and benzene.
Fluid Phase Equilib., 238:1-6.
176
Page 197
Rosales, M., Gonz'alez, A., Guerrero, Y., Pacheco, I., S'anchez-Delgado, R.A. (2007a).
Kinetics and mechanisms of homogeneous catalytic reactions Part 6. Hydroformylation
of 1-hexene by use ofRh(acac)(C0)2/dppe [dppe = 1,2-bis(diphenylphosphino)ethane]
as the precatalyst. J. Mol. Catal. A: Chern. 270, 241-249
Rosales, M., Duran, J.A., Gonzalez, A., Pacheco, I., Sanchez-Delgado, R.A. (2007b).
Kinetics and mechanisms of homogeneous catalytic reactions. Part 7.
Hydroformylation of 1-hexene catalyzed by cationic complexes of rhodium and iridium
containing PPh3 . J. Mol. Catal. A: Chern., 270, 250-256.
Routray, K., Deo, G. (2005). Kinetic parameter estimation for a multi-response non
linear reaction model, AIChE Journal. 51,1733.
Saeys, M., Reyniers, M., Marin, G.B., Neurock, M. (2002). Density functional theory of
benzene adsorption on Pt(lll). J. Phys. Chern. B, 106,7489-7498.
Saeys, M., Reyniers, M., Thybaut, J.W., Neurock, M., Marin, G.B. (2005). First
principles based kinetic model for the hydrogenation of toluene. J. Catal., 236, 129-
138.
Sander, B., Jorgensen, S.S., Rasmussen, P., (1983). Gas solubility calculations, I.
UNIFAC. Fluid Phase Equilib., II :105-126.
Scarpello, J.T., Nair, D., Freitas dos Santos, L.M., White, L.S., Livingston, A.G. (2002).
The separation of homogeneous organometallic catalysts using solvent resistant
nanofiltration. J. Membrane Science, 203, 71-85.
Schlegel, H.B. (1994). Some thoughts on reaction-path following. J. Chern. Soc. Faraday
Trans., 90, 1569-1574.
Schlegel, H.B., Yarkony, D.R. (1994). Modem Electronic Structure Theory, World
Scientific Publication, Singapore, 459-500.
Scott, R.L. (1948). The Solubility of Fluorocarbons. J. Am. Chern. Soc., 70: 4090-4093.
Shaik, S.S., Hiberty, P.C. (2007). A Chemist's guide to valence bond theory. John Wiley
& Sons. ISBN: 978-0-470-03735-5, pp. 254-256.
Shriver, D.F., Atkins, P.W., Langford, C.H. (1998). Inorganic Chemistry, 2nd ed.,
Oxford University Press: Oxford.
177
Page 198
Silk, S.J. (1975). The threshold limit value for carbon monoxide. Ann. occup. Hyg., 18,
29-35.
Sobieszuk, P., Cyganski, P., Pohorecki, R. (2008). Volumetric liquid mass transfer
coefficient in a gas-liquid microreactor. Chemical and Process Engineering. 29, 651-
661.
Still, C., Salmi, T., Miiki-Arvela, P., Eriinen, K., Murzin, D.Y., Lehtonen, J. (2006).
Solubility of gases in a hydroformylation solvent. Chemical Eng. Science 61, 3698-
3704.
Streitwieser. A. (1961). Molecular Orbital Theory for Organic Chemists. John Wiley &
Sons; 1st Ed.
Tang, D., Qin, S., Su, Z., Hu, C. (2007). Comprehensive theoretical study on the
mechanism of regioselective hydroformylation of phosphinibutene catalyzed by a
heterobinuclear rhodium(I)-chromium complex. Organometallics, 26, 33-47.
Terreros, P., Pastor, E., Fierro, J. L. G. (1989). Heptene hydroformylation on
phosphinated polystyrene-anchored rhodium complexes. J. Mol. Catal., 53, 359-369.
Tijani, J., Ali B.E. (2006). Selective thermomorphic biphasic hydroformylation of higher
olefins catalyzed by HRhCO(PPh3)3/P(OPh)3 Applied Catal. A: General303, 158-165.
Unveren, H.H.Y. (2004). Hydroformylation oflong chain olefins in microemulsion. MSc
thesis, der Technische Universitiit Berlin.
van der Veen, L.A., Keeven, P.H., Schoemaker, G.C., Reek, J.N.H., Kramer, P.C.J., van
Leeuwen, P.W.N.M., Lutz, M., Spek, A.L. (2000). Origin of the Bite Angle Effect on
Rhodium Diphosphine Catalyzed Hydroformylation. Organometallics 19, 872.
van Leeuwen, P.W.N.M. (2004). Homogeneous catalysis, understanding the art. K.luwer
Academic Publishers, Dordrecht (The Netherlands): Springer-Verlag.
van Leeuwen, P.W.N.M., Claver, C. (2000). Rhodium Catalyzed Hydroformylation.
Kluwer Academic Publishers, Dordrecht (The Netherlands): Springer-Verlag.
http://www.knovel.com/knovel2/Toc.jsp?
van Leeuwen, P.W.N.M., Roobeek., C.F. (1983). Hydroformylation of less reactive
olefins with modified rhodium catalysts. J. Organomet. Chern., 258, 343-350.
178
Page 199
van Leeuwen, P.W.N.M., Jongsma, T., Challa, G. (1991). A mechanistic study of
rhodium tri( o-t-butylphenyl)phosphite complexes as hydroformylation catalysts. J.
Organomet. Chern., 421,121.
van Rooy, A., de Bruijn, J.N.H., Roobeek, K.F., Kamer, P.C.J., van Leeuwen, P.W.N.M.
(1996). Rhodium-catalysed hydroformylation of branched 1-alkenes; bulky phosphite
vs. triphenylphosphine as modifying ligand. J. Organometallic Chern., 507,69-73.
van Rooy, A., Orij, E.N., Kamer, P.C.J., van Leeuwen, P.W.N.M. (1995).
Hydroformylation with a rhodium/bulky phosphite modified catalyst. Catalyst
comparison for oct-1-ene, cyclohexene and styrene. Organometallics, 14, 34-43.
vender Veen, L.A., Keeven, P.H., Schoemaker, G. C., Reek, J.N.H., Kramer, P.C.J., van
Leeuwen, P.W.N.M., Lutz, M., Spek, A.L., (2000) Origin of the Bite Angle Effect on
Rhodium Diphosphine Catalyzed Hydroformylation. Organometallics, 19, 872.
Washburn, E.W. (2003). International Critical Tables of Numerical Data, Physics,
Chemistry and Technology. Knovel: Physical constants and thermodynamics of phase
transition. pp. 5094, 5320, 10961.
Weissermel, K., Arpe, H. (1997). Industrial Organic Chemistry. John Wiley & Sons; 3rd
Ed. ISBN 3-527-28838-4
Wilhelm, E. (1986). Dilute solutions of gases in liquids. Fluid Phase Equilib., 27, 233-
261.
Wilson, G.M. (1964). Vapor-Liquid Equilibrium. XL A New Expression for the Excess
Free Energy of Mixing. J. Am. Chern. Soc.; 86, 127-130.
Wojciechowski, B.W., Rice, N.M. (2003). Experimental methods in kinetic studies.
Elsevier Science B.V., Amsterdam.
Yang, C., Bi, X., Mao, Z. (2002a). Effect of reaction engineering factors on biphasic
hydroformylation of 1-dodecene catalyzed by water-soluble rhodium complex. J. Mol.
Catal. A, 187, 35-46.
Yang, C., Mao, Z., Wang, Y., Chen., J. (2002b). Kinetics of hydroformylation of
propylene using RhCl(CO)(TPPTS)z/TPPTS complex catalyst in aqueous system.
Catal. Today, 74, 111-119.
Yen, C.L., McKetta, J.J., (1962). A thermodynamic correlation of nonpolar gas
solubilities in polar, non-associated liquids. A/ChE J. 8, 501-507.
179
Page 200
Zaretskii, M.l., Rusak, V.V. and Chartov, E.M. (2008). Using Propylene Carbonate in
Extraction and Absorption: A Review. Coke and Chemistry, 51, 101-104.
Zhang, H., Ramachandran, B., Senekowitsch, J., Wyatt, R.E. (1999). Determination of
spectroscopic constants and anharmonic force-fields for HOC! and DOC! using scaled
external correlation. J Mol. Struc.: THEOCHEM 487, 75-85.
Zhang, Y.Q., Mao, Z., Chen, J. (2002). Macro-kinetics ofbiphasic hydroformylation of
1-dodecene catalyzed by water soluble rhodium complex. Catal. Today, 74,23-35.
Zheng, X.L., Jiang, J.Y., Liu, X.Z., Jin, Z.L. (1998). Thermoregulated phase transfer
ligands and catalysis. III. Aqueous/organic two phase hydroformylation of higher
olefins by thermoregulated phase-transfer catalysis. Catal. Today 44, 175-182.
Zhu, H., Ding, Y., Yin, H., Yan, L., Xiong, J., Lu, Y., Luo, H., Lin, L. (2003). Supported
rhodium and supported aqueous-phase catalyst, and supported rhodium catalyst
modified with water-soluble TPPTS ligands. Applied Catal. A: Genera/245, 111-117.
180
Page 201
Appendix A
Key Structures Involved in the Catalytic Cycle of Hydroformylation of 1-Decene
and Selected Parameters
Bl B2
El E2
TS l(E2/F2) TS l(El/Fl)
181
Page 202
Hl
H2
TS 2(Hl/Jl) TS 2(H2/J2)
182
Page 203
Jl J2
TS 3(Jl/Nl) TS 3(J2/N2)
183
Page 204
Nl N2
Pl P2
(bond lengths are in angstrom)
184
Page 205
Appendix B
Key Structures Involved in the Catalytic Cycle of Hydroformylation of 1-Dodecene
and Selected Parameters
El E2
H~ k j,!
H ;ttft. 8 I
2.221
TS l(E2/F2) TS l(El/Fl)
H
Fl F2
185
Page 206
Hl H2
TS 2(Hl/Jl) TS 2(H2/J2)
B
~~ , -w Ji~ 2.032
1:1 Jl J2
186
Page 207
l:l
' l:l TS 3(Jl/Nl) TS 3(J2/N2)
H ~!:I
Nl N2
Pl P2
187
Page 208
AppendixC
Key Structures Involved in the Catalytic Cycle of Hydroformylation of Styrene and
Selected Parameters
El
TS (E2/F2)
Fl
188
E2
F2
2.462
TS(El/Fl)
Page 209
H1 H2
TS 1 (H1/J1) TS 1 (H2/J2)
J1 J2
189
Page 210
TS 2 (Jl/Nl) TS 2 (J2/N2)
Nl N2
Pl P2
(bond lengths are in angstrom)
190
Page 211
AppendixD
Kinetic Data for Hydroformylation of Higher Alkenes in Homogeneous System
Table D-1: Kinetic data for hydroformylation of 1-dodecene at temperature of 323 K
(Bhanage et al., 1997).
Exp. Rate H, co 1-dodecene catalyst
(kmohn-38 1) (kmobn-3
) (kmo1m'3) (kmohn-3) (kmohn-3
)
0 0.00000 0.2248 0.36 0.0020 7.50E-06 0.02145 0.2248 0.36 0.0020
1.50E-05 0.04538 0.2248 0.36 0.0020 1.80E-05 0.05611 0.2248 0.36 0.0020
0 0.08977 0.0000 0.36 0.0020 2.20E-04 0.08977 0.0066 0.36 0.0020 1.60E-04 0.08977 0.0083 0.36 0.0020 9.40E-05 0.08977 0.0140 0.36 0.0020 6.00E-05 0.08977 0.0273 0.36 0.0020 l.OOE-05 0.08977 0.1116 0.36 0.0020 5.00E-06 0.08977 0.1405 0.36 0.0020
0 0.08977 0.2248 0 0.0020 1.50E-05 0.08977 0.2248 0.37 0.0020 1.80E-05 0.08977 0.2248 0.75 0.0020 2.00E-05 0.08977 0.2248 0.95 0.0020 2.30E-05 0.08977 0.2248 1.45 0.0020 2.50E-05 0.08977 0.2248 2.18 0.0020
0 0.08977 0.2248 0.36 0.0000 l.OOE-05 0.08977 0.2248 0.36 0.0010 1.80E-05 0.08977 0.2248 0.36 0.0020 3.00E-05 0.08977 0.2248 0.36 0.0040 6.00E-05 0.08977 0.2248 0.36 0.0080
191
Page 212
Table D-2: Kinetic data for hydroforrny1ation of 1-dodecene at temperature of 333 K
(Bhanage et al., 1997).
29 3 119
Exp. Rate H, co 1-dodecene catalyst
(kmoln13s1) (kmolm.3) (kmo1m.3) (kmolm.3) (kmo1m-3
)
0 0.00000 0.2286 0.3600 0.0020 3.00E-05 0.02304 0.2286 0.3600 0.0020 6.30E-05 0.04693 0.2286 0.3600 0.0020 7.30E-05 0.05802 0.2286 0.3600 0.0020 O.OOE+OO 0.09283 0.0000 0.3600 0.0020 7.50E-04 0.09283 0.0059 0.3600 0.0020 6.00E-04 0.09283 0.0084 0.3600 0.0020 4.00E-04 0.09283 0.0143 0.3600 0.0020 2.00E-04 0.09283 0.0277 0.3600 0.0020 l.OOE-04 0.09283 0.0588 0.3600 0.0020 6.00E-05 0.09283 0.1134 0.3600 0.0020 3.50E-05 0.09283 0.1697 0.3600 0.0020 O.OOE+OO 0.09283 0.2286 0.0000 0.0020 4.40E-05 0.09283 0.2286 0.1800 0.0020 6.30E-05 0.09283 0.2286 0.3800 0.0020 8.10E-05 0.09283 0.2286 0.7000 0.0020 9.20E-05 0.09283 0.2286 1.4500 0.0020 9.80E-05 0.09283 0.2286 2.1800 0.0020 O.OOE+OO 0.09283 0.2286 0.3600 0.0000 3.50E-05 0.09283 0.2286 0.3600 0.0010 6.00E-05 0.09283 0.2286 0.3600 0.0020 1.20E-04 0.09283 0.2286 0.3600 0.0040 2.30E-04 0.09283 0.2286 0.3600 0.0080
192
Page 213
Table D-3: Kinetic data for hydroformylation of 1-dodecene at temperature of 343 K
(Bhanage et al., 1997).
28 I 117
Exp. Rate H, co 1-dodecene catalyst
(kmoln13s1) (kmolm·3) (kmolm-3) (kmolm-3) (kmo1m-3)
0 0.00000 0.2325 0.3600 0.0020 1.03E-04 0.02402 0.2325 0.3600 0.0020 1.99E-04 0.04893 0.2325 0.3600 0.0020 2.30E-04 0.06050 0.2325 0.3600 0.0020 O.OOE+OO 0.09680 0.0000 0.3600 0.0020 1.60E-03 0.09680 0.0085 0.3600 0.0020 1.13E-03 0.09680 0.0145 0.3600 0.0020 6.25E-04 0.09680 0.0282 0.3600 0.0020 1.88E-04 0.09680 0.1154 0.3600 0.0020 1.25E-04 0.09680 0.1726 0.3600 0.0020 O.OOE+OO 0.09680 0.2325 0.0000 0.0020 1.48E-04 0.09680 0.2325 0.1800 0.0020 1.90E-04 0.09680 0.2325 0.3800 0.0020 2.20E-04 0.09680 0.2325 0.7000 0.0020 2.50E-04 0.09680 0.2325 2.1500 0.0020 O.OOE+OO 0.09680 0.2325 0.3600 0.0000 l.OOE-04 0.09680 0.2325 0.3600 0.0010 2.00E-04 0.09680 0.2325 0.3600 0.0020 3.80E-04 0.09680 0.2325 0.3600 0.0040 7.30E-04 0.09680 0.2325 0.3600 0.0080
193
Page 214
Table D-4: Kinetic data for hydroformylation of styrene at temperature of 333 K (Nair et
al., 1999).
K H 29 3 II 9
Exp. Rate H, co styrene catalyst
(kmolm"3s 1\ (kmolm.3) lkmolm.3) (kmolm.3) (kmolm"3
)
0 0.00000 0.1714 3.4500 0.0010 1.90E-05 0.03413 0.1714 3.4500 0.0010 4.20E-05 0.06826 0.1714 3.4500 0.0010 8.40E-05 0.13652 0.1714 3.4500 0.0010
0 0.06962 0.0000 3.4500 0.0010 9.73E-05 0.06962 0.0045 3.4500 0.0010 8.94E-05 0.06962 0.0165 3.4500 0.0010 7.50E-05 0.06962 0.0420 3.4500 0.0010 6.84E-05 0.06962 0.0588 3.4500 0.0010 5.92E-05 0.06962 0.0924 3.4500 0.0010 5.00E-05 0.06962 0.1261 3.4500 0.0010 4.21E-05 0.06962 0.1739 3.4500 0.0010 3.16E-05 0.06962 0.2521 3.4500 0.0010 2.50E-05 0.06962 0.3504 3.4500 0.0010 O.OOE+OO 0.06962 0.1714 0.0000 0.0010 4.05E-05 0.06962 0.1714 0.9000 0.0010 4.17E-05 0.06962 0.1714 1.7000 0.0010 4.28E-05 0.06962 0.1714 3.4000 0.0010 4.40E-05 0.06962 0.1714 6.8700 0.0010 O.OOE+OO 0.06962 0.1714 3.4500 0.0000 5.25E-06 0.06962 0.1714 3.4500 0.0001 l.IOE-05 0.06962 0.1714 3.4500 0.0003 2.31E-05 0.06962 0.1714 3.4500 0.0005 4.41E-05 0.06962 0.1714 3.4500 0.0010
194
Page 215
Table D-5: Kinetic data for hydroformylation of styrene at temperature of 343 K (Nair et
al., 1999).
28 I 117
Exp. Rate H, co styrene catalyst
(kmolm.3s1) (kmolm.3) (kmolm.3) (kmolm.3) (kmolm.3)
0 0.00000 0.1744 3.4500 0.0010 4.20E-05 0.03559 0.1744 3.4500 0.0010 9.03E-05 0.07117 0.1744 3.4500 0.0010 1.75E-04 0.14235 0.1744 3.4500 0.0010 O.OOE+OO 0.07260 0.0000 3.4500 0.0010 1.89E-04 0.07260 0.0046 3.4500 0.0010 1.76E-04 0.07260 0.0168 3.4500 0.0010 1.51E-04 0.07260 0.0427 3.4500 0.0010 1.37E-04 0.07260 0.0598 3.4500 0.0010 1.26E-04 0.07260 0.0872 3.4500 0.0010 l.OIE-04 0.07260 0.1282 3.4500 0.0010 8.94E-05 0.07260 0.1769 3.4500 0.0010 6.71E-05 0.07260 0.2521 3.4500 0.0010 5.52E-05 0.07260 0.3504 3.4500 0.0010 O.OOE+OO 0.07260 0.1744 0.0000 0.0010 8.89E-05 0.07260 0.1744 0.9000 0.0010 9.00E-05 0.07260 0.1744 1.7000 0.0010 9.05E-05 0.07260 0.1744 3.4000 0.0010 9.22E-05 0.07260 0.1744 6.8700 0.0010
0 0.07260 0.1744 3.4500 0.0000 1.16E-05 0.07260 0.1744 3.4500 0.0001 2.47E-05 0.07260 0.1744 3.4500 0.0003 4.78E-05 0.07260 0.1744 3.4500 0.0005 9.08E-05 0.07260 0.1744 3.4500 0.0010
195
Page 216
Table D-6: Kinetic data for hydroformylation of styrene at temperature of 353 K (Nair et
al., 1999).
26 8 II 53
Exp. Rate H, co styrene catalyst
I (kmoim·\·1) (kmolm.3) (kmolm.3) (kmolm·3) (kmolm.3)
0 0.00000 0.1769 3.4500 0.0010 9.14E-05 0.03731 0.1769 3.4500 0.0010 2.00E-04 0.07463 0.1769 3.4500 0.0010 3.84E-04 0.14925 0.1769 3.4500 0.0010 O.OOE+OO 0.07612 0.0000 3.4500 0.0010 4.39E-04 0.07612 0.0047 3.4500 0.0010 4.05E-04 0.07612 0.0170 3.4500 0.0010 3.45E-04 0.07612 0.0434 3.4500 0.0010 3.25E-04 0.07612 0.0607 3.4500 0.0010 2.75E-04 0.07612 0.0885 3.4500 0.0010 2.34E-04 0.07612 0.1301 3.4500 0.0010 1.97E-04 0.07612 0.1795 3.4500 0.0010 1.63E-04 0.07612 0.2602 3.4500 0.0010 1.25E-04 0.07612 0.3617 3.4500 0.0010 O.OOE+OO 0.07612 0.1769 0.0000 0.0010 1.97E-04 0.07612 0.1769 0.9000 0.0010 2.00E-04 0.07612 0.1769 1.7000 0.0010 1.97E-04 0.07612 0.1769 3.4000 0.0010 2.01E-04 0.07612 0.1769 6.8700 0.0010
0 0.07612 0.1769 3.4500 0.0000 2.52E-05 0.07612 0.1769 3.4500 0.0001 5.04E-05 0.07612 0.1769 3.4500 0.0003 1.04E-04 0.07612 0.1769 3.4500 0.0005 1.96E-04 0.07612 0.1769 3.4500 0.0010
196
Page 217
Table D-7: Kinetic data for hydrofonnylation of 1-decene at temperature of 323 K
(Divekar et al., 1993).
Exp. Rate H, co 1-decene catalyst
(kmolm"3s"1) (kmolm"3
) (kmolm-3) (kmolm-3
) (kmolm-3)
0 0.00000 0.1000 0.5280 0.0010 9.57E-06 0.02010 0.1000 0.5280 0.0010 2.97E-05 0.04053 0.1000 0.5280 0.0010 8.42E-05 0.08106 0.1000 0.5280 0.0010
0 0.04080 0.0000 0.5280 0.0010 2.08E-04 0.04080 0.0087 0.5280 0.0010 1.84E-04 0.04080 0.0202 0.5280 0.0010 1.06E-04 0.04080 0.0404 0.5280 0.0010 6.27E-05 0.04080 0.0606 0.5280 0.0010 2.74E-05 0.04080 0.1029 0.5280 0.0010 1.57E-05 0.04080 0.1538 0.5280 0.0010 1.18E-05 0.04080 0.2038 0.5280 0.0010 O.OOE+OO 0.04080 0.1000 0.0000 0.0010 1.53E-05 0.04080 0.1000 0.2683 0.0010 2.58E-05 0.04080 0.1000 0.5244 0.0010 3.71 E-05 0.04080 0.1000 0.7927 0.0010 5.81E-05 0.04080 0.1000 1.3170 0.0010 9.19E-05 0.04080 0.1000 2.6460 0.0010
Table D-8: Kinetic data for hydrofonnylation of 1-decene at temperature of 333 K
(Divekar et al., 1993).
Exp. Rate H, co 1-decene catalyst
(kmolm-38 1) (kmolm"3
) (kmolm-3) (kmolm-3
) (kmolm-3)
0 0.00000 0.1076 0.5280 0.0010 2.58E-05 0.02200 0.1076 0.5280 0.0010 7.27E-05 0.04407 0.1076 0.5280 0.0010 2.28E-04 0.08890 0.1076 0.5280 0.0010 O.OOE+OO 0.04470 0.0000 0.5280 0.0010 3.61E-04 0.04470 0.0106 0.5280 0.0010 3.72E-04 0.04470 0.0231 0.5280 0.0010 2.12E-04 0.04470 0.0442 0.5280 0.0010 1.49E-04 0.04470 0.0663 0.5280 0.0010 7.45E-05 0.04470 0.1096 0.5280 0.0010 3.92E-05 0.04470 0.1634 0.5280 0.0010 2.74E-05 0.04470 0.2192 0.5280 0.0010 O.OOE+OO 0.04470 0.1076 0.0000 0.0010 4.60E-05 0.04470 0.1076 0.2805 0.0010 7.34E-05 0.04470 0.1076 0.5366 0.0010 9.52E-05 0.04470 0.1076 0.7927 0.0010 1.36E-04 0.04470 0.1076 1.3170 0.0010 1.81 E-04 0.04470 0.1076 2.6340 0.0010
197
Page 218
Table D-9: Kinetic data for hydroformylation of decene at temperature of 343 K
(Divekar et al., 1993).
Exp. Rate H, co 1-decene catalyst
(kmolm·'s1) (kmolm.3
) (kmolm.3) (kmolm-3
) (kmolm-3)
0 0.00000 0.1148 0.5280 0.0010 5.36E-05 0.02322 0.1148 0.5280 0.0010 1.34E-04 0.04840 0.1148 0.5280 0.0010 3.79E-04 0.09719 0.1148 0.5280 0.0010 O.OOE+OO 0.04470 0.0000 0.5280 0.0010 6.98E-04 0.04470 0.0125 0.5280 0.0010 6.74E-04 0.04470 0.0240 0.5280 0.0010 4.04E-04 0.04470 0.0471 0.5280 0.0010 2.67E-04 0.04470 0.0702 0.5280 0.0010 1.39E-04 0.04470 0.1163 0.5280 0.0010 7.25E-05 0.04470 0.1760 0.5280 0.0010 4.51E-05 0.04470 0.2346 0.5280 0.0010 O.OOE+OO 0.04470 0.1148 0.0000 0.0010 8.31E-05 0.04470 0.1148 0.2439 0.0010 1.36E-04 0.04470 0.1148 0.5244 0.0010 1.69E-04 0.04470 0.1148 0.7805 0.0010 2.11 E-04 0.04470 0.1148 1.3170 0.0010 2.53E-04 0.04470 0.1148 2.6460 0.0010
Table D-10: Kinetic data for hydroformylation of 1-octene at temperature of 323 K
(Palo and Erkey, 1999).
Exp. Rate H, (kmolm co 1-octene catalyst (kmolm-3s 1
) ') (kmolm-3) (kmolm-3) (kmolm-3)
O.OOE+OO 0.000 1.100 0.960 0.001 1.50E-04 1.100 1.100 0.960 0.001 2.40E-04 2.100 1.100 0.960 0.001 2.70E-04 2.600 1.100 0.960 0.001
0 1.000 0.000 0.960 0.001 1.20E-04 1.000 1.100 0.960 0.001 8.00E-05 1.000 1.600 0.960 0.001 5.70E-05 1.000 2.200 0.960 0.001 O.OOE+OO 1.100 1.100 0.000 0.001 8.33E-05 1.100 1.100 0.410 0.001 1.05E-04 1.100 1.100 0.680 0.001 1.20E-04 1.100 1.100 0.950 0.001 O.OOE+OO 1.100 1.100 0.960 0.000 1.2E-04 1.100 1.100 0.960 0.001
2.30E-04 1.100 1.100 0.960 0.001 4.90E-04 1.100 1.100 0.960 0.003
198
Page 219
AppendixE
Estimated Rate Parameters
Table E-1: Estimated rate parameters of Model M2 with 95% confidence limits.
Substrate T k K' K' K' K' K' SEE E, I 2 3 4 5
(kJ mor1) (K)
ModelM2 1-dodecene 323 2.6x10⁴ 1.4x1Q4 2.5x1Q5 5.9x10⁵ J.9X 104 9.0x10⁵ 25.8 88.3
*3.4x104
cl2 333 5.9x10⁴ J.Ox1Q4 !.Ox 105 3.7x1Q5 J.5x104 5.0x1Q5 *57.1' *5.8x10⁴
343 ll.Ox104 0.77x1Q o.52x1o' 2.3x1Q5 J.2x104 3.0x105
*9.9x104 4
1-decene 323 !.Ox 104 7.0x10³ z.ox 105 4.0x10⁴ 60.0 9.0x10⁴ 24.3 49.4 *1.1x 1013
Cw 333 3.0x10⁴ 8.0x10³ J.3x10' 5.7x1Q4 900 J.2x 105 *49.0b *1.4x10 13
343 5.0x10⁴ 2.5x10³ 8.Qx104 6.9x 10⁴ J.2x103 J.4x 105
*2.8x1013
styrene 333 l.lx104 11.0 3.7x101 4.6 Ux105 SAx 105 9.7 74.5 *1.6
c, 343 J.Sx104 9.0 9.4X1Q1 0.50 s.sx104 6.0x105 *68.8' *3.1
353 2.9x10⁴ 5.0 J.4X 102 0.050 6.0x10⁴ 4.8x105
*6.6 1-octene 323 3.2x10⁵ 1.4x 10⁴ 2.5x1Q5 5.9x10⁵ J.9x104 9.0x1Q5 7.0
c, *0.10
ModelM3 Non-linear Arrhenius constant and relatively high <t>min
(kmol, m3, s units)
*Activation energy and rate constant value reported in open literature: 'Bhanage et al. ( 1997) bDivekar eta!. (1993) 'Nair et a!.( 1999)
199
Page 220
Table E-2: Estimated rate parameters of Model A2 with 95% confidence limits.
Substrate T k K' K' K' K' K' SEE Ea (K)
1 2 3 4 5 (kJ mor')
ModelA3 7.0xlO 1-octene 353 l.lxl03 5.3xl01 2.4xl01 2.4x 101 -4.3xi02 15.3 36.8
Cw 363 2.0xl03 3.8xl02 -I.6xl02 l.lxl03
3.4xl01 3.4xl01
373 3.Ix!03 2.5xJ01 5.4xl02 1.2x 10² -8.5xl01 6.8xJ01
1-dodecene 353 l.lx 103 5.7xi02 -l.lxJ02 -1.4xJ02 -4.IxJ03 3.0xi02 7.4 51.0 cl2 363 I.8x 103 ].Oxi03 -I.2xl02 -1.4xi02 -4.lxi03 I.9xl02
373 2.9xl03 4.9xl02 -5.3 x!02 -1.5xi02 -4.3xl03 6.6xi02
ModelA2 Non-linear Arrhenius constant and relatively high <Pmin
(kmol, m3, s units)
200
Page 221
AppendixF
Derivation of the Rate Equation
Rate equation is a differential equation, and it can be integrated in order to obtain an
integrated rate equation that links concentrations of reactant with time. In a semi-batch
reactor, the concentration of 1-dodecene varies as a function of time and hence, it was
necessary to check the validity of the rate equation over the entire range of conditions
involved in a batch reactor operated at higher conversions. The data was developed to
observe the variation in the concentrations of 1-dodecene as a function of time, at
constant Pco and PH2. Using model M1 (equation 3.14), the variation of the concentration
of 1-dodecene can be expressed by the following mass balance equations for the kinetic
regime:
-d[ dodecene] k[ H 2 ] [CO] [catalyst] [ dodecene J dt (I+ Kco[C0] 2 )(l + Kdodecm[dodecene]) F-1
with initial conditions, t = 0 and [ dodecene] = [ dodecene ]0
For constant Hz and CO pressure conditions, the following equation for the variation of
1-dodecene concentration with time can be derived,
[dodecene]0 k[H2 ][CO][catalyst] F-2 In + K dodecene ([ dodecene] 0 - [ dodecene J t ) = 2 [dodecenelt l+Kc
0[CO]
In deriving the equation, it was assumed that the change in reactant and products
concentration do not affect the solubility of Hz and CO significantly. Using Equation (B-
2), the concentration of 1-dodecene, as a function of time was predicted for different
temperatures and compared with literature data (Bhanage et a!., 1997).
201
Page 222
AppendixG
Table G-1: Solubility of CO at different pressure and temperature (x2), calculated solubility (X calc) and standard error of estimation
(SEE) from the RST -based model.
T- 298.15 K T-313.15K T- 323.15 K P(kPa) x, X calc SEE ("lo) P (kPa) x, X calc SEE(%) P(kPa) x, X calc SEE(%)
Propylene carbonate 131 0.00155 0.00150 3.22 122 0.00156 0.00152 2.56 128 0.00157 0.00155 1.27 333 0.0048 0.0043 10.42 370 0.0049 0.0045 8.16 332 0.0049 0.0048 2.04 535 0.0077 0.0079 2.62 613 0.0078 0.0082 5.13 523 0.0078 0.0084 7.69 767 0.0106 0.0101 4.76 865 0.0107 0.0110 2.80 755 0.0109 0.0111 1.83 995 0.0134 0.0129 3.73 1082 0.0136 0.0132 2.94 997 0.0138 0.0135 2.17 1115 0.0160 0.0165 3.12 1315 0.0162 0.0164 1.23 1361 0.0163 0.0167 2.45 1496 0.0183 0.0179 2.19 1489 0.0184 0.0187 1.63 1533 0.0184 0.0189 2.72
Biphasic PC+dodecane 136 0.00145 0.00152 4.83 117 0.00150 0.00155 3.33 156 0.00155 0.00157 1.29 282 0.0042 0.0042 0.00 399 0.0043 0.0044 2.33 399 0.0045 0.0047 4.44 574 0.0074 0.0077 4.05 576 0.0075 0.0080 6.67 576 0.0077 0.0082 6.49 809 0.0110 0.0092 16.36 821 0.0112 0.0094 16.07 821 0.0113 0.0096 15.04 1004 0.0135 0.0133 1.48 1005 0.0136 0.0136 0.00 1015 0.0138 0.0138 0.00 1245 0.0163 0.0165 1.23 1355 0.0165 0.0168 1.82 1350 0.0165 0.0170 3.03 1515 0.0180 0.0176 2.22 1523 0.0182 0.0178 2.20 1535 0.0183 0.0181 1.09
TMS-systems PC+dodecane+ 1 ,4-dioxane 125 0.00169 0.00165 2.37 120 0.00172 0.00167 2.91 138 0.00175 0.00171 2.29 321 0.0050 0.0052 4.00 368 0.0053 0.0054 1.89 388 0.0056 0.0056 0.00 610 0.0093 0.0089 4.30 595 0.0100 0.0092 8.00 625 0.0107 0.0095 11.21 803 0.0125 0.0127 1.60 885 0.0130 0.0129 0.77 890 0.0135 0.0132 2.22 1005 0.0147 0.0139 5.44 995 0.0149 0.0142 4.70 987 0.0150 0.0145 3.33 1355 0.0173 0.0174 0.58 1116 0.0174 0.0176 1.15 1126 0.0178 0.0179 0.56 1523 0.0198 0.0205 3.54 1515 0.0200 0.0207 3.50 1510 0.0205 0.0209 1.95
202
Page 223
Table Gl (continue)
r~ 333.15 K r~ 343.15 K P(kPa) x, Xcalc SEE(%) P(kPa) x, X calc SEE(%)
Propylene carbonate 131 0.00157 0.00157 0.00 145 0.00158 0.00159 0.63 399 0.0052 0.0050 3.85 328 0.0050 0.0052 4.00 622 0.0079 0.0085 7.59 576 0.0080 0.0087 8.75 875 0.0109 0.0112 2.75 850 0.0111 0.0113 1.80 1056 0.0139 0.0137 1.44 999 0.0140 0.0139 0.71 1216 0.0165 0.0169 2.42 1189 0.0165 0.0171 3.64 1495 0.0186 0.0190 2.15 1545 0.0187 0.0192 2.67
Bipbasic PC+dodecane 146 0.00158 0.00159 0.63 126 0.00160 0.00161 0.63 362 0.0050 0.0049 2.00 378 0.0051 0.0051 0.00 665 0.0078 0.0084 7.69 643 0.0081 0.0086 6.17 788 0.0113 0.0098 13.27 885 0.0116 0.0100 13.79 1006 0.0138 0.0140 1.45 1182 0.0144 0.0142 1.39 1301 0.0165 0.0171 3.64 1315 0.0166 0.0173 4.22 1503 0.0185 0.0183 1.08 1495 0.0187 0.0185 1.07
TMS-systems PC+dodecane+ I ,4-dioxane 122 0.00178 0.00174 2.25 135 0.00182 0.00176 3.30 376 0.0055 0.0058 5.45 339 0.0056 0.0060 7.14 576 0.0109 0.0098 10.09 592 0.0113 0.0100 11.50 799 0.0133 0.0134 0.75 811 0.0140 0.0137 2.14 995 0.0153 0.0147 3.92 1015 0.0155 0.0150 3.23 1255 0.0181 0.0181 0.00 1242 0.0183 0.0183 0.00 1496 0.0207 0.0211 1.93 1519 0.0210 0.0213 1.43
203
Page 224
Table G-2: Solubility of H2 at different pressure and temperature (x2), calculated solubility (xcaic) and standard error of estimation
(SEE) from the RST-based model.
T- 298.15 K T~ 313.15 K T~ 323.15 K P(kPa) x, X calc SEE_(%) P(kPa) x, X calc SEE(%) P(kPa) x, X calc SEE(%)
Propylene carbonate 131 0.00135 0.00132 2.22 122 0.00138 0.00135 2.17 128 0.00139 0.00137 1.44 333 0.0048 0.0047 2.08 370 0.0049 0.0050 2.04 332 0.0051 0.0053 3.92 535 0.0075 0.0080 6.67 613 0.0076 0.0082 7.89 523 0.0077 0.0084 9.09 767 0.0101 O.Dl05 3.96 865 0.0102 0.0107 4.90 755 0.0102 0.0109 6.86 995 0.0124 0.0128 3.23 1082 0.0126 0.0129 2.38 997 0.0127 0.0130 2.36 1215 0.0145 0.0149 2.76 1315 0.0147 0.0150 2.04 !361 0.0148 0.0153 3.38 1496 0.0178 0.0175 1.69 1489 0.0179 0.0178 0.56 !533 0.0180 0.0181 0.56
Biphasic PC+dodecane 136 0.00092 0.00096 4.35 117 0.00098 0.00097 1.02 !56 0.00104 0.00099 4.81 282 0.0022 0.0026 9.09 399 0.0024 0.0027 12.50 399 0.0027 0.0029 7.41 574 0.0044 0.0046 4.55 576 0.0046 0.0049 6.52 576 0.0047 0.0051 8.51 809 0.0072 0.0070 2.78 821 0.0073 0.0074 1.37 821 0.0075 0.0077 2.67 1004 0.0093 0.0089 4.30 1005 0.0095 0.0094 1.05 !015 0.0098 0.0097 1.02 1245 0.0103 0.0106 2.91 1355 0.0104 0.0107 2.88 !350 0.0106 0.0109 2.83 1515 0.0126 0.0129 2.38 1523 0.0128 0.0130 1.56 !535 0.0129 0.0132 2.33
TMS-systems PC+dodecane+ I ,4-dioxane 125 0.00115 0.00118 2.61 120 0.00122 0.00120 1.64 !38 0.00126 0.00124 1.59 321 0.0032 0.0029 9.38 368 0.0033 0.0033 0.00 388 0.0036 0.0035 2.78 610 0.0059 0.0055 6.78 595 0.0060 0.0057 5.00 625 0.0062 0.0059 4.84 803 0.0097 0.0095 2.06 885 0.0099 0.0097 2.02 890 0.0105 0.0101 3.81 1005 0.0119 0.0122 2.52 995 0.0121 0.0123 1.65 987 0.0122 0.0126 3.28 1355 0.0154 0.0158 2.60 1116 0.0155 0.0159 2.58 1126 0.0157 0.0161 2.55 1523 0.0166 0.0167 0.60 1515 0.0168 0.0169 0.60 1510 0.0169 0.0173 2.37
204
Page 225
Table G-2 (Continue)
T= 333.15 K T= 343.15 K P(kPa) x, X calc SEE(%) P(kPa) x, X calc SEE(%)
Propylene carbonate 131 0.00140 0.00145 3.57 145 0.00140 0.00148 -5.71 399 0.0051 0.0055 7.84 328 0.0051 0.0057 -11.76 622 0.0077 0.0086 11.69 576 0.0082 0.0089 -8.54 875 0.0103 0.0110 6.80 850 0.0103 0.0112 -8.74 1056 0.0127 0.0133 4.72 999 0.0127 0.0135 -6.30 1216 0.0148 0.0156 5.41 1189 0.0148 0.0158 -6.76 1495 0.0181 0.0185 2.21 1545 0.0181 0.0188 -3.87
Biphasic PC+dodecane 146 0.00109 0.00103 5.50 126 0.00115 0.00108 6.09 362 0.0028 0.0032 14.29 378 0.0031 0.0035 12.90 665 0.0049 0.0053 8.16 643 0.0052 0.0056 7.69 788 0.0078 0.0079 1.28 885 0.0080 0.0083 3.75 1006 0.0099 0.0102 3.03 1182 0.0102 0.0106 3.92 1301 0.0106 0.0115 8.49 1315 0.0109 0.0117 7.34 1503 0.0129 0.0136 5.43 1495 0.0131 0.0139 6.11
TMS-systems PC+dodecane+ I ,4-dioxane 122 0.00129 0.00127 1.55 135 0.00133 0.00136 2.26 376 0.0037 0.0038 2.70 339 0.0039 0.0043 10.26 576 0.0062 0.0064 3.23 592 0.0065 0.0067 3.08 799 0.0104 0.0108 3.85 811 O.Dl05 0.0112 6.67 995 0.0124 0.0130 4.84 1015 0.0125 0.0133 6.40 1255 0.0158 0.0165 4.43 1242 0.0160 0.0166 3.75 1496 0.0169 0.0178 5.33 1519 0.0172 0.0182 5.81
205
Page 226
Table G-3: Solubility of CO at different pressure and temperature (x2), calculated solubility (xcalc) and standard error of estimation
(SEE) from the modified UNIF AC model.
T- 298.15 K T-313.15K T- 323.15 K P(kPa) x, X calc SEE(%) P(kPa) x, Xcalc SEE ('Yo) P(kPa) x, Xcalc SEE(%)
Propylene carbonate 131 0.00155 0.00145 6.45 122 0.00156 0.00158 1.28 128 0.00157 0.00160 1.91 333 0.0048 0.0050 4.17 370 0.0049 0.0052 6.12 332 0.0049 0.0054 10.20 535 0.0077 0.0080 3.90 613 0.0078 0.0083 6.41 523 0.0078 0.0085 8.97 767 0.0106 0.0109 2.83 865 0.0107 0.0112 4.67 755 0.0109 0.0114 4.59 995 0.0134 0.0130 2.99 1082 0.0136 0.0135 0.74 997 0.0138 0.0137 0.72 1115 0.0160 0.0155 3.13 1315 0.0162 0.0158 2.47 1361 0.0163 0.0160 1.84 1496 0.0183 0.0188 2.73 1489 0.0184 0.0190 3.26 1533 0.0184 0.0192 4.35
Biphasic PC+dodecane 136 0.00145 0.00149 2.76 117 0.00150 0.00153 2.00 !56 0.00155 0.00156 0.65 282 0.00423 0.0045 6.38 399 0.0043 0.0048 11.63 399 0.0045 0.0052 15.56 574 0.0074 0.0078 5.41 576 0.0075 0.0081 8.00 576 0.0077 0.0084 9.09 809 O.Ql 10 0.0115 4.55 821 0.0112 0.0118 5.36 821 0.0113 0.0121 7.08 1004 0.0135 0.0140 3.70 1005 0.0136 0.0145 6.62 1015 0.0138 0.0147 6.52 1245 0.0163 0.0168 3.07 1355 0.0165 0.0172 4.24 1350 0.0165 0.0175 6.06 1515 O.Ql80 0.0175 2.78 1523 0.0182 0.0185 1.65 1535 0.0183 0.0187 2.19
TMS-systems PC+dodecane+ I ,4-dioxane 125 0.00169 0.00165 2.37 120 0.00172 0.00!69 1.74 138 0.00175 0.00173 1.14 321 0.0050 0.0045 10.00 368 0.0053 0.0049 7.55 388 0.0056 0.0053 5.36 610 0.0093 0.0099 6.45 595 0.0100 0.0105 5.00 625 0.0107 0.0109 1.87 803 0.0125 0.0129 3.20 885 0.0130 0.0135 3.85 890 0.0135 0.0139 2.96 1005 0.0147 0.0151 2.72 995 0.0149 0.0155 4.03 987 0.0150 0.0159 6.00 1355 0.0173 0.0178 2.89 1116 0.0174 0.0182 4.60 1126 0.0178 0.0186 4.49 1523 0.0188 0.0195 3.72 1515 0.0190 0.0199 4.74 1510 0.0191 0.0204 6.81
206
Page 227
Table G-3 (Continue)
T- 333.15 K T- 343.15 K P(kPa) x, X calc SEE(%) P(kPa) x, X calc SEE(%)
Propylene carbonate 131 0.00157 0.00157 0.00 145 0.00157 0.00159 1.27 399 0.0052 0.0050 3.85 328 0.0050 0.0052 4.00 622 0.0079 0.0085 7.59 576 0.0080 0.0087 8.75 875 0.0109 0.0112 2.75 850 0.0111 0.0113 1.80 1056 0.0139 0.0137 1.44 999 0.0140 0.0139 0.71 1216 0.0165 0.0169 2.42 1189 0.0165 0.0171 3.64 1495 0.0186 0.0190 2.15 1545 0.0187 0.0192 2.67
Biphasic PC+dodecane 146 0.00158 0.00159 0.63 126 0.00160 0.00161 0.63 362 0.0050 0.0049 2.00 378 0.0051 0.0051 0.00 665 0.0078 0.0084 7.69 643 0.0081 0.0086 6.17 788 0.0113 0.0098 13.27 885 0.0116 0.0100 13.79 1006 0.0138 0.0140 1.45 1182 0.0144 0.0142 1.39 1301 0.0165 0.0171 3.64 1315 0.0166 0.0173 4.22 1503 0.0185 0.0183 1.08 1495 0.0187 0.0185 1.07
TMS-systems PC+dodecane+ 1,4-dioxane 122 0.00178 0.00174 2.25 135 0.00182 0.00176 3.30 376 0.0055 0.0058 5.45 339 0.0056 0.0060 7.14 576 0.0109 0.0098 10.09 592 0.0113 0.0100 11.50 799 0.0133 0.0134 0.75 811 0.0140 0.0137 2.14 995 0.0153 0.0147 3.92 1015 0.0155 0.0150 3.23 1255 0.0181 0.0181 0.00 1242 0.0183 0.0183 0.00 1496 0.0207 0.0211 1.93 1519 0.0210 0.0213 1.43
207
Page 228
Table G-4: Solubility of Hz at different pressure and temperature (x2), calculated solubility (xcaic) and standard error of estimation
(SEE) from the modified UNIF AC model.
T- 298.15 K T- 313.15 K T- 323.15 K P(kPa) Xz_ X calc SEE(%) P(kPa) x, X calc SEE(%) P(kPa) x, X calc SEE(%)
Propylene carbonate 131 0.00135 0.00137 1.48 122 0.00138 0.00138 0.00 128 0.00139 0.00140 0.72 333 0.0048 0.0050 4.17 370 0.0049 0.0051 4.08 332 0.0051 0.0052 1.96 535 0.0075 0.0074 1.33 613 0.0076 0.0075 1.32 523 0.0077 0.0076 1.30 767 0.0101 0.0100 0.99 865 0.0102 0.0101 0.98 755 0.0102 0.0103 0.98 995 0.0124 0.0123 0.81 1082 0.0126 0.0125 0.79 997 0.0127 0.0127 0.00 1215 0.0145 0.0143 1.38 1315 0.0147 0.0145 1.36 1361 0.0148 0.0147 0.68 1496 0.0178 0.0179 0.56 1489 0.0179 0.0180 0.56 1533 0.0180 0.0182 1.11
Bipbasic PC+dodecane 136 0.00092 0.00095 3.26 117 0.00098 0.00097 1.02 156 0.00104 0.00099 4.81 282 0.0022 0.0024 9.09 399 0.0024 0.0025 4.17 399 0.0027 0.0028 3.70 574 0.0044 0.0045 2.27 576 0.0046 0.0047 2.17 576 0.0047 0.0049 4.26 809 0.0072 0.0073 1.39 821 0.0073 0.0075 2.74 821 0.0075 0.0077 2.67 1004 0.0093 0.0091 2.15 1005 0.0095 0.0094 1.05 1015 0.0098 0.0097 1.02 1245 0.0103 0.0102 0.97 1355 0.0104 O.Q105 0.96 1350 0.0106 0.0106 0.00 1515 0.0126 0.0128 1.59 1523 0.0128 0.0130 1.56 1535 0.0129 0.0132 2.33
TMS-systems PC +dodecane+ 1 ,4-dioxane 125 0.00115 0.00118 2.61 120 0.00122 0.00121 0.82 138 0.00126 0.00124 1.59 321 0.0032 0.0035 9.38 368 0.0035 0.0036 2.86 388 0.0037 0.0038 2.70 610 0.0059 0.0062 5.08 595 0.0060 0.0064 6.67 625 0.0062 0.0066 6.45 803 0.0097 0.0096 1.03 885 0.0099 0.0098 1.01 890 0.0105 0.0102 2.86 1005 0.0119 0.0121 1.68 995 0.0121 0.0124 2.48 987 0.0124 0.0126 1.61 1355 0.0154 0.0152 1.30 1116 0.0155 0.0155 0.00 1126 0.0157 0.0157 0.00 1523 0.0166 0.0165 0.60 1515 0.0168 0.0167 0.60 1510 0.0169 0.0170 0.59
208
Page 229
Table G-4: (Continue)
T~ 333.15 K T~ 343.15 K P(kPa) x, Xcalc SEE(%) P(kPa) x, Xcalc SEE(%)
Propylene carbonate 131 0.00140 0.00142 1.43 145 0.00142 0.00143 0.70 399 0.0051 0.0053 3.92 328 0.0053 0.0054 1.89 622 0.0077 0.0078 1.30 576 0.0079 0.0079 0.00 875 0.0103 0.0104 0.97 850 O.Ql05 0.0104 0.95 1056 0.0127 0.0128 0.79 999 0.0129 0.0128 0.78 1216 0.0148 0.0149 0.68 1189 0.0150 0.0149 0.67 1495 0.0181 0.0183 1.10 1545 0.0185 0.0183 1.08
Biphasic PC+dodecane 146 0.00109 0.00105 3.67 126 0.00115 0.00110 4.35 362 0.0028 0.0030 7.14 378 0.0031 0.0034 9.68 665 0.0049 0.0051 4.08 643 0.0052 0.0055 5.77 788 0.0078 0.0080 2.56 885 0.0080 0.0083 3.75 1006 0.0099 0.0102 3.03 1182 0.0102 0.0105 3.05 1301 0.0106 0.0109 2.83 1315 0.0109 0.0110 0.92 1503 0.0129 0.0134 3.88 1495 0.0131 0.0136 3.82
TMS-systems PC+dodecane+ 1,4-dioxane 122 0.00129 0.00127 1.55 135 0.00133 0.00130 2.26 376 0.0037 0.0039 5.41 339 0.0039 0.0042 7.69 576 0.0062 0.0068 9.68 592 0.0065 0.0070 7.69 799 0.0104 0.0105 0.96 811 0.0105 0.0108 2.86 995 0.0124 0.0128 3.23 1015 0.0125 0.0131 4.80 1255 0.0158 0.0159 0.63 1242 0.0160 0.0161 0.62 1496 0.0169 0.0172 1.78 1519 0.0172 0.0175 1.74
209
Page 230
AppendixH
Table H-1: A summary of the effect of reaction conditions on the conversion and selectivity involving Rh-catalyzed hydroformylation
reaction
Reference Catalyst Precursor Substrate [Catalyst] p T t Solvent Olefin Conversion Yield of Aldehyde n/iso
mollm3 bar K h {%) {%)
Klein et a!. Rh(acac)(CO), 1-pentene 0.080 10 393 16 anisole 76.0 99.0 (2001) NAPHOS; NAPHOS:Rh~5,
Huang et a!. Rh.(C0)12 1-octene 11.6 10 353 1.5 THF 96.7 6.5 1.4 (2004)
Rh.(C0),2 + PPh3; P:Rh~5 97.7 93.1 2.4
Rh.(CO)n/MCM-4l(NH2) 25.2 5.9 1.7
Rh.(C0)12/MCM-41(NH2) + 98.9 95.9 2.7 PPh3 ; P:Rh~5
RhCl(PPh,), 20.1 21.4 3.0
RhCl{PPh,)/ MCM-41(NH2) 73.6 61.0 2.9
RhCl{PPh,)/ MCM-4l(NH2) + 92.9 94.5 2.7 PPh3; P:Rh~5
van Rooy et Rh( CO h( acac )tris(2-tertbutyl- 1-octene 0.1 10 353 toluene 44.0 1.9 a!., (1995) 4-methylphenyl) phosphate;
P:Rh~50
Behr et a!. Rh(acac)(C0)2 4-octene 3.33 10 398 4 PC/ dodecane/ 99.0 9.0 (2005) Biphephos; Biphephos:Rh ~ 5 p-xylene
Tijani and Ali HRh(CO)(PPh,)3 1-octene 0.83 14 363 1.5 PC/heptane - 84.0 8.1 (2006) P(OPh), ; P:Rh ~ 12
210
Page 231
Table H-1: (Continue)
Reference Catalyst Precursor Substrate [Catalyst] p T t Solvent Olefin Conversion Yield of Aldehyde n/i mol/m3 bar K h % (%)
suarez et al. RhC1(CO)(TPPMS)2 1-hexene 0.19 68 373 1.5 biphasic 95.0 73.2 1.1 (2006) [TPPMS~P(C6H5),(C6H,S03)] toluene/H20
RhCl(CO)(TPPDS), 96.0 73.9 1.3 [TPPDS~P(C6H5)(C6H,S03)2]
RhCl(CO)(TPPTS)z 94.0 74.3 1.1 [TPPTS~P(CJI,S03),]
Present work HRh(CO)(PPh3) 3 1-octene 0.17 15 363 1.5 PC/dodecane/ 53.0 47.0 9.0 P(OPh),; P:Rh ~ 12 1 ,4-dioxane
211
Page 232
AppendixJ
Kinetic Data
Table J-1: Kinetic data, estimated rate parameters, mean residual sum of squares (MRSS) and standard error of estimation (SEE)
from the empirical rate model.
Hydroformylation of 1-octene with HRh(CO)(PPh3) 3/P(OPh)3 catalyst in TMS-system at temperature of 353 K.
k 0.55 Kco 0.52 m 1.72
[1-octene] [catalyst] PH2 Pco R expt Reale MRSS SEE %SEE 0.19 8.66E-05 7.485 7.485 2.00E-05 2.13E-05 1.57273E-12 6.27E-02 6.27E+OO 0.19 0.000173 7.485 7.485 4.00E-05 4.25E-05 6.04712E-12 6.15E-02 6.15E+OO 0.19 0.000346 7.485 7.485 8.00E-05 8.49E-05 2.41885E-11 6.15E-02 6.15E+OO 0.19 0.000644 7.485 7.485 1.55E-04 1.58E-04 9.33789E-12 1.97E-02 1.97E+OO 0.1 1.73E-04 7.485 7.485 2.45E-05 2.23E-05 4.8097 4E-12 8.94E-02 8.94E+OO
0.212 1.73E-04 7.485 7.485 5.20E-05 4.74E-05 2.13869E-11 8.89E-02 8.89E+OO 0.29 1.73E-04 7.485 7.485 7.00E-05 6.48E-05 2.69779E-11 7.42E-02 7.42E+OO 0.34 1.73E-04 7.485 7.485 8.33E-05 7.60E-05 5.35909E-11 8.79E-02 8.79E+OO 0.39 1.73E-04 7.485 7.485 8.67E-05 8.72E-05 2.05087E-13 5.22E-03 5.22E-01 0.19 1.73E-04 11.23 3.74 8.99E-05 8.79E-05 3.99698E-12 2.22E-02 2.22E+OO 0.19 1.73E-04 10 4.98 7.06E-05 7.01E-05 2.25464E-13 6.73E-03 6.73E-01 0.19 1.73E-04 7.485 7.48506 4.62E-05 4.25E-05 1 .39959E-11 8.10E-02 8.10E+OO 0.19 1.73E-04 3.74 11.23 1.80E-05 1.63E-05 2.95579E-12 9.55E-02 9.55E+OO
1.05807E-11 7.56E-01 5.82E+OO
212
Page 233
Table J-2: Kinetic data, estimated rate parameters, mean residual sum of squares (MRSS) and standard error of estimation (SEE) from
the empirical rate model.
Hydroforrnylation of 1-octene with HRh(CO)(PPh3) 3/ P(OPh)3 catalyst in TMS-system at temperature of 363 K.
k 1.11 Kco 1.18 m 1.60
[1-octene] [catalyst] PH2 Pco Rexpt Reale MRSS SEE %SEE 0.19 8.66E-05 7.485 7.485 2.50E-05 2.64E-05 1.9815E-12 5.63E-02 5.63E+OO 0.19 0.000173 7.485 7.485 5.20E-05 5.28E-05 5.69011E-13 1.45E-02 1.45E+OO 0.19 0.000346 7.485 7.485 1.00E-04 1.06E-04 3.03453E-11 5.51E-02 5.51E+OO 0.19 0.000644 7.485 7.485 1.85E-04 1.96E-04 1.29511E-10 6.15E-02 6.15E+OO 0.1 1.73E-04 7.485 7.485 3.05E-05 2.78E-05 7.42325E-12 8.94E-02 8.94E+OO
0.212 1.73E-04 7.485 7.485 6.50E-05 5.89E-05 3. 76662E-11 9.44E-02 9.44E+OO 0.29 1.73E-04 7.485 7.485 8.40E-05 8.05E-05 1.2112E-11 4.14E-02 4.14E+OO 0.34 1.73E-04 7.485 7.485 1.00E-04 9.44E-05 3.13322E-11 5.60E-02 5.60E+OO 0.39 1.73E-04 7.485 7.485 1.12E-04 1.08E-04 1.37997E-11 3.32E-02 3.32E+OO 0.19 1.73E-04 11.23 3.74 9.77E-05 1.03E-04 2.56597E-11 5.18E-02 5.18E+OO 0.19 1.73E-04 10 4.98 8.50E-05 8.31E-05 3.62952E-12 2.24E-02 2.24E+OO 0.19 1.73E-04 7.485 7.48506 5.80E-05 5.28E-05 2.7519E-11 9.04E-02 9.04E+OO 0.19 1.73E-04 3.74 11.23 2.45E-05 2.18E-05 7 .08915E-12 1.09E-01 1.09E+01
2.00968E-11 6.66E-01 5.96E+OO
213
Page 234
Table J-3: Kinetic data, estimated rate parameters, mean residual sum of squares (MRSS) and standard error of estimation (SEE)
from the empirical rate model.
Hydroformylation of 1-octene with HRh(CO)(PPh3) 3/ P(OPh)3 catalyst in TMS-system at temperature of 373 K.
k 1.97 Kco 2.24 m 1.36
[1-octene] [catalyst] Pm Pco 0.19 8.66E-05 7.485 7.485 0.19 0.000173 7.485 7.485 0.19 0.000346 7.485 7.485 0.19 0.000644 7.485 7.485 0.1 1.73E-04 7.485 7.485
0.212 1.73E-04 7.485 7.485 0.29 1.73E-04 7.485 7.485 0.34 1.73E-04 7.485 7.485 0.39 1.73E-04 7.485 7.485 0.19 1.73E-04 11.23 3.74 0.19 1.73E-04 10 4.98 0.19 1.73E-04 7.485 7.48506
- 0.19 1.73E-04 3.74 11.23
R expt Reale
3.50E-05 3.63E-05 7.00E-05 7.25E-05 1.35E-04 1.45E-04 2.60E-04 2.70E-04 4.12E-05 3.81E-05 8.50E-05 8.09E-05 1.20E-04 1.11E-04 1.37E-04 1.30E-04 1.60E-04 1.49E-04 1.20E-04 1.30E-04 1.13E-04 1.08E-04 8.00E-05 7.25E-05 3.50E-05 3.21E-05
214
MRSS SEE %SEE 1.63815E-12 3.66E-02 3.66E+OO 6.13065E-12 3.54E-02 3.54E+OO 9.90429E-11 7.37E-02 7.37E+OO 9.59441E-11 3.77E-02 3.77E+OO 9.45396E-12 7.46E-02 7.46E+OO 1 . 70736E-11 4.86E-02 4.86E+OO 8. 79603E-11 7.82E-02 7.82E+OO 5.33788E-11 5.33E-02 5.33E+OO 1.2619E-10 7.02E-02 7.02E+OO
9.14029E-11 7.97E-02 7.97E+OO 2.55121 E-11 4.47E-02 4.47E+OO 5.66128E-11 9.41E-02 9.41E+OO 8.35294E-12 8.26E-02 8.26E+OO 4.18963E-11 7.27E-01 6.06E+OO
5.97E+OO
Page 235
Table J-4: Estimated rate parameters, mean residual sum of squares (MRSS) and standard error of estimation (SEE) from the
mechanistic rate model.
Hydroformylation of 1-octene with HRh(CO)(PPh3)3/ P(OPh)3 catalyst in TMS-system at temperature of353 K
k 5.11 E+03 K1 * 1.22E+02 K2* 1.50E+03 K3* 8.80E-01 K4* 8.12E-13
[H2l [CO] [1-octene] [catalyst] Rexpt Rexpt X 10 Reale Reale X 10 MRSS SEE %SEE 0.0747 0.0930 0.19 8.66E-05 2.200E-05 2.200E-01 2.293E-05 2.293E-01 8.712E-13 4.243E-02 4.243E+OO 0.0747 0.0930 0.19 1.73E-04 4.400E-05 4.400E-01 4.581 E-05 4.581 E-01 3.290E-12 4.122E-02 4.122E+OO 0.0747 0.0930 0.19 3.46E-04 9.000E-05 9.000E-01 9.163E-05 9.163E-01 2.649E-12 1.808E-02 1.808E+OO 0.0747 0.0930 0.19 6.44E-04 1.700E-04 1.700E+OO 1.705E-04 1.705E+OO 2.956E-13 3.198E-03 3.198E+OO 0.0747 0.0930 0.1 1.73E-04 2.454E-05 2.454E-01 2.419E-05 2.419E-01 1.241E-13 1.435E-02 1.435E+OO 0.0747 0.0930 0.212 1.73E-04 5.200E-05 5.200E-01 5.108E-05 5.108E-01 8.471 E-13 1.770E-02 1.770E+OO 0.0747 0.0930 0.29 1.73E-04 7.000E-05 7.000E-01 6.969E-05 6.969E-01 9.905E-14 4.496E-03 4.496E+OO 0.0747 0.0930 0.34 1.73E-04 8.000E-05 8.000E-01 8.156E-05 8.156E-01 2.432E-12 1.949E-02 1.949E+OO 0.0747 0.0930 0.39 1.73E-04 9.000E-05 9.000E-01 9.339E-05 9.339E-01 1.151E-11 3.770E-02 3.770E+OO 0.1397 0.0124 0.19 1.73E-04 1.000E-04 1.000E+OO 1.100E-04 1.100E+OO 8.493E-37 9.216E-15 9.216E+OO 0.1120 0.0373 0.19 1.73E-04 8.200E-05 8.200E-01 8.998E-05 8.998E-01 6.372E-11 9.734E-02 9.734E+OO 0.0998 0.0618 0.19 1.73E-04 7.200E-05 7.200E-01 7.176E-05 7.176E-01 5.545E-14 3.271E-03 3.271E-01 0.0747 0.0930 0.19 1.73E-04 4.800E-05 4.800E-01 4.581E-05 4.581 E-01 4.780E-12 4.555E-02 4.555E+OO 0.0373 0.1395 0.19 1.73E-04 2.000E-05 2.000E-01 1.847E-05 1.847E-01 2.328E-12 7.629E-02 7.629E+OO
Average: 8.454E-12 4.211E-01 4.161E+OO
215
Page 236
Table J-5: Estimated rate parameters, mean residual sum of squares (MRSS) and standard error of estimation (SEE) from the
mechanistic rate model.
Hydroformylation of 1-octene with HRh(CO)(PPh3) 3/ P(OPh)3 catalyst in TMS-system at temperature of 363 K.
k 8.01E+03 K1 * 2.02E+02 K2* 1.30E+03 K3* 6.80E-03 K4* 4.33E-14
[H2l [CO] [1-octene] [catalyst] Rexpt RexptX 10" Reale Rca1e X 1 o• MRSS SEE %SEE 0.0754 0.0949 0.19 8.66E-05 2.800E-05 2.800E-01 2.962E-05 2.962E-01 2.618E-12 5.779E-02 5.779E+OO 0.0754 0.0949 0.19 1.73E-04 5.800E-05 5.800E-01 5.917E-05 5.917E-01 1.364E-12 2.014E-02 2.014E+OO 0.0754 0.0949 0.19 3.46E-04 1.190E-04 1.190E+OO 1.183E-04 1.183E+OO 4.411 E-13 5.581E-03 5.581E+OO 0.0754 0.0949 0.19 6.44E-04 2.220E-04 2.220E+OO 2.203E-04 2.203E+OO 3.045E-12 7.860E-03 O.OOOE+OO 0.0754 0.0949 0.1 1.73E-04 3.000E-05 3.000E-01 3.114E-05 3.114E-01 1.303E-12 3.805E-02 3.805E+OO 0.0754 0.0949 0.212 1.73E-04 6.800E-05 6.800E-01 6.602E-05 6.602E-01 3.926E-12 2.914E-02 2.914E+OO 0.0754 0.0949 0.29 1.73E-04 9.200E-05 9.200E-01 9.031 E-05 9.031E-01 2.866E-12 1.840E-02 1.840E+OO 0.0754 0.0949 0.34 1.73E-04 1.070E-04 1.070E+OO 1.059E-04 1.059E+OO 1.263E-12 1.050E-02 1.050E+OO 0.0754 0.0949 0.39 1.73E-04 1.220E-04 1.220E+OO 1.214E-04 1.214E+OO 3.083E-13 4.551E-03 4.551E+OO 0.1411 0.0127 0.19 1.73E-04 1.250E-04 1.250E+OO 1.250E-04 1.250E+OO 7.347E-40 2.168E-16 2.168E+OO 0.1132 0.0381 0.19 1.73E-04 9.770E-05 9.770E-01 1.074E-04 1.074E+OO 9.372E-11 9.909E-02 9.909E+OO 0.1008 0.0632 0.19 1.73E-04 8.600E-05 8.600E-01 8.854E-05 8.854E-01 6.468E-12 2.957E-02 2.957E+OO 0.0754 0.0949 0.19 1.73E-04 6.000E-05 6.000E-01 5.917E-05 5.917E-01 6.924E-13 1.387E-02 1.387E+OO 0.0377 0.1424 0.19 1.73E-04 2.500E-05 2.500E-01 2.519E-05 2.519E-01 3.762E-14 7.758E-03 7.758E-01
Average: 1.180E-11 3.344E-01 4.867E+OO
216
Page 237
Table J-6: Estimated rate parameters, mean residual sum of squares (MRSS) and standard error of estimation (SEE) from the
mechanistic rate model.
Hydroformylation of 1-octene with HRh(CO)(PPh3) 3/ P(OPh)3 catalyst in TMS-system at temperature of373 K.
k 1.00E+04 K1 * 2.25E+02 K2* 9. 70E+02 K3* 9.67E-06 K4* 7.06E+OO
[H2J [CO] [1-octene] [catalyst] R.xpt R.xpt X 104
Reale Reate X 104 MRSS SEE %SEE
0.0765 0.0990 0.19 8.66E-05 3.700E-05 3.700E-01 3.789E-05 3.7893E-01 7.971E-13 2.413E-02 2.413E+OO 0.0765 0.0990 0.19 1.73E-04 7.500E-05 7.500E-01 7.570E-05 7.5698E-01 4.873E-13 9.307E-03 9.307E-01 0.0765 0.0990 0.19 3.46E-04 1.490E-04 1.490E+OO 1.514E-04 1.5140E+OO 5.741E-12 1.608E-02 1.608E+OO 0.0765 0.0990 0.19 6.44E-04 2.820E-04 2.820E+OO 2.818E-04 2.8179E+OO 4.441E-14 7.473E-04 7.473E-02 0.0765 0.0990 0.1 1.73E-04 4.122E-05 4.122E-01 3.992E-05 3.9917E-01 1.697E-12 3.160E-02 3.160E+OO 0.0765 0.0990 0.212 1.73E-04 8.500E-05 8.500E-01 8.442E-05 8.4424E-01 3.322E-13 6.781E-03 6.781E+OO 0.0765 0.0990 0.29 1.73E-04 1.200E-04 1.200E+OO 1.153E-04 1.1529E+OO 2.214E-11 3.922E-02 3.922E+OO 0.0765 0.0990 0.34 1.73E-04 1.400E-04 1.400E+OO 1.350E-04 1.3503E+OO 2.471E-11 3.550E-02 3.550E+OO 0.0765 0.0990 0.39 1.73E-04 1.600E-04 1.600E+OO 1.547E-04 1.5472E+OO 2.785E-11 3.298E-02 3.298E+OO 0.1431 0.0132 0.19 1.73E-04 1.500E-04 1.500E+OO 1.496E-04 1.4960E+OO 1.598E-13 2.665E-03 2.665E-01 0.1148 0.0397 0.19 1.73E-04 1.250E-04 1.250E+OO 1.302E-04 1.3024E+OO 2.745E-11 4.191E-02 4.191E+OO 0.1022 0.0659 0.19 1.73E-04 1.100E-04 1.100E+OO 1.101E-04 1.1012E+OO 1.324E-14 1.046E-03 1.046E-01 0.0765 0.0990 0.19 1.73E-04 7.500E-05 7.500E-01 7.570E-05 7.5698E-01 4.873E-13 9.307E-03 9.307E-01 0.0382 0.1486 0.19 1.73E-04 3.300E-05 3.300E-01 3.333E-05 3.3335E-01 1.120E-13 1.014E-02 1.014E+OO
Average: 1.120E-11 2.614E-01 4.538E+OO
217
Page 238
Table J-7: Kinetic data, estimated rate parameters, mean residual sum of squares (MRSS) and standard error of estimation (SEE) from
the mechanistic rate model.
Hydroformylation of 1-dodecene with HRh(CO)(PPh3) 3/ P(OPh)3 catalyst in TMS-system at temperature of 353 K.
k 700.006 K1* 0.986379 K2* 2437.357 K3* 0.624826 K4* 0.996482
[H2l [CO] [1-octene] [catalyst] R.xpt R.xpt X 10" Reale Reale X 104 MRSS SEE %SEE
0.0748 0.0931 0.5 8.66E-05 9.500E-06 9.500E-02 9.347E-06 9.347E-02 2.340E-14 1.610E-02 1.610E+OO 0.0748 0.0931 0.5 1.73E-04 2.000E-05 2.000E-01 1.867E-05 1.867E-01 1.762E-12 6.638E-02 6.638E+OO 0.0748 0.0931 0.5 3.46E-04 3.700E-05 3.700E-01 3.734E-05 3.734E-01 1.190E-13 9.323E-03 9.323E-01 0.0748 0.0931 0.2 8.66E-05 3.900E-06 3.900E-02 3.775E-06 3.775E-02 1.568E-14 3.211E-02 3.211 E+OO 0.0748 0.0931 0.5 8.66E-05 9.200E-06 9.200E-02 9.347E-06 9.347E-02 2.162E-14 1.598E-02 1.598E+OO 0.0748 0.0931 0.675 8.66E-05 1.200E-05 1.200E-01 1.255E-05 1.255E-01 3.011E-13 4.573E-02 4.573E+OO 0.0499 0.0621 0.5 8.66E-05 8.800E-06 8.800E-02 8.690E-06 8.690E-02 1.219E-14 1.255E-02 1.255E+OO 0.1272 0.0621 0.5 8.66E-05 2.200E-05 2.200E-01 2.216E-05 2.216E-01 2.510E-14 7.202E-03 7.202E+OO 0.1496 0.0621 0.5 8.66E-05 2.550E-05 2.550E-01 2.607E-05 2.607E-01 3.235E-13 2.230E-02 2.230E+OO 0.0499 0.0124 0.5 8.66E-05 1.100E-05 1.100E-01 1.100E-05 1.100E-01 1.545E-37 3.573E-14 3.573E-12 0.0499 0.0248 0.5 8.66E-05 1.300E-05 1.300E-01 1.316E-05 1.316E-01 2.599E-14 1.240E-02 1.240E+OO 0.0499 0.0373 0.5 8.66E-05 1.200E-05 1.200E-01 1.185E-05 1.185E-01 2.107E-14 1.210E-02 1.210E+OO 0.0499 0.0621 0.5 8.66E-05 8.500E-06 8.500E-02 8.690E-06 8.690E-02 3.594E-14 2.230E-02 2.230E+OO 0.0499 0.1242 0.5 8.66E-05 5.000E-06 5.000E-02 4.803E-06 4.803E-02 3.885E-14 3.942E-02 3.942E+OO 0.0499 0.1863 0.5 8.66E-05 3.500E-06 3.500E-02 3.268E-06 3.268E-02 5.381 E-14 6.628E-02 6.628E+OO
Average: 2.527E-13 3.802E-01 3.501E+OO
218
Page 239
Table J-8: Kinetic data, estimated rate parameters, mean residual sum of squares (MRSS) and standard error of estimation (SEE) from
the mechanistic rate model.
Hydroformylation of 1-dodecene with HRh(CO)(PPh3) 3/ P(OPh)3 catalyst in TMS-system at temperature of 363 K.
k 1366.306 K1* 2218.616 K2* 0.169272 K3* 0.479424 K4* 5.347078
[H2l [CO] [1-octene] [catalyst] R.xpt Rexpt X 104
Reale R"'' X 104
MRSS SEE %SEE 0.0756 0.0951 0.5 8.66E-05 2.000E-05 2.000E-01 1.961 E-05 1.961E-01 1.536E-13 1.960E-02 1.960E+OO 0.0756 0.0951 0.5 1.73E-04 3.780E-05 3.780E-01 3.917E-05 3.917E-01 1.879E-12 3.627E-02 3.627E+OO 0.0756 0.0951 0.5 3.46E-04 7.650E-05 7.650E-01 7.834E-05 7.834E-01 3.392E-12 2.408E-02 2.408E+OO 0.0756 0.0951 0.2 8.66E-05 7.800E-06 7.800E-02 7.867E-06 7.867E-02 4.437E-15 8.540E-03 8.540E-01 0.0756 0.0951 0.5 8.66E-05 2.000E-05 2.000E-01 1.961 E-05 1.961 E-01 1.536E-13 1.960E-02 1.960E+OO 0.0756 0.0951 0.675 8.66E-05 2.600E-05 2.600E-01 2.643E-05 2.643E-01 1.807E-13 1.635E-02 1.635E+OO 0.0504 0.0634 0.5 8.66E-05 1.800E-05 1.800E-01 1.824E-05 1.824E-01 5.973E-14 1.358E-02 O.OOOE+OO 0.1285 0.0634 0.5 8.66E-05 4.600E-05 4.600E-01 4.652E-05 4.652E-01 2.737E-13 1.137E-02 1.137E+OO 0.1512 0.0634 0.5 8.66E-05 5.350E-05 5.350E-01 5.473E-05 5.473E-01 1.521E-12 2.305E-02 2.305E+OO 0.0504 0.0127 0.5 8.66E-05 2.500E-05 2.500E-01 2.500E-05 2.500E-01 2.155E-35 1.857E-13 1.857E+OO 0.0504 0.0254 0.5 8.66E-05 2.900E-05 2.900E-01 2.849E-05 2.849E-01 2.577E-13 1.750E-02 1.750E+OO 0.0504 0.0381 0.5 8.66E-05 2.450E-05 2.450E-01 2.515E-05 2.515E-01 4.269E-13 2.667E-02 2.667E+OO 0.0504 0.0634 0.5 8.66E-05 1.830E-05 1.830E-01 1.824E-05 1.824E-01 3.093E-15 3.039E-03 3.039E-01 0.0504 0.1268 0.5 8.66E-05 9.700E-06 9.700E-02 1.009E-05 1.009E-01 1.493E-13 3.984E-02 3.984E+OO 0.0504 0.1903 0.5 8.66E-05 6.800E-06 6.800E-02 6.878E-06 6.878E-02 6.116E-15 1.150E-02 1.150E+OO
Average. 7.692E-13 2.574E-01 3.755E+OO
219
Page 240
Table J-9: Kinetic data, estimated rate parameters, mean residual sum of squares (MRSS) and standard error of estimation (SEE)
from the mechanistic rate model.
Kinetic data for the hydroformylation of 1-dodecene with HRh(CO)(PPh3)3/P(OPh)3 catalyst in TMS-system at temperature of373 K.
k 2686.86 K1* 2044.202 K2* 0.019827 K3* 0.101234 K4* 34.81747
[H2l [CO] [1-octene] [catalyst] R.xpt R.xpt X 104
Reale Reale X 10 MRSS SEE %SEE
0.0766 0.0992 0.5 8.66E-05 3.300E-05 3.300E-01 3.597E-05 3.597E-01 8.819E-12 8.999E-02 8.999E+OO 0.0766 0.0992 0.5 1.73E-04 6.500E-05 6.500E-01 7.186E-05 7.186E-01 4.701 E-11 1.055E-01 1.055E+01 0.0766 0.0992 0.5 3.46E-04 1.270E-04 1.270E+OO 1.437E-04 1.437E+OO 2.793E-10 1.316E-01 1.316E+01 0.0766 0.0992 0.2 8.66E-05 1.450E-05 1.450E-01 1.439E-05 1.439E-01 1.143E-14 7.373E-03 7.373E-01 0.0766 0.0992 0.5 8.66E-05 3.800E-05 3.800E-01 3.597E-05 3.597E-01 4.122E-12 5.343E-02 5.343E+OO 0.0766 0.0992 0.675 8.66E-05 5.000E-05 5.000E-01 4.855E-05 4.855E-01 2.106E-12 2.903E-02 2.903E+OO 0.0511 0.0662 0.5 8.66E-05 3.200E-05 3.200E-01 3.207E-05 3.207E-01 4.707E-15 2.144E-03 2.144E-01 0.1303 0.0662 0.5 8.66E-05 8.500E-05 8.500E-01 8.177E-05 8.177E-01 1.040E-11 3.794E-02 3.794E+OO 0.1533 0.0662 0.5 8.66E-05 1.000E-04 1.000E+OO 9.621E-05 9.621 E-01 1.440E-11 3.794E-02 3.794E+OO 0.0511 0.0132 0.5 8.66E-05 4.300E-05 4.300E-01 4.300E-05 4.300E-01 4.284E-29 1.522E-10 1.522E+OO 0.0511 0.0265 0.5 8.66E-05 4.700E-05 4.700E-01 4.676E-05 4.676E-01 5.734E-14 5.095E-03 5.095E-01 0.0511 0.0397 0.5 8.66E-05 4.100E-05 4.100E-01 4.202E-05 4.202E-01 1.051E-12 2.500E-02 2.500E+OO 0.0511 0.0662 0.5 8.66E-05 3.200E-05 3.200E-01 3.207E-05 3.207E-01 4.707E-15 2.144E-03 2.144E-01 0.0511 0.1323 0.5 8.66E-05 2.000E-05 2.000E-01 1.899E-05 1.899E-01 1.012E-12 5.031E-02 5.031E+OO 0.0511 0.1985 0.5 8.66E-05 1.300E-05 1.300E-01 1.334E-05 1.334E-01 1.147E-13 2.605E-02 2.605E+OO
Average. 3.339E-11 5.272E-01 3.550E+OO
220
Page 241
AppendixK
AAS Standard Calibration Curve
This appendix includes the AAS standard calibration curve for the quantitative analysis
of rhodium.
O.Ql8
0.016
0.014
0.012
</]
~ O.Ql
< 0.008
0.006
0.004
0.002
0
0 2 4
y ~ 0.0013x + 0.0053
R2 ~ 0.9951
6 8
Concentration (ppm)
Figure K-1: Rhodium standard curve
221
10
Page 242
APPENDIXL
Experimental Tie-Line Data
Table L-1: Experimental tie-line data for TMS (PC+1,4-dioxane+dodecane)+l-octene system.
Polar-rich phase (weight fraction) Non-polar rich phase (weight fraction) PC 1 ,4-dioxane dodecane 1-octene PC I ,4-dioxane dodecane 1-octene 298.15 K
0.1593 0.6596 0.1460 0.0351 0.1174 0.1380 0.2866 0.4580 0.1992 0.6437 0.1202 0.0369 0.1276 0.1509 0.4345 0.2870 0.2303 0.6074 0.1096 0.0527 0.1444 0.1522 0.4864 0.2170
308.15 K 0.1486 0.6656 0.1344 0.0514 0.2733 0.1480 0.1507 0.4280 0.1935 0.6607 0.1112 0.0346 0.3929 0.1589 0.2045 0.2437 0.1974 0.6459 0.1013 0.0554 0.3887 0.1599 0.2464 0.2050
Table L-2: Experimental tie-line data for TMS (PC+1,4-dioxane+dodecane)+nonanal system.
Polar-rich phase (weight fraction) Non-polar rich phase (weight fraction) PC I ,4-dioxane dodecane non anal PC I ,4-dioxane dodecane nonanal 298.15 K
0.1489 0.7225 0.1238 0.0048 0.1219 0.4206 0.3475 0.1100 0.1739 0.6646 0.1506 0.0109 0.1253 0.3554 0.3693 0.1500 0.1972 0.6325 0.1578 0.0125 0.0446 0.3405 0.3849 0.2300
308.15 K 0.1381 0.7300 0.1271 0.0048 0.1333 0.4195 0.3467 0.1006 0.1724 0.6541 0.1649 0.0086 0.1018 0.4380 0.3565 0.1037 0.1862 0.6439 0.1578 0.0121 0.0149 0.3760 0.4052 0.2039
222
Page 243
Table L-3. Experimental tie-line data for TMS (PC+ 1,4-dioxane+dodecane)+ 1-octene+nonanal system.
Polar-rich Ehase (weight fraction) Non-Eolar rich Ehase (weight fraction) PC 1,4-dioxane dodecane 1-octene non anal PC 1 ,4-dioxane dodecane 1-octene nonanal 298.15 K 0.1079 0.7096 0.1460 0.0361 0.0004 0.0104 0.1380 0.3066 0.4580 0.0870 0.0489 0.7837 0.1202 0.0379 0.0093 0.0146 0.1509 0.3045 0.2870 0.2430 0.1563 0.6674 0.1096 0.0537 0.0130 0.0154 0.1522 0.3164 0.2170 0.2990 0.0283 0.7774 0.1317 0.0565 0.0061 0.0629 0.1390 0.3081 0.1310 0.3590 0.0600 0.5485 0.2026 0.0814 0.1075 0.0119 0.1276 0.3199 0.3580 0.1826 308.15 K 0.0772 0.7356 0.1344 0.0524 0.0004 0.0901 0.1480 0.2507 0.4280 0.0832 0.1059 0.7407 0.1112 0.0356 0.0066 0.0919 0.1589 0.2845 0.2437 0.2210 0.1731 0.6759 0.1013 0.0364 0.0134 0.0707 0.1599 0.2764 0.2050 0.2880 0.1000 0.6947 0.1280 0.0702 0.0071 0.0783 0.1590 0.2958 0.1210 0.3459 0.0822 0.6000 0.2057 0.0608 0.0514 0.1311 0.1386 0.2599 0.3248 0.1456 0.1821 0.5399 0.1289 0.1094 0.0398 0.0996 0.1717 0.3885 0.2115 0.1287
Table L-4: Experimental tie-line data for TMS (PC+1,4-dioxane+dodecane)+P(OPh)3+ HRh(CO)(PPh3)3+ 1-octene+nonanal system.
Polar-rich phase (weight fraction) Non-Eolar rich Ehase (weight fraction) 1,4- 1,4-
PC dioxane dodecane P(OPh)3 catalyst 1-octene nonanal PC dioxane dodecane P(OPh), catalyst 1-octene nonanal
298.15 K 0.0914 0.7300 0.0400 0.0957 0.0073 0.0056 0.0301 0.0080 0.4970 0.3190 0.0055 0.0011 0.1370 0.0324 0.0930 0.7500 0.0166 0.0915 0.0037 0.0361 0.0091 0.0092 0.0830 0.8050 0.0098 0.0001 0.0534 0.0395 0.1343 0.7526 0.0150 0.0109 0.0032 0.0770 0.0070 0.0031 0.1200 0.7520 0.0066 0.0001 0.0856 0.0326 0.2127 0.7210 0.0154 0.0141 0.0053 0.0230 0.0085 0.1146 0.1485 0.5540 0.0020 0.0000 0.1275 0.0534 0.1158 0.6830 0.0157 0.0811 0.0044 0.0610 0.0390 0.0117 0.1010 0.7110 0.0099 0.0001 0.1246 0.0417 0.0419 0.7400 0.0281 0.0925 0.0031 0.0260 0.0684 0.0058 0.6310 0.2060 0.0085 0.0001 0.0740 0.0747 308.15 K 0.0825 0.6410 0.0376 0.1940 0.0071 0.0055 0.0323 0.0052 0.4759 0.3256 0.0050 0.0001 0.1530 0.0352 0.0502 0.7850 0.0162 0.1000 0.0043 0.0356 0.0087 0.0063 0.0808 0.8146 0.0080 0.0001 0.0528 0.0375 0.1206 0.7689 0.0140 0.0100 0.0026 0.0769 0.0070 0.0029 0.1190 0.7480 0.0060 0.0001 0.0859 0.0381 0.1600 0.7709 0.0153 0.0120 0.0051 0.0287 0.0081 0.0601 0.1419 0.6024 0.0019 0.0003 0.1377 0.0557 0.1302 0.6980 0.0155 0.0521 0.0043 0.0615 0.0385 0.0225 0.1000 0.6980 0.0099 0.0000 0.1246 0.0450 0.0392 0.7387 0.0272 0.0903 0.0033 0.0372 0.0641 0.0058 0.6288 0.2134 0.0108 0.0001 0.0702 0.0710
223
Page 244
APPENDIXM
Papers Published/Presented
M-1 Papers Published in International Journal
i) Shaharun, M.S., Mukhtar, H., Dutta, B.K. (2008). Solubility of carbon monoxide
and hydrogen in propylene carbonate and thermomorphic multicomponent
hydroformylation solvent. Chern Eng Sci. 63, 3024-3035.
ii) Shaharun, M.S., Mukhtar, H., Dutta, B.K. (2009). Ab Initio Energy Calculations
and Macroscopic Rate Modeling of Hydroformylation of Higher Alkenes by Rh
based Catalyst. AIChE J. (accepted).
iii) Shaharun, M.S., Dutta, B.K. Mukhtar, H., Maitra, S. (2009). Hydroformylation of
1-octene using rhodium-phosphite catalyst in a thermomorphic solvent system -
In Press.
M-2 Papers Presented in Local and International Conference
i) Shaharun, M.S., Mukhtar, H., Bhatia, S., Dutta, B.K. (2008). Hydrofromylation of
1-octene using rhodium-phosphite catalyst in a thermomorphic solvent system.
National Postgraduate Conference (NPC), 31st March 2008, Tronoh, Perak.
ii) Shaharun, M.S., Mukhtar, H., Bhatia, S., Dutta, B.K. (2008). Hydroformylation of
1-octene using rhodium-phosphite catalyst in a thermomorphic solvent system.
20th International Symposium on Chemical Reaction Engineering (ISCRE), 7-
10th September, 2008, Kyoto, Japan.
iii) Shaharun, M.S., Mukhtar, H., Bhatia, S., Yusup, S., Dutta, B.K. (2008). Kinetics
of hydroformy1ation of higher olefins using rhodium-phosphite catalyst in a
thermomorphic solvent system. 2008 Annual Meeting - AIChE, 16-21st
November, 2008, Philadelphia, USA.
224


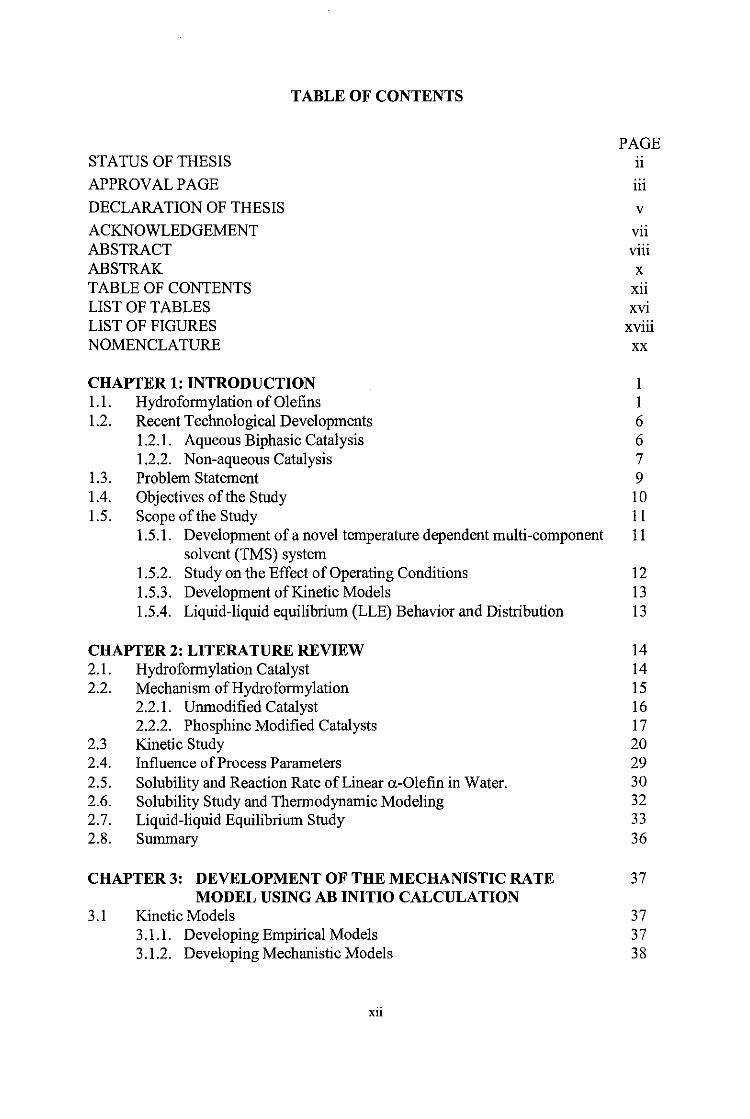


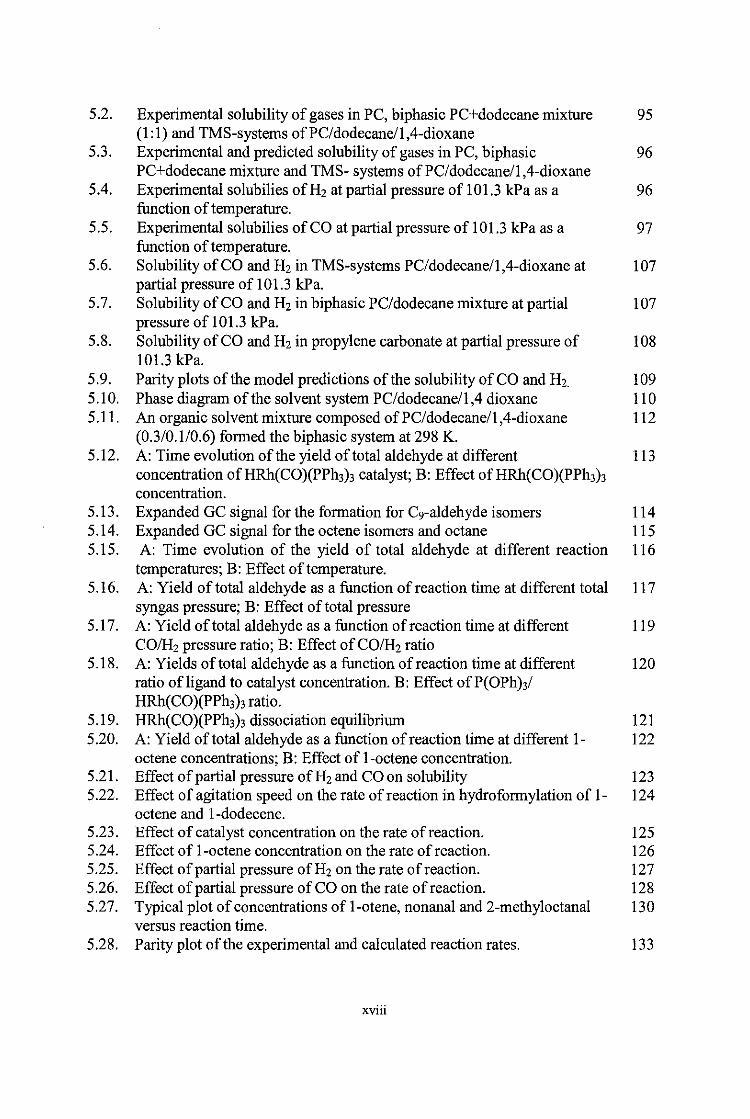


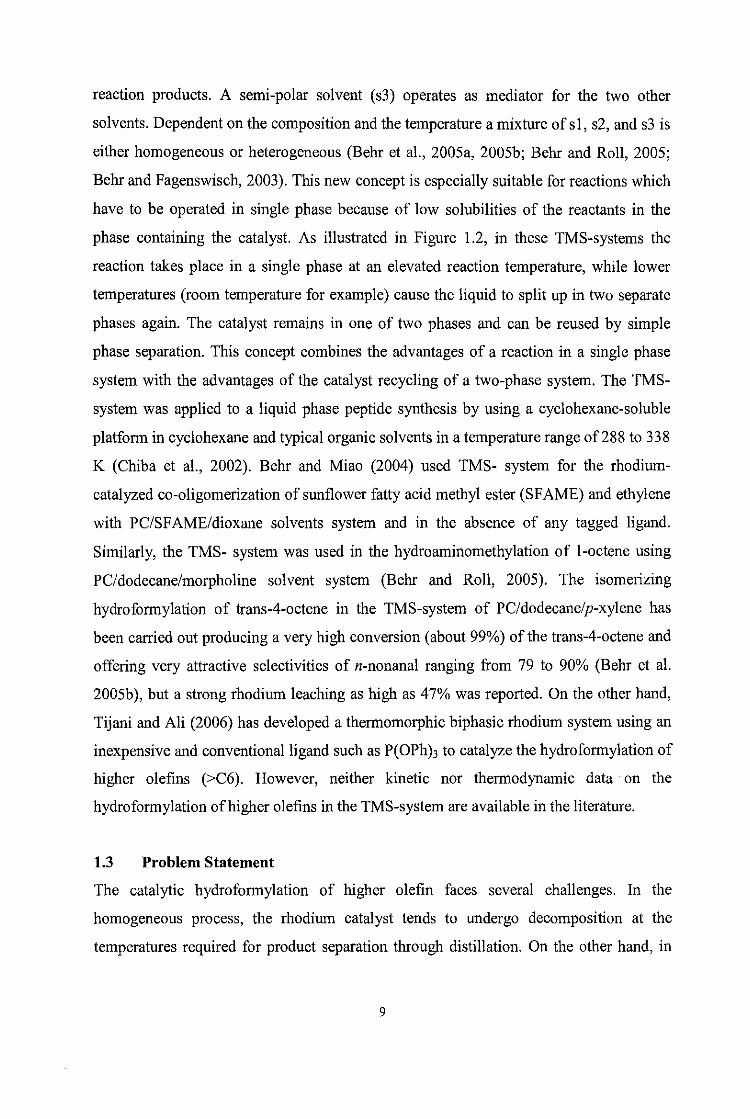


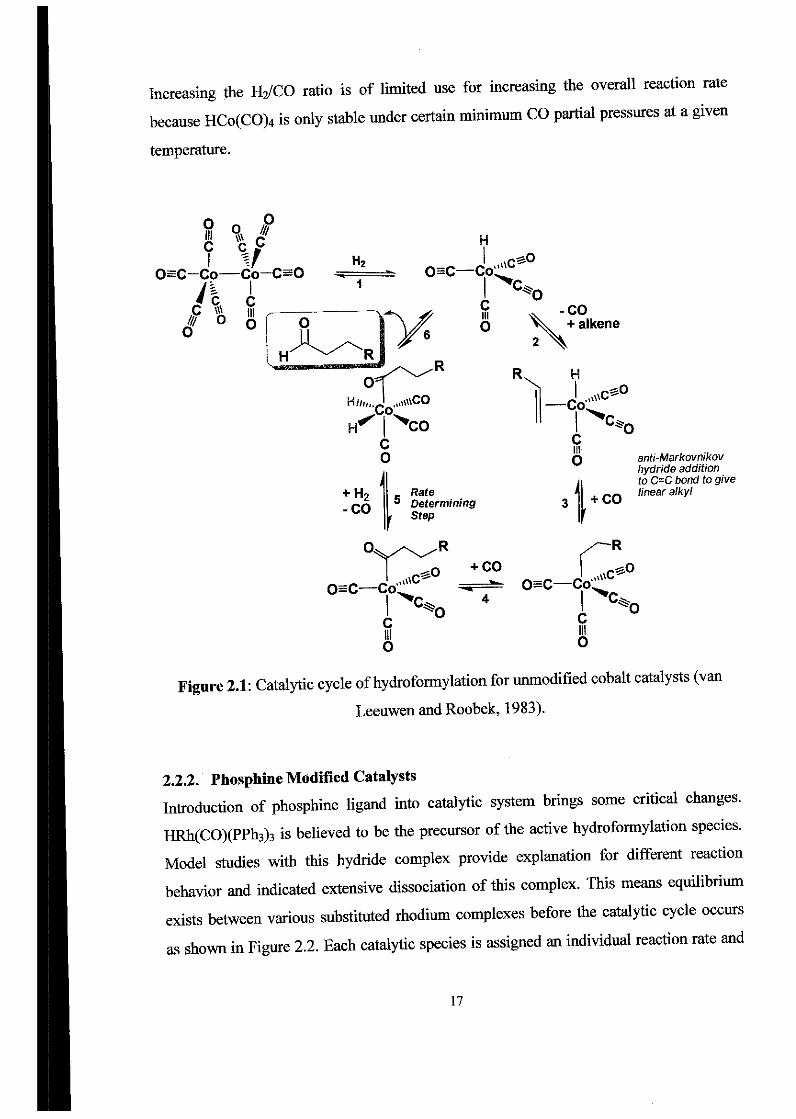


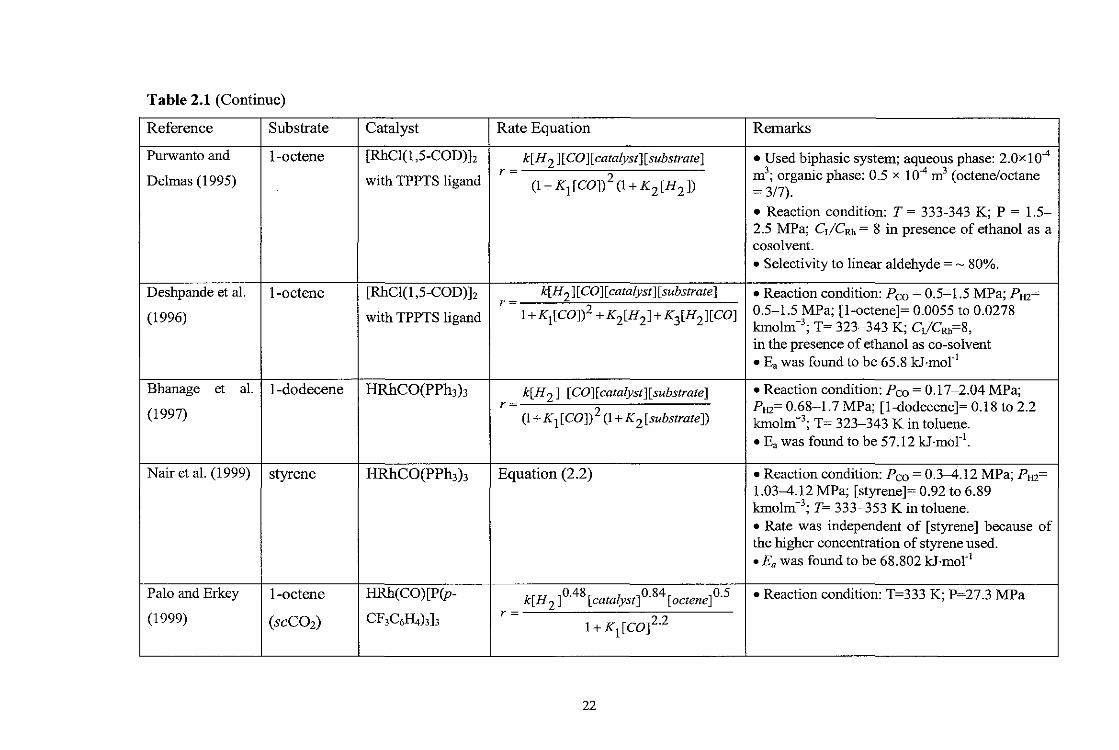

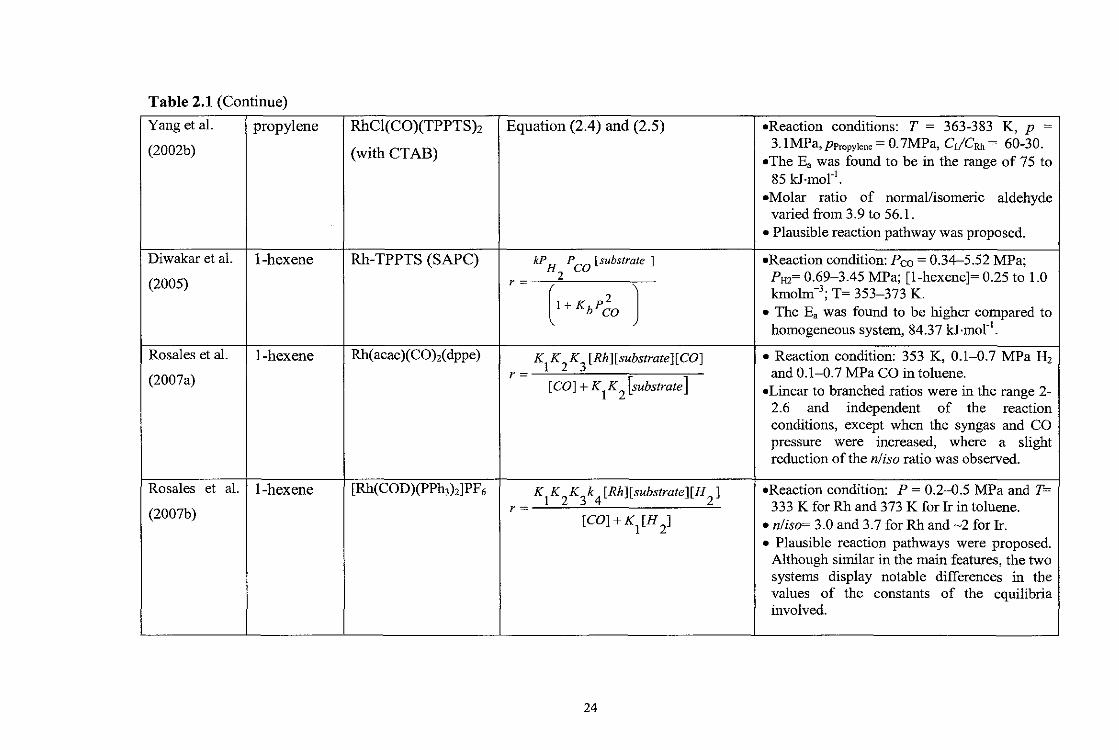
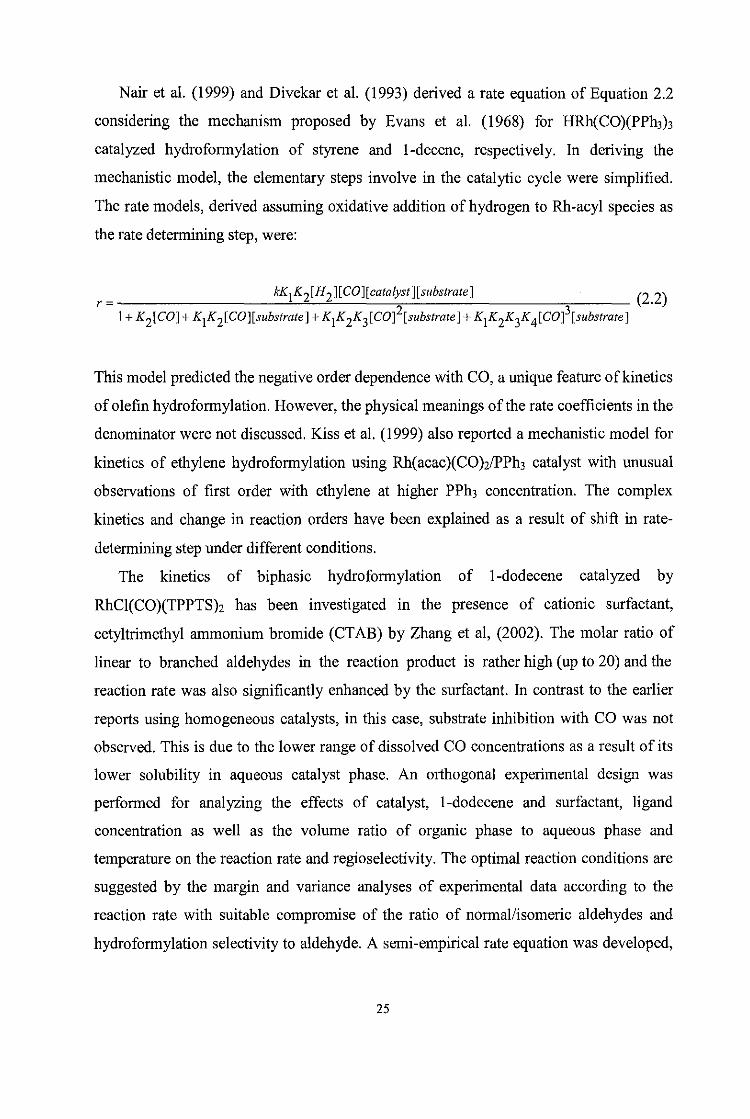


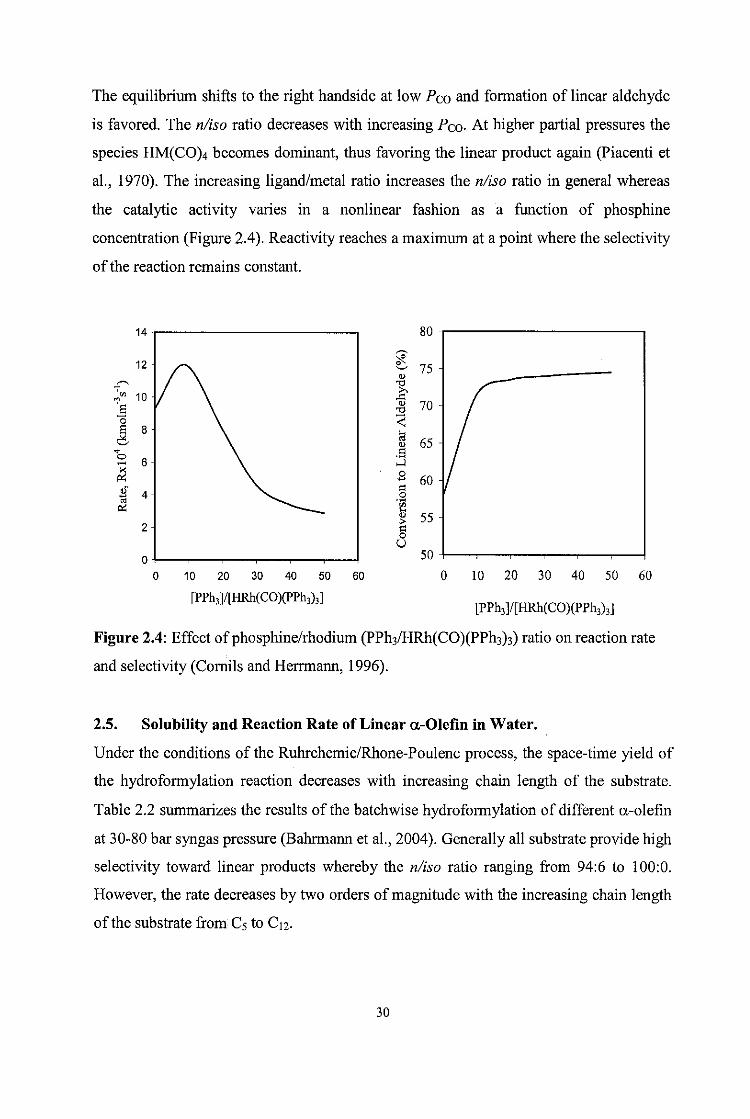


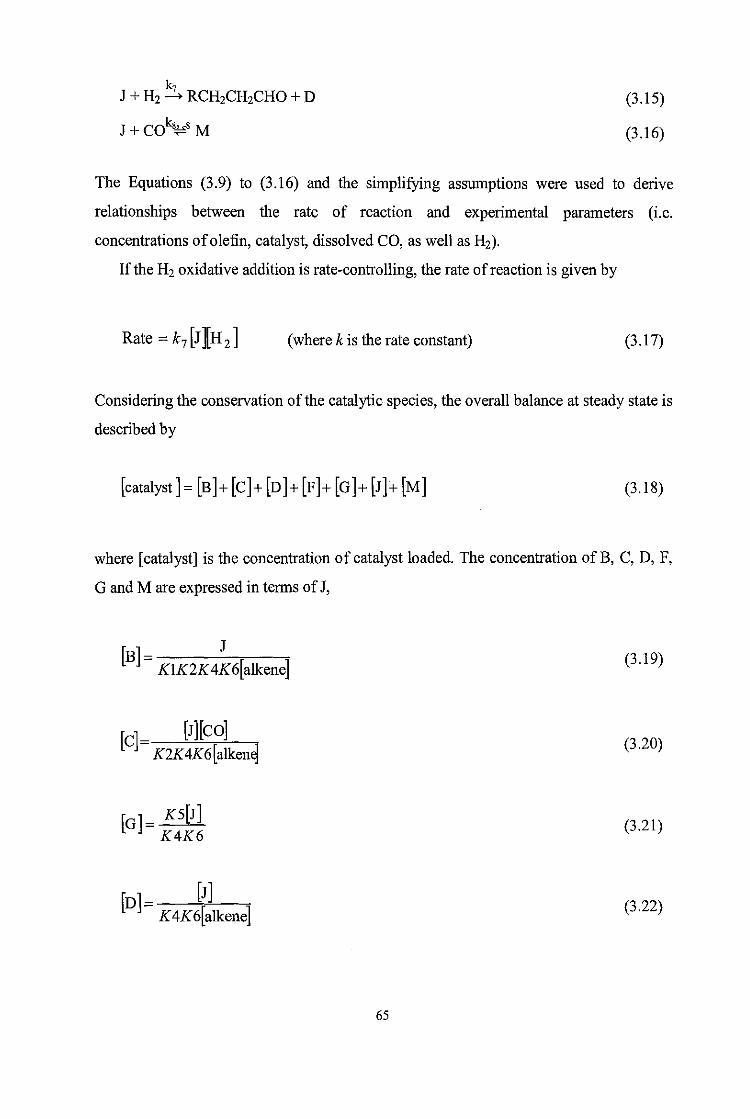


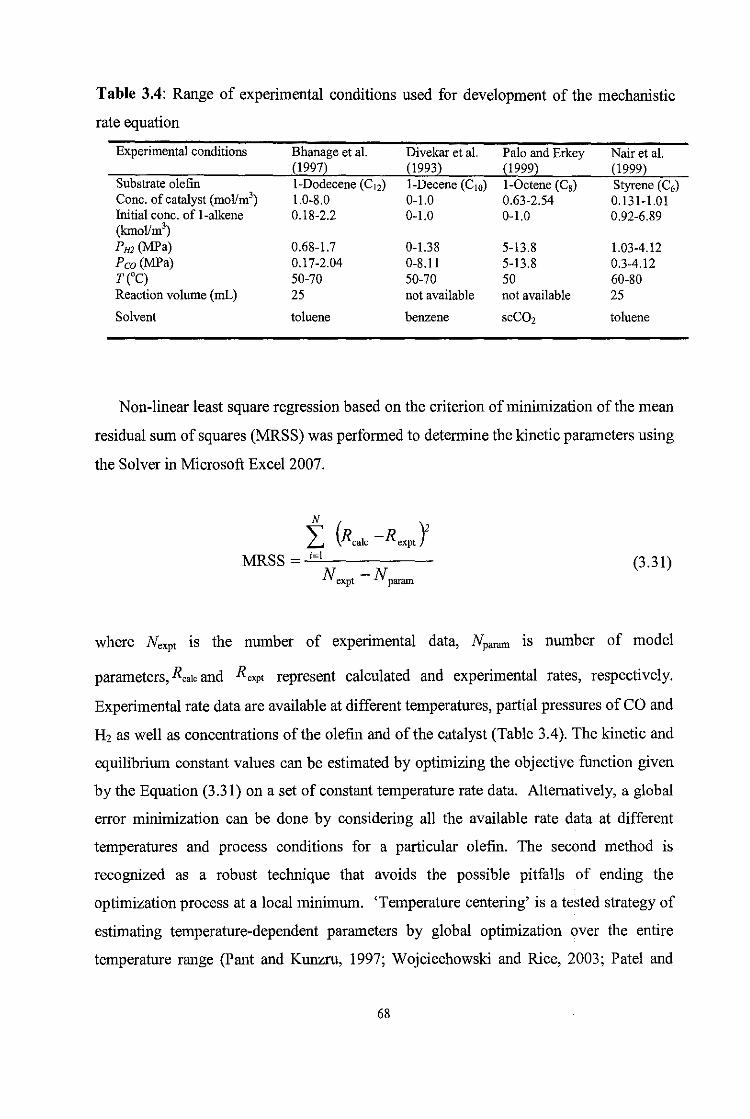


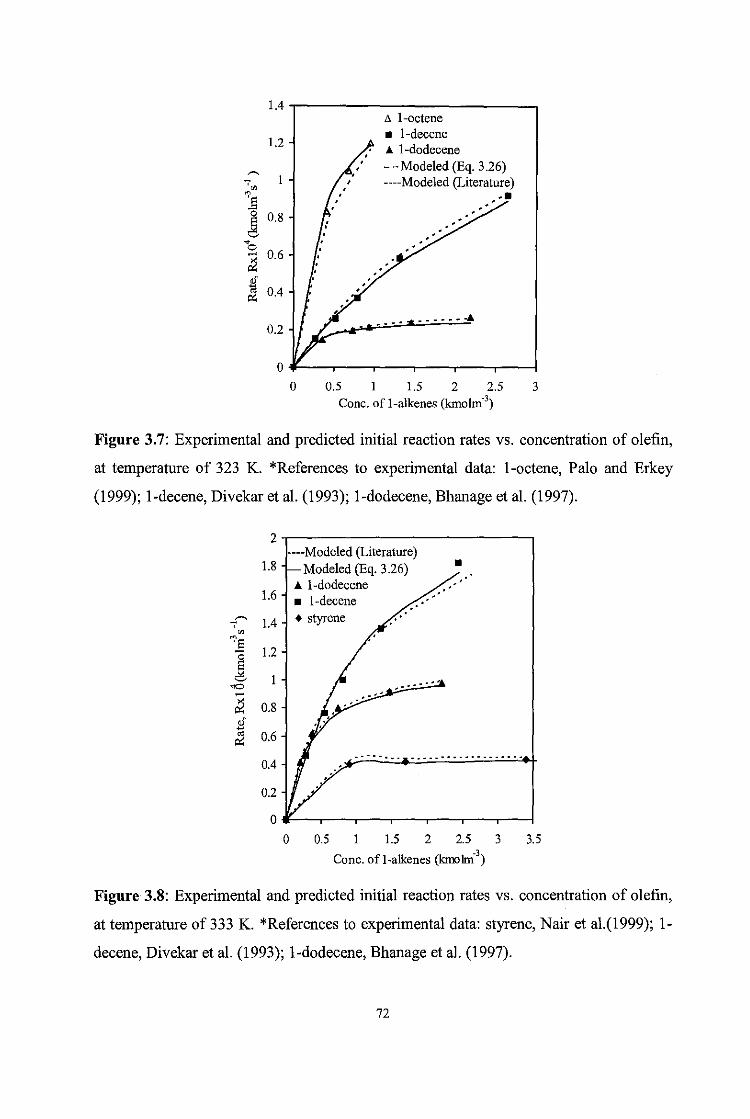

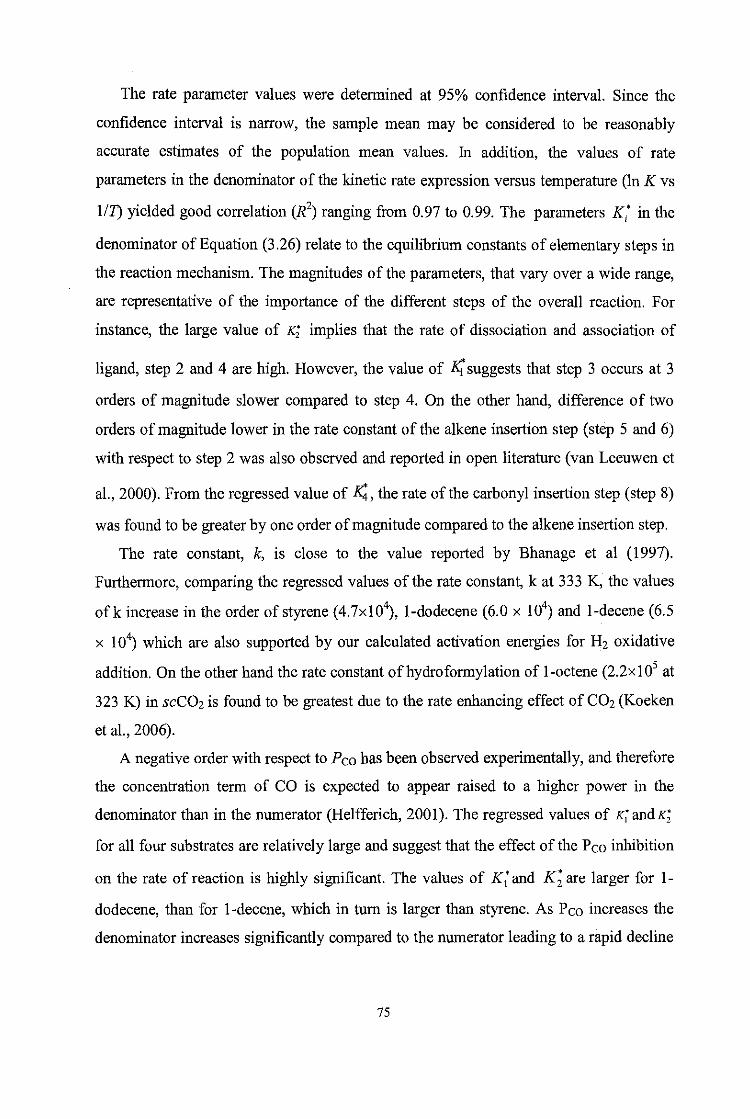


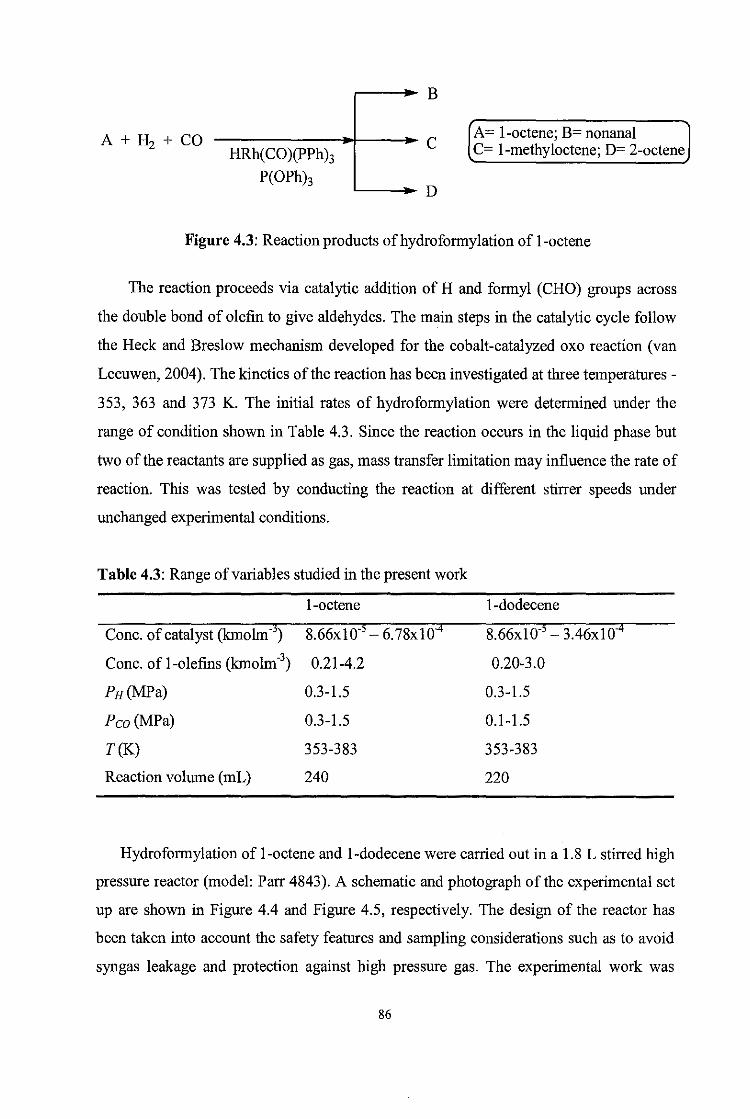
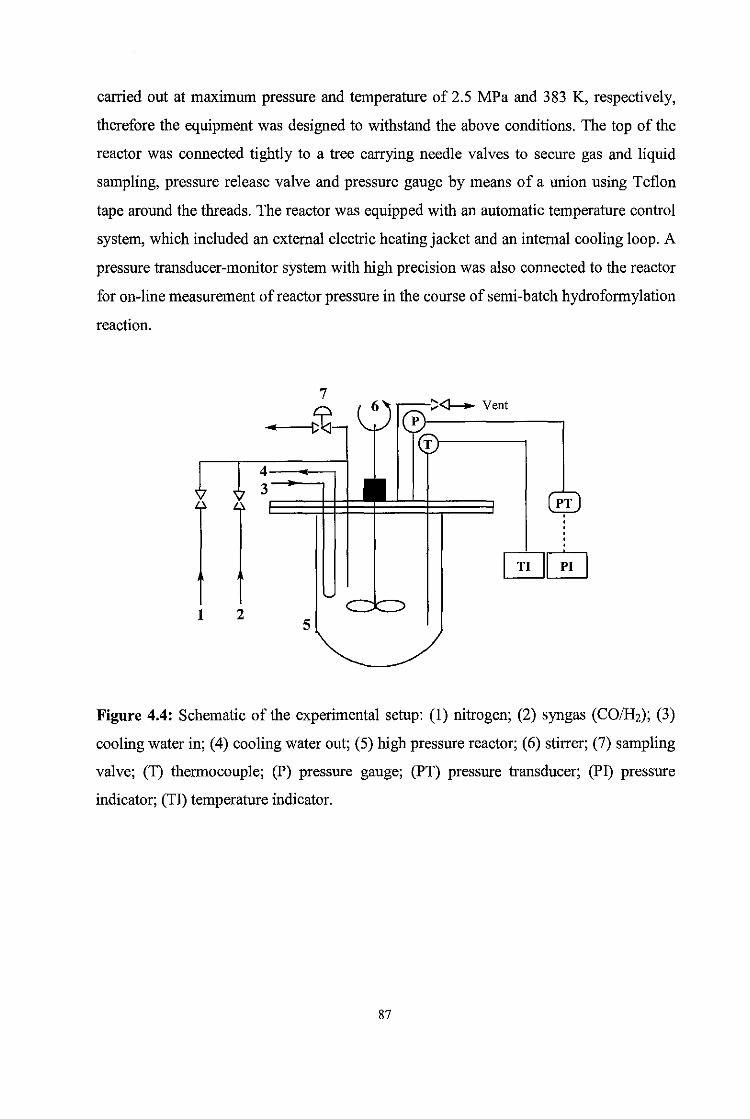
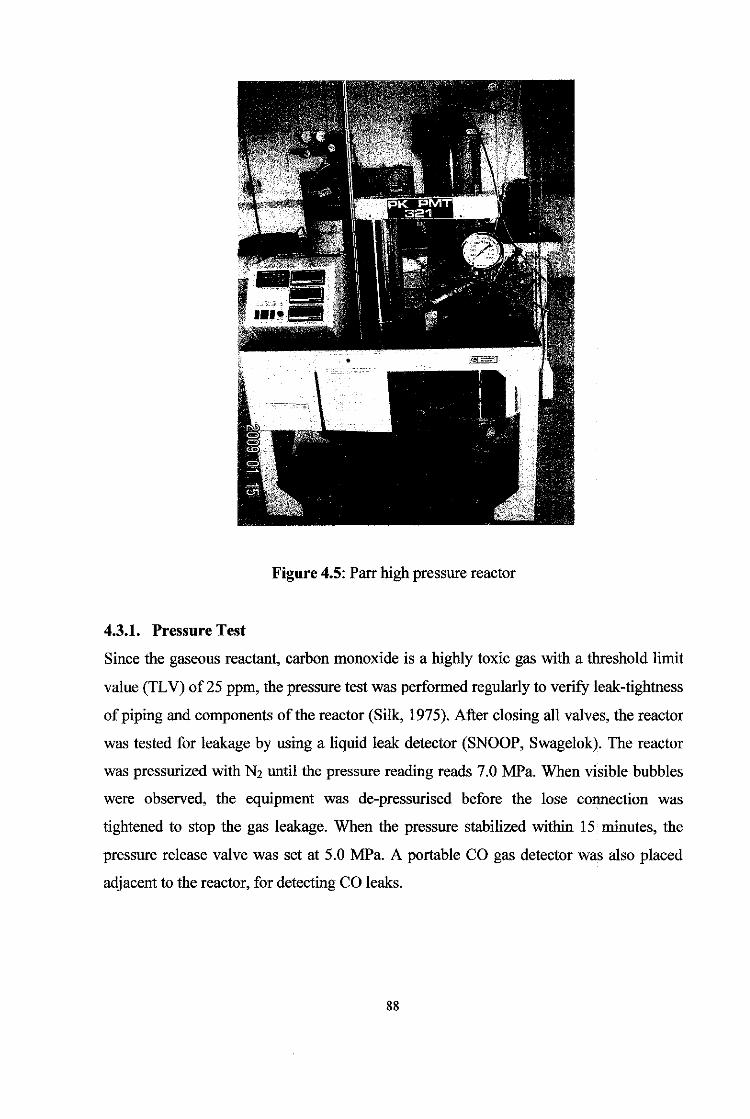


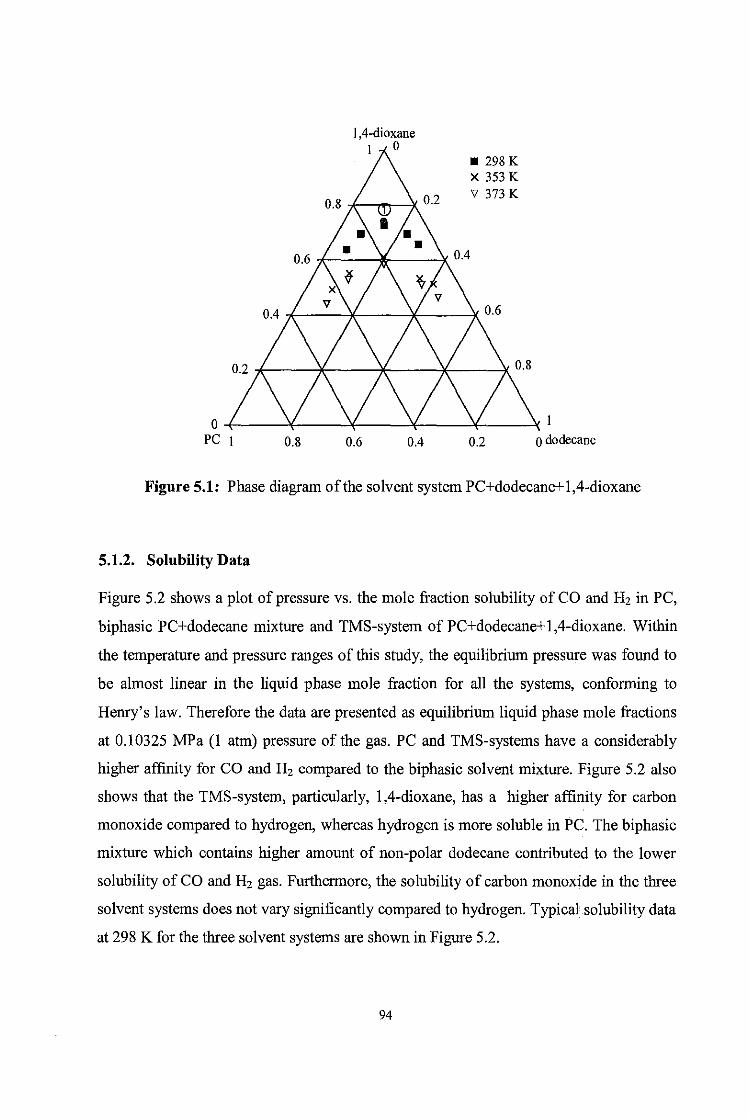


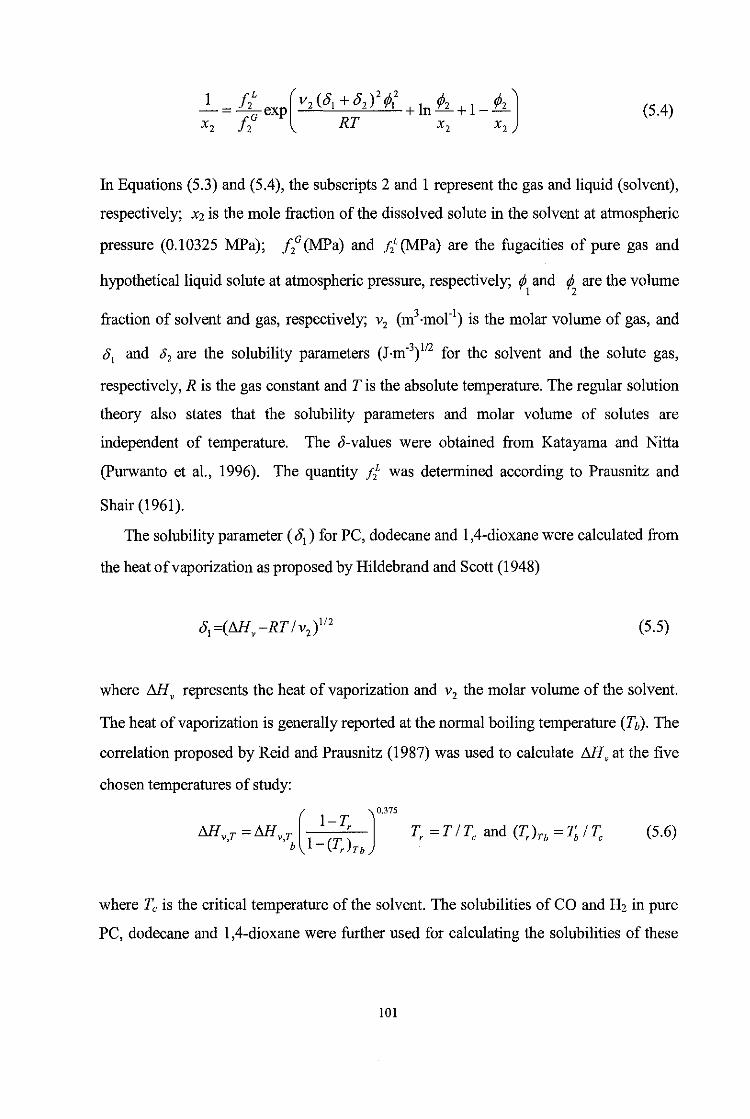


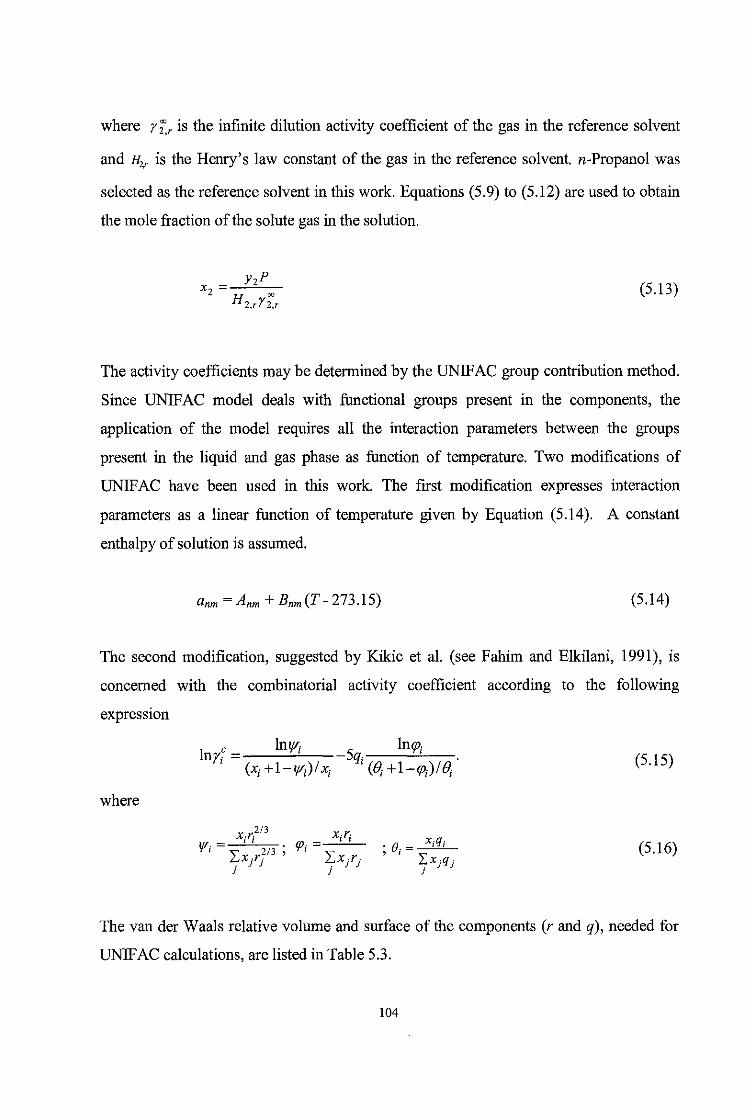


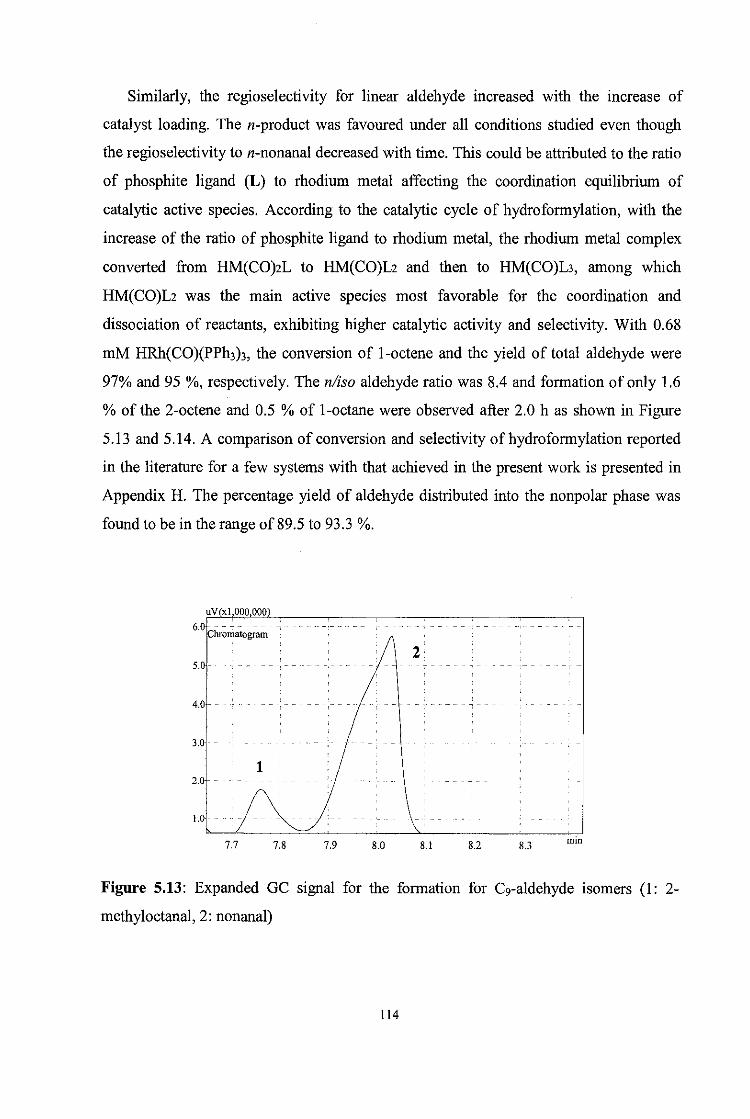

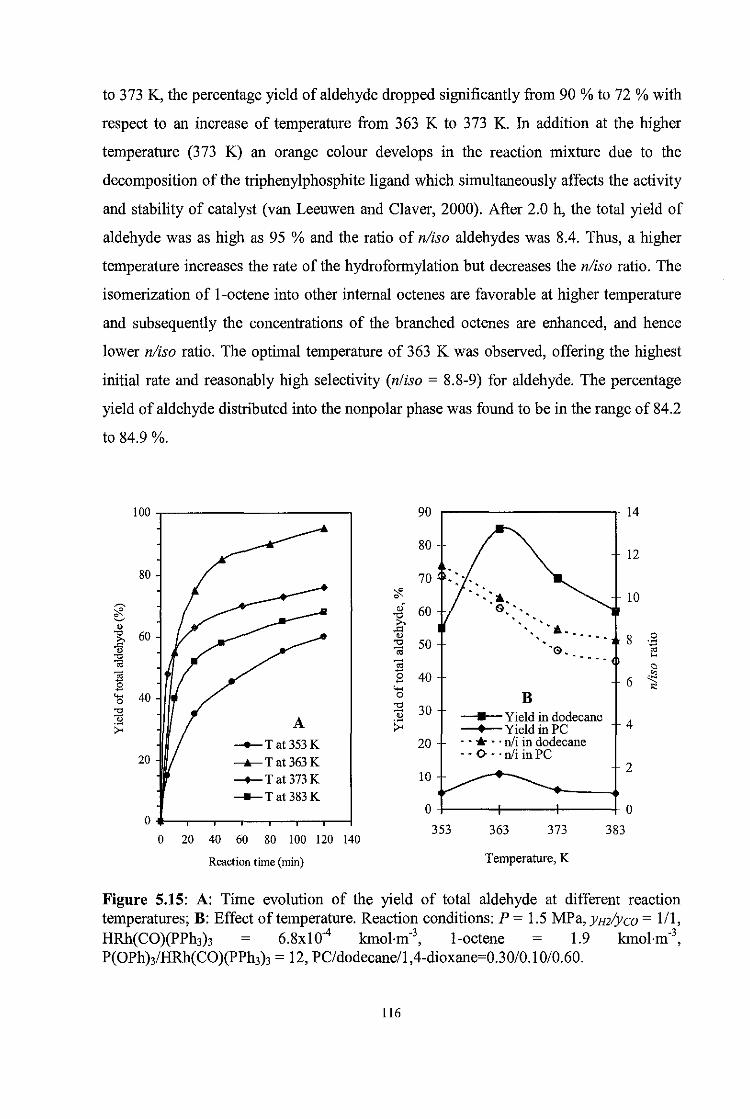


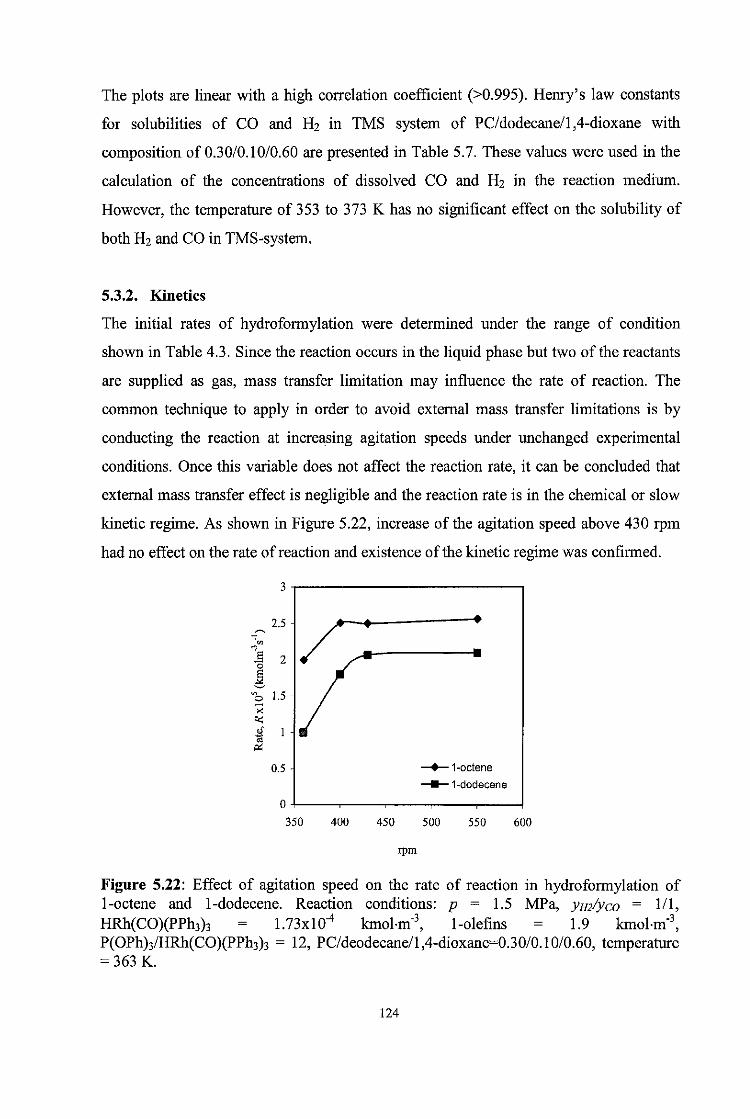

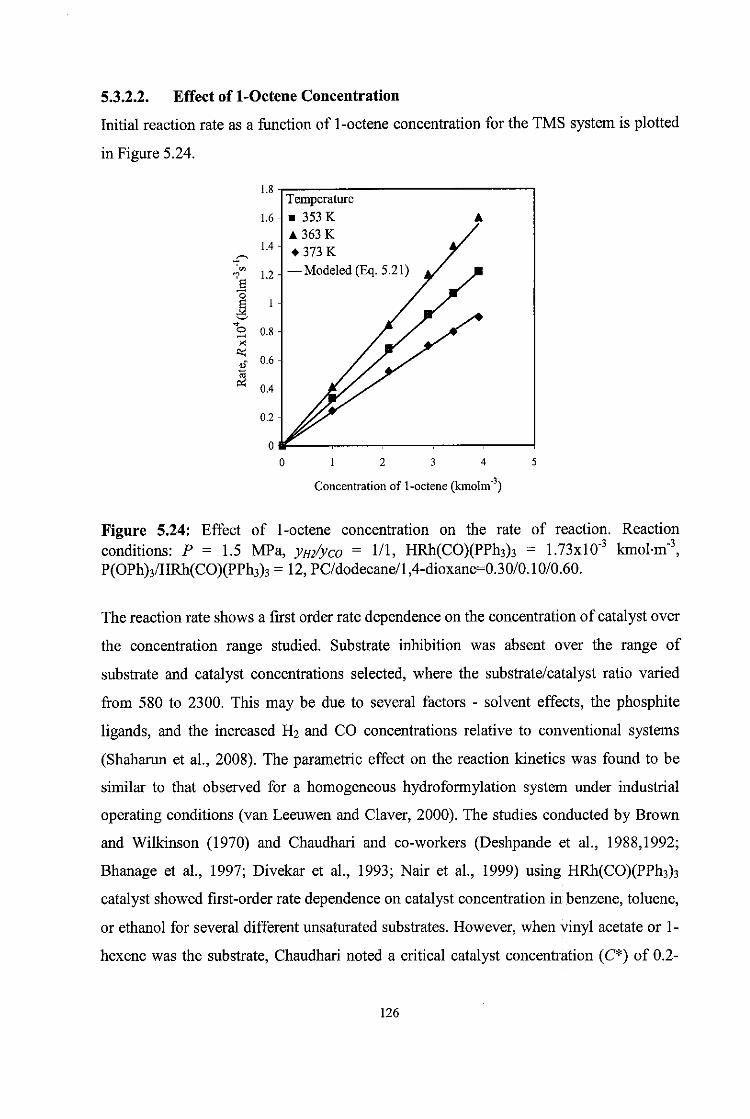


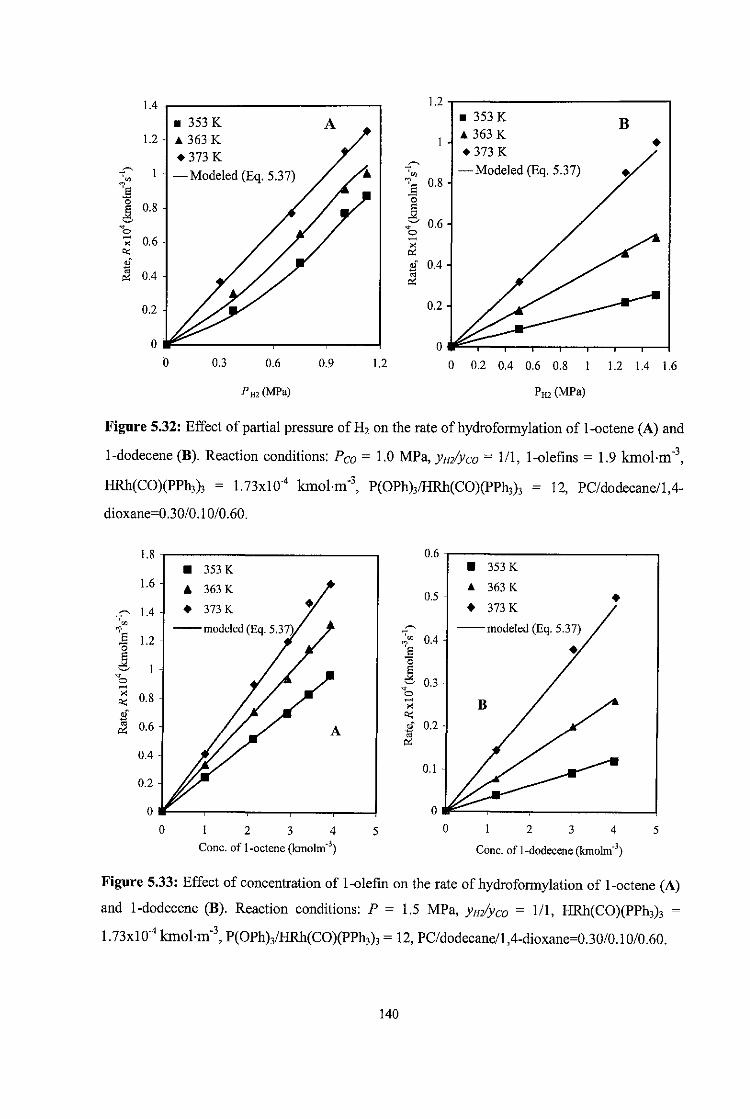


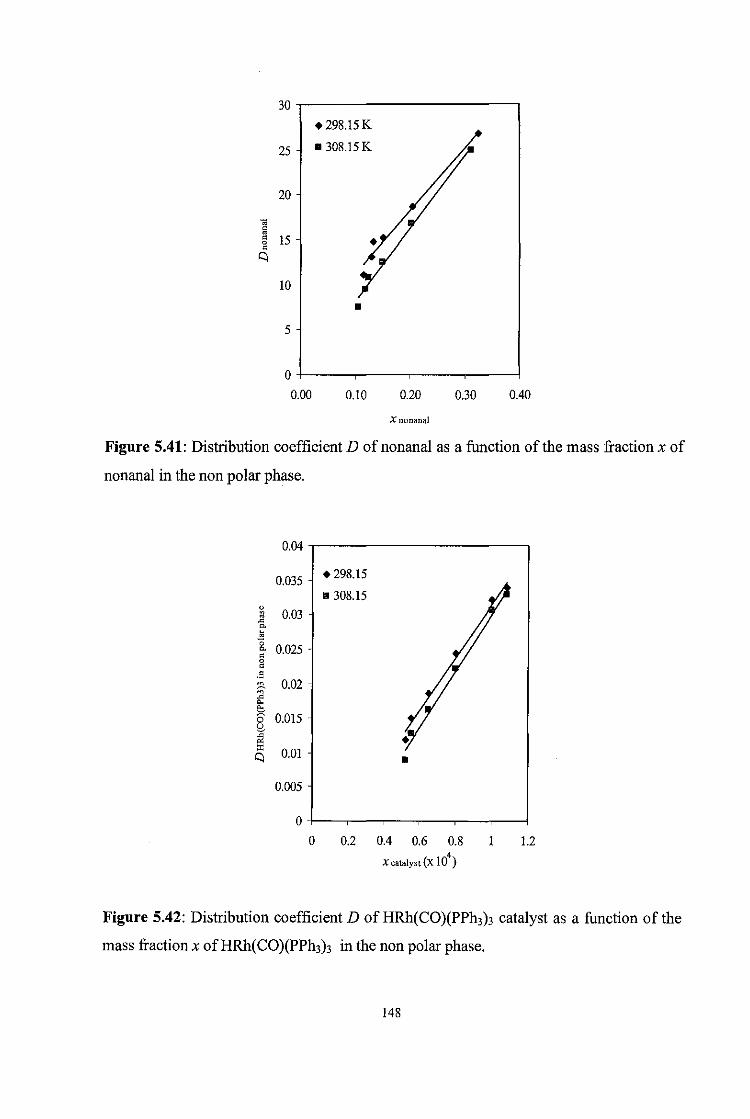


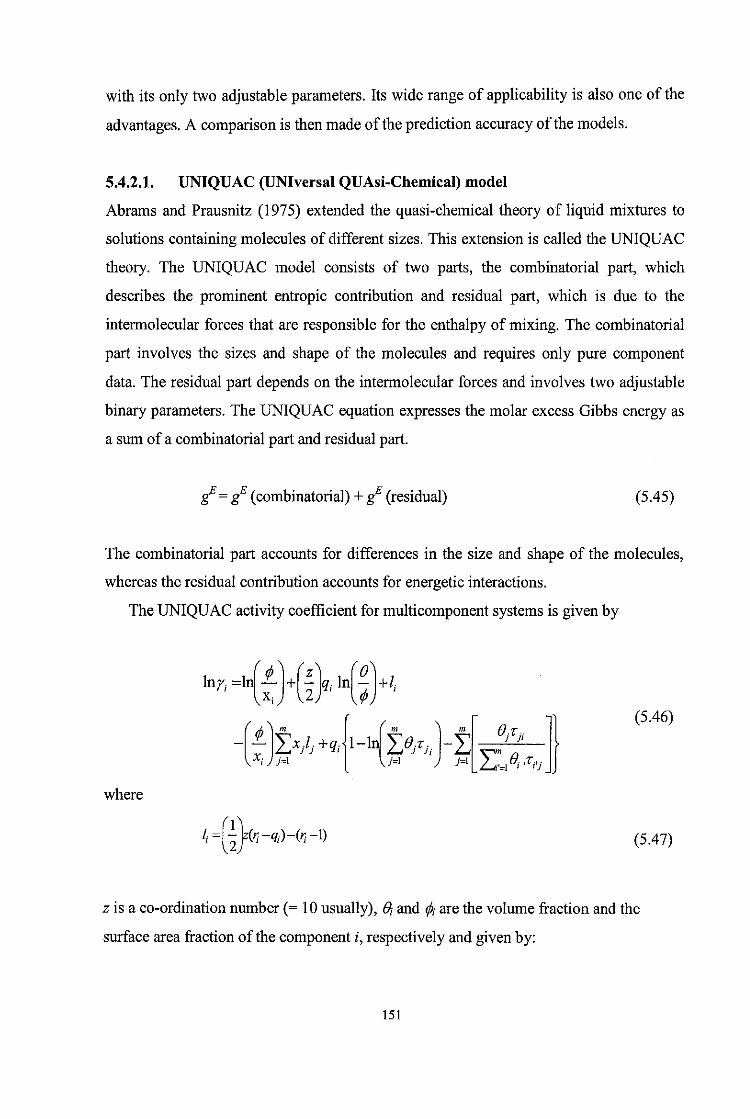

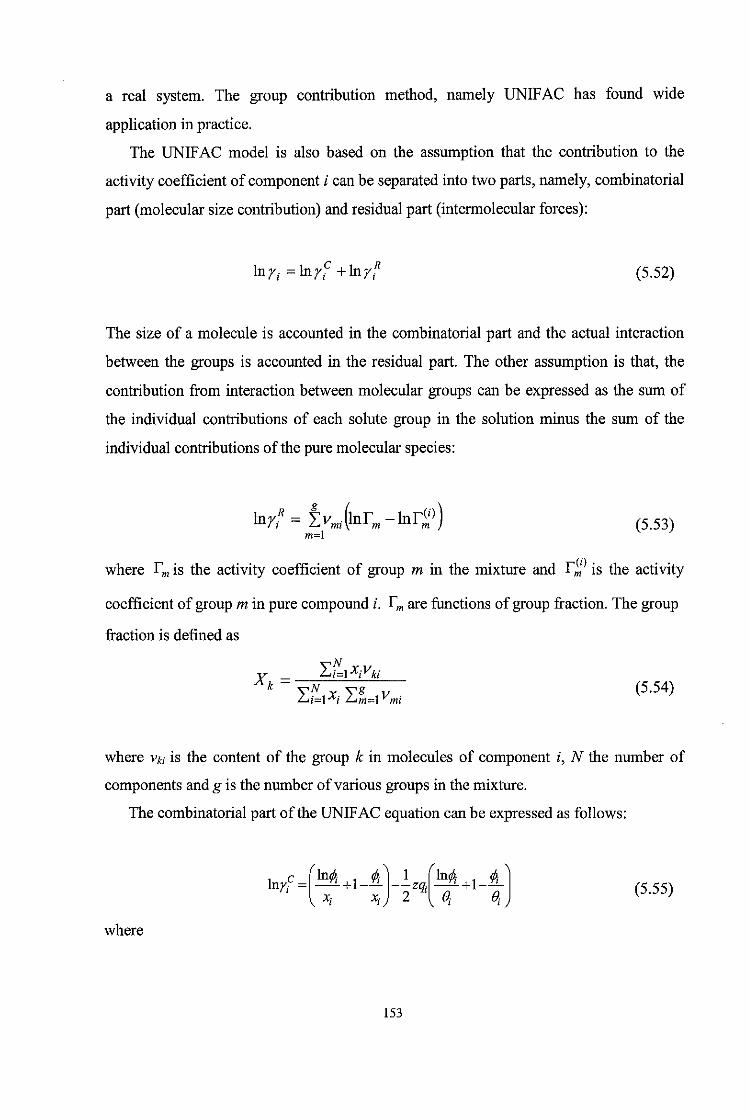


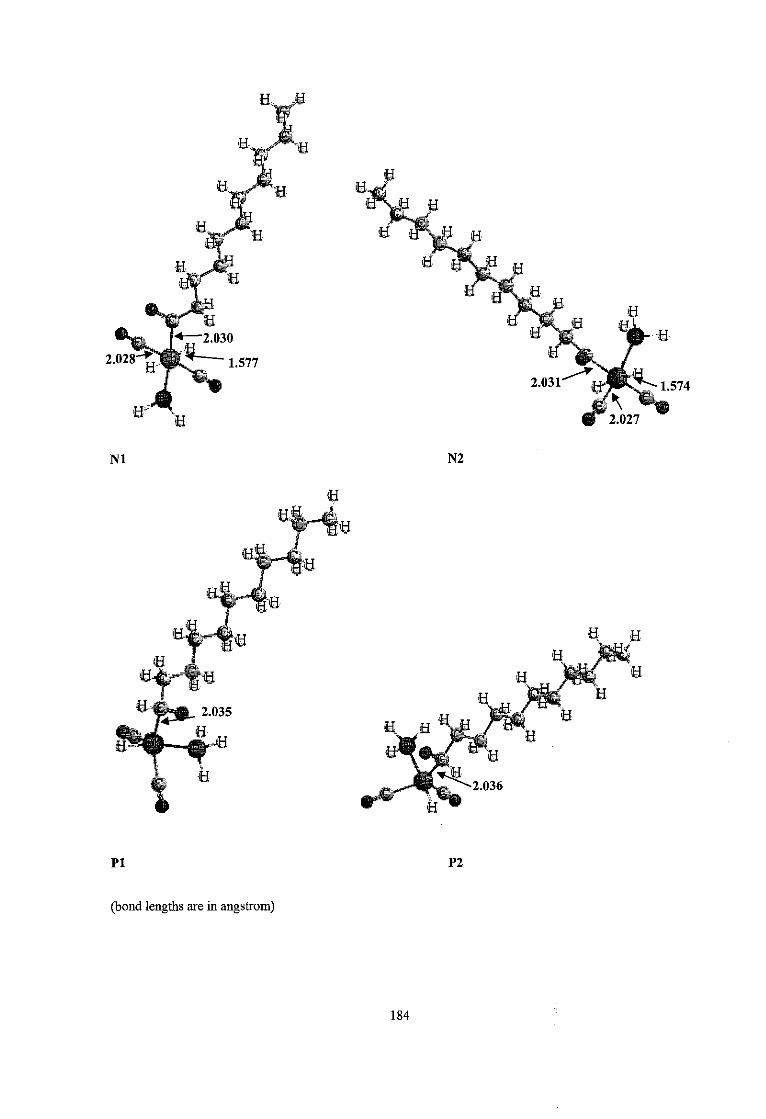


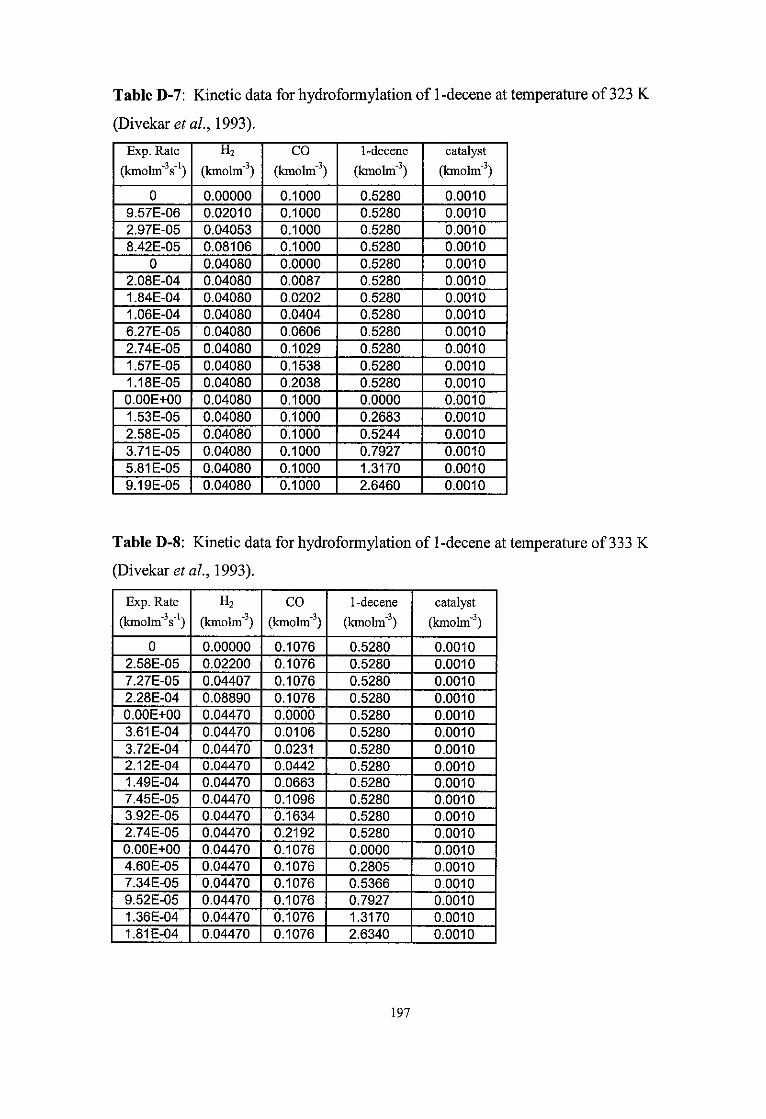
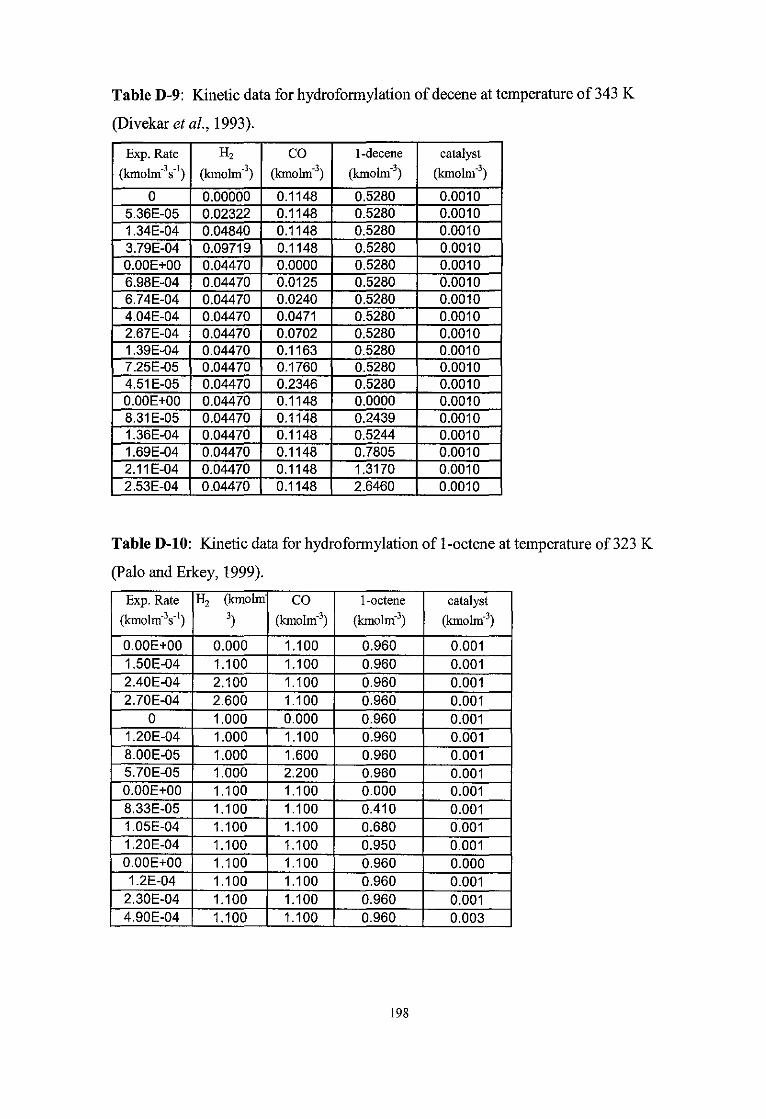


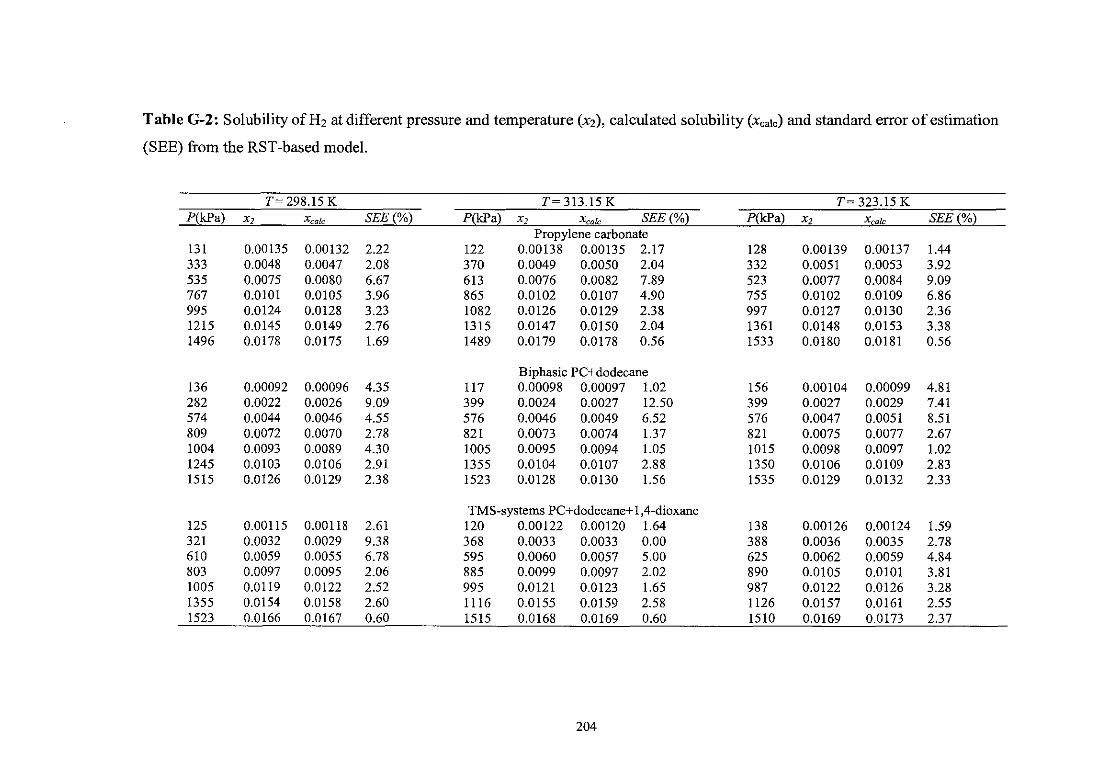
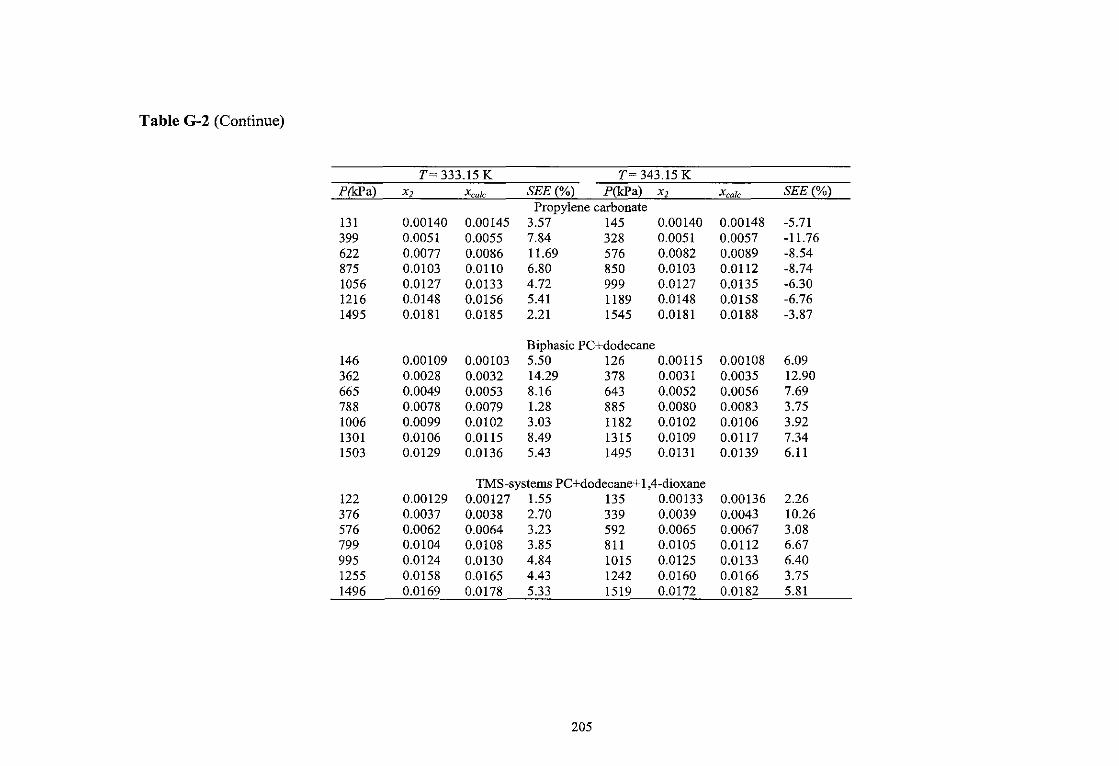


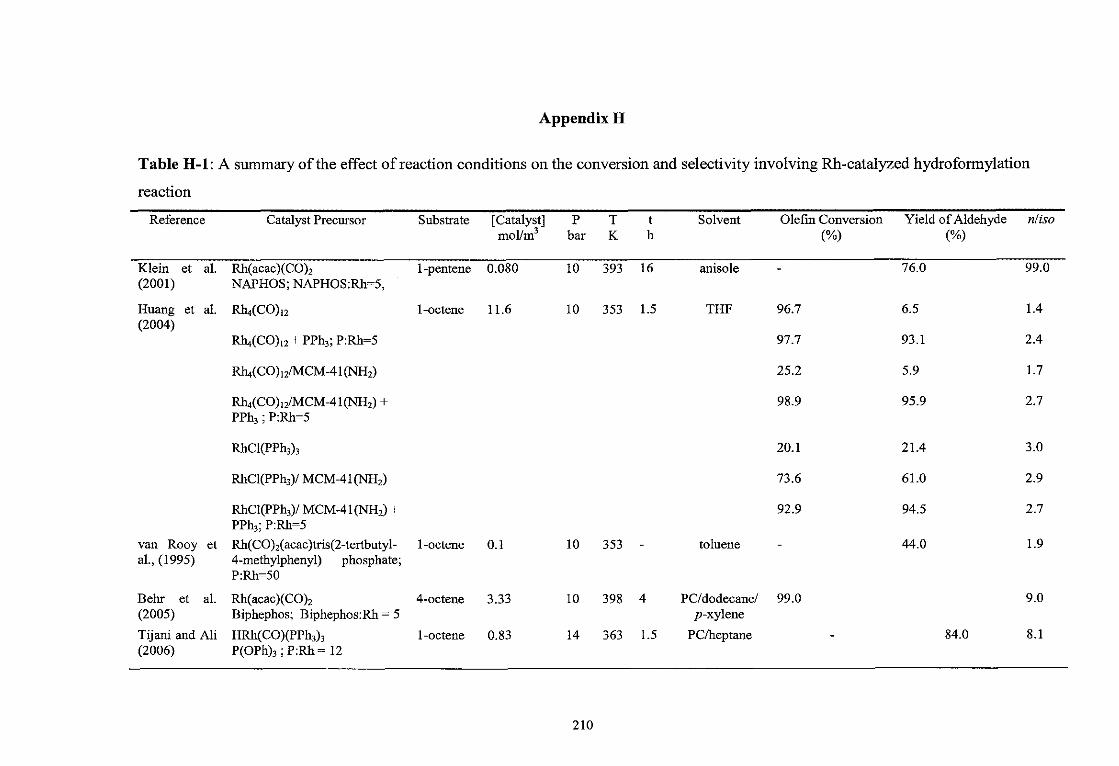


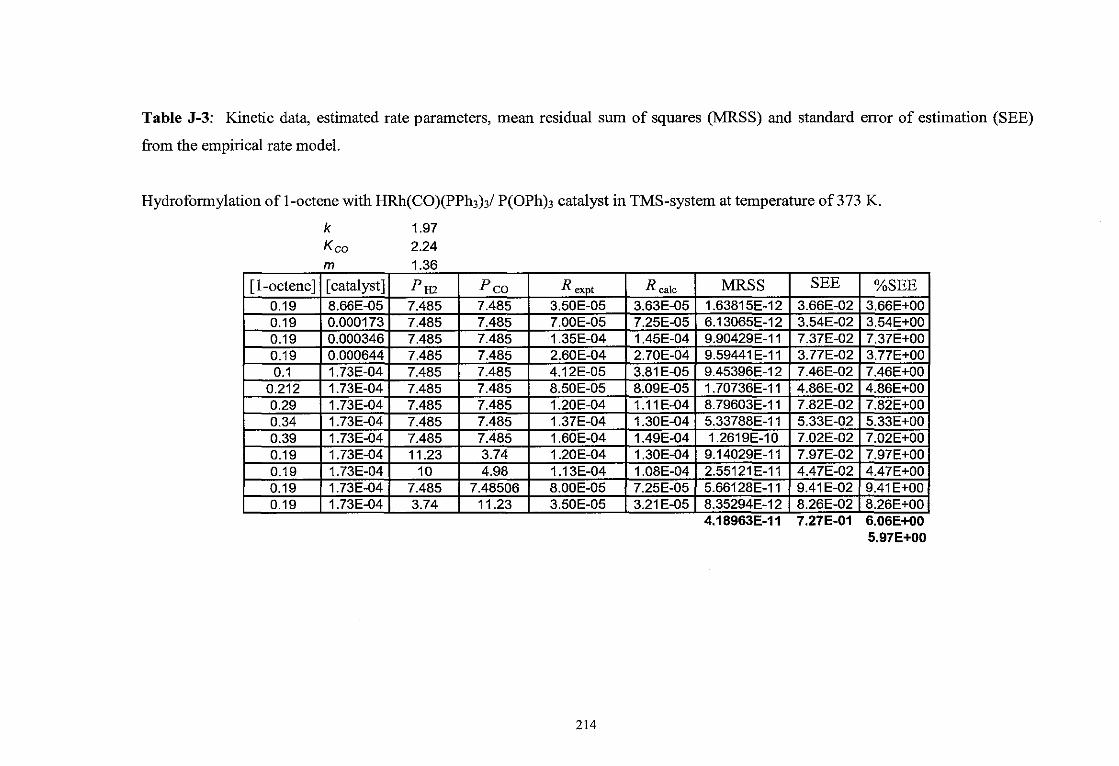

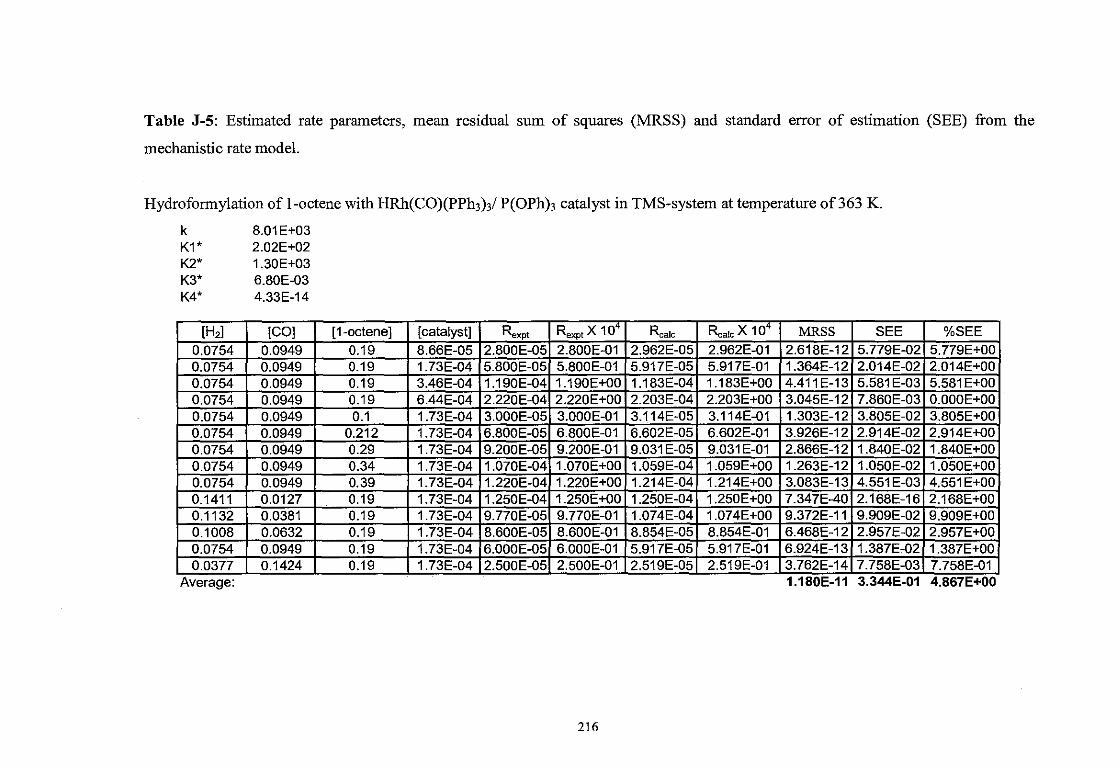

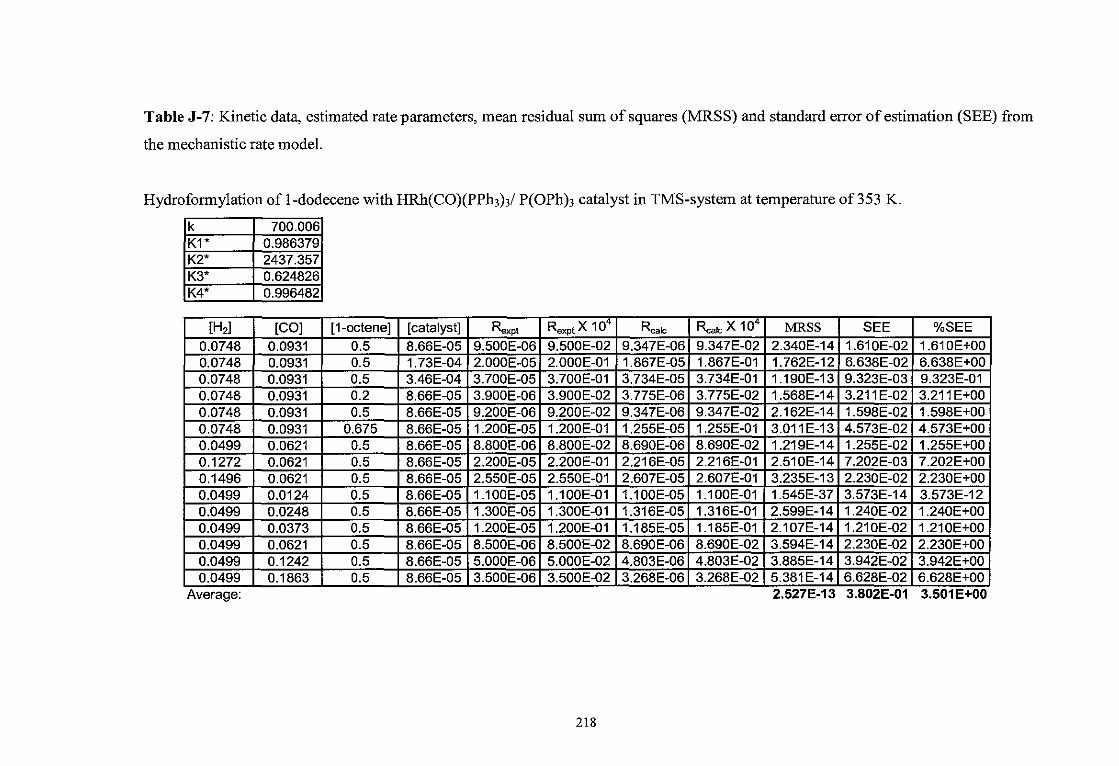


![trial.spmpaper.meedu.joshuatly.com] Pahang JUJ 2012 SPM...1 The equation below shows a reaction to produce hydrogen gas. Persamaan di bawah menunjukkan tindak balas bagi menghasilkan](https://static.documents.pub/doc/80x56/5e58c01629186e754d53190e/trial-edujoshuatlycom-pahang-juj-2012-spm-1-the-equation-below-shows-a-reaction.jpg)


