[email protected]Lightning invasion overvoltage study for UHVAC substation S.SUN G.TREMOUILLE Alstom Grid Alstom Grid China France SUMMARY With the increasing demand of power energy, the UHV power transmission technologies attract all the attention of power utilities and manufacturers with distinct advantages in the power transmission of large capacity and long distance. However, it also raises the challenges on the lightning overvoltage protection of UHV substations. This paper presented a lightning invasion overvoltage study on 400kV AC substation and 1000kV UHVAC substation in order to compare the effect of different EMT equipment model on lightning invasion overvoltage level of HV and UHV substation. Focus will be done on modelling, as simplification done for lower voltage level may no more be accurate for UHV issues. Discussion will be made on the impact for several modelling axis: OHL: power frequency pre-stressed overhead line model; overhead line model without pre-stressed voltage. Corona effect: dynamic additional capacitance model Tower: single vertical losses line model ; multi-story tower model Footing resistance: constant resistor model ; ionization model Insulator flashover: critical flashover voltage model; V-Time curve flashover model Surge arrester: non-linear resistance model; frequency dependent model GIS: includes circuit breaker, disconnector, elbow, insulator supporter and connection bus bar This study is carried out by PSCAD/EMTDC. Necessary sensitivities studies will be carried out prior to the discussion, in order to have a quantities approach. KEYWORDS UHV, Insulation-coordination, Fast-front, Overvoltage, EMT, Modelling 21, rue d’Artois, F-75008 PARIS C4-304 CIGRE 2012 http : //www.cigre.org
Lightning invasion overvoltage study for UHVAC substation
S.SUN G.TREMOUILLE Alstom Grid Alstom Grid China France
SUMMARY With the increasing demand of power energy, the UHV power transmission technologies attract all the attention of power utilities and manufacturers with distinct advantages in the power transmission of large capacity and long distance. However, it also raises the challenges on the lightning overvoltage protection of UHV substations. This paper presented a lightning invasion overvoltage study on 400kV AC substation and 1000kV UHVAC substation in order to compare the effect of different EMT equipment model on lightning invasion overvoltage level of HV and UHV substation. Focus will be done on modelling, as simplification done for lower voltage level may no more be accurate for UHV issues. Discussion will be made on the impact for several modelling axis: OHL: power frequency pre-stressed overhead line model; overhead line model without pre-stressed
voltage. Corona effect: dynamic additional capacitance model Tower: single vertical losses line model ; multi-story tower model Footing resistance: constant resistor model ; ionization model Insulator flashover: critical flashover voltage model; V-Time curve flashover model Surge arrester: non-linear resistance model; frequency dependent model GIS: includes circuit breaker, disconnector, elbow, insulator supporter and connection bus bar This study is carried out by PSCAD/EMTDC. Necessary sensitivities studies will be carried out prior to the discussion, in order to have a quantities approach. KEYWORDS UHV, Insulation-coordination, Fast-front, Overvoltage, EMT, Modelling
21, rue d’Artois, F-75008 PARIS C4-304 CIGRE 2012 http : //www.cigre.org
2
1 INTRODUCTION
As transmission lines appeared at the beginning of the 20th century, the hazard of lightning on transmission lines became obvious. With the increase of the operating voltage of transmission lines, the proportion of lightning accident also increases among a total number of trip accidents. It is known that lightning strikes inject steep front current impulses to the overhead transmission lines, and cause travelling waves which propagate along the overhead line and invade into substations where they cause lightning invasion overvoltages and pose a risk to any items of equipment connected. Due to the different position of the strike point, there are two kinds of lightning invasion over voltage. One is back flashover referring to the lightning strikes on tower (or shielding wire) which increases the tower top voltage over the insulator strength, then lead to backward flashovers from the tower to an overhead line conductor. Another one is shielding failure which refers to the lightning strikes directly on the overhead line conductor due to the shielding wire protection failure.
Lightning overvoltage could be recognized as a dominant factor to determine the insulation level of a substation. Thus the resulting over voltage must be compatible with the dielectric withstand of the different equipments of substation. Lightning invasion overvoltage in substation can be modelled and analysed by electromagnetic transient methodology considering the travelling wave and transient energy exchange in the network. Different modelling methods of the network component, such as lightning impulse, overhead line and tower, substation components and other related equipment, are recommended and discussed in IEC 60071-4 with the voltage level up to 750kV.
With the increasing demand of power energy, the UHV power transmission technologies attract all the attention of power utilities and manufacturers with distinct advantages in the power transmission of large capacity and long distance. However, it also raises the challenges on the lightning overvoltage protection of UHV substations. Equipment modelling for lightning over voltage in UHV substation may require more accurate method. Based on the lightning over voltage study of 400kV (HV) substation and 1000kV (UHV) substation, the impact of different equipment models to the overvoltage result have been studied and discussed.
2 MODELLING
An accurate representation of a network component is essential for reliable power system transient analysis. The simulation of transient phenomena may require a representation of network components valid for a frequency range. In order to achieve accurate simulation, the mathematical models with frequency dependence of parameters should be taken into account in the network components modelling. The overvoltage in substation due to the lightning strikes the overhead line is a transient phenomenon with the frequency range from 10 kHz to3 MHz. Modelling guidelines for representation of network component in lightning overvoltage simulations have been proposed in many references [1]. The lightning stroke is modelled as an ideal current source with impulse lightning current as the input signal, of which amplitude and wave shape are determined by statistical method considering the region and overhead line configuration[2]. In this paper, focus will be on the modelling of different network component which are summarized as below:
2.1 TOWER MODEL
Several tower models have been developed over the years, they were developed using a theoretical approach [2][3] or based on an experimental work [4][6]. Single vertical lossless line model and multi-story model are adopted in this study for comparison.
Single vertical lossless line model
Single vertical lossless model as
reference
Multi story model as " advanced
model"
3
The simplest representation of the over head line tower is a lossless distributed-parameter transmission line, characterized by surge impedance and a travel time [5]. Figure 1 shows the geometric configuration of the tower body, while related surge impedance can be calculated by (1).
This model is composed of four sections that represent the tower sections between cross-arms [4]. Each section consists of a lossless line in series with an inductance in parallel with a damping resistance included the attenuation of the traveling waves (Figure2).The parameters of the corresponding electrical model are calculated from the tower geometry data, more information is provided in [6].
2.2 TOWER FOOTING RESISTANCE MODEL
Generally two types of tower footing resistance model are used: one is simplified constant resistance, the other one considers surge current magnitude dependent characteristics due to soil ionization [1].
Constant resistance model
To conservative consideration, the tower footing resistance can be presented as its power frequency footing resistance. Normally the resistance value is required to limit within 10ohms. Thus in this simulation 10ohms resistance is adopted.
Ionization model
Due to the high value of earth current during a lightning strike, ionization of the soil should be taken into account so that tower footing resistance could be represented as non-linear resistors proposed in [1], of which characteristic can be determined by formula (2):
21
1321221
+
+)+(+=
hh
hrhhrhrravg 21 += hhHT
2r1
2r2
2r3
h1
h2
Constant resitance model ( 10 Ohm) as
reference
Ionazation, current dependant model as "
advanced model"
1l
2l
3l
4l
1R 1L
1tZ
2tZ
4R 4L
2R
3R
fR
2L
3L
1tZ
1tZ
4
(2) with Where: R0 low-current and low-frequency resistance (ohm); If lightning current through the footing impedance (A); ρ soil resistively (ohm.m); E0 soil ionization gradient (recommended value from IEC60071-4[1] is 400 kV/m).
2.3 INSULATOR FLASHOVER MODEL
As explained at the beginning, during the back flash, the lightning strikes at the shield wire or the tower top while the lightning current incepts into the tower which increases the tower top voltage, as well as the voltage stressed over the line insulator. If the voltage at the tower top is over the insulator strength, then the back flashover occurs. As the result the voltage travelling wave will invade into the substation. Thus the insulator flashover model is very important to the lightning overvoltage of the substation equipment. However, due to the statistical factor involved in this process such as environment, insulator pollution, etc, it is difficult to achieve the accurate insulator flashover model. Two models recommended by IEC 60071-4 are described as below:
Critical flashover voltage (CFO) model [7]
This model consider that the break down voltage of the line insulator is the impulse voltage level at which the probability of flashover of the insulator is 50%. For configurations such as conductor-upper structure and conductor-cross arm, the influence of the insulators on the strength is negligible so that the strength of these configurations is close to that of air gaps.
For the purpose of estimating the breakdown strength of overhead line insulator strings for negative polarity, in order to determine the magnitude of surges propagating into a substation, the following formula may be used, where d is the air gap length in metre.
dU ×700=%50 (kV crest)
The formula is applicable to sea-level, thus altitude correction has to be considered when applying the insulation co-ordination procedure.
V-Time curve flashover model
The breakdown of air gap as an insulator is a function of environmental conditions in addition to the fast front voltage build up. In this study, it can be expressed by a simplified method proposed in [8][9]
75.02
1 +=t
KKV fo , LKLK ×710=,×400= 21
Where foV is the flashover voltage ( kV)
L is the equivalent air gap length (m)
75.0t is the elapsed time after lightning stroke
)(
1
)(
)IR
)R(I0
f0
f gf
g
f
g
II
II
RIR
I(
2
0
0
2 REIg
Voltage control swith model , as
reference
V-Time curve flashover volatge as " advanced model"
5
2.4 SURGE ARRESTER
For the modeling of surge arrester in EMT study, two typical configurations are proposed by IEC60071-4[1]. The non-linear resistance model is recommended firstly where the behavior of surge arrester is related to the Voltage-Current curve based on lightning impulse testing from manufacturer. However, this simple model can only present well at one frequency. With a given inception current magnitude in surge arrester, when the time to crest of current is decreased from 8us to 1.3us, the voltage developed across the arrester can increase by approximately 6% [10]. In lightning overvoltage phenomenon, the lightning current impulse incepted into the surge arrester normally would not be the standard impulse shape as in the manufacture testing. Thus another frequency-dependent surge arrester model is recommended by IEEE working group, where the non-linear V-I characteristic of an arrester is represented with two sections of nonlinear resistance designated by different V-I curve to represent different front separately. There are two R-L filter adopted to separate these two sections. Under the slow-front surges, this R-L filter has very little impedance and the two non-linear sections of the model are in parallel. Under fast-front surges the impedance of the R-L filter becomes more significant. Thus this frequency-dependent model will give good results for current surges with times to crest from 0.5 us to 40 us [10].
Non-linear resistance model
This non-linear resistor model for surge arrester use 8/20 μs characteristics as the V-I curve. The leader of surge arrester to the ground is represented as an inductance which is about 1uH/m. It is also equipped with stray capacitance when the surge arrester is applied in GIS.
Frequency dependent model
As described before, the frequency dependent model is presented in Fig.3, where A0 and A1 are two non-linear resistances. For slow-front surges, A0 and A1 are in parallel. For fast- front surges, the V-I characteristic of A0 is dominant in this model. However, this frequency dependent model requires an iterative procedure to determine the parameters where corrections on different elements are necessary until a satisfactory behavior is obtained. The initial values can be obtained through formulas that take into account both the electrical data and the physical parameters [10]. Figure 3 Frequency dependence model
2.5 GIS MODEL
The main components of GIS which should be taken into account in lightning study are circuit breaker, disconnector, voltage transformer, current transformer, bus conductor, elbow, insulator supporter, and so on. The GIS component can be represented as line model defined by related surge impedance and length with a phase to ground stray capacitance which is recommended by IEC60071-4. The value of surge impedance of GIS components depends on their geometrical dimensions. In SF6
insulated cable, the velocity of voltage travelling wave is equal to sm /10×3 8 [11].
It is known that in electromagnetic transient simulation, accurate modeling can achieve the result which is more corresponded to reality. Then it is preferred to model each GIS component consistent with its geometry configuration. However, accurate modeling of GIS requires detailed information of
L0
R0 C A0 A1
L1
R1
non linear resistance, as reference
frequency dependant model as " advanced
model"
6
equipment and also simulation time. In this study, the influence of the full GIS model and simplified GIS model where elbow or insulator support are neglected to the overvoltage result is studied based on HV and UHV substation.
Figure 4 Elbow Figure 5 Insulator support
2.6 LINE CORONA MODEL
As the voltage reaches the corona inception voltage, the corona effect happens which can change the shielding wire surge impedance and increase the coupling efficient between transmission line and the shielding wire. Thus the induced voltage in transmission line is increased and the voltage over the insulator is decreased. Besides, the amplitude and steepness of the voltage travelling wave front is decreased, therefore the lightning invasion voltage into the substation could be changed.
In this study, the overhead line model without and with corona effect is studied to investigate the impact of corona effect to the overvoltage result. The corona effect can be represented using discrete classical components. This is achieved by dividing the line into sections of a given length and connecting one or two branches containing a diode, a capacitor and a DC voltage source to each section. In EMT simulation, corona model in OHL can be modeled by a circuit with diodes and capacitors to mathematical descriptions of the q-v curve characterizes. Fig 6 shows the equivalent circuits of corona model proposed by Wagner and Lloyd [11]. Where the capacitance 0C represents the additional capacitance of line while the DC source Vi represents the corona inception voltage. Below the corona inception voltage level, 0C is prevented from charging by the diode, maintaining the whole line capacitance as the natural capacitance value.
Figure 6 Corona equivalent circuits
2.7 POWER SUPPLY MODEL
The power-frequency voltage when the lightning strikes at the overhead line can be represented as a power-frequency voltage source and an adaptation resistor in series. Lightning overvoltage study in substation considering the power-frequency voltage or neglect the power-frequency voltage is simulated corresponding to investigate its impact to the overvoltage in substation. In the simulation where the power frequency voltage of the substation is considered, the negative lightning strikes at the overhead line when the power frequency voltage achieves the positive maximum value. Figure 7 Power supply model
7
3 SYSTEMS
In order to compare the impact of different EMT equipment model on lightning invasion overvoltage level of HV and UHV substation, numerous simulations have been carried out based on the 400kVAC GIS substation and 1000kV AC GIS substation system configuration and component parameters are described as below:
3.1 400KV GIS AC SUBSTATION
Figure 8 shows the main electrical connection of 400kV GIS substation, where two incoming lines connect with two transformers through one and half breaker scheme. The overhead line parameters are described in table 1 and 2. 400kV GIS parameters are from project data, where the capacitance of insulator supporter here is adopted as 3.8pF. The rated voltage of surge arrester is 360kV; it has one column with the length of 1.95m. Residual voltage under 10kA lightning impulse and 1kA switching surge are 836kV and 702kV. The lightning overvoltage at the main components, such as bushing, voltage transformer, power transformer, gas insulated bus , surge arrester and bus conductor inside GIS (see Figure3), are measured during the simulation and the maximum overvoltage of each type of component are recorded.
Figure 8 400kV GIS main electrical connection
Table 1 Incoming line conductor parameters Table 2 Parameters of entrance terminal towers
3.2 1000KV GIS AC SUBSTATION
Figure 9 shows the main electrical connection of 1000kV Huainan UHV GIS substation of China [12]. The overhead line parameters are described in table 3 and 4. The surge arrester rated voltage is 828 kV. Residual voltage under 20kA lightning impulse and 2kA switching surge are 1620kV and 1460kV. More detailed parameters can be found from [12]. Maximum lightning overvoltage is measured at the same component as described in 400kV GIS. In 1000kV GIS the capacitance voltage transformer is applied. Thus the lightning overvoltage at the capacitance voltage transformer has been measured as well.
Figure 9 1000kV GIS UHV Huainan Substation
GIB GIB
SASA
SA SA
CB
DS
Bushing
PT
Tr Tr
SA SA
CVT CVT
SA SA
Shunt reactor Shunt reactor
CVT CVT
Line 1 Line 2
GIB
Bushing
CB
DS
8
Table 3 Parameters of entrance terminal towers Table 4 Incoming line conductor parameters
3.3 LIGHTNING INVASION OVERVOLTAGE SIMULATION
Simulation conditions
1)Lightning stroke current
The determination of lightning strike current and its inception point at overhead line are well-explained in [7]. In this study, lightning stroke current is represented by ideal current source, with the impulse current shape as described in table 5
Table 5 Lightning stroke applied in lightning over voltage simulation
2)System configuration
To evaluate the over voltage level of GIS substation during the lightning stroke, different cases of network configuration are taken into account, depending on the state of each breaker and disconnector. In this lightning overvoltage study of HV and UHV GIS, the configuration of one incoming line connected with one transformer (line1 connects transformer 1) is applied as the base of modelling comparison. Besides, the GIS substation is modelled in single phase A with related bus bar length based on GIS drawing, with phase A conductor insulator flashover for back flash.
3) Simulation cases
With the GIS configuration presented before , several simulation cases have been taken to the lightning overvoltage study in order to compare the impact of different equipment models to the overvoltage result , as well as its influence degree to the HV and UHV voltage level. As presented before, for each component involve in the lightning invasion overvoltage in substation, there are two different models listed. In the following simulation, basic simulation case is the one with all simplified component EMT model. Table 6 shows the modelling application details of other cases.
9
Table 6: Simulation cases
Simulation results: The simulation is carried out by power system transient simulation tool PSCAD/EMDC. Lightning overvoltage at main components in the substation are measured and listed in table 7~10.
Table 7: 1000kV Huainan GIS lightning invasion overvoltage result in kV –Back flashover
Table 8: 1000kV Huainan GIS lightning invasion overvoltage result in kV –Shielding failure
Table 9 400kV GIS lightning invasion overvoltage result in kV –Back flashover
Table 10: 400kV GIS lightning invasion overvoltage result in kV –Shielding failure
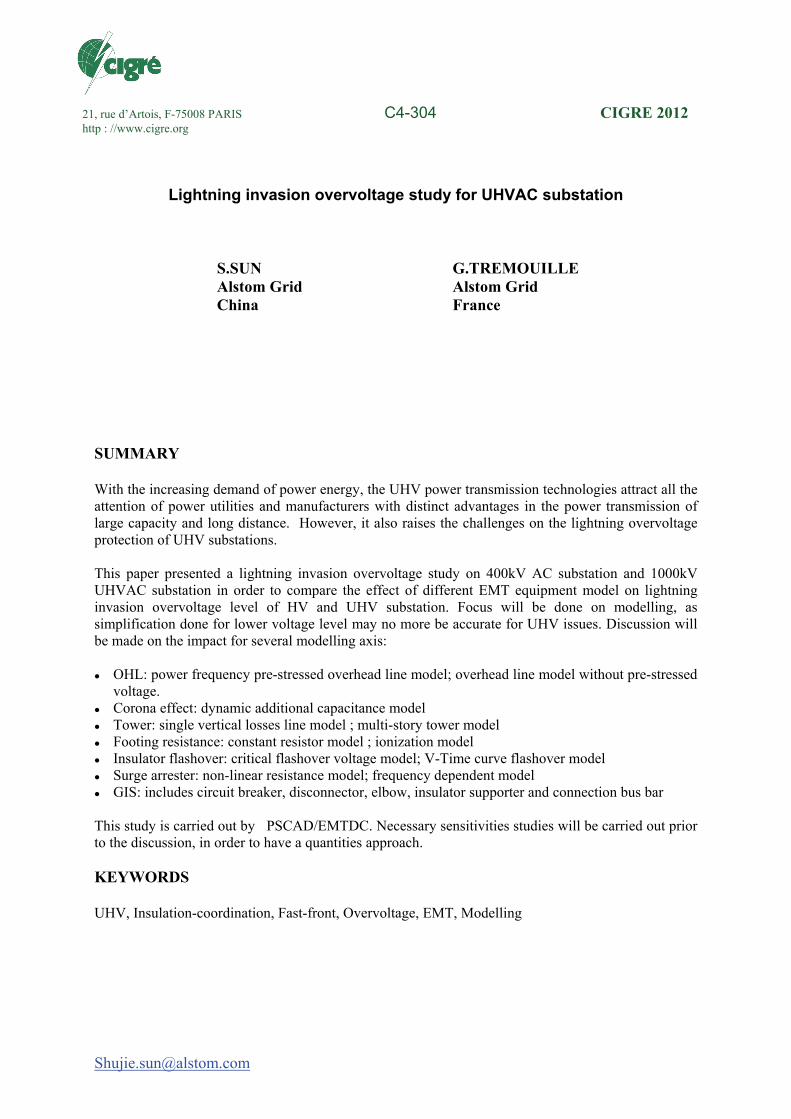
3.4 COMPARSION AND DISCUSSION
The observed impact should be compared to the safety margin used in simulation such as safety factor Ks = 1.05 in air and 1.15 in oil, SF6 or solid insulation [7], in mean a safety margin between 0.1 and 0.3 p.u. The observed modelling results deviation should be observed have in mind this 0.1 to 0.3 p.u. range. It should be noted that an altitude correction factor Ka (1.13 for lightning at 1000m altitude) should also be integrated in such insulation coordination studies [7].
Shielding failure cases
As first and simple analysis on the result we can highlight that the impact of the modelling details such as GIS bus insulator and GIS enclosure elbow for the shielding failure case is very low (< 0.026 p.u. for 400kV, to 0.04p.u. maximum in 1000 kV) whatever the voltage level is.
The impact of tower modelling, tower footing resistance modelling, insulator flashover modeling is less than 0.015p.u. in 400 kV and became here also negligible in our study case for 1000 kV with a maximum impact of 0.02 p.u
In a second hand, the impact of corona effect or the introduction of a 50 Hz (60 Hz) source is reducing from a significant impact of 0.17 p.u. (400 kV case) to a very low impact of 0.02 p.u. in the 1000 kV case.
Finally the surge arrester modelling method which is well known to have a main impact on the simulation result, have here also a major impact in 400 kV case, with 1 p.u. deviation, the impact in 1000 kV reduce here also ( to 0.03 p.u.)
In all these case the impact of the model is reducing with the increase of the voltage level, at least 4 times less is 1000 kV compare to 400 kV case. (See figure 10)
This factor 4 is obtained then we compare a full advanced substation model to the reference case using simple model for all devices.
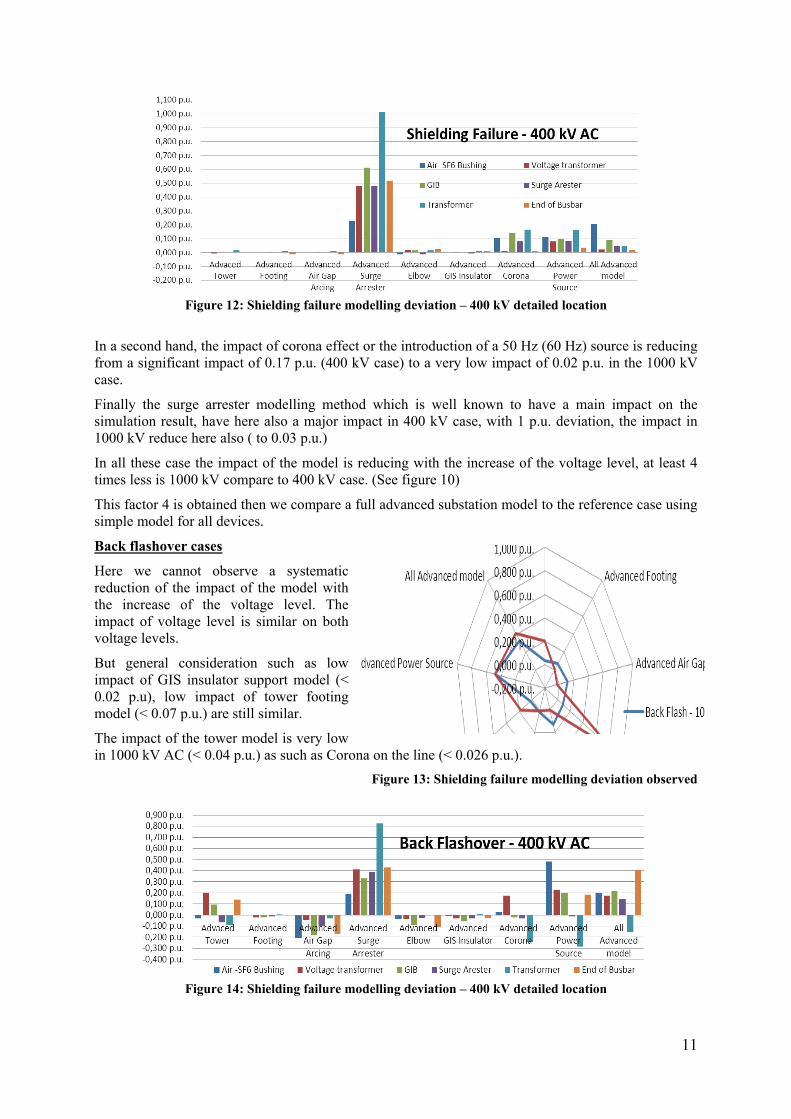
Back flashover cases
Here we cannot observe a systematic reduction of the impact of the model with the increase of the voltage level. The impact of voltage level is similar on both voltage levels.
But general consideration such as low impact of GIS insulator support model (< 0.02 p.u), low impact of tower footing model (< 0.07 p.u.) are still similar.
The impact of the tower model is very low in 1000 kV AC (< 0.04 p.u.) as such as Corona on the line (< 0.026 p.u.).
Removing the main impacting model of surge arrester and power source introduction, we can show the synthesis as Figure11 modeling is impacting more in 400 kV than in 1000 kV but in any case impact of GIS insulator, tower footing , is low ( < 0.1 p.u.).
Figure 16: Overall consolidation impact
4 CONCLUSION
In EMT simulation, the network component modeling is the most important part to simulate the accurate transient phenomenon. For the substation lighting invasion overvoltage simulation and analysis, it requires massive modeling work to achieve the overvoltage results. Simplified and complicated modeling methods of network component have been introduced in this paper, the comparison of impacting on the results of different component model are achieved based on the lightning invasion overvoltage simulation of 400kV and 1000kV AC substation. There are 10 designed cases for each voltage level with different network component model adopted. The simulation results are all compared to the basic simulation case which is the one with all simplified component EMT model. Through the compared result, it can be concluded as below.
As the shielding failure case became the most of the time the design case in 1000 kV regarding lightning issue, it is interesting to observe that this case is the less sensitive one on the modelling issue. The most important modelling issue is observed with the surge arrester (0.03 p.u. impact, in this case) having regard that the implementation of all advanced model introduce de variation of the simulation result of less than 0.05 p.u., which is lower than half of minimum safety margin (0.1p.u., but selected as 15% minimum the most of time, i.e. 0.28 p.u. in this case).
In 400 kV cases, the most severe case (for lightning issues) is the lightning back flash over given significant result regarding the modelling option at least for overhead line lower modelling (0.2 p.u.) Surge arrester modelling (0.83 p.u.) corona (0.18 p.u.), 50 (60) Hz power source modelling.
13
Implementation of more advance model introduces in 400 kV lightning design case (back flash) a large deviation of 0.4 p.u. of the simulation result, it confirm that such model are mandatory for acceptable accuracy.
So, if we can’t not advise to systematically simple model for modelling lightning phenomena in 1000 kV, we can concluded that preliminary studies carried out with simple model for lightning events are acceptable with an accuracy of 0.05 p.u. in our generic study case. Such level of confidence could not be reach in 400 kV design case (back flashover) with simplified model.
BIBLIOGRAPHY
[1] IEC TR 60071-4, 2004"Insulation Co-ordination—Part 4: Computational Guide to Insulation Co-ordination and Modelling of Electrical Networks"
[2] Working Group 33-01 (Lightning) of Study Committee 33 (Overvoltages and Insulation Coordination), 1991."Guide to Procedures for Estimating the Lightning Performance of Transmission Lines”
[3] W. A. Chisholm, Y. L. Chow "Lightning Surge Response of Transmission Towers" IEEE Transactions on Power Apparatus and Systems, Vol PAS-102, No 9, September 1983 [4] Masaru Ishii, Eiichi Ohsaki, Tatsuo Kawamura, Kaneyoshi Murotani, Teruya Kouno, Takemitsu
Higuchi "Multi-storey transmission tower model for lightning surge analysis" IEEE Transactions on Power Delivery, Vol 6, No 3, July 1991
[5] C.F. Wagner and A.R. Hileman,"A new approach for the calculation of the lightning performance of transmission lines IIIa, simplified method: stroke to tower", AIEE trans (Powers Apparatus and Systems), vol 79, October 1960
[6] T. Yamada, A. Mochizuki, J. Sawada, E. Zaima “Experimental evaluation of a UHV tower model for lightning surge analysis” IEEE Transactions on Power Delivery, Vol. 10, No. 1, January 1995
[7] IEC TR 60071-2, 2004."Insulation Co-ordination—Part 2: Application guide" [8] “Transmission Line Reference Book, 345 kV and Above”, Second Edition, Electric Power
Research Institute, Palo Alto, California, 1982. [9] Applications of PSCAD / EMTDC, Manitoba HVDC Research Centre Inc. [10] IEEE working group 3.4.11, “Modelling of metal oxide surge arresters”, IEEE Transaction on
power delivery, vol.7 No.1 January, 1992 [11] Andrew R. Hileman “Insulation coordination for power systems”, CRC Press, Taylor & Francis
Group ISBN: 0-8247-9957-7 [12] CHEN Shui-ming, WANG Wei, “Analysis on UHV Substation Lightning Intruding Overvoltage
considering power frequency voltage” High Voltage Engineering Vol.36.No.8, Aug 31, 2010
BIBLIOGRAPHY Authors
Ms. Shujie SUN was born in Hunan province, China, on August 28,1982. She graduated from Shanghai Jiaotong University in 2009 with Master degree of Power system and automation. Shujie joined ALSTOM Grid Technology centre in 2009 (formerly AREVA T&D China Technology Centre), now she is a senior engineer of power system analysis.
Mr. Gilles Trémouille was born in Sens (Bourgogne), France, on August 12, 1968. He graduated from E.S.T. P (Ecole Speciale des Travaux Public du Batiment et de l'industrie ) Paris, in 1992 as Mechanical Engineering & Power Systems.- Since November 1999, this school is associated with another, state-owned, French " Grande Ecole ", Ecole Nationale Supérieure d'Arts et Métiers (ENSAM). Gilles start is activity EDF DER (research) in the OHL test center of EDF (Electricité de France). He joint ALSTOM Grid in 1995 (formerly CEGELEC, AREVA T&D). He is a Member of the IEEE. He integrated the Cigre working group C4 (System Technical Performance) & B3 ( Substations)