41
Balance of Payment-Current account Macroeconomic Presentation September-18, 2014 Nitin Joshi Pankaj Tolani Sandeep Sharma Satyajeet Singh Shashank Shekhar
| Date post: | 15-Jul-2015 |
| Category: |
Economy & Finance |
| Upload: | sandeep-sharma |
| View: | 39 times |
| Download: | 0 times |

Balance of Payment-Current account
Macroeconomic Presentation
September-18, 2014
Nitin Joshi
Pankaj Tolani
Sandeep Sharma
Satyajeet Singh
Shashank Shekhar

Agenda
2
Introduction
Calculation
Reducing current account deficit
Trends (BOP and Current a/c)
Conclusion

IntroductionThe balance of payments of a country is asystematic record of all economic/ monetarytransactions between residents of a countryand rest of the world.
3
4
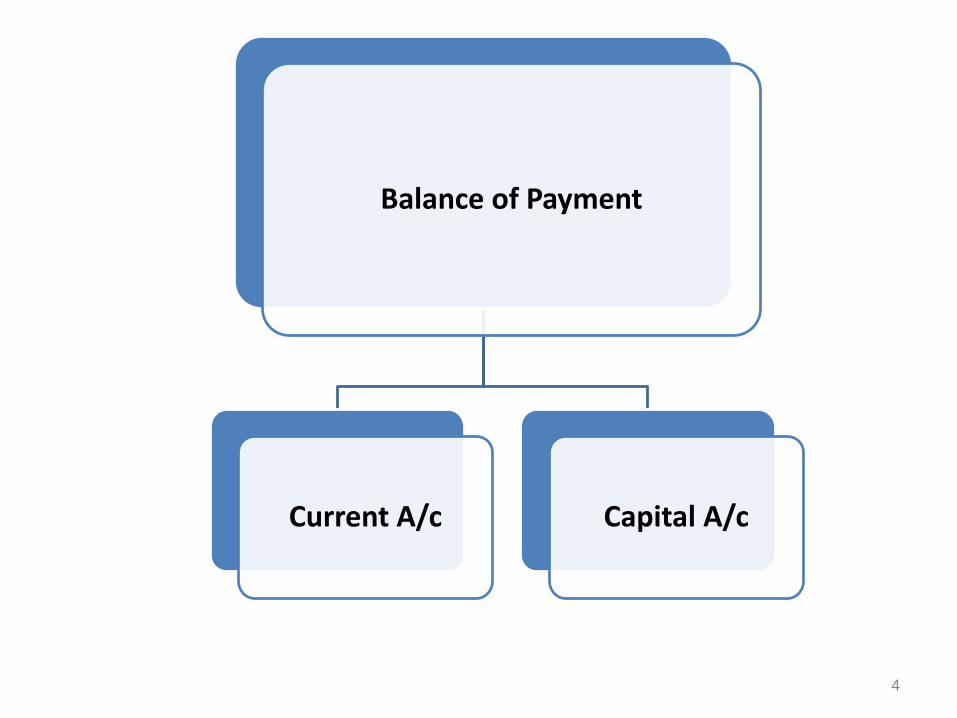
Balance of Payment
Current A/c Capital A/c
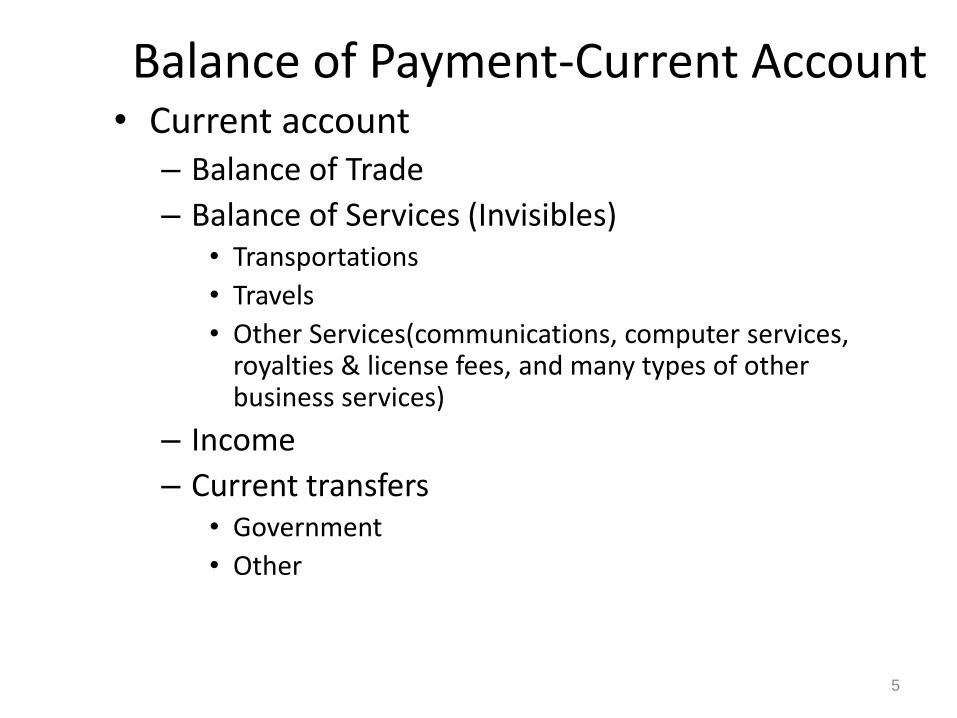
Balance of Payment-Current Account• Current account
– Balance of Trade
– Balance of Services (Invisibles)• Transportations
• Travels
• Other Services(communications, computer services, royalties & license fees, and many types of other business services)
– Income
– Current transfers• Government
• Other
5
Agenda
6
Introduction
Calculation
Reducing current account deficit
Trends (BOP and Current a/c)
Conclusion

Calculation• Double entry book keeping system
– Both sides of transactions debit and credit are recorded
• Credit side shows receivables
• Debit side shows the payables
• The balance of each item shown under Net balance.
• Sum of net balance gives “Current account balance”
7

Calculation
8
Transactions Credit Debit Net Balance (+) or (-)
Merchandise trade Exports Imports -------
Foreign travel Earnings Payments -------
Transportation (Shipping)
Earnings Payments -------
Insurance premium Receipts Payments -------
Investment income Receipts Payments -------
Govt. (Purchases and sale of goods and services)
Receipts Payments -------
Miscellaneous Receipts Payments -------
Miscellaneous include – Motion picture royalties, telephone and telegraph services, fees for
copyright and consultancy etc
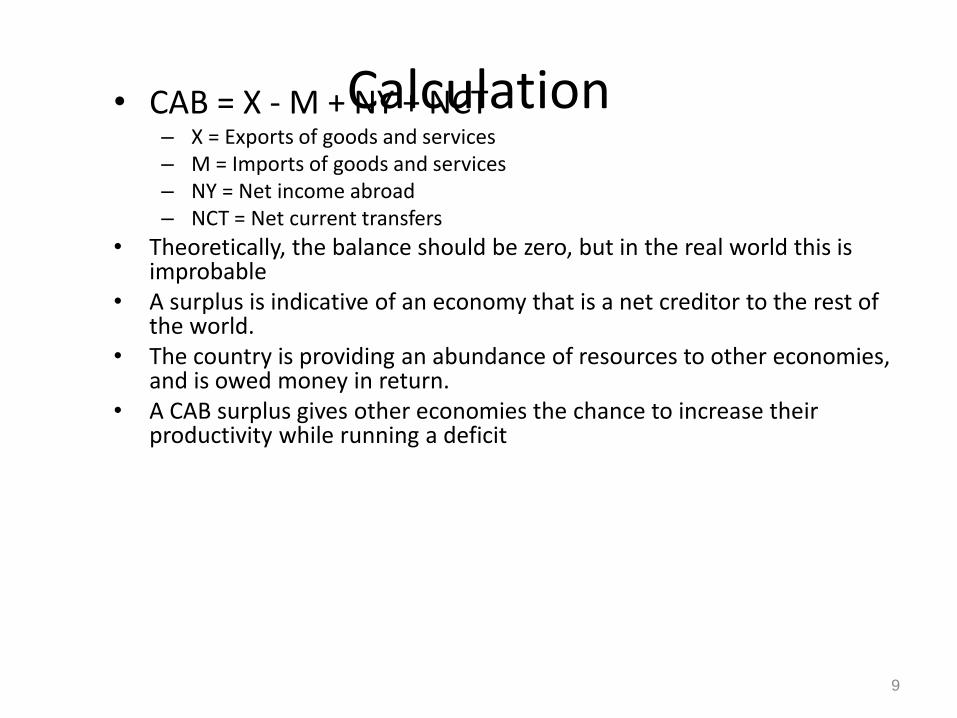
Calculation• CAB = X - M + NY + NCT – X = Exports of goods and services– M = Imports of goods and services– NY = Net income abroad– NCT = Net current transfers
• Theoretically, the balance should be zero, but in the real world this is improbable
• A surplus is indicative of an economy that is a net creditor to the rest of the world.
• The country is providing an abundance of resources to other economies, and is owed money in return.
• A CAB surplus gives other economies the chance to increase their productivity while running a deficit
9
Calculation– Current account deficit
• Occurs when a country's total imports of goods, services and transfers is greater than the country's total export of goods, services and transfers. This situation makes a country a net debtor to the rest of the world
10
It is important to
understand from
where a deficit or a
surplus is stemming
because sometimes
looking at the current
account as a whole
could be misleading.

Calculation• Current Account + Capital account=0
• In an open economy, part of domestic output is sold to foreigners (exports) and part of spending by domestic residents purchases foreign goods (imports).
– Spending by domestic residents
– Spending on domestic goods
11

Calculation• We will assume that domestic spending depends on the
interest rate and income
• Net exports
• A rise in foreign income, improves the home country’s trade balance as it affects the foreign demand of our exports
• A rise in R or a real depreciation improves our trade balance as demand shifts from goods produced abroad to those produced at home.
• A rise in home income raises import spending and hence worsens the trade balance.
12

Calculation• Figure shows the effect of a rise in foreign income.
• The higher foreign spending on our goods raises demand and hence, at unchanged interest rates, requires an increase in output. This is shown by the rightward shift of the IS curve
13

Agenda
14
Introduction
Calculation
Reducing current account deficit
Trends (BOP and Current a/c)
Conclusion

Reducing deficit• Devaluation of currency
• Deflation
• Supply Side Policies
• Protectionism
16

Devaluation of currency• If there is a devaluation in the currency, the
price of importing goods increases and therefore the quantity demanded of imports falls.
• Exports will be become cheaper and there will be an increase in the quantity of exports
• Therefore, assuming demand is relatively price elastic, we would expect a devaluation to lead to an improvement in the current account.
• However it does depend upon the elasticity 17

Deflation• If a government reduces aggregate demand
by raising interest rates or increasing taxes then people will have less money to spend so they reduce consumption of imports.
• India has a high marginal propensity to import.
• Deflationary policies will also put pressure on manufacturers to reduce costs.
• With lower Aggregate Demand, growth is likely to fall causing higher unemployment.
18
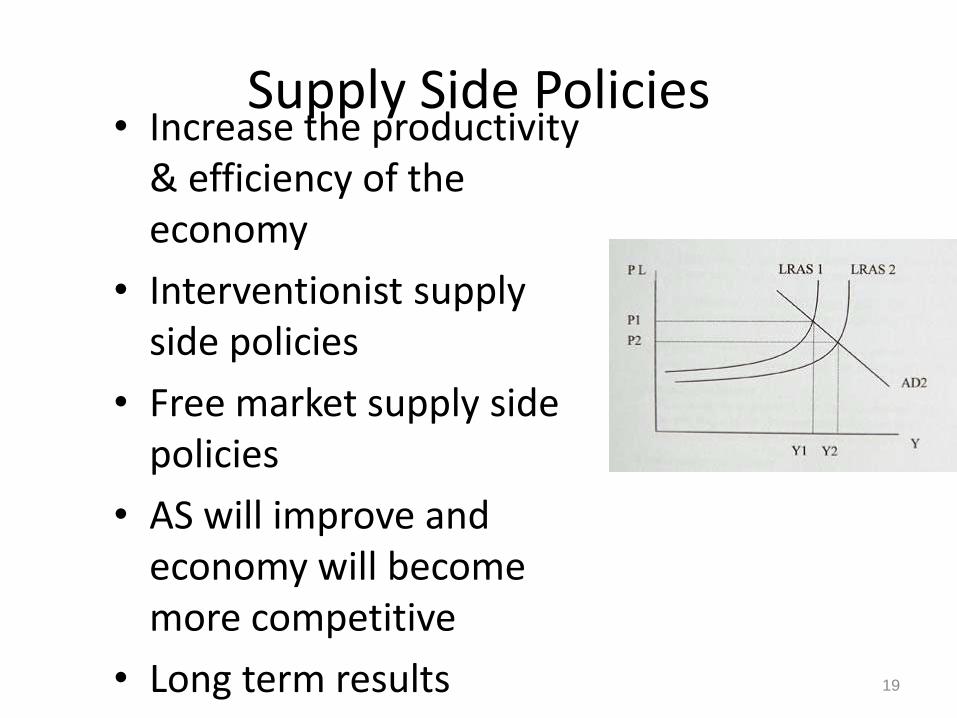
Supply Side Policies• Increase the productivity
& efficiency of the economy
• Interventionist supply side policies
• Free market supply side policies
• AS will improve and economy will become more competitive
• Long term results 19
Protectionism• Increased tariffs of quotas will reduce
imports and improve the current account
• Protectionism leads to retaliation so exports will decrease
• Domestic industries may become uncompetitive, because there is no incentive.
20

Protectionism• Increased tariffs of quotas will reduce
imports and improve the current account
• Protectionism leads to retaliation so exports will decrease
• Domestic industries may become uncompetitive, because there is no incentive.
21

Agenda
22
Introduction
Calculation
Reducing current account deficit
Trends (BOP and Current a/c)
Conclusion

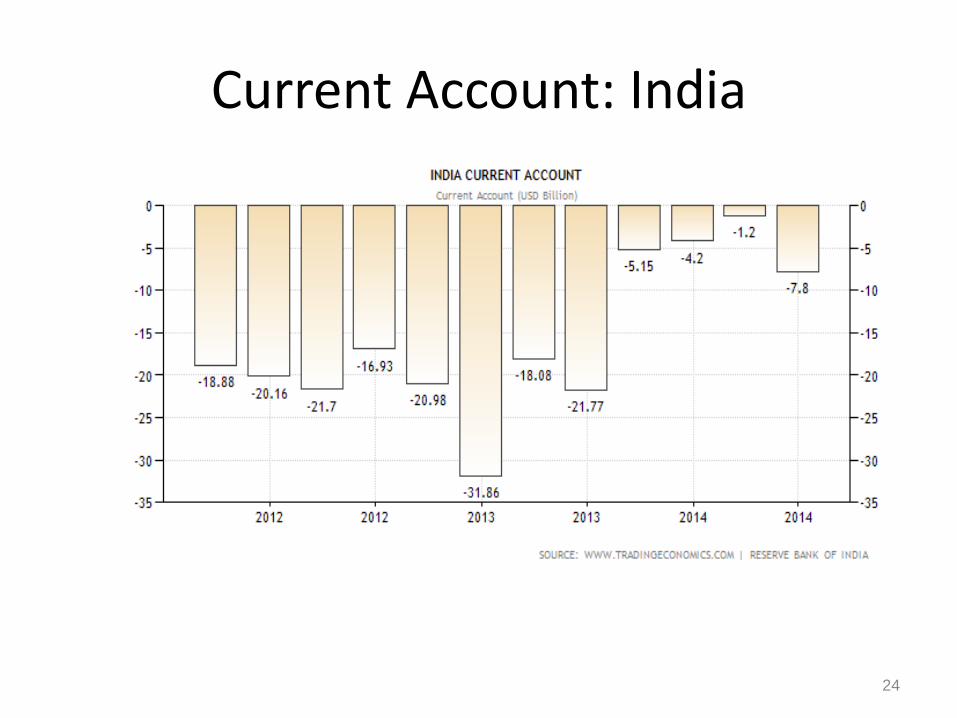
Trends• India’s current account deficit (CAD)
narrowed sharply to $7.8 billion (1.7 percent of gross domestic product) in the firstquarter of 2014-15
• CAD was $21.8 billion (4.8 per cent of GDP)in the year ago period for the same quarter.
• However, it was higher than $1.2 billion(0.2 per cent of GDP) in Q4 of 2013-14.
23
Current Account: India
24
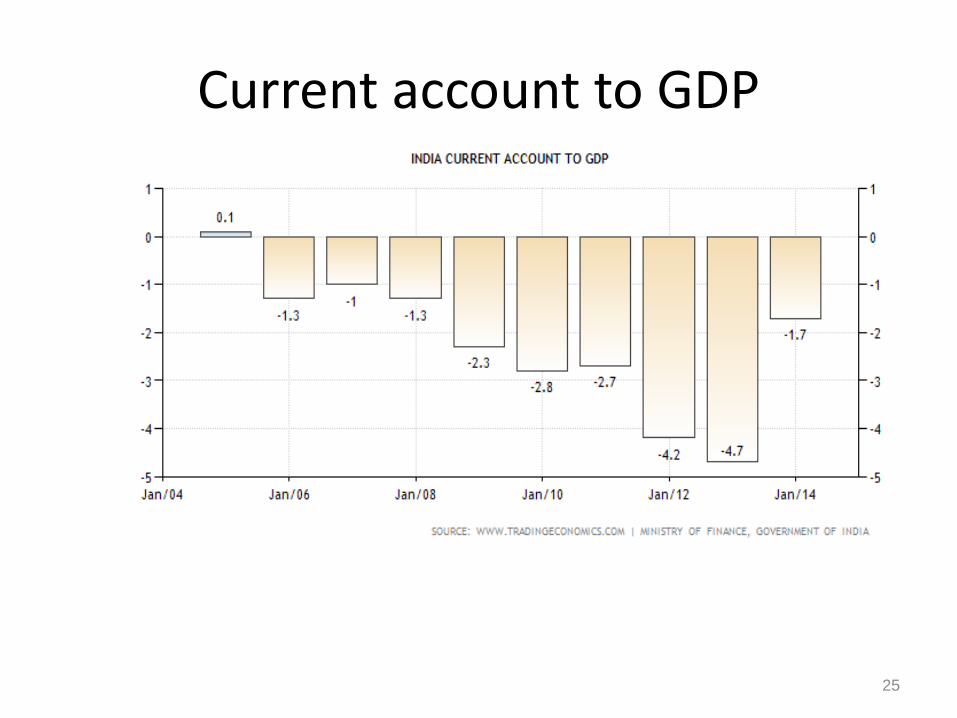
Current account to GDP
25
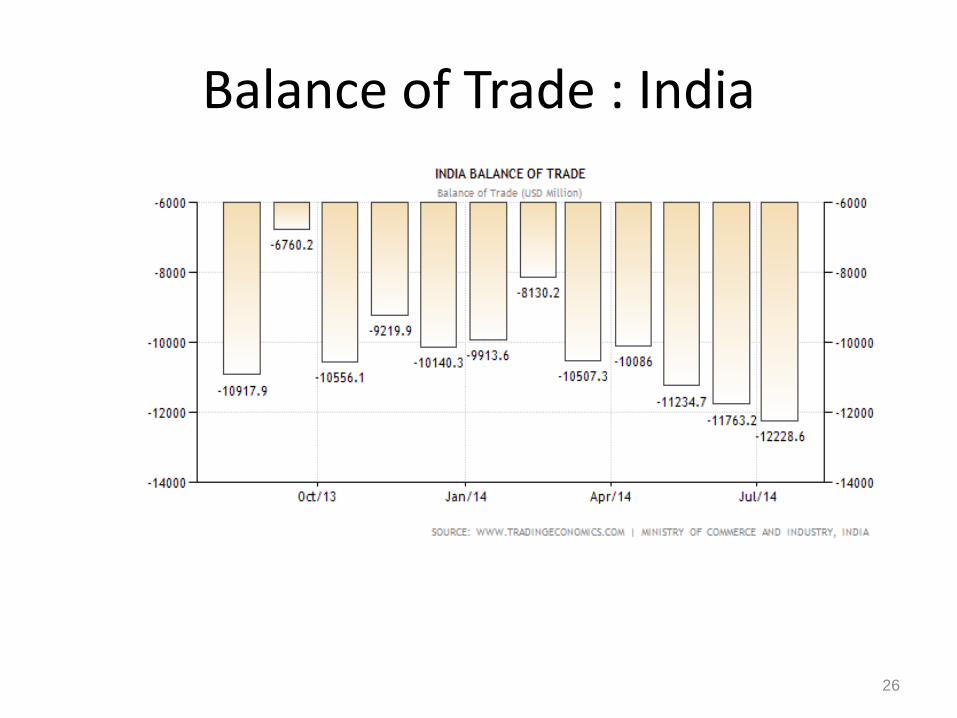
Balance of Trade : India
26

India exports
27

India imports
28

India Remittances
29
Million USD
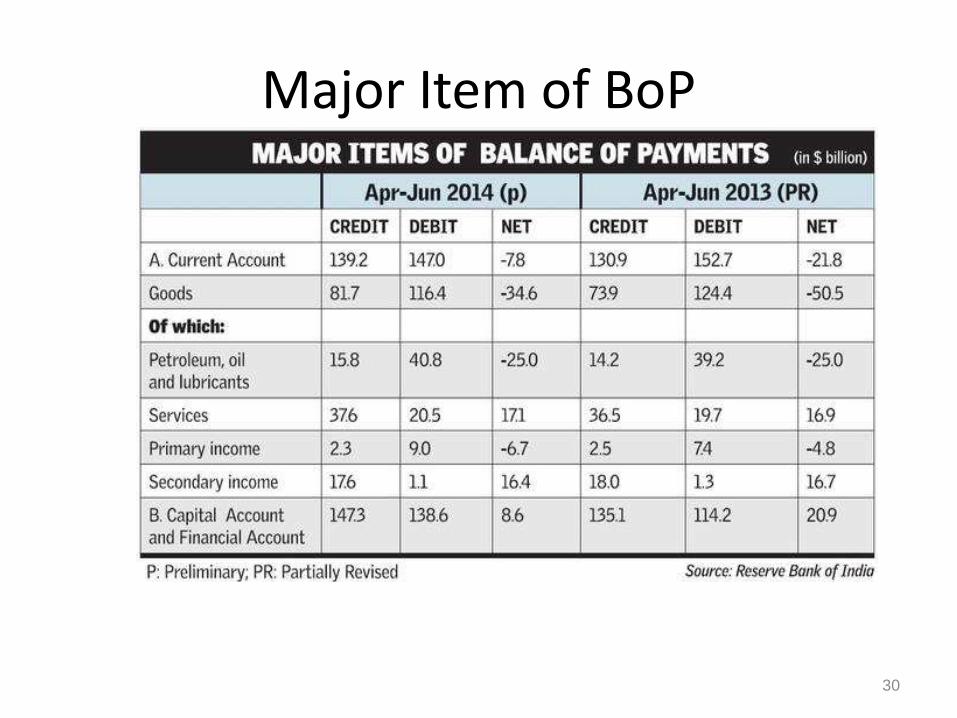
Major Item of BoP
30
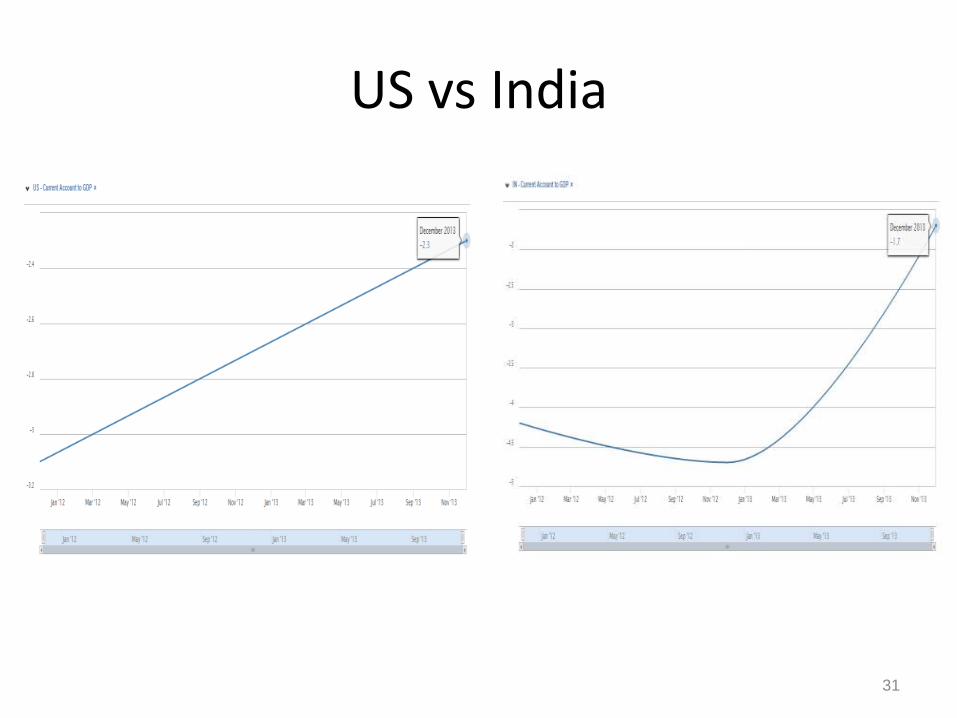
US vs India
31

China vs India
32

Largest trading partners of India
• According to the Department of Commerce,the fifteen largest trading partners ofIndia represent 62.1% of Indian imports, and58.1% of Indian exports as of December 2010.
• These figures do not include services orforeign direct investment, but only trade ingoods
33
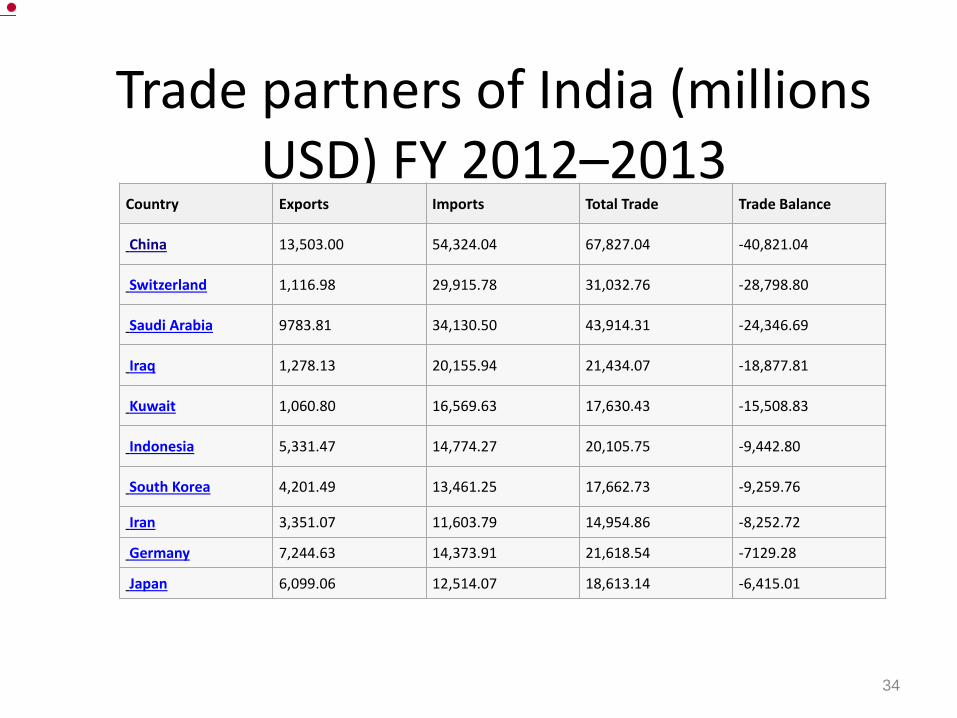
Trade partners of India (millions USD) FY 2012–2013
Country Exports Imports Total Trade Trade Balance
China 13,503.00 54,324.04 67,827.04 -40,821.04
Switzerland 1,116.98 29,915.78 31,032.76 -28,798.80
Saudi Arabia 9783.81 34,130.50 43,914.31 -24,346.69
Iraq 1,278.13 20,155.94 21,434.07 -18,877.81
Kuwait 1,060.80 16,569.63 17,630.43 -15,508.83
Indonesia 5,331.47 14,774.27 20,105.75 -9,442.80
South Korea 4,201.49 13,461.25 17,662.73 -9,259.76
Iran 3,351.07 11,603.79 14,954.86 -8,252.72
Germany 7,244.63 14,373.91 21,618.54 -7129.28
Japan 6,099.06 12,514.07 18,613.14 -6,415.01
34

India’s Top Exports and Imports-Commodities
35

Q1, FY 14-15 CAD
• Lower CAD was primarily on account of a contraction in trade deficitcontributed by both a rise in exports and a decline in imports
• Exports, at $81.7 billion, increased by 10.6 per cent in the first quarter of2014-15 as against a decline of 1.5 per cent in the first quarter of 2013-14.
• Imports, at $116.4 billion, moderated by 6.5 per cent as against anincrease of 4.7 per cent.
• The decline in imports was primarily led by a steep drop of 57.2 per centin gold imports, which amounted to $7 billion, significantly lower than$16.5 billion
36
• Non-gold imports recorded a modest rise of 1.3 per cent as against adecline of 0.6 per cent in the corresponding quarter of last year reflectingsome revival in economic activity
• Net services receipts improved marginally on account of higher exports ofservices. Net services at $17.1 billion recorded a growth of 1.2 per cent inthe first quarter of 2014-15.
• "As growth picks up non-oil non-gold imports shall start picking up so ourcurrent account deficit will come under little more pressure. But the flipside of that is our fiscal deficit will come under less pressure becausegrowth will pick up. WE have to manage both as we go along. My sense iswe are much better prepared our macro economic picture looks muchhealthier”..... Raghuram Rajan , Governor RBI
37
Q1, FY 14-15 CAD

Agenda
38
Introduction
Calculation
Reducing current account deficit
Trends (BOP and Current a/c)
Conclusion

Evaluation – Pros & Cons
• Pros of current account deficit
• Good for short term
• High money supply (from foreign borrowings) leads to higher productivity & employment
• Decrease in imports by higher import duty by the establishment to narrow the deficit
• Higher exports due to devaluation of domestic currency against the foreign currency
• Development of infrastructure & introduction of better foreign industrial practices in culture.
39

• Cons of current account deficit
• Higher financing through borrowing burdens the country with high interest payments
• Decline in confidence in the economy can lead to withdrawal of investment & devaluation of currency and inflation
40

Conclusion
• Advantages or disadvantages of current account deficit depends on its % of GDP.
• Depends on how the deficit is financed. Financing it through long term capital investment instead of borrowing is better alternative.
• Depends upon the country in question. Developing countries are more vulnerable.
41

42


