Beef Cow Nutrition Guide Dale A. Blasi Extension Specialist, Forage Utilization/Stocker Frank K. Brazle Extension Specialist, Livestock Production, Southeast Gerry L. Kuhl Extension Specialist, Beef Cattle Nutrition and Management Twig T. Marston Extension Specialist, Cow/Calf Management Kansas State University Beef Cow Nutrition Guide Twig T. Marston Extension Specialist Cow/Calf Management Dale A. Blasi Extension Specialist Forage Nutrition and Management Frank K. Brazle Extension Specialist Livestock Production, Southeast Gerry L. Kuhl Extension Specialist Feedlot Specialization Kansas State University Agricultural Experiment Station and Cooperative Extension Service
Transcript
Beef Cow Nutrition Guide
Dale A. Blasi Extension Specialist, Forage Utilization/Stocker
Frank K. Brazle Extension Specialist,
Livestock Production, Southeast
Gerry L. Kuhl Extension Specialist,
Beef Cattle Nutrition and Management
Twig T. Marston Extension Specialist, Cow/Calf Management
Kansas State University
Beef Cow Nutrition Guide
Twig T. Marston Extension Specialist
Cow/Calf Management
Dale A. Blasi Extension Specialist
Forage Nutrition and Management
Frank K. Brazle Extension Specialist
Livestock Production, Southeast
Gerry L. Kuhl Extension Specialist
Feedlot Specialization
Kansas State University Agricultural Experiment Station and
Cooperative Extension Service
�
�
The Biological Priority for Nutrients
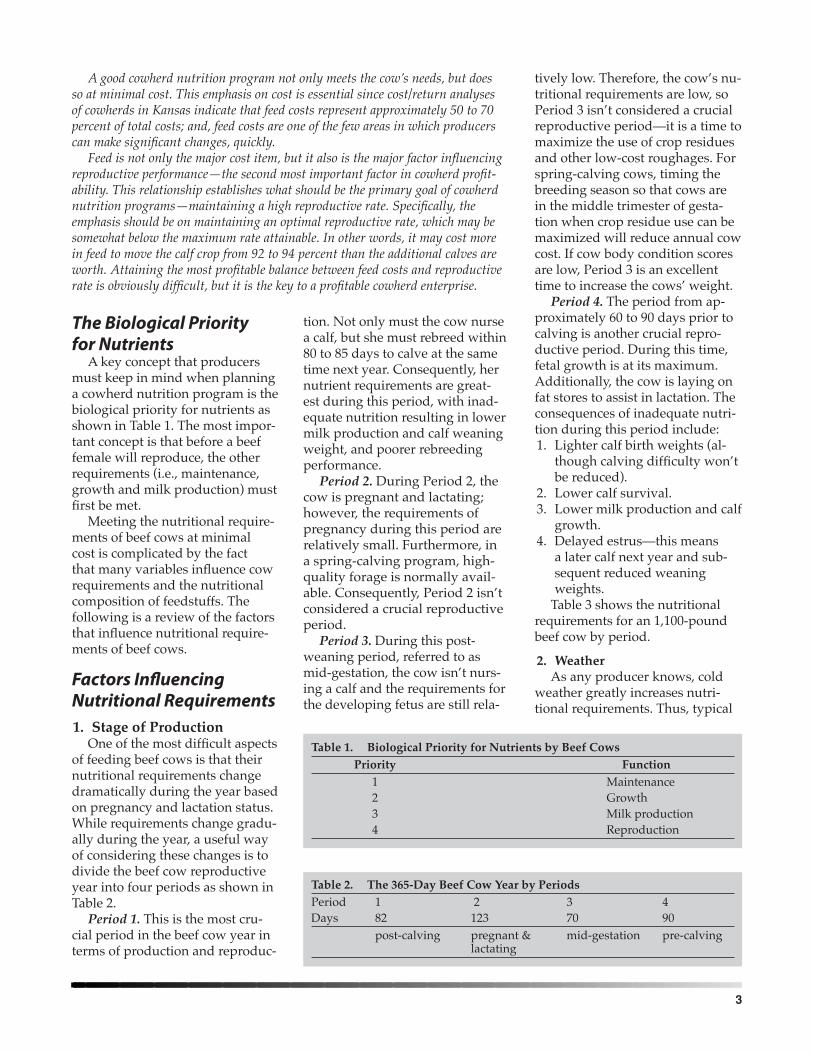
A key concept that producers must keep in mind when planning a cowherd nutrition program is the biological priority for nutrients as shown in Table 1. The most impor-tant concept is that before a beef female will reproduce, the other requirements (i.e., maintenance, growth and milk production) must first be met.
Meeting the nutritional require-ments of beef cows at minimal cost is complicated by the fact that many variables influence cow requirements and the nutritional composition of feedstuffs. The following is a review of the factors that influence nutritional require-ments of beef cows.
One of the most difficult aspects of feeding beef cows is that their nutritional requirements change dramatically during the year based on pregnancy and lactation status. While requirements change gradu-ally during the year, a useful way of considering these changes is to divide the beef cow reproductive year into four periods as shown in Table 2.
Period 1. This is the most cru-cial period in the beef cow year in terms of production and reproduc-
tion. Not only must the cow nurse a calf, but she must rebreed within 80 to 85 days to calve at the same time next year. Consequently, her nutrient requirements are great-est during this period, with inad-equate nutrition resulting in lower milk production and calf weaning weight, and poorer rebreeding performance.
Period 2. During Period 2, the cow is pregnant and lactating; however, the requirements of pregnancy during this period are relatively small. Furthermore, in a spring-calving program, high-quality forage is normally avail-able. Consequently, Period 2 isn’t considered a crucial reproductive period.
Period 3. During this post-weaning period, referred to as mid-gestation, the cow isn’t nurs-ing a calf and the requirements for the developing fetus are still rela-
A good cowherd nutrition program not only meets the cow’s needs, but does so at minimal cost. This emphasis on cost is essential since cost/return analyses of cowherds in Kansas indicate that feed costs represent approximately 50 to 70 percent of total costs; and, feed costs are one of the few areas in which producers can make significant changes, quickly.
Feed is not only the major cost item, but it also is the major factor influencing reproductive performance—the second most important factor in cowherd profit-ability. This relationship establishes what should be the primary goal of cowherd nutrition programs—maintaining a high reproductive rate. Specifically, the emphasis should be on maintaining an optimal reproductive rate, which may be somewhat below the maximum rate attainable. In other words, it may cost more in feed to move the calf crop from 92 to 94 percent than the additional calves are worth. Attaining the most profitable balance between feed costs and reproductive rate is obviously difficult, but it is the key to a profitable cowherd enterprise.
tively low. Therefore, the cow’s nu-tritional requirements are low, so Period 3 isn’t considered a crucial reproductive period—it is a time to maximize the use of crop residues and other low-cost roughages. For spring-calving cows, timing the breeding season so that cows are in the middle trimester of gesta-tion when crop residue use can be maximized will reduce annual cow cost. If cow body condition scores are low, Period 3 is an excellent time to increase the cows’ weight.
Period 4. The period from ap-proximately 60 to 90 days prior to calving is another crucial repro-ductive period. During this time, fetal growth is at its maximum. Additionally, the cow is laying on fat stores to assist in lactation. The consequences of inadequate nutri-tion during this period include: 1. Lighter calf birth weights (al-
though calving difficulty won’t be reduced).
2. Lower calf survival. 3. Lower milk production and calf
growth. 4. Delayed estrus—this means
a later calf next year and sub-sequent reduced weaning weights.
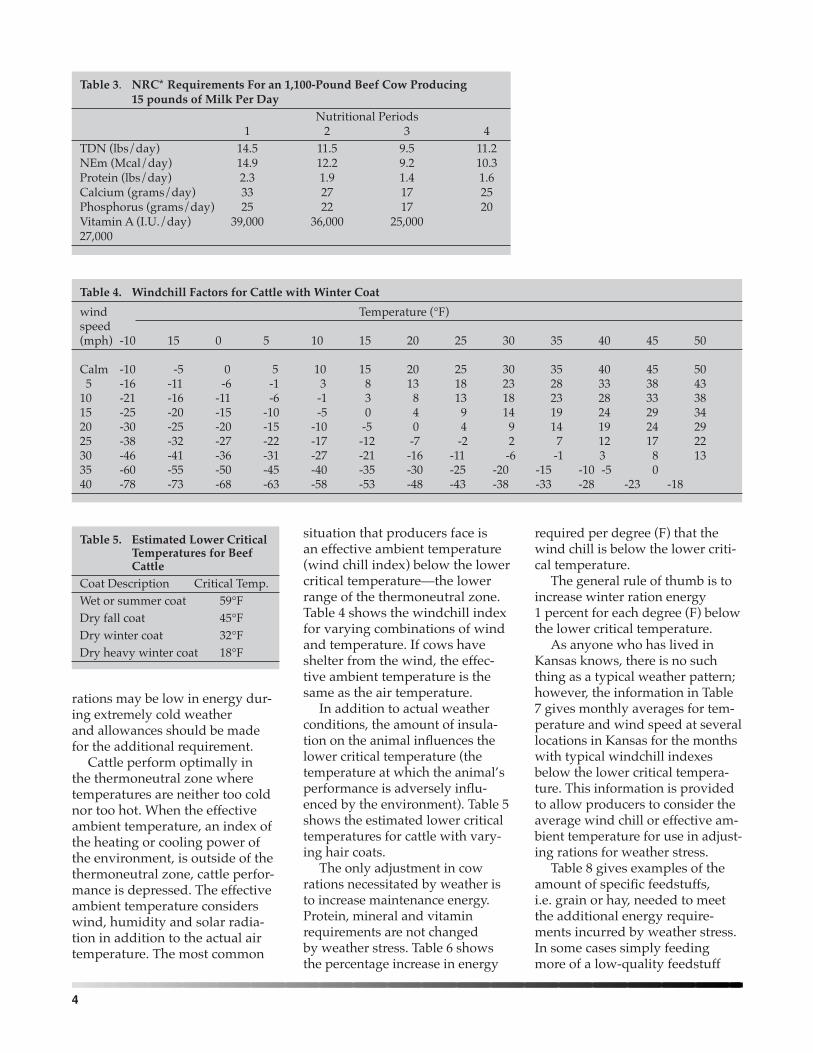
Table 3 shows the nutritional requirements for an 1,100-pound beef cow by period.
rations may be low in energy dur-ing extremely cold weather and allowances should be made for the additional requirement.
Cattle perform optimally in the thermoneutral zone where temperatures are neither too cold nor too hot. When the effective ambient temperature, an index of the heating or cooling power of the environment, is outside of the thermoneutral zone, cattle perfor-mance is depressed. The effective ambient temperature considers wind, humidity and solar radia-tion in addition to the actual air temperature. The most common
situation that producers face is an effective ambient temperature (wind chill index) below the lower critical temperature—the lower range of the thermoneutral zone. Table 4 shows the windchill index for varying combinations of wind and temperature. If cows have shelter from the wind, the effec-tive ambient temperature is the same as the air temperature.
In addition to actual weather conditions, the amount of insula-tion on the animal influences the lower critical temperature (the temperature at which the animal’s performance is adversely influ-enced by the environment). Table 5 shows the estimated lower critical temperatures for cattle with vary-ing hair coats.
The only adjustment in cow rations necessitated by weather is to increase maintenance energy. Protein, mineral and vitamin requirements are not changed by weather stress. Table 6 shows the percentage increase in energy
Table5. EstimatedLowerCritical TemperaturesforBeef CattleCoat Description Critical Temp.Wet or summer coat 59°FDry fall coat 45°FDry winter coat 32°FDry heavy winter coat 18°F
required per degree (F) that the wind chill is below the lower criti-cal temperature.
The general rule of thumb is to increase winter ration energy 1 percent for each degree (F) below the lower critical temperature.
As anyone who has lived in Kansas knows, there is no such thing as a typical weather pattern; however, the information in Table 7 gives monthly averages for tem-perature and wind speed at several locations in Kansas for the months with typical windchill indexes below the lower critical tempera-ture. This information is provided to allow producers to consider the average wind chill or effective am-bient temperature for use in adjust-ing rations for weather stress.
Table 8 gives examples of the amount of specific feedstuffs, i.e. grain or hay, needed to meet the additional energy require-ments incurred by weather stress. In some cases simply feeding more of a low-quality feedstuff
�
will not meet these additional requirements, in which case the energy density of the diet must be increased by either feeding a high-quality forage or by adding a high-energy feedstuff such as grain.
3. CowWeightAs cow weight increases, the
nutritional requirement for en-ergy and protein increases. Table 9 shows the energy and protein requirements for cows of differ-ing weights at moderate body conditioning scores. As a general rule, each 100-pound change in weight changes the Net Energy of Maintenance (NEm) requirement by about .57 Mcal. Correspond-ingly, the crude protein require-ment changes by about .1 pound for each 100-pound change in body weight.
4. CowBodyConditionScoreWhile the concept of using body
condition as a tool in feeding cattle is certainly not new, it has gained considerable favor with produc-ers and nutritionists since numer-ous research trials have shown that reproduction in beef cows is greatly influenced by body fatness. For example, Table 10 shows the relationship between body condi-tion at calving, pre- and post-calv-ing gains, and cycling activity 60 days post-calving. From a practical standpoint, the goal should be to have cows calve in good body con-dition and avoid significant loss in condition between calving and the start of the breeding season.
To assist producers in eval-uat-ing body condition, a nine-point cow condition scoring system has been developed with “1” being a very thin cow and “9” a very fat cow. Readers interested in more in-formation regarding the use of this system are referred to the bulletin, C-842, Feeding Your Cows by Body Condition Score, available from K-State Research and Extension.
Average monthly temperatureJan. 24.9 29.5 27.2 26.1 29.6Feb. 30.9 35.0 31.9 32.5 35.1Mar. 39.9 42.1 37.2 41.8 44.1Nov. 41.1 42.5 38.1 42.7 44.3Dec. 30.8 33.7 30.3 31.8 34.41 Comparative climatic data for the United States through 1978.2 Monthly normals of temperature, precipitation, and HDD and CDD for
1951–1980 for Kansas. Sept. 1982 edition #81.
Table8. AffectofTemperatureonEnergyNeedsa
Effective Increase % Amount of Extra Extra Grain Temp. in Energy Hay Needed or Needed50°F 0 0 030°F 0 0 010°F 20 31⁄2–4 lbs/cow 2–21⁄2 lbs/cow-10°F 40 7–8 lbs/cow 4–5 lbs/cowa Assumes a dry winter coat.
Table9. RelationshipBetweenCowWeightandNutrientRequirements— (dry,maturecows—middlethirdofpregnancy) Requirements (lbs)Cow Weight TDN NEm Protein (lbs/day) (Mcal/day) (lbs/day)1000 8.8 7.57 1.31100 9.5 8.13 1.41200 10.1 8.68 1.5Nutrient Requirements of Beef Cattle, NRC, 1984.
�
5.MilkProductionMilk production places tre-
mendous demands for nutrients on beef cows. For example, an increase in milk production of 5 pounds per day requires about 1.7 Mcal of NEm, .3 pounds of crude protein, .012 pounds of calcium, and .006 pounds of phosphorus. Table 11 illustrates the influence of increasing milk production on cow nutrient requirements.
Not only does milk production put tremendous nutritional stress on beef cows, but peak lactation usually occurs by 60 to 80 days postpartum, which unfortunately precedes the start of the breeding
6. AgeThe age of the animal influences
nutritional requirements because a young cow is still growing. Again, a review of the biological priority for nutrients (Table 1) is useful since it indicates that growth is the second highest priority. The importance of this factor is clear when one considers that Kansas producers routinely indicate that most of their “open” cows are 2- and 3-year-olds. The failure of these females to rebreed means that nutrition was inadequate to meet maintenance + growth + milk production and al-low for reproduction.
Table 19 shows the nutrient requirements of 2-year-old heifers during early lactation. Included in these requirements is a growth rate of .5 pounds per day. The actual growth rate may be higher for large-framed heifers or heifers that are compensating for previ-ous restrictions in energy intake. Consequently, producers should increase the levels of energy and protein above those shown in Table 19, if these situations exist.
If possible, young females, along with old or thin cows, should be fed separately from the mature cows during the winter so that their additional nutritional requirements for growth and/or condition can be met. In short, the loss of 2- and 3-year-old cows due to reproduc-tive failure represents a significant economic loss because the expense of heifer development has already been incurred with very limited returns.
7. PhysicalActivityThe maintenance requirement
of beef cows is increased by activ-ity. As a general guideline, the NEm requirement is increased by about .9 Mcal/day in cows graz-ing compared to cows fed in a drylot. Consequently, if cows are required to graze over wide areas, adjustments should be made to the requirements shown in Table 19.
Table10. RelationshipofBodyConditionandPercentageofCowsCycling 60DaysAfterCalvingCondition Weight change Weight change % cyclingat calving pre-calving post-calving 60 days post-calvingGood Lost Lost 90%+Moderate Gained Lost 74%Moderate Lost Lost 48%Thin Lost Gained 46%Thin Lost Lost 25%* Source: Whitman, Colorado State University, 1975.
Table11. RelationshipBetweenMilkProductionandNutrient Requirements—1,100-poundcow Requirement (lbs.) Lbs. of milk TDN NEm Protein per day (lbs/day) (Mcal/day) (lbs/day) 10 12.1 11.54 2.0 15 13.3 13.24 2.3 20 14.5 14.94 2.6Nutrient Requirements of Beef Cattle, NRC, 1984.
season. Also, it is important to keep in mind that milk production has a higher biological priority for nutrients than reproduction. Consequently, attempting to feed a thin cow more just prior to the breeding season to increase con-dition may only result in more milk production. Table 12 shows the average peak production and average total production over a 205-day lactation for the most common beef breeds. Studies of lactation curves in beef cows indicate that milk production increases rather rapidly from birth of the calf to a peak at 60–80 days and then declines slowly until weaning.
Table12. PeakandAverageMilkProductionforCommonBeefBreedsBreed Peak milk Average milk production production lbs/day lbs/dayAngus 20.7 14.9Charolais 21.6 15.1Gelbvieh 25.3 17.8Hereford 18.7 12.5Limousin 20.9 14.1Simmental 24.1 16.8Meat Animal Research Center.
�
While cold weather generally increases intake, windy or wet weather will reduce grazing time and intake.
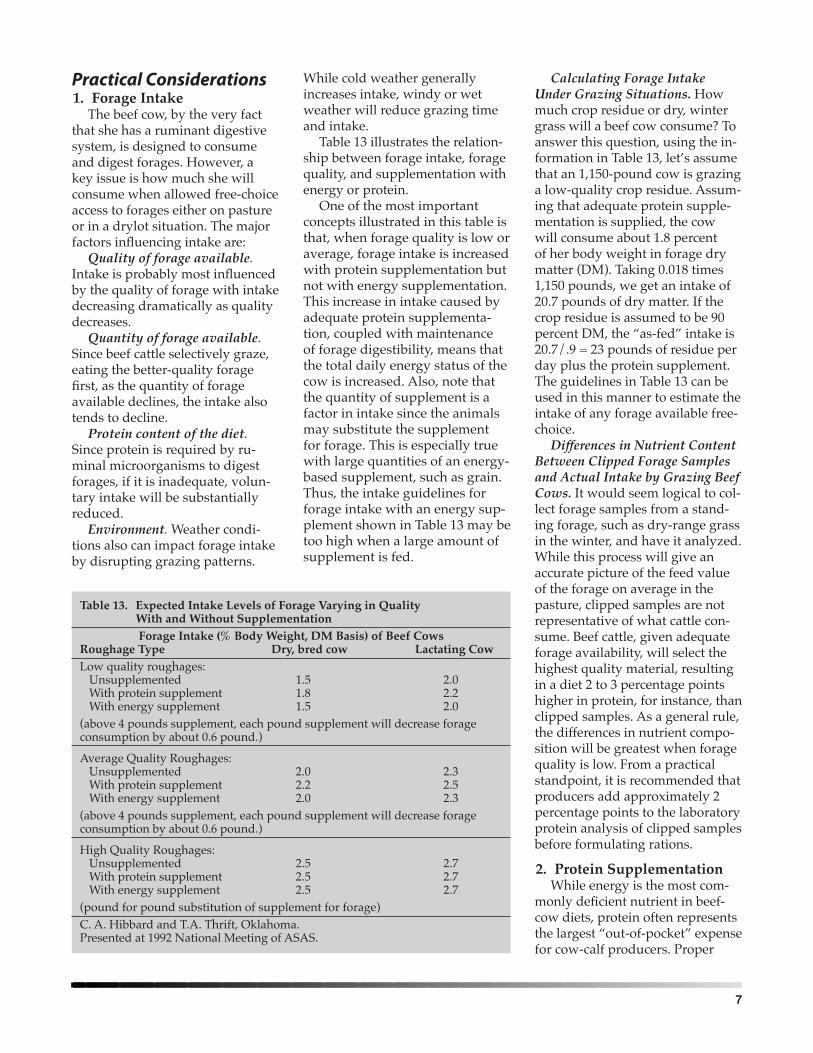
Table 13 illustrates the relation-ship between forage intake, forage quality, and supplementation with energy or protein.
One of the most important concepts illustrated in this table is that, when forage quality is low or average, forage intake is increased with protein supplementation but not with energy supplementation. This increase in intake caused by adequate protein supplementa-tion, coupled with maintenance of forage digestibility, means that the total daily energy status of the cow is increased. Also, note that the quantity of supplement is a factor in intake since the animals may substitute the supplement for forage. This is especially true with large quantities of an energy-based supplement, such as grain. Thus, the intake guidelines for forage intake with an energy sup-plement shown in Table 13 may be too high when a large amount of supplement is fed.
Practical Considerations1. ForageIntake
The beef cow, by the very fact that she has a ruminant digestive system, is designed to consume and digest forages. However, a key issue is how much she will consume when allowed free-choice access to forages either on pasture or in a drylot situation. The major factors influencing intake are:
Quality of forage available. Intake is probably most influenced by the quality of forage with intake decreasing dramatically as quality decreases.
Quantity of forage available. Since beef cattle selectively graze, eating the better-quality forage first, as the quantity of forage available declines, the intake also tends to decline.
Protein content of the diet. Since protein is required by ru-minal microorganisms to digest forages, if it is inadequate, volun-tary intake will be substantially reduced.
Environment. Weather condi-tions also can impact forage intake by disrupting grazing patterns.
ForageIntake(%BodyWeight,DMBasis)ofBeefCowsRoughageType Dry,bredcow LactatingCowLow quality roughages: Unsupplemented 1.5 2.0 With protein supplement 1.8 2.2 With energy supplement 1.5 2.0(above 4 pounds supplement, each pound supplement will decrease forage consumption by about 0.6 pound.)
Average Quality Roughages: Unsupplemented 2.0 2.3 With protein supplement 2.2 2.5 With energy supplement 2.0 2.3(above 4 pounds supplement, each pound supplement will decrease forage consumption by about 0.6 pound.)
High Quality Roughages: Unsupplemented 2.5 2.7 With protein supplement 2.5 2.7 With energy supplement 2.5 2.7(pound for pound substitution of supplement for forage)C. A. Hibbard and T.A. Thrift, Oklahoma. Presented at 1992 National Meeting of ASAS.
Calculating Forage Intake Under Grazing Situations. How much crop residue or dry, winter grass will a beef cow consume? To answer this question, using the in-formation in Table 13, let’s assume that an 1,150-pound cow is grazing a low-quality crop residue. Assum-ing that adequate protein supple-mentation is supplied, the cow will consume about 1.8 percent of her body weight in forage dry matter (DM). Taking 0.018 times 1,150 pounds, we get an intake of 20.7 pounds of dry matter. If the crop residue is assumed to be 90 percent DM, the “as-fed” intake is 20.7/.9 = 23 pounds of residue per day plus the protein supplement. The guidelines in Table 13 can be used in this manner to estimate the intake of any forage available free-choice.
Differences in Nutrient Content Between Clipped Forage Samples and Actual Intake by Grazing Beef Cows. It would seem logical to col-lect forage samples from a stand-ing forage, such as dry-range grass in the winter, and have it analyzed. While this process will give an accurate picture of the feed value of the forage on average in the pasture, clipped samples are not representative of what cattle con-sume. Beef cattle, given adequate forage availability, will select the highest quality material, resulting in a diet 2 to 3 percentage points higher in protein, for instance, than clipped samples. As a general rule, the differences in nutrient compo-sition will be greatest when forage quality is low. From a practical standpoint, it is recommended that producers add approximately 2 percentage points to the laboratory protein analysis of clipped samples before formulating rations.
2. ProteinSupplementationWhile energy is the most com-
monly deficient nutrient in beef-cow diets, protein often represents the largest “out-of-pocket” expense for cow-calf producers. Proper
�
protein supplementation of poor quality forages will increase for-age intake. Increased forage intake meets the cow additional energy intake. Thus, to maximize profit-ability, it is essential to optimize protein supplementation. Inad-equate dietary protein results in low forage intake and digestibility, resulting in much poorer perfor-mance. This reduction in perfor-mance may be expressed as weight loss, a decline in body condition, lower milk production, lower an-tibody transfer to calves through colostrum, or numerous health problems resulting from lowered resistance to disease.
Meeting the protein require-ments of beef cattle is complicated by the fact that the microorganisms in the ruminant digestive system can utilize many sources of nitro-gen to make protein. Additionally, the digestive characteristics of plant and animal proteins are variable. The following section is an attempt to define some of the terms used in describing types of protein and give guidelines for practical application of these concepts.
Degradable and Undegradable Intake Protein. The protein frac-tion of the diet can be divided into two components, degradable in-take protein (DIP) and undegrad-able intake protein (UIP). The DIP fraction is available to the rumen microflora and, thus, can be used for their growth and digestion of dietary fiber. Supplementing low-quality forages with DIP has been shown to increase forage digestion and intake, thus increasing energy intake. The UIP is not available to the rumen microflora and, there-fore, has essentially no effect on forage utilization. The UIP fraction can be a direct supply of amino acids to the host animal or it can go undigested and be expelled from the gastrointestinal tract. Oil seed byproducts (soybean meal, cottonseed meal, sunflower meal) contain a high percentage of DIP while proteins derived from ani-
mal sources contain mostly UIP. From these general statements, producers should realize that for most forage-based diets, supple-mentation programs should focus on the inclusion rates of DIP in the diet. K-State research has indicated that the amount of DIP required to maximize forage use appears to be about 10 to 11 percent of the digestible organic matter (which is roughly the same as TDN content). Therefore, to correctly supply the proper amount of supple-ment, producers need to know the source of the supplemental protein as well as an estimate of forage intake, digestibility and nutrient composition.
Non-Protein Nitrogen (NPN). From a practical viewpoint, cattle have the ability to use either “natu-ral” protein such as that contained in feedstuffs or various other nitrogen sources. Sources other than natural protein are generally referred to as nonprotein nitrogen (NPN) sources. Common NPN sources used in protein supple-ments include urea, biuret and ammonia hydroxide.
Usefulness of NPN in Beef Cow Rations—The use of NPN in cow rations has been discouraged in the past because for the rumen micro-flora to convert NPN into protein they must also be supplied with adequate energy and carbon skele-tons. Forage-based diets usually do not supply excessive amounts of either, thus, limiting the quantity of NPN that can be fully utilized. Most NPN sources are considered to be 100 percent DIP in nature. Recent research results have indi-cated limited amounts of the DIP in supplements can be replaced by NPN. At present, an inclusion level of 15 percent of the total crude protein (or 20 percent of the DIP) as NPN can be used without sig-nificantly jeopardizing livestock performance. Because of the severe energy limitations of low-quality forage diets, NPN is less
potent as an energy source than say with high-quality-forage diets or high-concentrate diets. Previ-ous research where supplement containing significant amounts of NPN indicates that, at best, 50 percent of the protein coming from NPN can be utilized by cows con-suming low- to medium-quality roughages. And, as NPN inclusion rates increase, the NPN utilization can steadily fall from 50 percent to as low as 20 to 25 percent. There-fore, cattlemen need to carefully analyze their protein supplementa-tion programs and only include those amounts of NPN that will be optimum to their operations.
Interpreting the NPN content of feedstuffs—Feed tags must show the NPN content of commercial-protein supplements. Commonly, this is done by showing the total protein concentration followed by the amount of protein coming from NPN. For example, a tag on a range cube might show the figures “20–10” for protein. This means that the total protein con-tent of the cube is 20 percent with the equivalent of 10 percentage units or 50 percent of the protein coming from NPN.
Calculating the Protein Value of a Supplement with NPN—For use with beef cows grazing dormant range or crop residues in late win-ter, the 20–10 supplement should be considered, at best, a 15 percent supplement (10 percent from natu-ral sources plus 50 percent of the 10 percent from NPN). Again, this is allowing for 50 percent utilization of the NPN which is a “best case” scenario.
If the actual rate of utilization is only 20 percent, as could be the case with crop residues in late win-ter, this supplement may only give performance equal to a 12 percent all natural (10 percent natural + 20 percent of the 10 percent from NPN = 12 percent). Note that the 12 or 15 percent figure for protein content should be used both for meeting protein requirements and
�
for pricing the supplement com-pared to a 20 percent “all natural supplement” or other protein source.
Biuret—While urea is the most commonly used form of NPN, many supplements contain biuret which is essentially two urea mol-ecules chemically bound together. Biuret is somewhat safer, but a review of research comparing urea and biuret indicates that the per-formance of cattle has been similar.
Ammonia Hydroxide—During the past 10 years, ammoniation of roughages has gained wide accep-tance by beef producers in Kansas, especially as a way of making a quality feedstuff out of wheat straw and other crop residues in drought years. Feed analyses routinely show an increase in the crude protein content of wheat straw by 4 to 6 percentage points by ammoniation. Thus, a straw at 4 percent CP prior to ammoniation often tests 9 percent CP after am-moniation. However, this protein is in the form of ammonia hydrox-
ide—an NPN source. Research has shown that beef cows make some use of this NPN source, but respond very well to additional supplementation with “natural” protein. This clearly points out that the primary reason for am-moniating forages is to increase fiber and energy intake and digest-ibility, and not to meet all of the protein needs of the cows.
By-Pass Protein. In recent years, considerable research has focused on the concept that not all types of “natural” proteins are digested by rumen microorganisms—some of it “by-passes” or escapes the rumen to be digested directly in the intestine. Examples of high-escape protein sources include dehydrated alfalfa, blood meal, corn gluten meal, distillers grains and feather meal. There is merit in having a percent-age of protein bypass ruminal di-gestion, and protein sources differ greatly in the proportion of protein that bypasses.
A review of the literature on by-pass protein utilization by beef cows indicates that high-bypass sources rarely show any benefit compared to other “all natural” sources such as soybean meal (SBM) or cottonseed meal (CSM). However, supplements contain-ing high bypass protein sources are better utilized in combination with NPN than are lower bypass sources such as SBM. In general, producers can price high bypass compared to low-bypass protein sources on a pound-for-pound basis for use with beef cows. It should be pointed out, however, that high-bypass sources plus NPN have shown some benefit in grow-ing programs and may have some economic advantage.
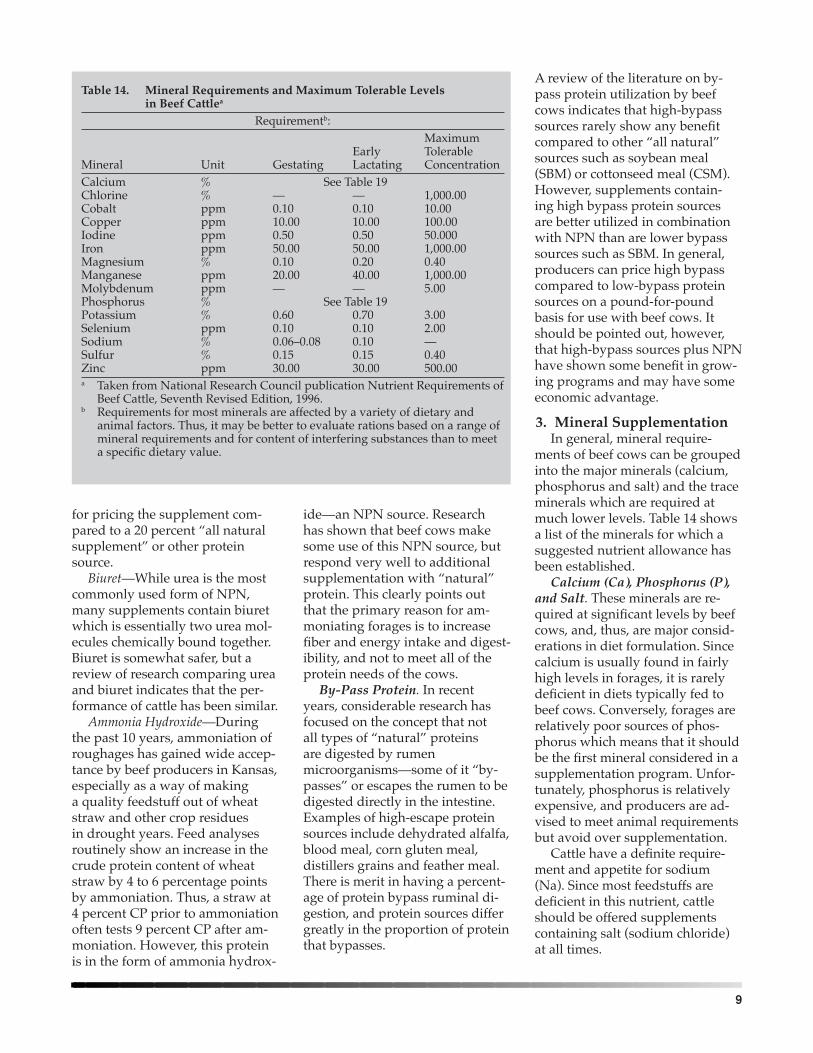
3. MineralSupplementationIn general, mineral require-
ments of beef cows can be grouped into the major minerals (calcium, phosphorus and salt) and the trace minerals which are required at much lower levels. Table 14 shows a list of the minerals for which a suggested nutrient allowance has been established.
Calcium (Ca), Phosphorus (P), and Salt. These minerals are re-quired at significant levels by beef cows, and, thus, are major consid-erations in diet formulation. Since calcium is usually found in fairly high levels in forages, it is rarely deficient in diets typically fed to beef cows. Conversely, forages are relatively poor sources of phos-phorus which means that it should be the first mineral considered in a supplementation program. Unfor-tunately, phosphorus is relatively expensive, and producers are ad-vised to meet animal requirements but avoid over supplementation.
Cattle have a definite require-ment and appetite for sodium (Na). Since most feedstuffs are deficient in this nutrient, cattle should be offered supplements containing salt (sodium chloride) at all times.
Requirementb: Maximum Early TolerableMineral Unit Gestating Lactating ConcentrationCalcium % See Table 19Chlorine % — — 1,000.00Cobalt ppm 0.10 0.10 10.00Copper ppm 10.00 10.00 100.00Iodine ppm 0.50 0.50 50.000Iron ppm 50.00 50.00 1,000.00Magnesium % 0.10 0.20 0.40Manganese ppm 20.00 40.00 1,000.00Molybdenum ppm — — 5.00Phosphorus % See Table 19Potassium % 0.60 0.70 3.00Selenium ppm 0.10 0.10 2.00Sodium % 0.06–0.08 0.10 —Sulfur % 0.15 0.15 0.40Zinc ppm 30.00 30.00 500.00a Taken from National Research Council publication Nutrient Requirements of
Beef Cattle, Seventh Revised Edition, 1996.b Requirements for most minerals are affected by a variety of dietary and
animal factors. Thus, it may be better to evaluate rations based on a range of mineral requirements and for content of interfering substances than to meet a specific dietary value.
10
Trace Minerals. Table 14 indi-cates both the minimum required levels and maximum tolerable levels for trace minerals. Require-ments for these minerals may be met by using trace mineralized (TM) Salt in a free-choice supple-ment; however, there are a few areas in Kansas where deficiencies of specific trace minerals are com-mon. In these locations, producers must increase the concentration of specific trace minerals in the supplement to avoid deficiency symptoms. A mineral consumed at .22 pounds/day would have to contain 0.0005 percent Cobalt, 0.05 percent Copper, 0.0025 percent Io-dine, 0.25 percent Iron, .25 percent Manganese, 0.0005 percent Seleni-um, and .2 percent Zinc to meet 50 percent of a beef cow’s total daily requirement.
GeneralConsiderationsinMineralSupplementation
Do Beef Cows Have the Ability to Balance Their Mineral Require-ments? Many producers believe that beef cows have the ability to consume specific minerals when a deficiency exists. However, re-search has shown that cows do not have the “nutritional wisdom” to balance their diets, which means that producers must do the “bal-ancing” for their cows. However, as previously mentioned, one of the minerals that cattle do crave is salt. Thus, other minerals should be mixed with salt or other feed ingredients to promote intake. The desire for salt means that a free-choice mineral, high in TM Salt and phosphorus, will usually provide adequate mineral supple-mentation. Since cows don’t crave minerals other than salt, it is rec-ommended that producers avoid using a salt block separate from a free-choice mineral supplement.
Producers often comment that their cows go through periods of extremely high mineral intake and periods of little or no intake. Again, these fluctuations are prob-
ably driven by an appetite for salt. Consequently, producers should increase the salt content of their free-choice mineral when the cows consume over .2 pounds daily.
Free-Choice Mineral Supplements. Average mineral consumption per cow should range from .1 to .2 pounds daily. Intake can be adjusted by alter-ing the salt level (higher levels reduce intake) or adding flavoring agents, such as SBM or molasses, to increase intake. Phosphorus intake and the cost of mineral supplementation can best be al-tered by changing the salt level in the mineral.
“Home Mineral Mixes.” In pe-riods of high requirements, such as early lactation and the breeding season, a mixture of 50 percent Dicalcium phosphate + 50 percent TM Salt is recommended. Dur-ing these periods, 3 to 5 percent SBM or molasses may be added to increase intake and prevent cak-ing. During periods of reduced mineral requirements, a mixture of 30 percent Dicalcium phosphate + 70 percent TM Salt should be adequate.
Special Mineral Considerations. Magnesium—Many producers
must supplement with magnesium (Mg) in the early spring to prevent
Table15. EstimatedDailyWaterIntakeofCattle Cows Mean Nursing Bred Dry Temp. Calves1 Cows & Heifers BullsMonth °F Gal Gal GalJanuary 36 11.0 6.0 7.0March 50 12.5 6.5 8.6May 73 17.0 9.0 12.0July 90 16.5 14.5 19.0Sept. 78 17.5 10.0 13.0Nov. 52 13.0 6.5 9.0Source: Paul Q. Guyer, University of Nebraska.1 Cows nursing calves during first three to four months after parturition—peak
milk production period.
Table16. RationsfortheMiddleTrimesterofPregnancy (OctoberthroughNovember) Amount Per Head Per DayRation Feedstuff Lbs. Feedstuff Lbs. Mineral Req.1 Wheat Straw 17 + Alfalfa Hay 6.5 P + TM Salt2 Corn Stovera 24 — P + TM Salt 3 Milo Stovera 24 — P + TM Salt4 Brome Hay 18b — TM Salt5 Prairie Hay 22c — P + TM Salt6 Prairie Hay 22 + Commercial .5d TM Salt Cubesa Both the corn and milo stovers were assumed to be 6.6 percent crude protein
during this period.b This level of intake is only 72 percent of expected free choice consumption,
which means that all cows must have access during feeding to avoid over consumption by “boss” cows.
c Slightly low in CPd 20 percent CP. A practical way of delivering these cubes would be to feed 2
pounds/head every four days, or even 3 pounds/head every six days. Note: If a high urea cube is utilized, they should be fed daily instead of
periodically.
11
grass tetany, especially on cool-sea-son forages such as brome, fescue and wheat pasture. Supplementa-tion should be started about three weeks prior to initiation of grazing for best results. The recommended intake of magnesium oxide (MgO) is at least .03 pounds per day which means that it must make up 15 to 20 percent of a free-choice mineral supplement. A good “home mix” for this period would be 15 percent MgO, 50 percent di-calcium phosphate, 25 percent salt, and 10 percent molasses or SBM. Since MgO is unpalatable, a fla-voring agent, such as molasses or
SBM, should be added to increase intake. Commercial mineral mix-tures utilized during early spring should be at least 10 percent Mg. In some situations, it may be nec-essary to increase Mg above the normal requirement. A suggested mix for these situations, is 25 per-cent MgO, 25 percent dicalcium phosphate, 25 percent salt, and 25 percent molasses or SBM.
Chelated Minerals—Chelated minerals are trace minerals that are attached to an organic mol-ecule, i.e. an amino acid or pro-tein. Most research has shown that chelated minerals have greater
bioavailability (higher absorp-tion potential) than some organic forms, especially oxides, used in common mineral supplements.
However, inorganic forms are much less expensive. Currently, the question of whether chelates are beneficial or not is one of the most controversial areas in beef cattle nutrition. This controversy results from the fact that even though absorption is greater, there is little, if any, research demon-strating improved cattle perfor-mance. Until further research demonstrates an economic advan-tage, producers are advised to use
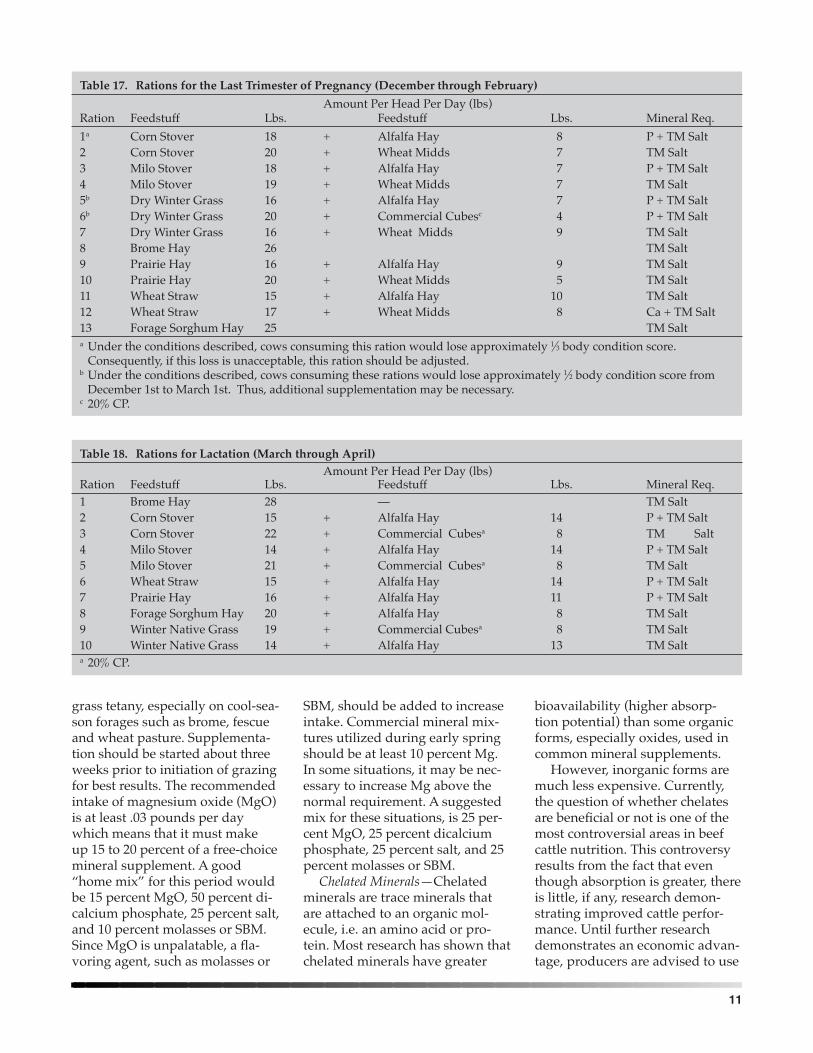
Table17. RationsfortheLastTrimesterofPregnancy(DecemberthroughFebruary) Amount Per Head Per Day (lbs)Ration Feedstuff Lbs. Feedstuff Lbs. Mineral Req.1a Corn Stover 18 + Alfalfa Hay 8 P + TM Salt2 Corn Stover 20 + Wheat Midds 7 TM Salt3 Milo Stover 18 + Alfalfa Hay 7 P + TM Salt4 Milo Stover 19 + Wheat Midds 7 TM Salt5b Dry Winter Grass 16 + Alfalfa Hay 7 P + TM Salt6b Dry Winter Grass 20 + Commercial Cubesc 4 P + TM Salt 7 Dry Winter Grass 16 + Wheat Midds 9 TM Salt 8 Brome Hay 26 TM Salt 9 Prairie Hay 16 + Alfalfa Hay 9 TM Salt10 Prairie Hay 20 + Wheat Midds 5 TM Salt11 Wheat Straw 15 + Alfalfa Hay 10 TM Salt12 Wheat Straw 17 + Wheat Midds 8 Ca + TM Salt 13 Forage Sorghum Hay 25 TM Salta Under the conditions described, cows consuming this ration would lose approximately 1⁄3 body condition score.
Consequently, if this loss is unacceptable, this ration should be adjusted.b Under the conditions described, cows consuming these rations would lose approximately 1⁄2 body condition score from
December 1st to March 1st. Thus, additional supplementation may be necessary.c 20% CP.
Table18. RationsforLactation(MarchthroughApril) Amount Per Head Per Day (lbs)Ration Feedstuff Lbs. Feedstuff Lbs. Mineral Req.1 Brome Hay 28 — TM Salt2 Corn Stover 15 + Alfalfa Hay 14 P + TM Salt3 Corn Stover 22 + Commercial Cubesa 8 TM Salt4 Milo Stover 14 + Alfalfa Hay 14 P + TM Salt 5 Milo Stover 21 + Commercial Cubesa 8 TM Salt6 Wheat Straw 15 + Alfalfa Hay 14 P + TM Salt7 Prairie Hay 16 + Alfalfa Hay 11 P + TM Salt8 Forage Sorghum Hay 20 + Alfalfa Hay 8 TM Salt9 Winter Native Grass 19 + Commercial Cubesa 8 TM Salt10 Winter Native Grass 14 + Alfalfa Hay 13 TM Salta 20% CP.
1�
highly available inorganic forms of trace minerals to minimize costs while assuring nutritional adequacy.
4. TroubleshootingCowHerdNutritionPrograms
It seems to be human nature to want to blame poor reproduction or performance in a herd of cattle on exotic causes rather than the most logical causes. In trouble-shooting cow herd nutrition pro-grams, keep in mind that a very high percentage of problems, in-cluding poor reproduction or low weaning weights, can be directly attributed to inadequate energy and/or protein intake and not to a trace mineral or unknown growth factor. Only after the adequacy of energy and protein has been es-tablished should the focus turn to mineral and vitamin nutrition.
5. VitaminRequirementsWhile beef cattle have require-
ments for several vitamins, most are produced by rumen microor-ganisms and, thus, are not required in the diet. However, vitamin A must be supplied in some form. Requirements for vitamin A are shown in Table 19. Research has shown that cattle are capable of storing large quantities of vitamin A in the liver during periods of high intake. This commonly occurs during the grazing season on lush, green forage, with these storage supplies being depleted during the winter months. Supplementing vitamin A is very inexpensive and can be accomplished by:
1. Feeding forages high in vita-min A such as high-quality alfalfa hay less than six to eight months old.
2. Including vitamin A in mineral mixes or in other supplements.
3. Injecting vitamin A in peri-ods where feedstuffs are low in vitamin A content and/or requirements are high. Injecting 2 million I.U. should provide sufficient vitamin A for 80 to 100 days.
6. WaterRequirementsNormally, water is easily sup-
plied to cattle and little thought is given to this requirement. But, drought conditions are common in Kansas and hauling water an all too frequent necessity. Generally, as temperature increases water consumption increases. If water in-take is limited, feed intake also will be depressed, resulting in subpar performance. Since water require-ments are influenced by a number of physiological and environmen-tal factors, Table 15 is included to provide a guideline for animal requirements.
Guidelines to Manage Beef Cow Diets 1. Feeding cattle is dynamic. Pro-
ducers must consider animal, environment and diet factors to correctly feed beef cows.
2. A cow’s nutrient requirements (energy, protein, minerals) will increase about 30 to 40 percent with calving. Forage intake will generally increase about 30 percent with calving.
3. Positive response to providing a supplement with high-protein concentrations is most likely when forage crude protein is less than 7 percent. The first-limiting nutrient in low-quality forages is protein. Therefore, the best approach for increasing total protein and energy supply is to supplement with DIP.
4. The NPN inclusion rate in sup-plements for forage-based diets must be monitored closely, as only up to 15 percent of the to-tal dietary crude protein should be NPN in nature. Including NPN at too high of levels may result in refusal to consume supplements.
5. Starch can negatively impact forage intake and fiber diges-tion. Supplementing winter cow diets with corn, grain sor-ghum and other cereal grains can actually decrease energy intake. The key is to meet pro-tein requirements of the rumen so that forage utilization is maximized.
6. When fed at levels exceeding 0.5 percent of body weight (e.g. 5.5 pounds of daily supplement for 1,100-pound cows) intake of low-quality forage will be reduced by 0.5 pounds for each 1 pound of alfalfa hay or low-protein concentrate fed above the 0.5 percent threshold.
7. Only minor differences in per-formance are evident for cattle supplemented every-other-day or three-times-weekly com-pared with daily.
1�
Table19. NutrientRequirementsofBreedingCattle Energy Daily in Diet DM Total Protein Calcium Phos. Vit. Ad
Wta Gainb Daily TDN NEm TDN NEm NEg Daily in Diet in Diet in Diet Daily(lbs) (lbs) DMc(lbs) (lbs) (Mcal) (%) (Mcal/lbs) (Mcal/lbs) (lbs) DM (%) DM (%) DM (%) (1000’s IU)Pregnant yearling heifers—Last third of pregnancy700 0.9 15.3 8.5 7.95 55.4 0.52 NAe 1.3 8.4 0.27 0.20 19700 1.4 15.8 9.6 7.95 60.3 0.60 0.34 1.4 9.0 0.33 0.21 20 700 1.9 15.8 10.6 7.95 67.0 0.70 0.43 1.5 9.8 0.33 0.21 20800 0.9 16.8 9.2 8.56 54.8 0.51 NA 1.4 8.2 0.28 0.20 21800 1.4 17.4 10.4 8.56 59.6 0.59 0.33 1.5 8.8 0.33 0.21 22800 1.9 17.5 11.6 8.56 66.1 0.69 0.42 1.6 9.3 0.35 0.21 22900 0.9 18.3 9.9 9.15 54.3 0.51 NA 1.5 8.1 0.26 0.20 23900 1.4 19.0 11.3 9.15 59.1 0.58 0.32 1.6 8.5 0.30 0.21 24900 1.9 19.2 12.5 9.15 65.4 0.68 0.41 1.7 9.0 0.32 0.21 24Dry pregnant mature cows—Middle third of pregnancy900 0.0 16.7 8.2 7.00 48.8 0.42 NA 1.2 7.0 0.18 0.18 21 1100 0.0 19.5 9.5 8.13 48.8 0.42 NA 1.4 7.0 0.19 0.19 251300 0.0 22.0 10.8 9.22 48.8 0.42 NA 1.5 6.9 0.20 0.20 28Dry pregnant mature cows—Last third of pregnancy900 0.9 18.2 9.8 9.15 54.0 0.50 NA 1.5 8.0 0.27 0.21 231000 0.9 19.6 10.5 9.72 53.6 0.50 NA 1.6 7.9 0.26 0.20 251200 0.9 22.3 11.8 10.83 52.9 0.49 NA 1.7 7.8 0.26 0.21 281400 0.9 24.9 13.1 11.90 52.5 0.48 NA 1.9 7.6 0.26 0.21 32Two-year-old heifers nursing calves—First 3–4 months postpartum—10 lbs milk/day700 0.5 15.9 10.3 9.20f 65.1 0.67 0.40 1.8g 11.3 0.36 0.24 28800 0.5 17.6 11.2 9.81f 63.8 0.66 0.39 1.9g 10.8 0.34 0.24 31900 0.5 19.2 12.0 10.40f 62.7 0.64 0.37 2.0g 10.4 0.32 0.23 341000 0.5 20.8 12.9 10.98f 61.9 0.62 0.36 2.1g 10.0 0.31 0.23 37Cows nursing calves—Average milking ability—First 3–4 months postpartum—10 lbs milk/day900 0.0 18.8 10.8 10.40f 57.3 0.55 NA 1.9g 9.9 0.28 0.22 331100 0.0 21.6 12.1 11.54f 56.0 0.54 NA 2.0g 9.4 0.27 0.22 381300 0.0 24.3 13.4 12.63f 55.1 0.52 NA 2.2g 9.1 0.27 0.22 43Cows nursing calves—superior milking ability—First 3–4 months postpartum—20 lb milk/day900 0.0 18.7 13.1 13.81f 69.8 0.74 NA 2.4g 12.9 0.41 0.28 331100 0.0 22.3 14.5 14.94f 65.2 0.67 NA 2.6g 11.9 0.38 0.27 401300 0.0 25.3 15.9 16.03f 62.6 0.64 NA 2.8g 11.2 0.36 0.26 45a Average weight for a feeding period.b Approximately 0.9 + 0.2 pound of weight gain/day over the last third of pregnancy is accounted for by the products of
conception. Daily 2.15 Mcal of NEm and 0.1 pound of protein are provided for this requirement for a calf with a birth weight of 80 pounds.
c Dry matter consumption should vary depending on the energy concentration of the diet and environmental conditions. These intakes are based on the energy concentration shown in the table and assuming a thermoneutral environment with-out snow or mud conditions. If the energy concentrations of the diet to be fed exceeds the tabular value, limit feeding may be required.
d Vitamin A requirements per pound of diet are 1,273 IU for pregnant heifers and cows and 1,773 for lactating cows and breeding bulls.
e Not applicable.f Includes 0.34 Mcal NEm/pound of milk produced.g Includes 0.03 pound protein/pound of milk produced.
1�
1�
Brand names appearing in this publication are for product identification purposes only. No endorsement is intended, nor is criticism implied of similar products not mentioned.
Publications from Kansas State University are available on the World Wide Web at: http://www.oznet.ksu.edu
Contents of this publication may be freely reproduced for educational purposes. All other rights reserved. In each case, credit Twig T. Marston, et al, Beef Cow Nutrition Guide, Kansas State University, April 1998.
Kansas State University Agricultural Experiment Station and Cooperative Extension ServiceC-735 April 1998
It is the policy of Kansas State University Agricultural Experiment Station and Cooperative Extension Service that all persons shall have equal opportunity and access to its educational programs, services, activities, and materials without regard to race, color, religion, national origin, sex, age or disability. Kansas State University is an equal opportunity organization. Issued in furtherance of Cooperative Extension Work, Acts of May 8 and June 30, 1914, as amended. Kansas State University, County Extension Councils, Extension Districts, and United States Department of Agriculture Cooperating, Marc A. Johnson, Director.