26
Configuration Guide for Informix Database Monitoring informix v4.1 series CA Nimsoft Monitor Snap

Configuration Guide for Informix Database Monitoring
informix v4.1 series
CA Nimsoft Monitor Snap

Legal Notices
This online help system (the "System") is for your informational purposes only and is subject to change or withdrawal by CA at any time.
This System may not be copied, transferred, reproduced, disclosed, modified or duplicated, in whole or in part, without the prior written consent of CA. This System is confidential and proprietary information of CA and protected by the copyright laws of the United States and international treaties. This System may not be disclosed by you or used for any purpose other than as may be permitted in a separate agreement between you and CA governing your use of the CA software to which the System relates (the “CA Software”). Such agreement is not modified in any way by the terms of this notice.
Notwithstanding the foregoing, if you are a licensed user of the CA Software you may make one copy of the System for internal use by you and your employees, provided that all CA copyright notices and legends are affixed to the reproduced copy.
The right to make a copy of the System is limited to the period during which the license for the CA Software remains in full force and effect. Should the license terminate for any reason, it shall be your responsibility to certify in writing to CA that all copies and partial copies of the System have been destroyed.
TO THE EXTENT PERMITTED BY APPLICABLE LAW, CA PROVIDES THIS SYSTEM “AS IS” WITHOUT WARRANTY OF ANY KIND, INCLUDING WITHOUT LIMITATION, ANY IMPLIED WARRANTIES OF MERCHANTABILITY, FITNESS FOR A PARTICULAR PURPOSE OR NONINFRINGEMENT. IN NO EVENT WILL CA BE LIABLE TO YOU OR ANY THIRD PARTY FOR ANY LOSS OR DAMAGE, DIRECT OR INDIRECT, FROM THE USE OF THIS SYSTEM, INCLUDING WITHOUT LIMITATION, LOST PROFITS, LOST INVESTMENT, BUSINESS INTERRUPTION, GOODWILL, OR LOST DATA, EVEN IF CA IS EXPRESSLY ADVISED IN ADVANCE OF THE POSSIBILITY OF SUCH LOSS OR DAMAGE.
The manufacturer of this System is CA.
Provided with “Restricted Rights.” Use, duplication or disclosure by the United States Government is subject to the restrictions set forth in FAR Sections 12.212, 52.227-14, and 52.227-19(c)(1) - (2) and DFARS Section 252.227-7014(b)(3), as applicable, or their successors.
Copyright © 2014 CA. All rights reserved. All trademarks, trade names, service marks, and logos referenced herein belong to their respective companies.
Legal information on third-party and public domain software used in the Nimsoft Monitor solution is documented in Nimsoft Monitor Third-Party Licenses and Terms of Use (http://docs.nimsoft.com/prodhelp/en_US/Library/Legal.html).

Contents 3
Contents
Chapter 1: Overview 5
About This Guide .......................................................................................................................................................... 6
Related Documentation ............................................................................................................................................... 6
Preconfiguration Requirements ................................................................................................................................... 7
Prerequisites ......................................................................................................................................................... 7
Supported Platforms ............................................................................................................................................. 7
informix Installation notes for Windows............................................................................................................... 8
Chapter 2: Configuration Details 9
informix Node ............................................................................................................................................................ 10
Checkpoints Node ............................................................................................................................................... 11
Configure A Node ....................................................................................................................................................... 18
Create Connection...................................................................................................................................................... 18
Add Profile Checkpoints ............................................................................................................................................. 18
Delete Connection ...................................................................................................................................................... 19
Add Profile .................................................................................................................................................................. 19
Delete Profile.............................................................................................................................................................. 19
Chapter 3: QoS Threshold Metrics 21
informix QoS Metrics ................................................................................................................................................. 21
informix Alert Metrics Default Settings ...................................................................................................................... 22
Checkpoints metrics ................................................................................................................................................... 24
Single counter description .................................................................................................................................. 25

4 Configuration Guide for Informix Database Monitoring
Documentation Changes
This table describes the version history for this document.
Version Date What's New?
4.1 March 2014 Documentation on the initial web-based GUI version of the Informix Database Monitoring probe. (Previous versions of this probe are configured using Infrastructure Manager).

Chapter 1: Overview 5
Chapter 1: Overview
The Informix Database Monitoring probe runs selected SQL queries to extract vital information about your Informix databases. The information is presented to the database administrator as alarms or as a report. The Informix Database Monitoring probe monitors the following information:
■ Connectivity to the database server
■ Uptime (in days) of the database server
■ Number of databases
■ Logging status of the databases
■ Number of active users
■ Databases for offline status
■ Database for recovering status
■ Database for redundancy
■ Database mirror is offline
■ Database mirror is recovering
■ Database free space (percent)
■ Database free space (MB)
■ Buffer cache hit ratio for reads
■ Buffer cache hit ratio for writes
■ Table extents
■ Table size (MB)
■ Number of attempts exceeding the maximum number of locks
■ Number of attempts exceeding the maximum number of threads
■ Number of failed attempts allocating entries in the transaction table
■ Number of times threads had to wait for a latch
■ Number of times threads had to wait for a buffer
■ Number of times sessions had to wait for a lock
■ Number of times threads had to wait for critical section checkpoints
■ Number of times potential deadlocks are detected and prevented
■ Number of times distributed deadlock timeout is exceeded while user is waiting for lock
■ Number of foreground writes

About This Guide
6 Configuration Guide for Informix Database Monitoring
■ Number of LRU writes
■ Number of chunk writes
■ Number of users waiting for locks
■ Users waiting for locks
■ Chunk I/O read statistics
■ Chunk I/O write statistics
■ Virtual cpu user time
■ Virtual cpu system time.
This section contains the following topics:
About This Guide (see page 6) Related Documentation (see page 6) Preconfiguration Requirements (see page 7)
About This Guide
This guide is for the CA Nimsoft Monitor Snap Administrator to help understand the configuration of the Informix Database Monitoring probe and provides the following information:
■ Overview of the Informix Database Monitoring probe and related documentation for previous probe versions.
■ Configuration details of the probe.
■ Field information and common procedures for configuring the probe.
Important! Description for the intuitive GUI fields is not included in the document.
Related Documentation
For related information, see the following material:
Related Documentation
The Release Notes for the informix probe (Informix Database Monitoring)

Preconfiguration Requirements
Chapter 1: Overview 7
Preconfiguration Requirements
This section contains the following preconfiguration requirements for the Informix Database Monitoring probe:
■ Software: Informix Connect 3.50, Informix Client SDK 3.50 (or higher) and Informix 9.x, 10.x, 11.5, 11.7
■ Platforms: Windows 32/64 bit
■ Hardware: Windows NT/2000/XP/2003/2008
Prerequisites
This section contains the prerequisites for the Informix Database Monitoring probe:
■ The Informix client or server is installed on the machine where SNAP is installed.
■ Navigate to Run > Services.msc and restart the Nimsoft Robot Watcher service.
Note: Restarting the Nimsoft Robot Watcher service is mandatory in case you have installed Informix client or serve after installing SNAP.
Important! Meeting the prerequisites is mandatory to configure the informix probe.
Supported Platforms
Refer to the Nimsoft Compatibility Support Matrix for the latest information on supported platforms. See also the Support Matrix for Nimsoft Probes for information on the informix probe.

Preconfiguration Requirements
8 Configuration Guide for Informix Database Monitoring
informix Installation notes for Windows
Informix Connect or the Client SDK (which contains Informix Connect too) must be installed before installing this probe. Refer the installation documentation for the Client SDK or Informix Connect for information on how to install the Client SDK.
Informix Connect or the Client SDK must be in the systems PATH environment variable.
Run the setnet32 application for Informix for setting up connectivity with the databases you wish to monitor. Do not check the Use my settings checkbox in setnet32. The following keys exist in the Windows Registry for the probe to be able to connect:
■ HKEY_LOCAL_MACHINE\Software\Informix\Environment\INFORMIXSERVER
■ HKEY_LOCAL_MACHINE\Software\Informix\Environment\INFORMIXDIR
■ HKEY_LOCAL_MACHINE\Software\Informix\SqlHosts\[one entry for each database]
Setnet32 creates these keys if the Use my settings checkbox is unchecked, otherwise they are created under HKEY_CURRENT_USER.
The dbping utility which is also a part of Informix Connect and the Client SDK allows you to test connections set up with setnet32. Verify a database connection definition by running this utility.
Note: Database definition names are case-sensitive. Check the definition in setnet32 or the Windows Registry before setting up a profile in the probe. The user configured in the connection parameters must have CONNECT privileges on the Informix database server. The target database selected for connection must be sysmaster for the predefined checkpoints to work.

Chapter 2: Configuration Details 9
Chapter 2: Configuration Details
The initial configuration of the Informix Database Monitoring probe is done by using the configuration tool (GUI), setting up one or more database instance profiles. The probe either runs locally on the database server, or it runs as a remote client.
This section contains the following topics:
informix Node (see page 10) Configure A Node (see page 18) Create Connection (see page 18) Add Profile Checkpoints (see page 18) Delete Connection (see page 19) Add Profile (see page 19) Delete Profile (see page 19)

informix Node
10 Configuration Guide for Informix Database Monitoring
informix Node
This node lets you view and configure the details of Informix Database Monitoring probe. You can also configure the log properties of the probe and list of alarm messages that are defined on the Informix Database Monitoring probe.
Navigation: informix
Set or modify the following values as required:
informix > Probe Information
This section provides information about the probe name, probe version, start time of the probe, and the vendor who created the probe.
informix > General Config
This section lets you configure the QoS and log properties of the Informix Database Monitoring probe.
■ Alarm Severity Filter: specifies a filter on severity level of an event for considering an event as an alarm.
■ Log Size: specifies the size of the log file that stores the internal messages of the probe.
■ Log Level: specifies the level of details that the probe log file saves.
■ QoS V2 Compatibility: generates suppression key in the alarm message.
Default: Not selected
informix > Message Pool
This section enables you to view the list of all the alarm messages available for the Informix Database Monitoring probe.

informix Node
Chapter 2: Configuration Details 11
Checkpoints Node
This node enables you to create a checkpoint defined for a number of profiles. For some of the checkpoints, defaults setting are applied.
Navigation: informix > Checkpoints
Set or modify the following values as required:
Checkpoints > Create New Checkpoint
This section lets you create a checkpoint with default settings or user-configurable settings.
■ Connection Name: specifies the connection that the profile monitors.
■ Query File: defines the file that stores the query.
■ Query: defines the query that the checkpoint reads.
■ Interval Modus: enables you to configure the interval value of the checkpoint.
Note: The interval value is the difference between the results of two queries.

informix Node
12 Configuration Guide for Informix Database Monitoring
<Checkpoint Name> Node
This node lets you configure the checkpoint properties such as message, objects, and monitoring conditions.
Note: This node is user-configurable and is called checkpoint name node in the document.
Navigation: informix > Checkpoints > checkpoint name
Set or modify the following values as required:
checkpoint name > General Config
This node lets you configure the properties of the checkpoint.
■ Check Point Name: specifies the available checkpoints name.
■ Active: activates the checkpoint.
■ Description: defines a short description of the checkpoint.
■ Condition: specifies how the information is transmitted.
■ Check Interval: specifies the default value of the check interval in the checkpoint.
■ Samples: specifies the number of samples used for calculating the average value.
Default: 1
■ Clear Severity: specifies the severity of the clear message.
■ Clear Message: specifies the clear message name.
■ Use Exclude/Use Include: adds the objects to the exclude/include list of some of the checkpoints.
■ Enable Exclude: specifies the checkpoint objects that you do not want to monitor.
■ Enable Include: specifies the checkpoint objects that you want to monitor.
■ Informix Timeout: specifies the threshold processing time of the checkpoint. If the processing time breaches the threshold, an alarm message is issued.
checkpoint name > Checkpoint Query Config
This section lets you view and configure the query properties that the checkpoint runs.
■ Connection Name: specifies the profile monitored connection.
■ Condition: defines the condition for evaluating thresholds.
■ Checked Value: retrieves the last measured value.
■ Query File: defines the file that stores the query.

informix Node
Chapter 2: Configuration Details 13
■ Query: defines the checkpoint read query.
■ Interval Modus: enables you to configure the interval value of the checkpoint.
Note: The interval value is the difference between the results of two queries.
checkpoint name > Row Identifier
This section lets you pick the rows as variables to set an alarm message and suppression key. If the query returns more than one row, the Informix Database Monitoring probe needs a unique identification for each row.
Note: This section appears only in custom checkpoints.
checkpoint name > Message Variable
This section lets you pick the columns as variables that are used in creating QoS.
■ Data Type: specifies the data type of the variable of the new alarm.
■ Column Use: specifies the column use of the variable.
Note: This section appears only in custom checkpoints.
checkpoint name > Exclude
This section lets you view and configure the value of the exclude pattern column.
checkpoint name > Include
This section lets you view and configure the value of the include pattern column.

informix Node
14 Configuration Guide for Informix Database Monitoring
Monitors Node
The Monitors node lets you add and delete the Quality of Service definitions from the Informix Database Monitoring probe.
Navigation: informix > Checkpoints > checkpoint name > Monitors
Set or modify the following values as required:
Monitors > Quality of Service
This section lets you configure the QoS for the MySQL probe.
■ Name: defines the QoS name for SQL checkpoint.
■ Metric: defines a measuring value of the SQL checkpoint.
■ Max value: defines the threshold value for SQL checkpoint.
Default: 1
Monitors > Threshold
This section lets you configure the threshold values for the MySQL probe.
■ Threshold object name: defines the monitoring object name.
■ Threshold value: defines the value used for the threshold evaluation.
■ Severity: specifies the alarm severity.
■ Message: specifies the message name used for threshold alarm.
■ Message text: defines the message text. If the message name changes, the text is updated at run time.

informix Node
Chapter 2: Configuration Details 15
Connection-<Connection Name> Node
This node lets you configure the values required in the initial setup of the connection by the Informix Database Monitoring probe.
Note: This node is user-configurable and is referred to as the Connection-connection name node in the document.
Navigation: Checkpoints > Connection-connection name
Set or modify the following values as required:
Connection-connection name > Connection Setup
This section lets you view the values required for the initial setup of the connection.
■ Name: defines the connection name.
■ User ID: provides user name for the SQL server or Windows authentication.
■ Host Name: defines the Informix Database Monitoring Server name/IP.
■ Protocol: defines the connection protocol.
■ Driver: defines the connection driver.
■ Service: defines the connection service name.
■ Server Name: defines the connection server name.
■ Database: defines the database name.
informix Node
16 Configuration Guide for Informix Database Monitoring
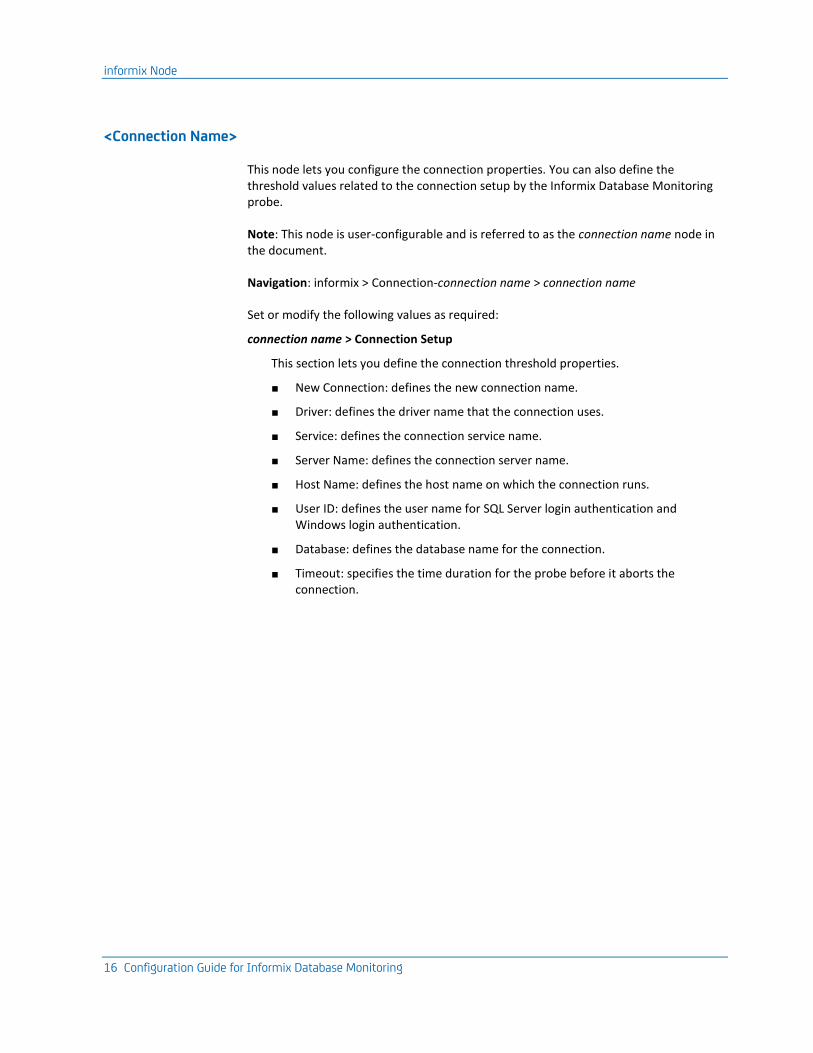
<Connection Name>
This node lets you configure the connection properties. You can also define the threshold values related to the connection setup by the Informix Database Monitoring probe.
Note: This node is user-configurable and is referred to as the connection name node in the document.
Navigation: informix > Connection-connection name > connection name
Set or modify the following values as required:
connection name > Connection Setup
This section lets you define the connection threshold properties.
■ New Connection: defines the new connection name.
■ Driver: defines the driver name that the connection uses.
■ Service: defines the connection service name.
■ Server Name: defines the connection server name.
■ Host Name: defines the host name on which the connection runs.
■ User ID: defines the user name for SQL Server login authentication and Windows login authentication.
■ Database: defines the database name for the connection.
■ Timeout: specifies the time duration for the probe before it aborts the connection.

informix Node
Chapter 2: Configuration Details 17
<Profile Name> Node
This node lets you define the properties of the profile which is created to monitor one instance of the connection. You can define different values for each profile related to each checkpoint.
Note: This node is user-configurable and is referred to as the profile name node in the document.
Navigation: informix > Connection-connection name > connection name > profile name
Set or modify the following values as required:
profile name > Profile
This section lets you configure the properties of the profile.
■ Active: activates the profile.
Default: Not Selected
■ Heartbeat: defines the interval at which all profile checkpoints schedules are tested and eventual checkpoint execution is triggered.
Default: 5
■ Connection: connection used in this profile.
■ Check interval: default value for the check interval in the profile.
Default: 5
■ Check Interval Unit: specifies the unit for the check interval.
■ Clear message: defines the message name for the timeout clear alarm.
■ Profile Timeout: specifies if the profile reaches the Profile timeout, the checkpoint processing is terminated.
Default: 15
■ Profile Timeout Message: specifies the message name used for threshold alarm.
■ Timeout severity: severity for timeout messages.
■ Informix Timeout: specifies the timeout set for breaking the connection with the server in case there is no activity.
■ Alarm Source: lets you override the source name of the alarm.
Configure A Node
18 Configuration Guide for Informix Database Monitoring
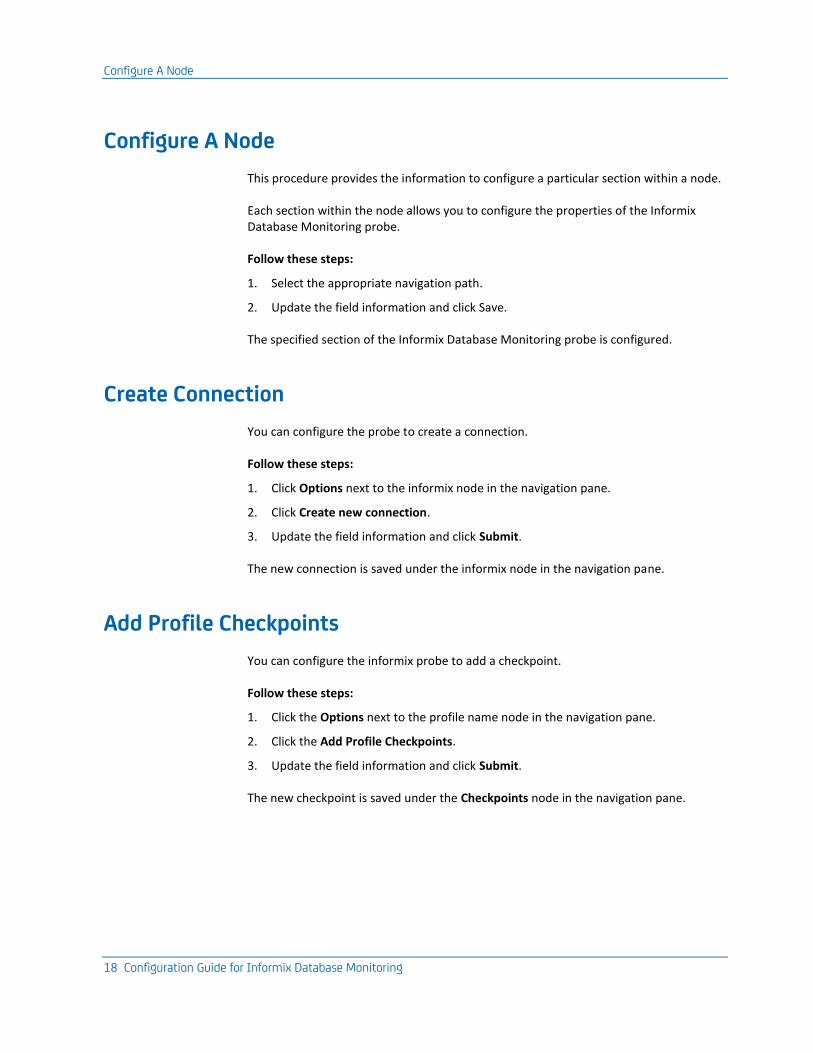
Configure A Node
This procedure provides the information to configure a particular section within a node.
Each section within the node allows you to configure the properties of the Informix Database Monitoring probe.
Follow these steps:
1. Select the appropriate navigation path.
2. Update the field information and click Save.
The specified section of the Informix Database Monitoring probe is configured.
Create Connection
You can configure the probe to create a connection.
Follow these steps:
1. Click Options next to the informix node in the navigation pane.
2. Click Create new connection.
3. Update the field information and click Submit.
The new connection is saved under the informix node in the navigation pane.
Add Profile Checkpoints
You can configure the informix probe to add a checkpoint.
Follow these steps:
1. Click the Options next to the profile name node in the navigation pane.
2. Click the Add Profile Checkpoints.
3. Update the field information and click Submit.
The new checkpoint is saved under the Checkpoints node in the navigation pane.

Delete Connection
Chapter 2: Configuration Details 19
Delete Connection
You can delete an existing connection when you no longer want the Informix Database Monitoring probe to monitor it.
Follow these steps:
1. Click the Options icon beside the Connection-connection name node that you want to delete.
2. Click the Delete connection option.
The connection is deleted.
Add Profile
You can configure the probe to create a profile.
Follow these steps:
1. Click the Options icon next to the Connection- connection name node in the navigation pane.
2. Click the Add profile option.
3. Update the field information and click Submit.
The new profile is saved under the connection name node in the navigation pane.
Delete Profile
You can delete an existing profile when you no longer want the Informix Database Monitoring probe to monitor it.
Follow these steps:
1. Click the Options icon beside the profile name node that you want to delete.
2. Click the Delete profile option.
The profile is deleted.

Chapter 3: QoS Threshold Metrics 21
Chapter 3: QoS Threshold Metrics
CA Nimsoft Monitor probes ship with default QoS threshold values set. The default threshold values provide an idea of the type of values to be entered in the fields and are not necessarily recommended best practice values. To aid in tuning thresholds and reducing false-positive alarms, this section describes the QoS metrics and provides the default QoS thresholds.
This section contains the following topics:
informix QoS Metrics (see page 21) informix Alert Metrics Default Settings (see page 22) Checkpoints metrics (see page 24)
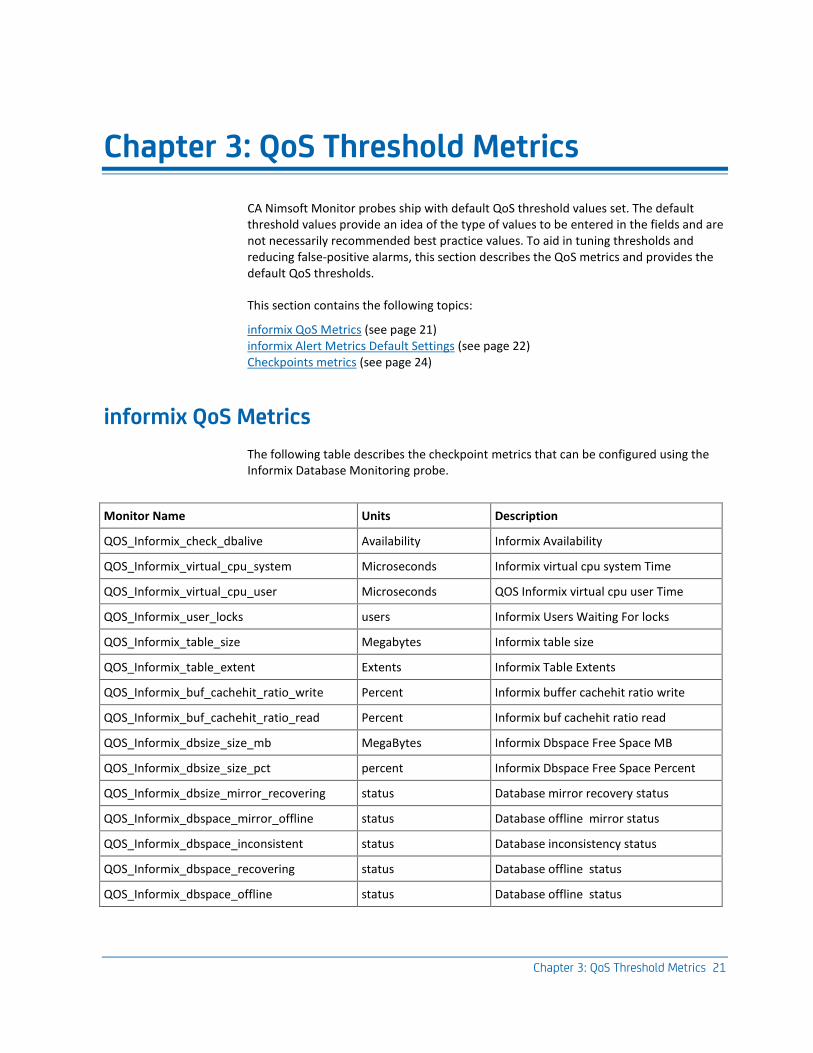
informix QoS Metrics
The following table describes the checkpoint metrics that can be configured using the Informix Database Monitoring probe.
Monitor Name Units Description
QOS_Informix_check_dbalive Availability Informix Availability
QOS_Informix_virtual_cpu_system Microseconds Informix virtual cpu system Time
QOS_Informix_virtual_cpu_user Microseconds QOS Informix virtual cpu user Time
QOS_Informix_user_locks users Informix Users Waiting For locks
QOS_Informix_table_size Megabytes Informix table size
QOS_Informix_table_extent Extents Informix Table Extents
QOS_Informix_buf_cachehit_ratio_write Percent Informix buffer cachehit ratio write
QOS_Informix_buf_cachehit_ratio_read Percent Informix buf cachehit ratio read
QOS_Informix_dbsize_size_mb MegaBytes Informix Dbspace Free Space MB
QOS_Informix_dbsize_size_pct percent Informix Dbspace Free Space Percent
QOS_Informix_dbsize_mirror_recovering status Database mirror recovery status
QOS_Informix_dbspace_mirror_offline status Database offline mirror status
QOS_Informix_dbspace_inconsistent status Database inconsistency status
QOS_Informix_dbspace_recovering status Database offline status
QOS_Informix_dbspace_offline status Database offline status

informix Alert Metrics Default Settings
22 Configuration Guide for Informix Database Monitoring
QOS_Informix_active_users Users Informix active users
QOS_Informix_logging_status count Logging status
QOS_Informix_database_count Databases Informix database count
QOS_Informix_server_startup uptime Database Server Uptime
QOS_INFORMIX_chunk_io_ write writes Informix Chunk I/O Writes
QOS_INFORMIX_chunk_io_ read Reads Informix Chunk I/O Writes
QOS_INFORMIX_chunk_io_writes ChunkWrites Informix Chunk Writes
QOS_INFORMIX_lru_writes LRUWrites Informix LRU Writes
QOS_INFORMIX_foreground_writes ForegroundWrites Informix Foreground Writes
QOS_INFORMIX_deadlock_timeout deadlocktimeout INFORMIX deadlock timeout
QOS_INFORMIX_deadlock_prevented deadlocksPrevented INFORMIX deadlock Prevented
QOS_INFORMIX_checkpoint_wait checkpointWaits INFORMIX checkpoint wait
QOS_INFORMIX_lock_wait LockWaits INFORMIX lock waits
QOS_INFORMIX_buffer_wait BufferWaits INFORMIX Buffer Waits
QOS_INFORMIX_latch_wait LatchWaits INFORMIX Latch Waits
QOS_INFORMIX_lock_thread Transactions Informix Transactions Overflow
QOS_INFORMIX_lock_user Threads Informix Thread Overflow
QOS_INFORMIX_lock_session Locks Informix Lock Overflow
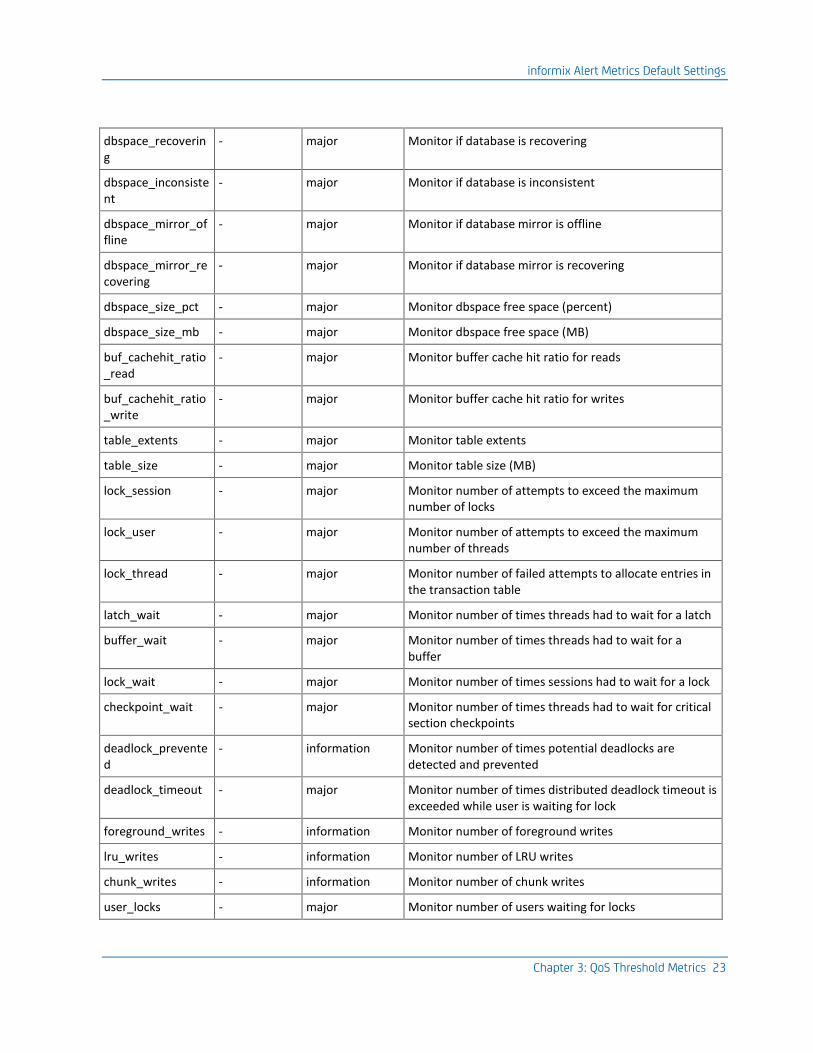
informix Alert Metrics Default Settings
The following table describes the default settings for the informix metrics:
Alert Metric Error Threshold
Error Severity Description
check_dbalive - Major Monitor connectivity to the database server
server_startup - information Monitor the uptime (in days) of the database server
database_count - information Monitor the number of databases
logging_status - information Monitor the logging status of the databases
active_users - information Monitor the number of active users
dbspace_offline - major Monitor databases for offline status
informix Alert Metrics Default Settings
Chapter 3: QoS Threshold Metrics 23
dbspace_recovering
- major Monitor if database is recovering
dbspace_inconsistent
- major Monitor if database is inconsistent
dbspace_mirror_offline
- major Monitor if database mirror is offline
dbspace_mirror_recovering
- major Monitor if database mirror is recovering
dbspace_size_pct - major Monitor dbspace free space (percent)
dbspace_size_mb - major Monitor dbspace free space (MB)
buf_cachehit_ratio_read
- major Monitor buffer cache hit ratio for reads
buf_cachehit_ratio_write
- major Monitor buffer cache hit ratio for writes
table_extents - major Monitor table extents
table_size - major Monitor table size (MB)
lock_session - major Monitor number of attempts to exceed the maximum number of locks
lock_user - major Monitor number of attempts to exceed the maximum number of threads
lock_thread - major Monitor number of failed attempts to allocate entries in the transaction table
latch_wait - major Monitor number of times threads had to wait for a latch
buffer_wait - major Monitor number of times threads had to wait for a buffer
lock_wait - major Monitor number of times sessions had to wait for a lock
checkpoint_wait - major Monitor number of times threads had to wait for critical section checkpoints
deadlock_prevented
- information Monitor number of times potential deadlocks are detected and prevented
deadlock_timeout - major Monitor number of times distributed deadlock timeout is exceeded while user is waiting for lock
foreground_writes - information Monitor number of foreground writes
lru_writes - information Monitor number of LRU writes
chunk_writes - information Monitor number of chunk writes
user_locks - major Monitor number of users waiting for locks

Checkpoints metrics
24 Configuration Guide for Informix Database Monitoring
user_lock_wait - information Monitor users waiting for locks
chunk_io_read - information Monitor chunk I/O read statistics
chunk_io_write - information Monitor chunk I/O write statistics
virtual_cpu_user - information Monitor virtual cpu user time
virtual_cpu_system - information Monitor virtual cpu system time
Checkpoints metrics
The following types of checkpoint metrics are available for the informix probe:
Count – absolute number of events in the interval. In the first interval, counts are not checked because their interval value cannot be calculated. If there is a "total" value in the message, it means "since the start of the server".
Count/sec – absolute number of events in the interval per second. Count/sec is calculated as the difference between count at the beginning of the interval and at the end. The result is then divided by length of the interval. In the first interval, counts are not checked because their interval value cannot be calculated. If there is a "total" value in the message, it means "since the start of the server".
Gauge – absolute number, describing the actual state of the system. If it describes size, it is measured in KB or MB, depending on actual size.
Ratio – calculated percentage, using interval counts. In the first interval, it is calculated from total counts (as the interval count cannot be calculated).
Status – absolute value.
Average – calculated using interval counts. At the beginning of the interval, it is calculated from absolute counts.

Checkpoints metrics
Chapter 3: QoS Threshold Metrics 25
Single counter description
The informix probe uses the following checkpoints:
■ active_users: checks for current the probe users.
■ buf_cachehit_ratio_read - ratio: Monitors buffer cache hit ratio for reads.
Calculated as (1 - (disk reads/buffer reads)) * 100.
■ buf_cachehit_ratio_write: Monitors buffer cache hit ratio for writes.
Calculated as (1 - (disk writes/buffer writes)) * 100.
■ buffer_wait: Monitors the number of times the threads had to wait for buffer.
■ check_dbalive: This checkpoint tries to connect to a server. When the connection is not established, an alert is generated. This checkpoint cannot be deactivated. In case there is an alert, check the server connectivity or if the server itself is running.
■ checkpoint_wait: Monitors the number of times the threads had to wait for critical section checkpoints.
■ chunk_io_read: Monitors the read statistics for input/output in the chunk.
■ chunk_io_write: Monitors the write statistics for input/output in the chunk.
■ chunk_writes: Monitors the number of chunk writes.
■ database_count: Monitors the number of databases.
■ dbspace_count: Monitors the count of database space.
■ dbspace_inconsistent: Monitors the database inconsistencies.
■ dbspace_mirror_offline: Monitors the database mirrors for offline status.
■ dbspace_mirror_recovering: Monitors the recovery status of the database mirrors.
■ dbspace_offline: Monitors the database for offline status.
■ dbspace_recovering: Monitors the database recovery.
■ dbspace_size_mb: Monitors free database space in MB.
■ dbspace_size_pct: Monitors free database space in percent.
■ deadlock_prevented: Monitors the number of times potential deadlocks are detected and are prevented.
■ deadlock_timeout: Monitors the number of times a distributed deadlock timeout is exceeded while the user is waiting for a lock release.
■ foreground_writes: Monitors the number of foreground writes.
■ latch_wait: Monitors the number of times a thread had to wait for a latch.
■ lock_session: Monitors the number of attempts for exceeding the maximum number of locks.
■ lock_thread: Monitors the number of failed attempts for allocating entries in the transaction table.

Checkpoints metrics
26 Configuration Guide for Informix Database Monitoring
■ lock_user: Monitors the number of user attempts for exceeding the maximum number of threads.
■ lock_wait: Monitors the number of times the sessions has to wait for a lock release.
■ logging_status: Monitors the logging status of the databases.
■ lru_writes: Monitors the number of LRU writes.
■ server_startup: Monitors the uptime of the database server (in days).
■ table_extents: Monitors the extent of the tables.
■ table_size - count: Measures the total table space size.
■ user_lock_wait: Monitors the number of users waiting for locks.
■ user_locks: provides a list of users holding a lock. The list helps in identifying users who are blocking other sessions (checkpoint locked_users). This checkpoint has default and count as threshold values. If the default threshold is set as 1, then the probe issues a message for every locked user with details about the user locking situation. If the default threshold is set greater than 1, then no message is issued. The count threshold defines the number of locked users as a threshold for this checkpoint.
■ virtual_cpu_system: Monitors virtual cpu system time.
■ virtual_cpu_usercheck_dbalive – status: Monitors virtual cpu user time.


