1 SELKIRK MOUNTAINS GRIZZLY BEAR RECOVERY AREA 2017 RESEARCH AND MONITORING PROGRESS REPORT PREPARED BY WAYNE F. KASWORM, THOMAS G. RADANDT, JUSTIN E. TEISBERG, ALEX WELANDER, WAYNE L. WAKKINEN, MICHAEL PROCTOR, AND HILARY COOLEY 2018 UNITED STATES FISH AND WILDLIFE SERVICE GRIZZLY BEAR RECOVERY COORDINATOR'S OFFICE UNIVERSITY OF MONTANA, MAIN HALL ROOM 309 MISSOULA, MONTANA 59812 (406) 243-4903
Transcript
1
SELKIRK MOUNTAINS GRIZZLY BEAR RECOVERY AREA 2017 RESEARCH
AND MONITORING PROGRESS REPORT
PREPARED BY WAYNE F. KASWORM, THOMAS G. RADANDT, JUSTIN E. TEISBERG, ALEX
WELANDER, WAYNE L. WAKKINEN, MICHAEL PROCTOR, AND HILARY COOLEY 2018 UNITED STATES FISH AND WILDLIFE SERVICE GRIZZLY BEAR RECOVERY COORDINATOR'S OFFICE UNIVERSITY OF MONTANA, MAIN HALL ROOM 309 MISSOULA, MONTANA 59812 (406) 243-4903
2
ABSTRACT
The U.S. Fish and Wildlife Service (USFWS) has been leading a grizzly bear monitoring and research program in the Selkirk Mountains Ecosystem (SE) since 2012. Key research and funding cooperators include Idaho Department of Fish and Game (IDFG), the Panhandle National Forest (USFS), Idaho Department of Lands, the Kalispel Tribe, the Kootenai Tribe of Idaho, and Washington Department of Fish and Wildlife. The British Columbia (BC) effort was led by Michael Proctor with key funding provided by BC Habitat Conservation Trust Fund and BC Fish and Wildlife Compensation Fund. Numbers of females with cubs in the SE varied from 1–6 per year and averaged 3.0 per year from 2012–17. Seven of 10 U.S. bear management units and the BC unit had sightings of females with young during 2012–17. Human-caused mortality averaged 1.8 bears per year (1.0 males and 0.8 females per year). Five females (all BC) and 6 males (two US and four BC) died due to human caused mortality during 2012–2017. Sex and age class and cause of mortality are as follows: four adult females (three under investigation and one management removal), three adult males (management removal, defense of life, and mistaken identity), one subadult female (management removal), and three subadult males (management removal, one mistaken identity, one train collision). Eighty-one instances of known and probable grizzly bear mortality were detected inside or within 16 km of the U.S. SE and the BC South Selkirk grizzly bear population unit during 1980–2017. This was the period of active research. Sixty-seven were human caused, 9 were natural mortality, and 5 were unknown cause. Fifty-two occurred in BC, 21 in Idaho, and 8 in Washington.
Remote cameras and corrals were deployed at 121 sites and checked for pictures and hair collection 183 times during 2017. Grizzly bears were detected by cameras at 30 sites. Genetic DNA results are not yet complete from collected hair at sites in 2017. Because of the lag time in lab analysis, we will report 2017 genetic results in the 2018 report. Females with cubs were detected at 8 corral sites (Blue-Grass Bear Management Unit [BMU], State Land BMU, and Myrtle BMU). In addition, we set up cameras at some rub sites and opportunistically along roadways and trails presumed to be on grizzly bear travel routes. This extended effort documented presence of a female grizzly bear with young in Ruby Creek and Trapper Creek, a female with cubs in Smith Creek (Long-Smith BMU), and several other single individuals. Additionally, 321 bear rub locations have been identified and installed since 2013. Hair samples were also collected from all captured individuals.
Fifty-six grizzly bears were trapped and radio collared for research purposes from 2007to 2017, the most recent period of active bear research in BC (2007–2016) and the U.S. (2012–2017). Sixteen of these occurred in the U.S. and 40 occurred in British Columbia. Home ranges were calculated and maps were displayed. Den entrance and exit dates were summarized.
This annual report is cumulative and represents data collected since the inception of this monitoring program. New information collected or made available to this study is incorporated, reanalyzed, and summarized annually. Information in this report supersedes previous reports. Please obtain permission prior to citation. Please cite this report as following: Kasworm, W. F., T. G. Radandt, J.E. Teisberg, A. Welander, W. Wakkinen, M. Proctor, and H. Cooley. 2018. Selkirk Mountains grizzly bear recovery area 2017 research and
monitoring progress report. U.S. Fish and Wildlife Service, Missoula, Montana. 46 pp.
3
TABLE OF CONTENTS PAGE ABSTRACT ................................................................................................................................ 2
TABLE OF CONTENTS ............................................................................................................ 3
Grizzly bear (Ursus arctos) populations south of Canada are currently listed as Threatened under the terms of the 1973 Endangered Species Act (16 U.S.C. 1531-1543). In 1993 a revised Recovery Plan for grizzly bears was adopted to aid the recovery of this species within ecosystems that they or their habitat occupy (USFWS 1993). Seven areas were identified in the Recovery Plan, one of which was the Selkirk Mountains Grizzly Bear Recovery Zone (SE) of northern Idaho, northeast Washington, and southeast British Columbia (BC) (Fig. 1). The recovery area includes the South Selkirks BC grizzly bear population unit and encompasses approximately 5,070 km2.
Surveys of sightings, sign, and mortality have been documented by Layser (1978) and Zager (1983). Idaho Department of Fish and Game (IDFG) captured and monitored a radio collared sample of grizzly bears in the SE from 1983 until 2002 to determine distribution, home ranges, cause specific mortality, reproductive rates, and population trend (Almack 1985, Wakkinen and Johnson 2004, Wakkinen and Kasworm 2004). This effort was suspended in 2003 due to funding constraints and management decisions. In cooperation with IDFG and the Panhandle National Forest (USFS) this effort was reinitiated during 2012 with personnel from the U.S. Fish and Wildlife Service (USFWS). During 2013, the program was expanded with funding from IDFG, USFS, several sources in BC, and USFWS. This cooperative research and monitoring effort was further expanded to involve Idaho Department of Lands, the Kalispel Tribe, the Kootenai Tribe of Idaho, and Washington Department of Fish and Wildlife in 2014. USFWS began a trapping and monitoring effort to collect and update known-fate population vital rates of radio-collared grizzly bears within the SE. In 2013–17, we also collected camera and
Figure 1. Grizzly bear recovery areas in the U.S., southern British Columbia, and Alberta, Canada.
5
hair samples at DNA hair corral, camera, and rub post locations, adding to similar efforts conducted by IDFG and USFS personnel.
OBJECTIVES 1. Document grizzly bear distribution in the SE. 2. Describe and monitor the grizzly bear population in terms of reproductive success, age
structure, mortality causes, population trend, and population estimates and monitor the targets for recovery as described in the grizzly bear recovery plan (USFWS 1993).
3. Determine habitat use and movement patterns of grizzly bears. Determine habitat preference by season and assess the relationship between habitats affected by man such as logged areas and grizzly bear habitat use. Evaluate permeability of the Kootenai River valley between the SE and adjacent grizzly bear populations.
4. Determine the relationship between human activity and grizzly bear habitat use through the identification of areas used more or less than expected in relation to ongoing timber management activities, open and closed roads, and human residences.
5. Identify mortality sources and management techniques to limit human-caused mortality of grizzly bears.
STUDY AREA
The SE encompasses 5,700 km2 of the Selkirk Mountains of northeastern Washington, northern Idaho, and southern British Columbia (BC). (Figure 2). Approximately 53% lies in the U.S. with the remainder in BC. Land ownership in BC is approximately 65% crown (public) land and 35% private. Land ownership in the U.S. portion is about 80% federal, 15% state, and 5% private.
Elevation on the study area ranges from 540 to 2,375 m. Weather patterns are characterized as Pacific maritime-continental climate, with long winters and short summers. Most of the precipitation falls during winter as snow, with a second peak in spring rainfall.
SE vegetation is dominated by various forested types. Dominant tree species include subalpine fir (Abies lasiocarpa), Englemann spruce (Picea engelmannii), western red cedar (Thuja plicata), and western hemlock (Tsuga heterophylla). Major shrub species include alder (Alnus spp.), fool's huckleberry (Menziesia ferruginea), mountain ash (Sorbus scopulina), and
huckleberry (Vaccinium spp.). Historically, wildfire was the primary disturbance factor in the SE. The 1967 Trapper
Peak (6,000 ha) and Sundance (9,000 ha) fires produced large seral huckleberry shrubfields. Timber management and recreation are currently the principal land uses.
METHODS Grizzly Bear Observations All grizzly bear observations and reports of sign (tracks, digs, etc.) by study personnel and the public were recorded. Grizzly bear sighting forms were sent to a variety of field personnel from different agencies to maximize the number of reports received. Sightings of grizzly bears were rated 1–5 with 5 being the best quality and 1 being the poorest. General definitions of these categories are presented below, but it was difficult to describe all circumstances under which sightings were reported. Only sightings receiving ratings of 4 or 5 were judged credible and used in reports. Sightings that rate 1 or 2 may not always be recorded in the database. 5 - Highest quality reports typically from study personnel or highly qualified observers. Sightings not obtained by highly qualified observers must have physical evidence such as pictures, track measurements, hair, or sightings of marked bears where marks are accurately described. 4 - Good quality reports that provide credible, convincing descriptions of grizzly bears or their sign. Typically these reports include a physical description of the animal mentioning several characteristics. Observer had sufficient time and was close enough or had binoculars to aid identification. Observer demonstrates sufficient knowledge of characteristics to be regarded as a credible observer. Background or experience of observer may influence credibility. 3 - Moderate quality reports that do not provide convincing descriptions of grizzly bears. Reports may mention 1 or 2 characteristics, but the observer does not demonstrate sufficient knowledge of characteristics to make a reliable identification. Observer may have gotten a quick glimpse of the bear or been too far away for a good quality observation. 2 - Lower quality observations that provide little description of the bear other than the observer’s judgment that it was a grizzly bear. 1 - Lowest quality observations of animals that may not have been grizzly bears. This category may also involve second hand reports from other than the observer. Capture and Marking Capture and handling of bears followed an approved Animal Use Protocol through the University of Montana, Missoula, MT (061-14CSCFC111714). Capture of black bears and grizzly bears was performed under Idaho and Washington state collection permits (ID 140226 and WA 14-082a) and a federal permit (TE704930-0). Bears were captured with leg-hold snares following the techniques described by Johnson and Pelton (1980) and Jonkel (1993). Snares were manufactured in house following the Aldrich Snare Co. (Clallam Bay, WA) design and consist of 6.5 mm braided steel aircraft cable. All bears were immobilized with Telazol (tiletamine hydrochloride and zolazepam hydrochloride), a mixture of Ketaset (ketamine hydrochloride) and Rompun (xylazine hydrochloride), or a combination of Telazol and Rompun. Yohimbine and Atipamezole were the primary antagonists for Rompun. Drugs were administered intramuscularly with a syringe mounted on a pole (jab-stick), homemade blowgun,
7
modified air pistol, or cartridge powered dart gun. Immobilized bears were measured, weighed, and a first premolar tooth was extracted for age determination (Stoneberg and Jonkel 1966). Blood, tissue and/or hair samples were taken from most bears for genetic and food use studies. Immobilized bears were given oxygen at a rate of 2–3 liters per minute. Recovering bears were dosed with Atropine and Diazepam. All grizzly bears were fitted with radio collars or ear tag transmitters when captured. Some bears were collared with Global Positioning System (GPS) radio collars. Collars were manufactured by Telonics (Mesa, AZ). To prevent permanent attachment, a canvas spacer was placed in the collars so that they would drop off in 1–3 years (Hellgren et al. 1988). Trapping efforts were typically conducted from May through August. Trap sites were usually located within 500 m of an open road to allow vehicle access. In a few instances trap sites were accessed behind restricted roads within the administrative motorized access provisions of the land management agency. Further, some remote trap sites were accessed with pack livestock. Traps were checked daily or in some cases twice daily. Bait consisted primarily of road-killed ungulates and a liquid lure composed of fish and livestock blood. Hair Sampling for DNA Analysis
Genetic information from hair-snagging with remote-camera photo verification allows us to document the number of individual grizzly bears occupying the study area and understand the level of relatedness within this population and between this and adjacent populations. Project objectives include: observations of females with young, sex ratio of sampled bears, and relatedness as well as genetic diversity measures of captured bears and source population and assessment of movement or gene flow in and out of the population. Sampling occurred from May–September in the SE following standard hair snagging techniques with barbed wire hair corrals (Woods et al. 1999). Sampling sites were established based on location of previous sightings, sign, habitat quality, and radio telemetry from bears. Sites were baited with 2 liters of a blood and fish mixture to attract bears across a barbwire perimeter placed to snag hair. Sites were deployed for 2–3 weeks prior to hair collection. Hair sampling also occurred at sites where personnel observed bear hair and “rubbing” on a tree, artificial sign post, or similar object. When observed, personnel formally established these sites by attaching barbed wire at the spot of rubbing and designating the location with a unique site number. Crews then subsequently revisited these locations to collect bear hair. Hair was collected and labeled to indicate: number and color of hairs collected, site location, date, and barb number. Samples collected 1) as part of this formal hair sampling effort, 2) from captured and handled bears, and 3) opportunistically (i.e., not from established sampling sites, such as tree staubs along trail, within identified daybeds, etc.) were sent to Wildlife Genetics International Laboratory in Nelson, British Columbia for DNA extraction and genotyping. Only samples from known grizzly bears or that outwardly appeared to be grizzly bear were sent to the lab. Hairs visually identified as black bear hair by technicians on our project or at the Laboratory were not processed and hairs processed and determined to be black bear were not genotyped. Dr. Michael Proctor (Birchdale Ecological Consulting) is a cooperator on this project and assisted with genetic interpretations. Radio Monitoring Attempts were made to obtain aerial radiolocations on all instrumented grizzly bears at least once each week during the 7–8 month period in which they were not in dens. Global Positioning System (GPS) collars were programmed to attempt locations every 1–2 hours depending on configuration, and data were stored within the collar and then downloaded to a lap top computer in an aircraft (Telonics Inc., Mesa AZ). Beginning in 2016, we have been using iridium collars on select males to enable remote download. All collars were equipped with
8
a release mechanism to allow them to drop off and be retrieved in October prior to denning. Weekly aircraft radio monitoring was conducted to check for mortality signals and approximate location. Life home ranges (minimum convex polygons; Hayne 1959) were calculated for grizzly bears during the study period. We generated home range polygons using ArcGIS. Isotope Analysis
Hair samples from known age, captured grizzly bears were collected and analyzed for stable isotopic ratios. Stable isotope signatures indicate source of assimilated (i.e., digested) diet of grizzly bears. Nitrogen stable isotope ratios (15N) indicate trophic level of the animal; an increased amount of ingested animal matter yields higher nitrogen isotope ratios while lower values tie to more plant-based diets. In the Selkirk Mountains, carbon isotope signatures vary depending on the amount of native C3 vs. C4 plant matter ingested. Corn, a C4 plant, has elevated 13C/12C ratios relative to native C3 plants. Because much of the human food stream is composed of corn, carbon stable isotope signatures allow for verification or identification of human food conditioned bears.
Hair samples were rinsed with a 2:1 chloroform:methanol solution to remove surface contaminants. Samples were then ground in a ball mill to homogenize the sample. Powdered hair was weighed and sealed in tin boats. Isotope ratios of δ13C and δ15N were assessed by continuous flow methods using an elemental analyzer (ECS 4010, Costech Analytical, Valencia, California) and a mass spectrometer (Delta PlusXP, Thermofinnigan, Bremen, Germany) (Brenna et al. 1997, Qi et al. 2003). Berry Production Quantitative comparisons of annual fluctuations and site-specific influences on fruit production of huckleberry were made using methods similar to those established in Glacier National Park (Kendall 1986). Transect line origins were marked by a painted tree or by surveyors’ ribbon. A specific azimuth was followed from the origin through homogenous habitat. At 0.5 m intervals, a 0.04 m2 frame (2 x 2 decimeter) was placed on the ground or held over shrubs and all fruits and pedicels within the perimeter of the frame were counted. If no portion of a plant was intercepted, the frame was advanced at 0.5 meter intervals and empty frames were counted. Fifty frames containing the desired species were counted on each transect. Timbered shrub fields and mixed shrub cutting units were the primary sampling areas to examine the influence of timber harvesting on berry production within a variety of aspects and elevations. Berry phenology, berry size, and plant condition were recorded. Monitoring goals identified annual trend of berry production and did not include documenting forest succession. Temperature and relative humidity data recorders (LogTag®, Auckland, New Zealand) were placed at berry monitoring sites. These devices record conditions at 90 minute intervals and will be retrieved, downloaded, and replaced at annual intervals. We used a berries/plot calculation as an index of berry productivity. Transects were treated as the independent observation unit. For each year observed, mean numbers of berries/plant (berries/plot) were used as our transect productivity indices. RESULTS AND DISCUSSION Grizzly Bear Observations, Mortality, and Recovery Plan Criteria Eighty-one reported sightings rated 4 or 5 (most credible) during 2017 (Table 1). Sightings occurred in all Bear Management Units (BMUs) except Kalispel-Granite and Lakeshore. Five known mortalities occurred during 2017 (Table 2).
9
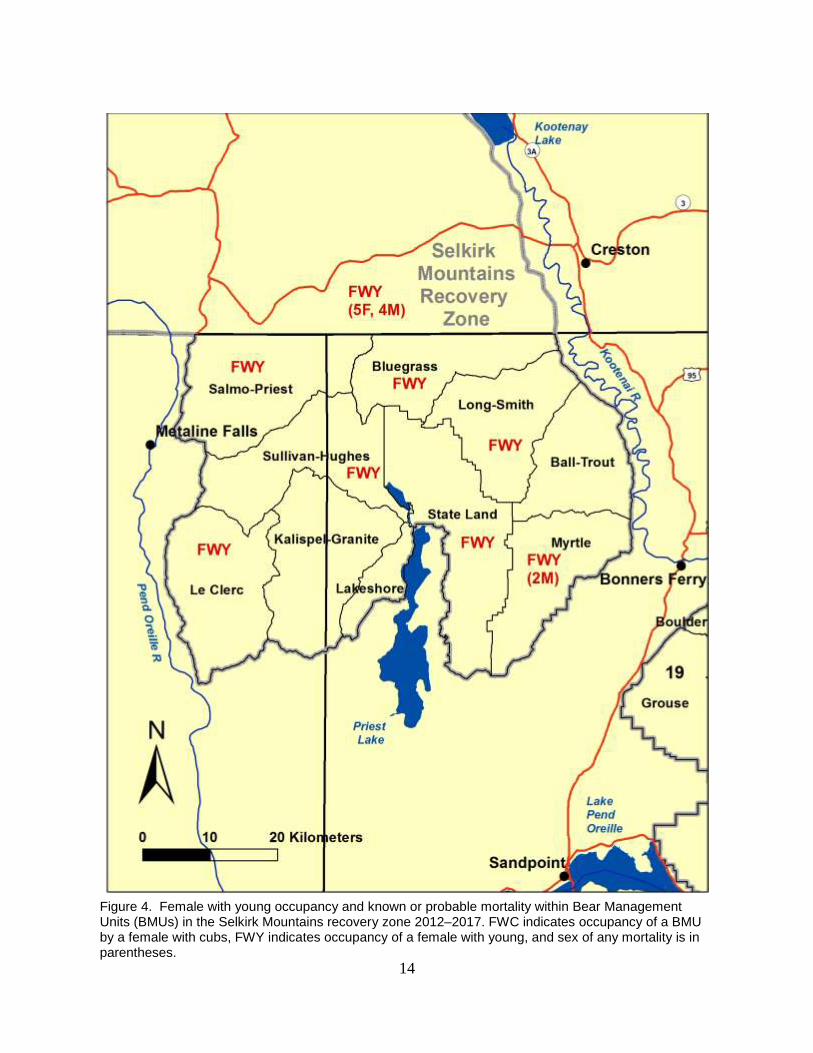
Recovery Target 1: 6 females with cubs over a running 6-year average both inside the recovery zone and within a 10 mile area immediately surrounding the recovery zone. Cubs are offspring in the first 12 months of life and yearlings are offspring in their second 12 months. The recovery plan (USFWS 1993) indicates that female with cub sightings within 10 miles of the recovery zone count toward recovery goals. Twelve credible sightings of a female with cubs occurred during 2017 in Blue-Grass, Long-Smith, Myrtle, State Lands, Pack River, and BC BMUs or Bears Outside Recovery Zone (BORZ) units (Tables 2, 3, 4, 5 and Fig. 4). There appeared to be 6 unduplicated females with cubs in the recovery area during 2017. Fourteen credible sightings of a female with yearlings or 2-year-olds occurred in Blue-Grass, LeClerc, Long-Smith, State Lands, Sullivan-Hughes, Pack River, and BC BMUs in 2017. Unduplicated sightings of females with cubs (including Canada) varied from 1–6 per year and averaged 3.0 per year from 2012–17 (Tables 3, 4). Recovery plan targets require a running 6 year average of 6.0 females with cubs per year and therefore this target has not been met. Recovery Criteria 2: 7 of 10 BMU’s occupied by females with young from a running 6-year sum of verified evidence. Seven of 10 BMUs in the U.S. portion of the recovery zone and the BC BMU had sightings of females with young (cubs, yearlings, or 2-year-olds) during 2012–17 (Fig. 4 and Table 5). Occupied U.S. BMUs were: Blue-Grass, LeClerc, Long-Smith, Myrtle, Salmo-Priest, State Lands, and Sullivan-Hughes BMUs. Recovery plan criteria indicate the need for 7 of 10 U.S. BMUs to be occupied. Recovery Criteria 3: The running 6-year average of known, human-caused mortality should not exceed 4 percent of the population estimate based on the most recent 3-year sum of females with cubs. No more than 30 percent shall be females. These mortality limits cannot be exceeded during any 2 consecutive years for recovery to be achieved. Eighty-one instances of grizzly bear mortality were detected inside or within 16 km of the U.S. portion of the SE and within the boundary of the BC South Selkirk grizzly bear population unit during 1980–2017 (Table 2, Fig. 3). Five known mortalities occurred during 2017. A female with 2 cubs were removed from the Creston, BC landfill in a management action, an adult male was killed in a defense of life incident in Porthill Creek in BC and an adult male was killed in a case of mistaken identity by a black bear hunter in McCormick Creek, ID. Eleven known or probable human caused mortalities of grizzly bears occurred in or within 10 miles of the SE in the U.S. or in the South Selkirk GBPU during 2012–17, including 5 females (all BC) and 6 males (Myrtle and BC BMUs) (Table 1). These mortalities included four adult females (three under investigation and one management removal), three adult males (management removal, defense of life, and mistaken identity), one subadult female (management removal), and three subadult males (management removal, one mistaken identity, one train collision). We estimated minimum population size by dividing observed females with cubs (13), minus any human-caused adult female mortality (1) from 2015–17, by 0.6 (sightability correction factor as specified in the recovery plan) then dividing by 0.333 (adult female proportion of population as specified in the recovery plan) (Tables 3, 4) (USFWS 1993). This resulted in a minimum population of 61 individuals. The recovery plan states; “any attempt to use this parameter to indicate trends or precise population size would be an invalid use of these data”. Applying the 4% mortality limit to the minimum calculated population resulted in a total mortality limit of 2.4 bears per year. The female limit is 0.7 females per year (30% of 1.6). Average annual human caused mortality for 2012–17 was 1.8 bears/year and 0.8 females/year. These mortality levels for total bears were less than the calculated limits and female mortality exceeded the calculated limit during 2012–17. The recovery plan established a goal of zero human-caused mortality for this recovery zone due to the initial low number of bears; however it
10
also stated “In reality, this goal may not be realized because human bear conflicts are likely to occur at some level within the ecosystem.” All tables and calculations are updated when new information becomes available. Table 1. Credible grizzly bear sightings, credible female with young sightings, and known human caused mortality by Selkirk Mountain bear management unit (BMU) or area, 2017.
BMU OR AREA
2017 Credible
1
Grizzly Bear Sightings
2017 Sightings of Females with Cubs (Total)
2017 Sightings of Females with Cubs (Unduplicated
2)
2017 Sightings of Females with Yearlings or 2-year-olds (Total)
2017 Sightings of Females with Yearlings or 2 year-olds (Unduplicated
2)
2017 Human Caused Mortality
Ball-Trout 1 0 0 0 0 0
Blue Grass 31 2 1 6 1 0
Kalsipel-Granite 0 0 0 0 0 0
Lakeshore 0 0 0 0 0 0
LeClerc 7 0 0 1 1 0
Long-Smith 16 1 0 3 1 0
Myrtle 4 1 0 0 0 1
Salmo-Priest 1 0 0 0 0 0
State Idaho 7 4 2 1 0 0
Sullivan-Hughes 2 0 0 1 1 0
Pack River 9 3 2 1 1 0
Priest River 1 0 0 0 0 0
BC 2 1 1 1 0 4
TOTAL 81 12 6 14 5 5 1Credible sightings are those rated 4 or 5 on a 5 point scale (see methods).
2Sightings may duplicate the same animal in different locations. Only the first sighting of a duplicated female with
cubs is counted toward total females (Table 3), however subsequent sighting contribute toward occupancy (Table 5).
Table 2. Known and probable grizzly bear mortality in the Selkirk Mountains recovery area, 1980–2016.
Mortality Date Tag Number Sex Age Mortality Cause Location
<500m from open road Owner1
11-May-80 None F 5.0 Human, Hunting Barrett Creek, BC Unk BC
2-May-82 None M AD Human, Poaching Priest River, ID Yes USFS
Sept 1982 None U Unk Human, Undetermined LeClerc Creek, WA Yes USFS
1-Jul-85 949 M 4.5 Human, Undetermined NF Granite Creek, WA Yes USFS
Autumn, 1985 867-85a U Cub Natural Cow Creek, ID Unk USFS
1-Sep-86 898 F 1.5 Human, Undetermined Grass Creek, ID Unk USFS
10-Sep-86 None M 7.0 Human, Management Curtis Lake, BC Yes BC
June 1987 1005 M 10.5 Human, Poaching Wall Mtn, BC Unk BC
8-Sep-87 962 M 7.5 Human, Poaching Trapper Creek, ID No IDL
30-May-88 None M 5.0 Human, Hunting Monk Creek, BC Unk BC
Sept 1988 1050 M 1.5 Natural Porcupine Creek, BC No BC
Sept 1988 1085 F 3.5 Human, Mistaken Identity Cow Creek, ID No USFS
14-Aug-89 1044 F 20+ Natural Laib Creek, BC No Private
22-Sep-89 None M 2.0 Human, Management 49 Mile Creek, BC Yes Private
22-Sep-89 None U Unk Human, Management 49 Mile Creek, BC Yes Private
6-Aug-90 None M Unk Human, Management Ymir Area, BC Yes Private
16-Sep-90 1042 F 3.5 Human, poaching Maryland Creek, BC Yes BC
1-Aug-91 1076 F 20+ Natural Next Creek, BC No BC
23-Apr-91 867-92a U 1.5 Natural Trapper Creek, ID Unk IDL
11-Apr-92 None M Unk Unknown Atbara, BC Yes BC
22-May-92 None M 4.0 Human, Hunting Cottonwood, BC Unk BC
July 1992 None M Unk Human, Management Lost Creek, BC Yes BC
7-Sep-92 1090 M 5.5 Unknown Laib Creek, BC Yes BC
11
Mortality Date Tag Number Sex Age Mortality Cause Location
<500m from open road Owner1
25-Sep-92 1015 F 12.5 Human, Self Defense Monk Creek, BC No BC
2-Jun-93 None M 4.0 Human, Management Lost Creek, BC Yes BC
5-Jun-93 None M 4.0 Human, Hunting Elmo Creek, BC Unk BC
2-Nov-93 867 F 15.5 Human, Poaching Willow Creek, WA No USFS
2-Nov-93 867-93a U 0.5 Human, Poaching Willow Creek, WA No USFS
2-Nov-93 867-93b U 0.5 Human, Poaching Willow Creek, WA No USFS
23-May-94 None M 12.0 Human, Hunting Wall Mountain, BC Unk BC
10-May-95 None F 1.5 Human, Undetermined Boundary Creek, ID Yes USFS
31-Oct-95 1100 M 2.5 Human, Mistaken Identity Granite Pass, WA Yes USFS
Autumn, 1995 None M AD Human, Mistaken Identity Mill Creek, WA2 Yes USFS
Autumn, 1996 1027-96b U Cub Natural Cedar Creek, ID Unk USFS
10-Oct-1996 1022 M 2.5 Human, Management Boswell, BC Yes Private
Sept 1997 None M 1.5 Human, Management Salmo, BC Yes Private
29-May-98 1023 M 4.5 Human, Hunting Findlay Creek, BC2 Yes BC
Aug 1998 None M 3.5 Human, Undetermined Usk, WA Yes Private
Oct 1999 1032 M 18.0 Human, Management Procter, BC Yes Private
Oct 1999 9810 M 10.0 Human, Undetermined Smith Creek, ID Unk USFS
Autumn 2000 None U Unk Unknown Hughes Meadows, ID Yes USFS
29-Aug-01 7 F 13.0 Natural Porcupine Creek, BC Yes BC
25-Oct-01 None F 2.0 Human, Management 49 Mile Creek, BC Yes Private
Oct 2001 None M Unk Human, Management Cottonwood Creek, BC Yes Private
12-May-02 17 M 6.0 Human, Management Nelway, BC Yes Private
15-Sep-02 None F 10+ Human, Management Blewett, BC Yes Private
15-Sep-02 None U 0.5 Human, Management Blewett, BC Yes Private
15-Sep-02 None U 0.5 Human, Management Blewett, BC Yes Private
15-Sep-02 None U 0.5 Human, Management Blewett, BC Yes Private
4-Oct-02 19 M 3.5 Human, Undetermined Lamb Creek, ID Yes USFS
May 2003 None U 1.5 Human, Mistaken Identity Smith Creek, ID Yes Private
2-Sep-03 None F AD Human, Management Blewett, BC Yes Private
23-Sep-03 None F 5.0 Human, Management Blewett, BC Yes Private
23-Sep-03 None F 0.5 Human, Management Blewett, BC Yes Private
3-Oct-03 30 F 2.5 Human, Management Erie Creek, BC Yes Private
May 2004 None M AD Human, Undetermined Hughes Meadows, ID Yes USFS
Autumn 2004 32 M 7.0 Human, Undetermined Bismark Meadows, ID Unk Private
Spring 2005 None U Unk Human, Undetermined E F Priest River, ID Unk IDL
10-May-2005 31 M 6 Human, Hunting Russell Creek, BC2 Yes BC
May 2006 None M AD Human, Management Procter, BC Yes Private
23-Oct-06 None F 1.0 Human, Management Blewett Ski Hill, BC Yes Private
23-Oct-06 None M 1.0 Human, Management Blewett Ski Hill, BC Yes Private
1-Aug-07 29 F AD Vehicle Collision Kootenay Pass, BC Yes BC
1-Oct-07 1000 F AD Human, Mistaken Identity Pass Creek Pass, WA Yes USFS
4-Oct-07 5393 M SA Human, Management Priest River, ID Yes Private
29-Sep-08 119 M 13.0 Human, Management Salmo, BC Yes Private
18-Aug-10 8005 F 5 Vehicle Collision Summit Creek, BC Yes BC
5-May-11 None M 2.5 Human, Management Porthill, ID Yes Private
25-May-11 0012 M 2.5 Human, Management Nelson, BC Yes Private
25-May-11 None M 2.5 Human, Management Nelson, BC Yes Private
28-Aug-2011 002 M 20 Human, Management Kootenay River, BC Yes Private
7-Oct-12 None M 3.0 Human, Mistaken Identity Beaverdale Creek, BC Yes BC
16-Oct-12 170 F 6.0 Human, Under investigation Salmo River, BC Yes Private
6-Jun-14 12006 F 5.0 Human, Under investigation Boundary Creek, BC Yes BC
27-Sep-14 None F AD? Human, Under investigation Ootishenia Creek, BC Unk BC
Summer 2014 3023a U Cub Natural Malcolm Creek, ID Unk USFS
Summer 2014 3023a U Cub Natural Malcolm Creek, ID Unk USFS
7-May-15 None M AD Vehicle Collision Summit Creek, BC Yes BC
11-Oct-2015 1001 M 4 Human, Undetermined Grouse Creek, ID2 Yes Private
12
Mortality Date Tag Number Sex Age Mortality Cause Location
<500m from open road Owner1
27-Aug-16 None M 2.5? Train Collision Deep Creek, ID Yes Private
25-Jun-17 226 F 10 Human, Management Kootenay River, BC Yes BC 25-Jun-17 None M 0.5 Human, Management Kootenay River, BC Yes BC 25-Jun-17 None F 0.5 Human, Management Kootenay River, BC Yes BC
1-Sep-17 922 M 5 Human, Self Defense Porthill Creek, BC Yes BC
4-Oct-17 None M AD Human, Mistaken Identity McCormick Creek, ID No IUSFS 1BC – British Columbia Crown Lands, IDL – Idaho Department of Lands, and USFS – U.S. Forest Service. 2More than 10 miles outside recovery zone in the U.S.
Figure 3. Grizzly bear known or probable mortalities from all causes (1980–2017) in the Selkirk Mountains recovery area.
13
Table 3. Status of the Selkirk Mountains recovery zone during 2012–2017 in relation to the demographic recovery targets from the grizzly bear recovery plan (USFWS 1993).
Recovery Criteria Target 2017
Females w/cubs (6-yr avg) 6 3.0 (18/6)
Human Caused Mortality limit 1
(4% of minimum population estimate) 2.4 1.8 (6 yr avg)
Female Human Caused mortality limit 1 (30% of total mortality) 0.7 0.8 (6 yr avg)
Distribution of females w/young in the most recent 6 years 2 7 of 10 BMUs 7 of 10 BMUs
1 Includes both U.S. and B.C. mortalities.
2 Includes only U.S. BMUs. B.C. BMUs are not yet drawn.
Table 4. Annual Selkirk Mountains recovery zone grizzly bear unduplicated counts of females with cubs (FWC’s) and known human-caused mortality, 1988–2017. The grizzly bear recovery plan (USFWS 1993) states that the goal for human caused mortality shall be zero.
YEAR ANNUAL FWC'S
ANNUAL HUMAN CAUSED ADULT FEMALE MORTALITY
ANNUAL HUMAN CAUSED ALL FEMALE MORTALITY
ANNUAL HUMAN CAUSED TOTAL MORTALITY
4% TOTAL HUMAN CAUSED MORTALITY LIMIT
1
30% ALL FEMALE HUMAN CAUSED MORTALITY LIMIT
1
TOTAL HUMAN CAUSED MORTALITY 6 YEAR AVERAGE
FEMALE HUMAN CAUSED MORTALITY 6 YEAR AVERAGE
1988 0 0 1 2
1989 4 0 0 2
1990 1 0 1 2
1991 1 0 0 0
1992 1 1 1 3
1993 1 1 2 5 0.0 0.0 0.8 0.3
1994 1 0 0 1 0.2 0.1 0.2 0.0
1995 1 0 1 3 0.2 0.1 0.5 0.2
1996 1 0 0 0 0.4 0.1 0.5 0.2
1997 1 0 0 1 0.6 0.2 0.7 0.2
1998 1 0 0 1 0.6 0.2 0.8 0.2
1999 1 0 0 2 0.6 0.2 1.2 0.2
2000 2 0 0 0 0.8 0.2 1.2 0.2
2001 2 0 1 2 1.0 0.3 1.0 0.2
2002 0 1 3 6 0.6 0.2 2.0 0.7
2003 1 2 4 5 0.0 0.0 2.7 1.3
2004 1 0 0 2 -0.2 -0.1 2.8 1.3
2005 1 0 0 1 0.2 0.1 2.7 1.3
2006 0 0 1 3 0.4 0.1 3.2 1.5
2007 0 2 2 3 -0.2 -0.1 3.3 1.7
2008 0 0 0 1 -0.4 -0.1 2.5 1.2
2009 0 0 0 0 -0.4 -0.1 1.7 0.5
2010 0 1 1 1 -0.2 -0.1 1.5 0.7
2011 0 0 0 4 -0.2 -0.1 2.0 0.7
2012 1 1 1 2 -0.2 -0.1 1.8 0.7
2013 1 0 0 0 0.2 0.1 1.3 0.3
2014 3 2 2 2 0.4 0.1 1.5 0.7
2015 4 0 0 1 1.2 0.4 1.7 0.7
2016 3 0 0 1 1.6 0.5 1.7 0.5
2017 6 1 2 5 2.4 0.7 1.8 0.8
14
Figure 4. Female with young occupancy and known or probable mortality within Bear Management Units (BMUs) in the Selkirk Mountains recovery zone 2012–2017. FWC indicates occupancy of a BMU by a female with cubs, FWY indicates occupancy of a female with young, and sex of any mortality is in parentheses.
15
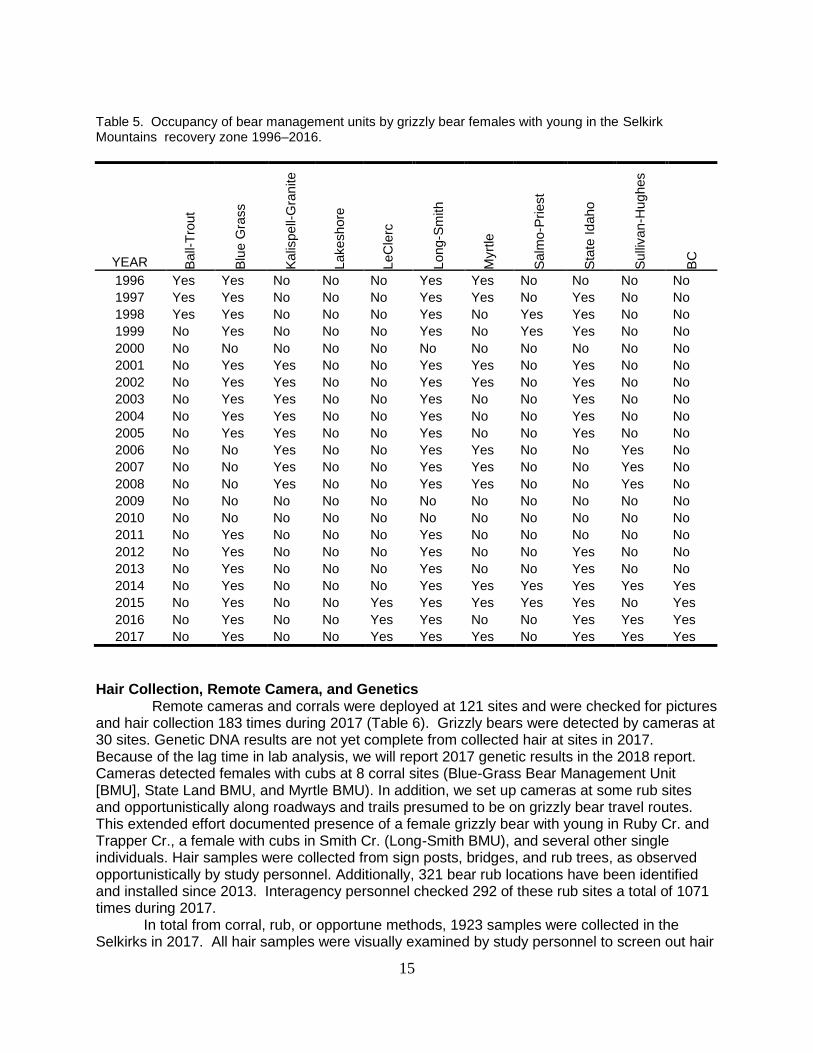
Table 5. Occupancy of bear management units by grizzly bear females with young in the Selkirk Mountains recovery zone 1996–2016.
YEAR Ball-
Tro
ut
Blu
e G
rass
Kalis
pe
ll-G
ran
ite
Lakeshore
LeC
lerc
Long-S
mith
Myrt
le
Salm
o-P
riest
Sta
te Id
aho
Sulli
van-H
ug
hes
BC
1996 Yes Yes No No No Yes Yes No No No No
1997 Yes Yes No No No Yes Yes No Yes No No
1998 Yes Yes No No No Yes No Yes Yes No No
1999 No Yes No No No Yes No Yes Yes No No
2000 No No No No No No No No No No No
2001 No Yes Yes No No Yes Yes No Yes No No
2002 No Yes Yes No No Yes Yes No Yes No No
2003 No Yes Yes No No Yes No No Yes No No
2004 No Yes Yes No No Yes No No Yes No No
2005 No Yes Yes No No Yes No No Yes No No
2006 No No Yes No No Yes Yes No No Yes No
2007 No No Yes No No Yes Yes No No Yes No
2008 No No Yes No No Yes Yes No No Yes No
2009 No No No No No No No No No No No
2010 No No No No No No No No No No No
2011 No Yes No No No Yes No No No No No
2012 No Yes No No No Yes No No Yes No No
2013 No Yes No No No Yes No No Yes No No
2014 No Yes No No No Yes Yes Yes Yes Yes Yes
2015 No Yes No No Yes Yes Yes Yes Yes No Yes
2016 No Yes No No Yes Yes No No Yes Yes Yes
2017 No Yes No No Yes Yes Yes No Yes Yes Yes
Hair Collection, Remote Camera, and Genetics
Remote cameras and corrals were deployed at 121 sites and were checked for pictures and hair collection 183 times during 2017 (Table 6). Grizzly bears were detected by cameras at 30 sites. Genetic DNA results are not yet complete from collected hair at sites in 2017. Because of the lag time in lab analysis, we will report 2017 genetic results in the 2018 report. Cameras detected females with cubs at 8 corral sites (Blue-Grass Bear Management Unit [BMU], State Land BMU, and Myrtle BMU). In addition, we set up cameras at some rub sites and opportunistically along roadways and trails presumed to be on grizzly bear travel routes. This extended effort documented presence of a female grizzly bear with young in Ruby Cr. and Trapper Cr., a female with cubs in Smith Cr. (Long-Smith BMU), and several other single individuals. Hair samples were collected from sign posts, bridges, and rub trees, as observed opportunistically by study personnel. Additionally, 321 bear rub locations have been identified and installed since 2013. Interagency personnel checked 292 of these rub sites a total of 1071 times during 2017.
In total from corral, rub, or opportune methods, 1923 samples were collected in the Selkirks in 2017. All hair samples were visually examined by study personnel to screen out hair
16
that appeared to be black bear and the remaining 529 samples collected in 2017 were sent to Wildlife Genetics International for analysis. Again, lab analysis for 2017 samples has not yet been completed.
In 2016, thirty-seven rub sites (22% of checked) yielded grizzly bear hair in 2016. This extended rub effort identified 13 individual grizzly bears. Combined, corral and rub efforts identified 25 individual grizzly bears in 2016. Four bears were identified from opportunistic hair collections (i.e., collections along trails, at trapsites, on cattle fencing or tree staubs). Both research captured bears were also genotyped. One photographed adult female was not detected genetically (226). One radiocollared bear was monitored in 2016 but not detected genetically or from photos (3017). In total, all combined efforts identified a minimum 30 individual grizzly bears (18 male, 12 female) alive and within the U.S. portion of the Selkirk grizzly bear population in 2016. New genotypes from these individuals were added to the grizzly bear genetic database from the South Selkirk Mountains that contains 161 individuals, 1983–2016.
Table 6. Grizzly bear hair snagging corrals and success in the Selkirk Mountains study area, 2013–2017.
DNA genetic results not yet complete for 2017 samples.
Year
Number
of sites
Sites with
grizzly bear
pictures(%)
Sites with
grizzly bear
hair(%)
Individual
grizzly bear
genotypes Locations with grizzly bear pictures or hair Comments
Jeru Cr., Molybdenite Cr., Joe Cr., Grass Cr., Pearson
Cr., Ruby Cr., SF Granite Cr., Smith Cr., Bugle Cr.,
Branch Cr., Roman Nose Cr., Trapper Cr., Trout Cr.,
WB LeClerc Cr.
Female with young at Boundary
Cr., Molybdenite Cr., and Cow Cr.
Female with cubs at Boundary
Cr., Branch Cr., Bugle Cr., Cow
Cr., Fall Cr., Jeru Cr., Roman
Nose Cr., Ruby Cr., and Trapper
Cr.
Total 568 94 36 31 2
1Percent success out of total number of sites deployed within the year
2Some individuals captured multiple times among years.
17
Figure 5. Location of hair snag corral and rub sampling sites in the Selkirk Mountains, 2007–16.
“Grizzly DNA” represents a site where collected hair was genetically identified as grizzly bear.
18
Movements and Gene Flow The SE population was previously identified as having low genetic diversity as determined by heterozygosity calculations (H=0.54, Proctor et al. 2012). This 2007 level was among the lowest of all interior North American grizzly bear populations. Low heterozygosity was believed to be the result of a small remnant population that has grown by reproduction with little emigration and gene flow from adjacent populations. Capture, telemetry, and genetic data were analyzed to evaluate movement and subsequent reproduction resulting in gene flow into and out of the SE. Twenty-seven grizzly bears were identified as immigrants, emigrants, or were the offspring of immigrants to the SE (Appendix Table T1). While movement and gene flow out of the SE may benefit other populations, gene flow into the SE is most beneficial to genetic health. Eight individuals (6 males and 1 female) are known to have moved into the SE from adjacent populations; however two males and one female were killed or removed (Figure 6). Known gene flow has been identified through reproduction by one immigrant (one male) resulting in 6 offspring in the SE. Additional analysis of changes in heterozygosity and other genetic measures is planned.
Figure 6. Known immigration, emigration, and gene flow in the Selkirk Mountains, 2000–17.
19
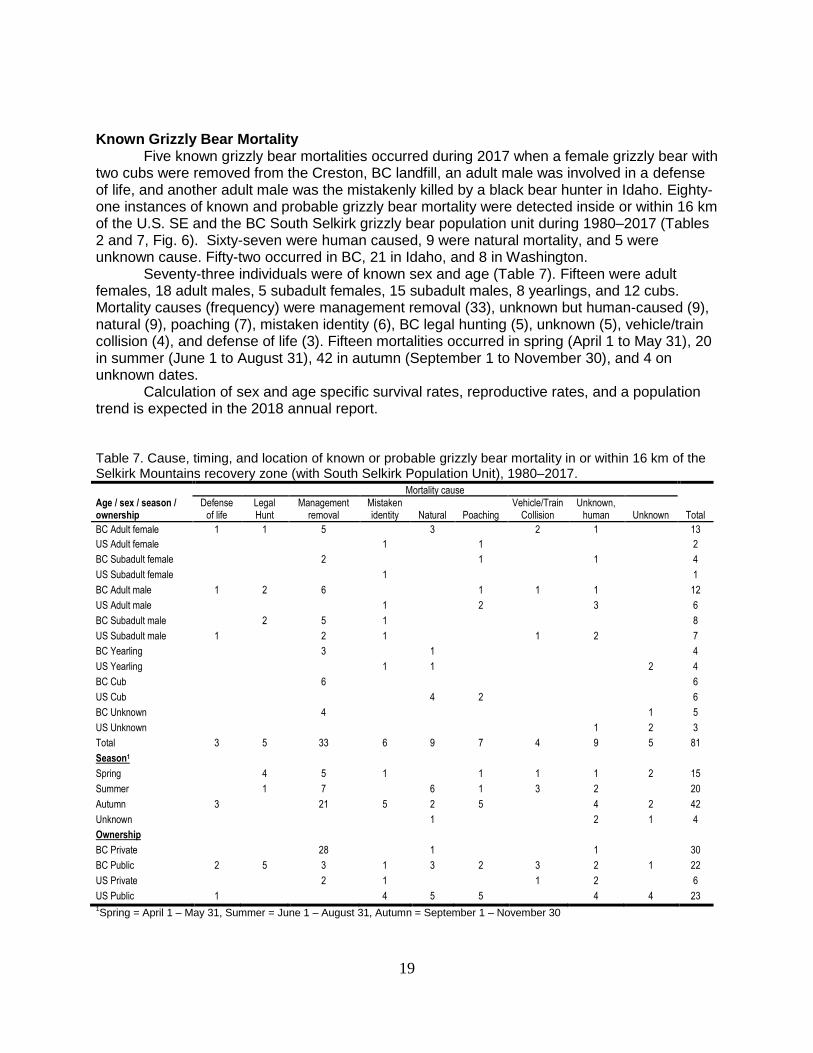
Known Grizzly Bear Mortality Five known grizzly bear mortalities occurred during 2017 when a female grizzly bear with two cubs were removed from the Creston, BC landfill, an adult male was involved in a defense of life, and another adult male was the mistakenly killed by a black bear hunter in Idaho. Eighty-one instances of known and probable grizzly bear mortality were detected inside or within 16 km of the U.S. SE and the BC South Selkirk grizzly bear population unit during 1980–2017 (Tables 2 and 7, Fig. 6). Sixty-seven were human caused, 9 were natural mortality, and 5 were unknown cause. Fifty-two occurred in BC, 21 in Idaho, and 8 in Washington. Seventy-three individuals were of known sex and age (Table 7). Fifteen were adult females, 18 adult males, 5 subadult females, 15 subadult males, 8 yearlings, and 12 cubs. Mortality causes (frequency) were management removal (33), unknown but human-caused (9), natural (9), poaching (7), mistaken identity (6), BC legal hunting (5), unknown (5), vehicle/train collision (4), and defense of life (3). Fifteen mortalities occurred in spring (April 1 to May 31), 20 in summer (June 1 to August 31), 42 in autumn (September 1 to November 30), and 4 on unknown dates. Calculation of sex and age specific survival rates, reproductive rates, and a population trend is expected in the 2018 annual report. Table 7. Cause, timing, and location of known or probable grizzly bear mortality in or within 16 km of the Selkirk Mountains recovery zone (with South Selkirk Population Unit), 1980–2017.
Mortality cause
Age / sex / season / ownership
Defense of life
Legal Hunt
Management removal
Mistaken identity
Natural
Poaching
Vehicle/Train Collision
Unknown, human
Unknown
Total
BC Adult female 1 1 5 3 2 1 13
US Adult female 1 1 2
BC Subadult female 2 1 1 4
US Subadult female 1 1
BC Adult male 1 2 6 1 1 1 12
US Adult male 1 2 3 6
BC Subadult male 2 5 1 8
US Subadult male 1 2 1 1 2 7
BC Yearling 3 1 4
US Yearling 1 1 2 4
BC Cub 6 6
US Cub 4 2 6
BC Unknown 4 1 5
US Unknown 1 2 3
Total 3 5 33 6 9 7 4 9 5 81
Season1
Spring 4 5 1 1 1 1 2 15
Summer 1 7 6 1 3 2 20
Autumn 3 21 5 2 5 4 2 42
Unknown 1 2 1 4
Ownership
BC Private 28 1 1 30
BC Public 2 5 3 1 3 2 3 2 1 22
US Private 2 1 1 2 6
US Public 1 4 5 5 4 4 23 1Spring = April 1 – May 31, Summer = June 1 – August 31, Autumn = September 1 – November 30
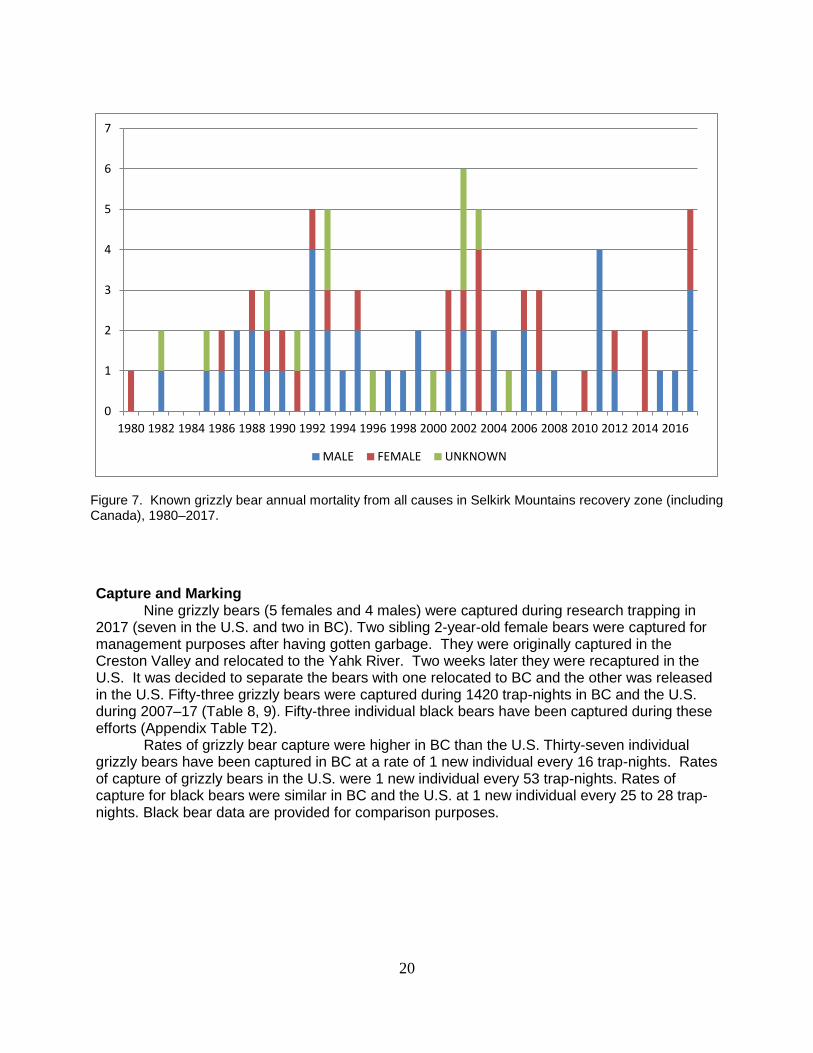
Nine grizzly bears (5 females and 4 males) were captured during research trapping in 2017 (seven in the U.S. and two in BC). Two sibling 2-year-old female bears were captured for management purposes after having gotten garbage. They were originally captured in the Creston Valley and relocated to the Yahk River. Two weeks later they were recaptured in the U.S. It was decided to separate the bears with one relocated to BC and the other was released in the U.S. Fifty-three grizzly bears were captured during 1420 trap-nights in BC and the U.S. during 2007–17 (Table 8, 9). Fifty-three individual black bears have been captured during these efforts (Appendix Table T2).
Rates of grizzly bear capture were higher in BC than the U.S. Thirty-seven individual grizzly bears have been captured in BC at a rate of 1 new individual every 16 trap-nights. Rates of capture of grizzly bears in the U.S. were 1 new individual every 53 trap-nights. Rates of capture for black bears were similar in BC and the U.S. at 1 new individual every 25 to 28 trap-nights. Black bear data are provided for comparison purposes.
Figure 7. Known grizzly bear annual mortality from all causes in Selkirk Mountains recovery zone (including Canada), 1980–2017.
21
Table 8. Capture effort and success for grizzly bears and black bears within the Selkirk Mountains study areas, 2007–2017.
Area / Year(s)
Trap-nights
Grizzly Bear Captures
Black Bear Captures
Trap-nights / Grizzly Bear
Trap-nights / Black Bear
Selkirks, US, 2012–17
ID Total Captures 628 17 22 37 29
WA Total Captures 213 1 8 213 27
US Individual bears¹ 841 16 30 53 28
Selkirks, BC, 2007-17
Total Captures 579 42 28 14 21
BC Individual bears¹ 579 37 23 16
25 1Only captures of individual bears included. Recaptures are not included in summary.
Table 9. Grizzly bear capture information from the Selkirk Mountain study area, 2007–2017. Multiple captures of a single bear during a given year are not included.
Bear
Capture Date
Sex Age (Est.)
Mass kg (Est.)
Location Capture Type
119 4/21/07 M 19 205 Duck Lake, BC Research
138 5/20/08 F 2 100 Corn Cr., BC Research
144 6/16/08 M 12 (205) Next Cr., BC Research
150 6/21/08 F 7 71 Elmo Cr., BC Research
151 6/23/08 F 20 82 Cultus Cr., BC Research
155 6/27/08 M 11
(170) Next Cr., BC Research
149 6/12/09 M 10 216 Wildhorse Cr., BC Research
161 6/15/09 F 18
82 Wildhorse Cr., BC Research
163 6/16/09 F 7 (102) Wildhorse Cr., BC Research
8005 6/16/09 F 4 (90) Salmo River, BC Management, pig feed
165 6/19/09 F 14 (80) Apex Cr., BC Research
169 6/23/09 F 20 (80) Wildhorse Cr., BC Research
171 6/25/09 F 14 91 Seaman Cr,, BC Research
177 6/22/10 F 9 84 Hidden Cr., BC Research
183 6/29/10 F 11 102 Sheep Cr., BC Research
17 9/17/10 M 3 100 Nelson Golf Course, BC Management, non-target capture
154 9/18/10 M (4) (91) Summit Cr., BC Research
7 9/25/10 F 13 132 Nelson Golf Course, BC Management, grease bin
152 5/26/11 M 10 148 Cottonwood Cr., BC Research
149 5/31/11 M 12 (205) Cottonwood Cr., BC Research
2 8/19/11 M 26 178 Creston Valley, BC Research
174 5/25/12 M 6 84 Cottonwood Cr., BC Research
166 5/30/12 M 3
56 Cottonwood Cr., BC Research
170 6/5/12 F 6 130 Salmo River, BC Management, cat food
183 6/8/12 F 11 -- Lost Cr., BC Research
156 8/17/12 M 2 125 Creston Valley, BC Management, fruit trees
12003 8/15/12 F 8 111 Trapper Cr., ID Research
12008 8/26/12 F 15 114 Trapper Cr. ID Research
12006 8/29/12 F 2 60 Trapper Cr. ID Research
221 8/29/12 M 6 149 Creston Valley, BC Research
226 6/6/13 F 6 115 Creston Valley, BC Management, frequenting dump
13017 7/22/13 F 2 58 Trapper Cr., ID Research
13021 7/30/13 F 3 76 Bugle Cr., ID Research
13023 7/30/13 F 9 94 Trapper Cr., ID Research
12016 8/23/13 F 10 104 Grass Cr., ID Research
232 5/17/14 M 5 130 Apex Cr., BC Research
174 5/22/14 M 8 116 Apex Cr., BC Research
234 5/23/14 M 7 75 Ymir Cr., BC Research
22
240 5/26/14 M 22 >245 Cottonwood Cr., BC Research
150 6/14/14 F 14 70 Hidden Cr., BC Research
248 6/19/14 M 4 93 Apex Cr., BC Research
250 6/21/14 M 7 123 Wildhorse Cr., BC Research
14327 6/21/14 M 7 195 Jackson Cr., ID Research
227 6/24/14 M 8 112 Hidden Cr., BC Research
229 6/26/14 F 4 72 Apex Cr., BC Research
4250 10/6/14 F (6) (145) Creston Valley, BC Research
1019 5/30/15 F 3 221 Creston Valley, BC Research
1020 6/7/15 F 6 144 Cultus Cr., BC Research
150 6/13/15 F 14 182 Next Cr., BC Research
1001 6/20/15 M 6 215 Trapper Cr., ID Research
247 5/29/16 M 3 79 Creston Valley, BC Research
1019 5/29/16 F 3 115 Creston Valley, BC Research
1021 5/31/16 M 11 242 Creston Valley, BC Research
1024 6/1/16 M (2) 74 Creston Valley, BC Research
1002 6/29/16 M 8 166 Willow Cr., WA Research
4-070 8/6/16 F (10) (182) Creston Valley, BC Research
1003 8/14/16 F 6 128 Boundary Cr., ID Research
4-011 8/15/16 F >5 (68) Kootenay R., BC Management; fruit trees
4-002 8/15/16 F (0.5) (34) Kootenay R., BC Management; captured with mother 4-011
4-004 8/15/16 F (0.5) (34) Kootenay R., BC Management; captured with mother 4-011
1006 5/26/17 M (1) 46 Boundary Cr., ID Research
1028 6/5/17 F (2) 58 Corn Cr., BC Management; garbage
1026 6/5/17 F (2) 60 Corn Cr., BC Management; garbage
1030 6/10/17 F (4) 110 Kootenay R., BC Research
1031 6/14/17 F (1) 40 Kootenay R., BC Research
1007 6/19/17 M (15) 170 Cow Cr., ID Research
1008 6/21/17 M (2) 86 Boundary Cr., ID Research
1009 6/21/17 M (5) 151 Cow Cr., ID Research
1010 6/25/17 F (12) 123 Cow Cr., ID Research
12008 7/23/17 F 20 113 Trapper Cr., ID Research
12003 7/24/17 F 13 97 Bugle Cr., ID Research
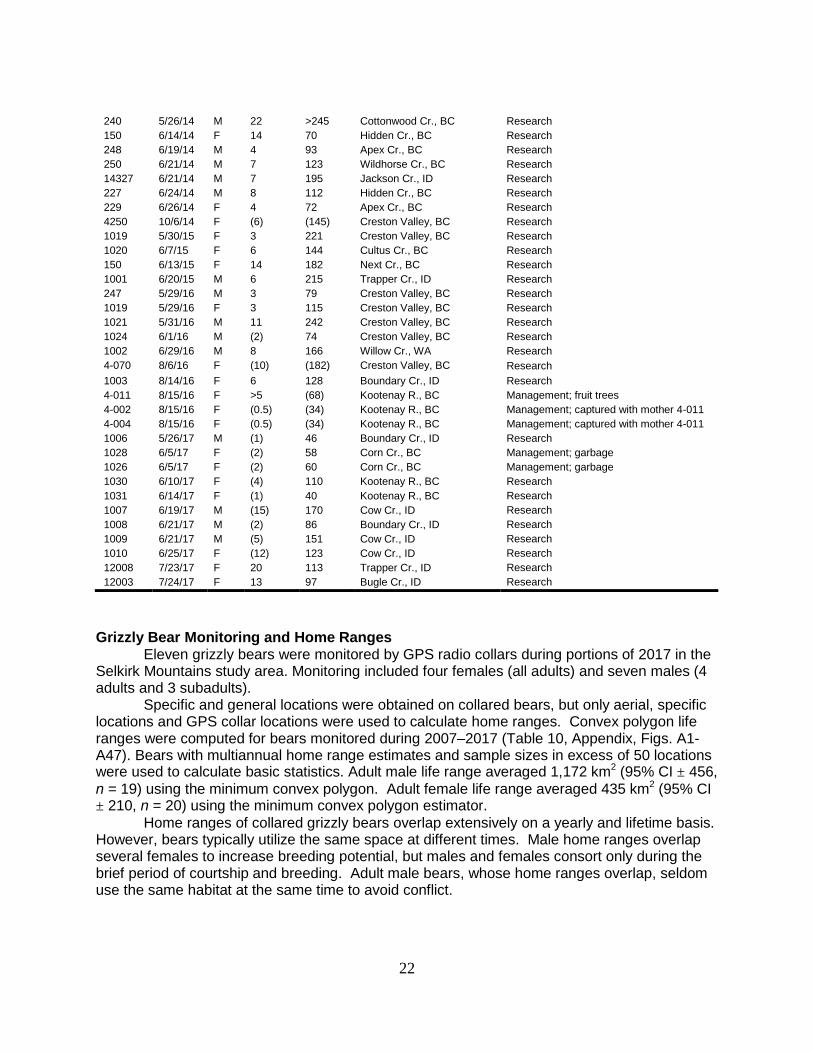
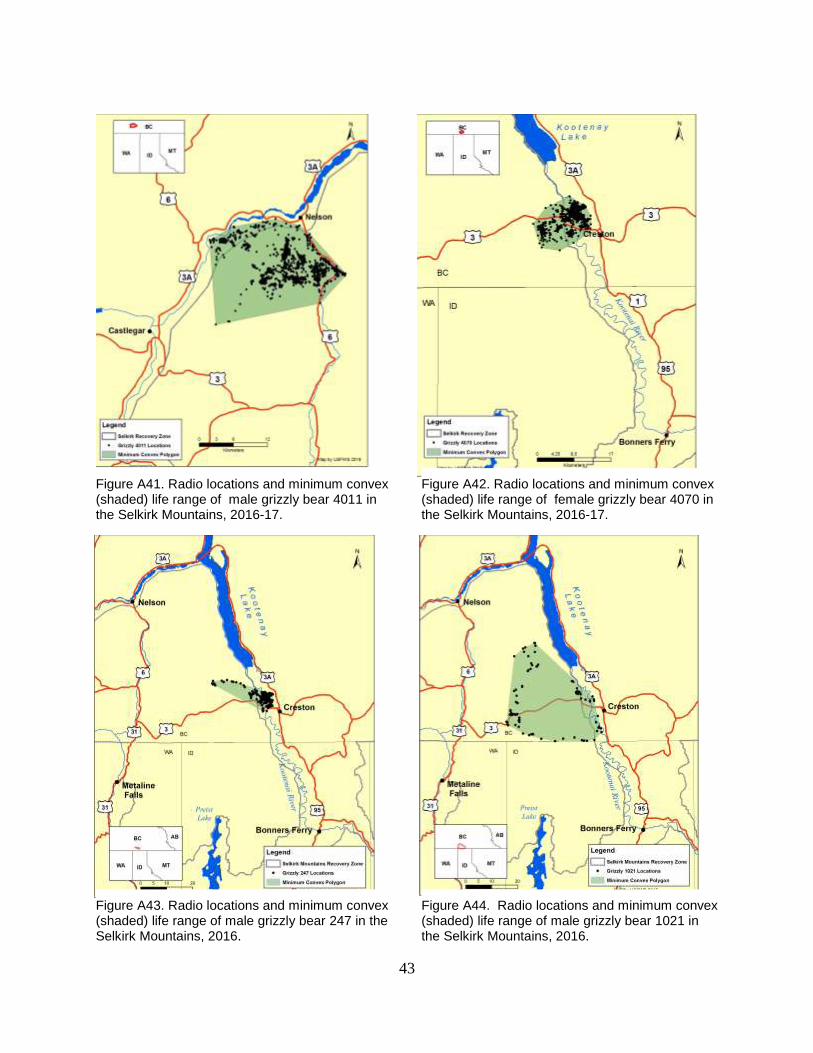
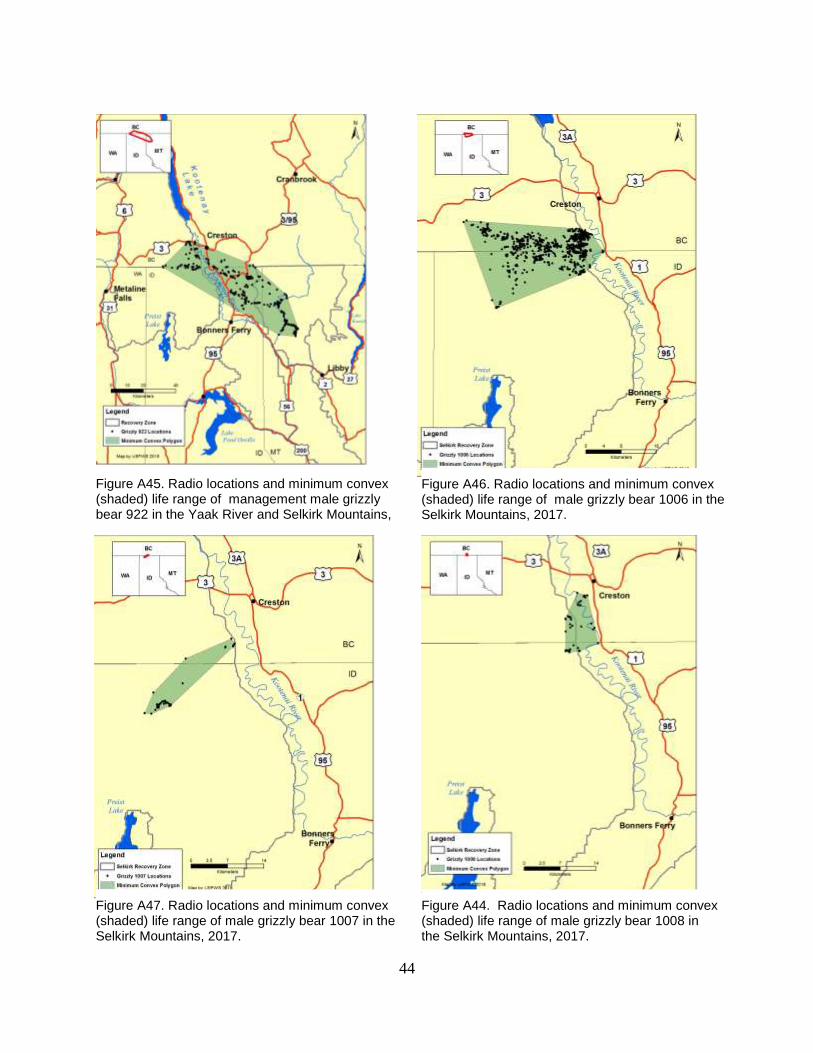
Grizzly Bear Monitoring and Home Ranges Eleven grizzly bears were monitored by GPS radio collars during portions of 2017 in the Selkirk Mountains study area. Monitoring included four females (all adults) and seven males (4 adults and 3 subadults). Specific and general locations were obtained on collared bears, but only aerial, specific locations and GPS collar locations were used to calculate home ranges. Convex polygon life ranges were computed for bears monitored during 2007–2017 (Table 10, Appendix, Figs. A1-A47). Bears with multiannual home range estimates and sample sizes in excess of 50 locations were used to calculate basic statistics. Adult male life range averaged 1,172 km2 (95% CI ± 456,
n = 19) using the minimum convex polygon. Adult female life range averaged 435 km2 (95% CI ± 210, n = 20) using the minimum convex polygon estimator.
Home ranges of collared grizzly bears overlap extensively on a yearly and lifetime basis. However, bears typically utilize the same space at different times. Male home ranges overlap several females to increase breeding potential, but males and females consort only during the brief period of courtship and breeding. Adult male bears, whose home ranges overlap, seldom use the same habitat at the same time to avoid conflict.
23
Table 10. Home range sizes of grizzly bears in the Selkirk Mountains of northern Idaho and southern
British Columbia, 2006–2017.
Bear Sex Age (Est) Years Collar Type
Number of fixes
100% Convex polygon
(km2) Area of use
103 M 3-4 2006-07 GPS 4,872 6,545 Kootenai, & Pend Oreille River, BC, ID, & WA
119 M 19-20 2008-09 GPS 2,115 1,830 Selkirk Mtns., BC
138 F 2-3 2008-09 GPS 3,232 750 Kootenay River, BC
144 M 9 2008 GPS 1,648 883 Selkirk Mtns., BC
7005 M 4 2008 GPS 229 1,144 Selkirk Mtns., BC
150 F 6-14 2008-09, 2014-16 GPS 5,919 1,354 Selkirk Mtns., BC
155 M 11-13 2008-10 GPS 2,175 1,479 Selkirk Mtns., BC
161 F 6-7 2009-10 GPS 2,008 126 Selkirk Mtns., BC
163 F 6-7 2009-10 GPS 4,144 271 Selkirk Mtns., BC
165 F 15-16 2009-10 GPS 416 169 Selkirk Mtns., BC
171 F 15-16 2009-10 GPS 2,740 227 Selkirk Mtns., BC
8005 F 4-5 2009-10 GPS 1,649 4,511 Selkirk Mtns., BC
177 F 9 2010 GPS 486 72 Selkirk Mtns., BC
154 M 4 2010 GPS 396 178 Selkirk Mtns., BC
183 F 9-12 2010, 12-13 GPS 616 362 Selkirk Mtns., BC
7 F 9 2010 GPS 35 75 Selkirk Mtns., BC
17 M 3 2010 GPS 255 106 Selkirk Mtns., BC
152 M 6-7 2011-12 GPS 1,189 340 Selkirk Mtns., BC
149 M 11 2011 GPS 737 2,114 Selkirk Mtns., BC
12003 F 5-7,13 2012-13,17 GPS 1570 426 Selkirk Mtns, ID
12006 F 2-4 2012-14 GPS 626 532 Selkirk Mtns, ID
12008 F 15-17,20 2012-14,17 GPS 1,892 706 Selkirk Mtns, ID
221 M 6-7 2012-13 GPS 47 140 Selkirk Mtns., BC
174 M 4-6 2012-14 GPS 972 621 Selkirk Mtns., BC
12016 F 10-13 2013-16 GPS 742 216 Selkirk Mtns, ID
13017 F 2-5 2013-16 GPS 1,707 859 Selkirk Mtns, ID
13021 F 3-5 2013-15 GPS 1,187 1,801 Selkirk Mtns, ID
13023 F 9-11 2013-15 GPS 1,109 472 Selkirk Mtns, ID
226 F 6-9 2013-16 GPS 2,578 482 Selkirk Mtns, Creston Valley, BC
229 F 3-5 2014-16 GPS 489 71 Selkirk Mtns, BC
232 M 5 2014 GPS 1,354 353 Selkirk Mtns, BC
234 M 7-9 2014-16 GPS 3,560 446 Selkirk Mtns, BC
248 M 4-6 2014-16 GPS 4,418 2,321 Selkirk Mtns, BC
807 M 4-7 2014-17 GPS 2,568 3,319 Selkirk Mtns, ID&Yaak River, MT
1001 M (4) 2015 GPS 1,352 1,357 Selkirk Mtns, BC
1019 F (3-4) 2015-16 GPS 894 187 Selkirk Mtns, Creston Valley
1020 F 5-6 2015-16 GPS 3,366 196 Selkirk Mtns, BC
1002 M (10) 2016 GPS 1,017 830 Selkirk Mtns, ID&WA
1003 F (6) 2016 GPS 1,257 122 Selkirk Mtns, ID& Creston Valley BC
1024 M (2) 2016 GPS 594 80 Selkirk Mtns, Creston Valley, BC
4011 F (10-11) 2016-17 GPS 2729 312 Selkirk Mtns, BC
4070 F (10) 2016 GPS 600 60 Selkirk Mtns, Creston Valley, BC
24
Bear Sex Age (Est) Years Collar Type
Number of fixes
100% Convex polygon
(km2) Area of use
247 M (2) 2016 GPS 601 129 Selkirk Mtns, Creston Valley, BC
1021 M (11) 2016 GPS 139 945 Selkirk Mtns, Creston Valley, BC
9222 M 4-5 2016-17 GPS 938 2,148 Kootenai Rr., ID Yaak Rr, MT
1006 M (1) 2017 GPS 1553 393 Selkirk Mtns, ID&BC
1007 M (15) 2017 GPS 118 74 Selkirk Mtns, ID&BC
1008 M (3) 2017 GPS 152 52 Selkirk Mtns, ID& Creston Valley BC
1009 M (5) 2017 GPS 180 216 Selkirk Mtns, ID&BC
1010 F (12) 2017 GPS 43 61 Selkirk Mtns, ID
23 M (3) 2017 GPS 427 114 Selkirk Mtns, BC
Grizzly Bear Denning Chronology We used VHF and GPS location data from radio-collared grizzly bears during 1998–2017 to summarize den entry and exit dates by month and week. Den entry dates (n = 72) ranged from the first week of October to the first week of December. Sixty-one (92%) entries occurred between the 2nd week of October and the 4th week of November (Fig. 8). SE grizzly bears (median entry during 1st week of November) entered dens 1 and 3 weeks earlier than bears in the Cabinet Mountains and Yaak River drainage (Kasworm et al. 2018), respectively (median entry during 2nd week of November for Cabinet bears and 4th week of November for Yaak bears). Males enter dens one week later than females (Fig. 8). By December 1, 96% of monitored Selkirk grizzly bears had entered winter dens. By this same date, only 62% of Cabinet and Yaak grizzly bears had entered dens.
Figure 8. Month and week of den entry for male and female radio-collared grizzly bears in the Selkirk
Ecosystem, 1998–2017.
We have far fewer den exit dates for Selkirk radio-collared grizzly bears (n = 21), and
25
nearly all emergence data is from female grizzly bears. Exit dates for female Selkirk grizzly bears ranged from the third week of March to the second week of May (median of 4th week in April) (Fig. 9). Exit dates for females are similar to those of females in the Cabinet Mountains and Yaak drainage (Kasworm et al. 2018). In general, Cabinet and Yaak female grizzly bears exit dens only one week earlier than female bears in the SE.
Figure 9. Month and week of den exit for male and female radio-collared grizzly bears in the Selkirk Ecosystem, 2013-2017.
Inter-ecosystem Isotope Analysis
To date, we have obtained carbon (δ13C) and nitrogen (δ15N) isotope ratios from 237 grizzly bear hair and blood samples between 1984 and 2015 across the Cabinet-Yaak and Selkirk ecosystems. Across the Selkirk and Cabinet-Yaak ecosystems, adult males consume slightly more animal matter (22%) than adult females (14%) and subadults (13%). Adult females in the Yaak River consume higher proportions of animal matter (22%) than do adult females in the Cabinets (10%) and the Selkirks (6%).
We estimate that 14 percent of the annual diet of Cabinet Mountain grizzly bears (n = 19 hair samples from non-management bears) is derived from animal matter. Adult males had slightly higher δ15N stable isotope signatures (4.2‰) than adult females (3.1‰), indicating greater use of available animal matter (24% vs. 10% animal matter, respectively).
Yaak grizzly bear diets contain nearly 22% animal matter (n = 84 hair samples). Adult female use of animal matter varies widely; δ15N and diet values ranged as low as 2.3‰ (~6% animal matter) to as high as 7.2‰ (~80% animal matter). Sampled grizzly bears in the Selkirk ecosystem consumed less animal matter than Cabinet and Yaak bears (12%; n = 36 hair samples). Diets of non-management, adult female bears include only 7% animal matter. However, one adult female captured in a management incident in the Creston Valley fed on animal matter at a rate of 82%. We suspect bears such as her likely gain meat from bone piles or dead livestock at nearby dairy operations. Across ecosystems, conflict and management bears had slightly higher proportions of meat (26%) in assimilated diets than research bears (17%). Management bears did not necessarily have higher δ13C signatures as would indicate a more corn-based or anthropogenic food source (-23‰ for both research and management bears). In fact, highest δ13C in our
26
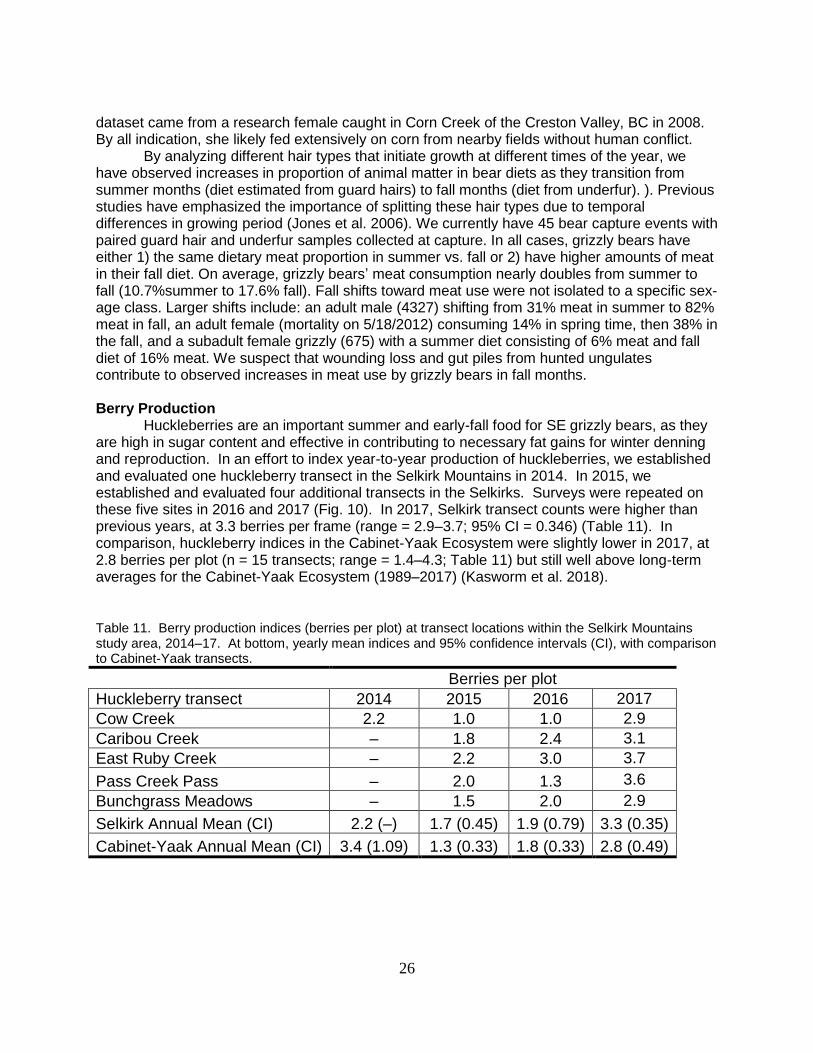
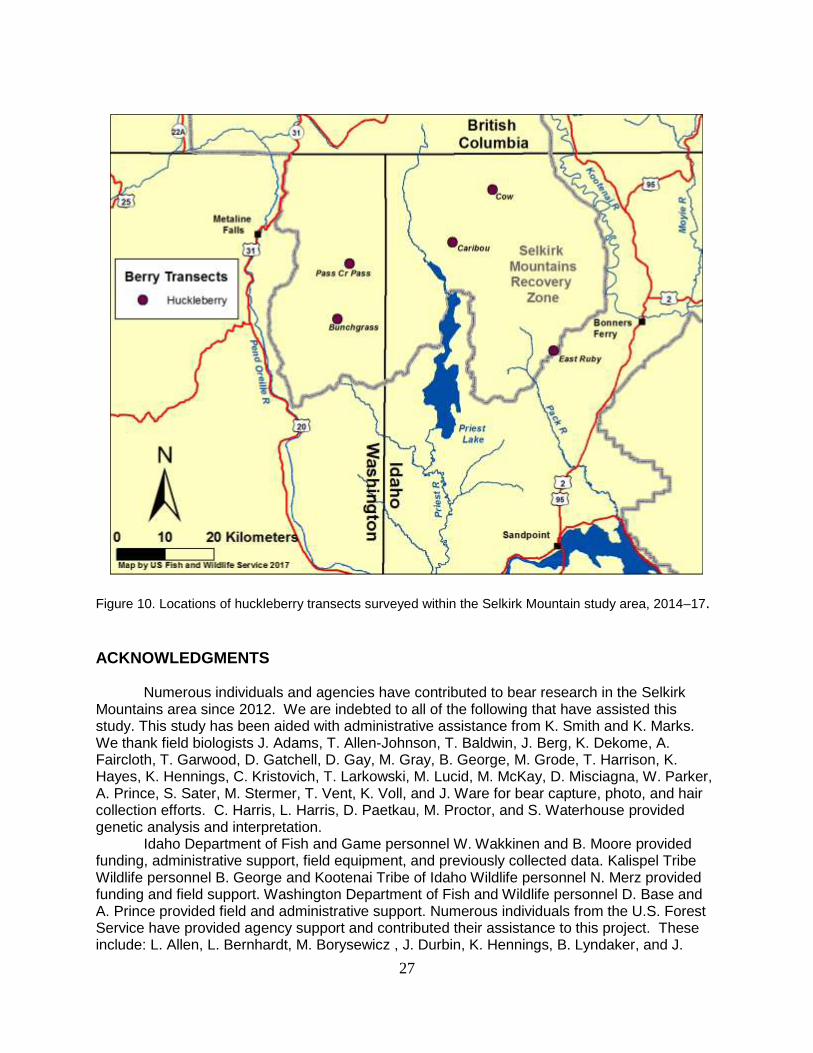
dataset came from a research female caught in Corn Creek of the Creston Valley, BC in 2008. By all indication, she likely fed extensively on corn from nearby fields without human conflict. By analyzing different hair types that initiate growth at different times of the year, we have observed increases in proportion of animal matter in bear diets as they transition from summer months (diet estimated from guard hairs) to fall months (diet from underfur). ). Previous studies have emphasized the importance of splitting these hair types due to temporal differences in growing period (Jones et al. 2006). We currently have 45 bear capture events with paired guard hair and underfur samples collected at capture. In all cases, grizzly bears have either 1) the same dietary meat proportion in summer vs. fall or 2) have higher amounts of meat in their fall diet. On average, grizzly bears’ meat consumption nearly doubles from summer to fall (10.7%summer to 17.6% fall). Fall shifts toward meat use were not isolated to a specific sex-age class. Larger shifts include: an adult male (4327) shifting from 31% meat in summer to 82% meat in fall, an adult female (mortality on 5/18/2012) consuming 14% in spring time, then 38% in the fall, and a subadult female grizzly (675) with a summer diet consisting of 6% meat and fall diet of 16% meat. We suspect that wounding loss and gut piles from hunted ungulates contribute to observed increases in meat use by grizzly bears in fall months. Berry Production Huckleberries are an important summer and early-fall food for SE grizzly bears, as they are high in sugar content and effective in contributing to necessary fat gains for winter denning and reproduction. In an effort to index year-to-year production of huckleberries, we established and evaluated one huckleberry transect in the Selkirk Mountains in 2014. In 2015, we established and evaluated four additional transects in the Selkirks. Surveys were repeated on these five sites in 2016 and 2017 (Fig. 10). In 2017, Selkirk transect counts were higher than previous years, at 3.3 berries per frame (range = 2.9–3.7; 95% CI = 0.346) (Table 11). In comparison, huckleberry indices in the Cabinet-Yaak Ecosystem were slightly lower in 2017, at 2.8 berries per plot (n = 15 transects; range = 1.4–4.3; Table 11) but still well above long-term averages for the Cabinet-Yaak Ecosystem (1989–2017) (Kasworm et al. 2018).
Table 11. Berry production indices (berries per plot) at transect locations within the Selkirk Mountains study area, 2014–17. At bottom, yearly mean indices and 95% confidence intervals (CI), with comparison to Cabinet-Yaak transects.
Figure 10. Locations of huckleberry transects surveyed within the Selkirk Mountain study area, 2014–17. ACKNOWLEDGMENTS Numerous individuals and agencies have contributed to bear research in the Selkirk Mountains area since 2012. We are indebted to all of the following that have assisted this study. This study has been aided with administrative assistance from K. Smith and K. Marks. We thank field biologists J. Adams, T. Allen-Johnson, T. Baldwin, J. Berg, K. Dekome, A. Faircloth, T. Garwood, D. Gatchell, D. Gay, M. Gray, B. George, M. Grode, T. Harrison, K. Hayes, K. Hennings, C. Kristovich, T. Larkowski, M. Lucid, M. McKay, D. Misciagna, W. Parker, A. Prince, S. Sater, M. Stermer, T. Vent, K. Voll, and J. Ware for bear capture, photo, and hair collection efforts. C. Harris, L. Harris, D. Paetkau, M. Proctor, and S. Waterhouse provided genetic analysis and interpretation. Idaho Department of Fish and Game personnel W. Wakkinen and B. Moore provided funding, administrative support, field equipment, and previously collected data. Kalispel Tribe Wildlife personnel B. George and Kootenai Tribe of Idaho Wildlife personnel N. Merz provided funding and field support. Washington Department of Fish and Wildlife personnel D. Base and A. Prince provided field and administrative support. Numerous individuals from the U.S. Forest Service have provided agency support and contributed their assistance to this project. These include: L. Allen, L. Bernhardt, M. Borysewicz , J. Durbin, K. Hennings, B. Lyndaker, and J.
28
Madison. N. Cheshire, and D. Parker provided exceptional services as aircraft pilots. The BC Fish Wildlife Compensation Program, BC Habitat Trust Foundation, Columbia Basin Trust, Colville National Forest, Great Northern Landscape Conservation Cooperative, Idaho Department of Fish and Game, Idaho Panhandle National Forest, Kalispel Tribe, Kootenai Tribe of Idaho, Liz Claiborne Art Ortenberg Foundation, National Fish and Wildlife Foundation, Nature Conservancy Canada, Wilburforce Foundation, Yellowstone to Yukon Conservation Initiative, and the U.S. Fish and Wildlife Service provided funding and support for this project.
LITERATURE CITED Almack, J. A. 1985. An evaluation of grizzly bear habitat in the Selkirk Mountains of north Idaho.
M.S. Thesis University of Idaho, Moscow. 87 pp. Brenna, J. T., T.N. Corso, H.J. Tobias and R.J. Caimi. 1997. High-precision continuous-flow
isotope ratio mass spectrometry. Mass Spectrometry Reviews. 16:227–258. Hayne, D. W. 1959. Calculation of size of home range. Journal of Mammalogy 30:1-18. Hellgren, E. C., D. W. Carney, N. P. Garner, and M. R. Vaughn. 1988. Use of breakaway
cotton spacers on radio collars. Wildlife Society Bulletin 16:216-218. Johnson, K. G. and M. R. Pelton. 1980. Prebaiting and snaring techniques for black bears.
Wildlife Society Bulletin 8:46-54. Jones, E. S., D. C. Heard, and M. P. Gillingham. 2006. Temporal variation in stable carbon and
nitrogen isotopes of grizzly bear guardhair and underfur. Wildlife Society Bulletin 34:1320–1325.
Jonkel, J. J. 1993. A manual for handling bears for managers and researchers. Edited by T.J.
Thier, U.S. Fish and Wildlife Service, Missoula, Montana. Kasworm, W. F., T. G. Radandt, J.E. Teisberg, A. Welander, M. Proctor, and C. Servheen.
2015. Cabinet-Yaak grizzly bear recovery area 2014 research and monitoring progress report. U.S. Fish and Wildlife Service, Missoula, Montana. 109 pp.
Kendall, K. C. 1986. Grizzly and black bear feeding ecology in Glacier National Park, Montana.
National Park Service Progress Report. 42 pp. Layser, E. F. 1978. Grizzly bears in the southern Selkirk Mountains. Northwest Science 52:77-
91. Proctor, M. P., D. Paetkau, B. N. Mclellan, G. B. Stenhouse, K. C. Kendall, R. D. Mace, W. F.
Kasworm, C. Servheen, C. L. Lausen, M. L. Gibeau, W. L. Wakkinen, M. A. Haroldson, G. Mowat, C. Apps, L. M. Ciarniello, R. M. R. Barclay, M. S. Boyce, C. C. Schwartz, and C. Strobeck. 2012. Population fragmentation and inter-ecosystem movements of grizzly bears in Western Canada and the Northern United States. Wildlife Monographs 180:1-46.
29
Qi, H., Coplen, T.B., Geilmann, H., Brand, W.A. and Böhlke, J.K. 2003. Two new organic reference materials for δ13C and δ15N measurements and a new value for the δ13C of NBS 22 oil. Rapid Communications in Mass Spectrometry. 17:2483–2487.
Stoneberg, R. and C. Jonkel. 1966. Age determination in black bears by cementum layers.
Journal of Wildlife Management 30:411-414. U.S. Fish and Wildlife Service. 1993. Grizzly bear recovery plan. U.S. Fish and Wildlife
Service, Missoula, Montana. Wakkinen, W. L. and B. K..Johnson. 2004. Selkirk ecosystem project January 2003-December
2003. Idaho Department of Fish and Game, Boise. 24 pp. Wakkinen, W. L. and W. F. Kasworm. 2004. Demographics and population trends of grizzly
bears in the Cabinet-Yaak and Selkirk ecosystems of British Columbia, Idaho, Montana, and Washington. Ursus 15 65-75.
Woods, J.G., D. Paetkau, D. Lewis, B.N. McLellan, M. Proctor, and C. Strobeck. 1999. Genetic
tagging of free-ranging black and brown bears. Wildlife Society Bulletin. 27:616-627. Zager, P. 1983. Grizzly bears in Idaho’s Selkirk Mountains: an update. Northwest Science
57:299-309. APPENDIX Table T1. Movement and gene flow to or from the Selkirk Mountains recovery area.
Area Start / Finish
1 Action Bear ID Sex Age Year Basis Comments
NCDE / SSelk
Movement None F 2 2000 Telemetry, capture
Captured and relocated several times in NCDE. Recaptured north of Bonners Ferry, ID and relocated back to NCDE.
NPur / SSelk
Movement SCptHM M 19 2008 Telemetry, Genetics
Born in NPur but traveled to SSelk and captured. Genetics determine parents in NPur
SPur / SSelK
Movement YHydeM M 3 2006-07 Telemetry Captured in SPur Yaak 2006. Bear traveled to SSelk 2006, denned then lost collar 2007.
KG/NPur Movement Wilf(156) M 4 2012 Capture, Genetics
Traveled from Kettle Granby in WA to N Purcells. Management removal 2012
SSelk / Bitt
Movement B90307M M ? 2007 Genetic assignment
Killed in Bitterroot September 2007. Genetic analysis indicates origin in Sselk
SSelk / CABSR / SSelk
Movement 928442 M 5 2012 Genetics Father SSelk S9058aM, Mother SSelk SBettyF, Hair snagged USGS 2012 in CABSR and again in Sselk 2015
SSelk / NPur
Movement S1022M M 1 1994, 1996
Telemetry, Mortality
Captured in SSelk 1994, Management removal 1996 Boswell, BC NPur.
SSelk / SPur
Movement S31M M 6 2004-05 Telemetry, Mortality
Father SSelk SS3KM, Mother SSelk S1MF, Collared 2003 West of Creston. Hunter kill 2005 east of Creston in SPur
NPur / SSelk
Movement PBobM M 26 2011 Telemetry, Mortality
Collared in NPurs, but recaptured later in SSelk and Management removal 2011
SSelk / KG
Movement ApexS248M M 4 2014-15 Telemetry Radio collared and traveled west to KG from SSelk 2015
SSelk / Cabsr
Movement S1001M M 6 2015 Telemetry, Mortality
Travel east from SSelk to Cabsr. Mortality 2015
30
SPur / SSelK
Movement Y11048M M 4 2017 Telemetry, Mortality
Travel west from SPur to Sselk. Mortality 2017
SPur / SSelK
Movement YGB807M M 5 2015-17 Telemetry Travel west from SPur to Sselk.
NPur / SSelk
Movement S14151M M Unk 2014 Genetics Parents both NPur, Father NPur PKiddM, Mother NPur PKellyF
NPur / SSelk
Gene flow SFoccacia170F F 6 2012 Genetics Father NPur SCptHM , Mother SSelk SCulveF
NPur / SSelk
Gene flow S92231M M Unk 2016 Genetics Father NPur SCptHM , Mother SSelk JillS226F
NPur / SSelk
Gene flow S25793M M Unk 2016 Genetics Father NPur SCptHM , Mother SSelk S1029F
NPur / SSelk
Gene flow S21285M M Unk 2016 Genetics Father NPur SCptHM , Mother SSelk S11675F
NPur / SSelk
Gene flow S21690M M Unk 2016 Genetics Father NPur SCptHM , Mother SSelk SMaya4208F
NPur / SSelk
Gene flow S21698M M Unk 2016 Genetics Father NPur SCptHM , Mother SSelk SMaya4208F
SSelk / KG
Movement 9305a ? Unk Unk Genetics Father SKirkM, Mother SSelk S10991F, Origin of father probably SSelk
SSelk / KG
Movement JC12-23 M? Unk 2012 Genetics, Mortality
Father Sunk1M, Mother S10739F Both Selkirks Male offspring JC12-23 in KG
SSelk / SPur
Movement 16749 M Unk 2015 Genetics Father C134B2V2, Mother JillS226F Both Selkirks. Male offspring 16749 in SPur
1Cabs – Cabinet Mountains, KG - Kettle Granby , NCDE – Northern Continental Divide, NPur – Purcell Mountains north of Highway
3, SPur – Purcell Mountains south of Highway 3, SSelk – South Selkirk Mountains south of Nelson, BC
Table T2. Black bears captured by study personnel in the Selkirk Ecosystem, 2007–17.
Bear Tag
Color Capture
Date Sex Age
(Est.) Mass kg
(Est) Location Capture Type
116 BLACK 4/24/2007 M 13 (125) Corn Cr., BC Research
118 BLACK 4/26/2007 M 3 (57) Corn Cr., BC Research
120 BLACK 4/28/2007 M UNK 163 Corn Cr., BC Research
120 BLACK 4/30/2008 M UNK (136) Corn Cr., BC Research
118 BLACK 4/30/2008 M (4) (73) Duck Lake, BC Research
136 BLACK 5/17/2008 M (6) (79) Leach Cr., BC Research
146 BLACK 6/17/2008 M UNK (59) Cultus Cr., BC Research
148 BLACK 6/20/2008 M UNK 76 Laib Cr., BC Research
142 BLACK 6/21/2008 M UNK (68) Cultus Cr., BC Research
153 BLACK 6/24/2008 M UNK 67 Elmo Cr., BC Research
143 BLACK 5/17/2009 M 20 (109) Corn Cr., BC Research
145 BLACK 5/24/2009 UNK UNK (79) Corn Cr., BC Research
143 BLACK 5/27/2009 M 20 (109) Dodge Cr., ID Research
401 GREEN 6/22/2011 F 5 56 Fall Cr., ID Research
403 GREEN 6/26/2011 F 9 79 Fall Cr., ID Research
405 GREEN 6/29/2011 M 4 58 Fall Cr., ID Research
407 GREEN 7/13/2011 M 2 47 Dodge Cr., ID Research
409 GREEN 7/15/2011 M 3 54 Trail Cr., ID Research
411 GREEN 7/18/2011 M 2 52 Fall Cr., ID Research
417 GREEN 7/21/2011 M UNK 37 Fall Cr., ID Research
8006 GREEN 8/18/2011 F 2 41 Roman Nose Cr., ID Research
155 GREEN 9/19/2011 F 8 (73) Dodge Cr., ID Research
31
Bear Tag
Color Capture
Date Sex Age
(Est.) Mass kg
(Est) Location Capture Type
165 GREEN 9/25/2011 M 11 139 SF Dodge Cr., ID Research
160 BLACK 5/26/2012 M 4 (68) Blewett Cr., BC Research
2001 GREEN 5/29/2012 M 11 95 Fedar Cr., ID Research
162 BLACK 5/29/2012 M 3 60 Blewett Cr., BC Research
2005 GREEN 8/23/2012 M 3 61 Abandon Cr., ID Research
3016 GREEN 7/21/2013 M 10 74 Hughes Meadows, ID Research
3019 GREEN 7/22/2013 M 4 49 Upper Priest Rv., ID Research
3020 GREEN 7/29/2013 M 3 49 Bugle Cr., ID Research
3013 GREEN 8/20/2013 F 16 75 Silver Cr., ID Research
238 BLACK 5/25/2014 M 9 58 Porcupine Cr., BC Research
236 BLACK 5/25/2014 M 8 90 Clearwater Cr., BC Research
236 BLACK 6/12/2014 M 6 93 Apex Cr., BC Research
4326 GREEN 6/13/2014 M 6 61 Jackson Cr., ID Research
246 BLACK 6/17/2014 M 8 102 Wildhorse Cr., BC Research
244 BLACK 6/17/2014 M 15 76 Wildhorse Cr., BC Research
392 RED 6/28/2014 M (4) 72 Hemlock Cr., WA Research
388 RED 7/19/2014 M (6) 96 LeClerc Cr., WA Research
389 RED 7/25/2014 F (9) 57 Le Clerc Cr., WA Research
391 RED 7/26/2014 M (5) 63 Jungle Cr., WA Research
390 RED 7/26/2014 F (4) 61 Sema Meadows, WA Research
4330 GREEN 8/22/2014 M 8 103 Trapper Cr., ID Research
4331 GREEN 8/24/2014 F (8) (79) Bugle Cr., ID Research
4332 GREEN 8/26/2014 M 16 105 Trapper Cr., ID Research
4333 GREEN 8/28/2014 M 3 53 Trapper Cr., ID Research
4305 GREEN 6/24/2015 F 6 47 Lime Cr., ID Research
4306 GREEN 7/18/2015 M (12) 113 Bugle Cr.,ID Research
4307 GREEN 8/23/2015 M (7) (125) Grass Cr., ID Research
601 RED 5/27/2016 M 7 88 SF Granite, WA Research
602 RED 6/9/2016 M 6 74 NF Harvey, WA Research
603 RED 6/27/2016 M 6 74 Willow Cr., WA Research
--- --- 8/23/2016 --- (1) (18) Boundary Cr., ID Research culvert, not tagged
4308 GREEN 7/17/2017 M (3) 62 Bugle Cr., ID Research
4309 GREEN 7/19/2017 M (3) 52 Trapper Cr., ID Research
4310 GREEN 7/19/2017 M (8) 65 Bugle Cr., ID Research
4329 GREEN 7/21/2017 M (4) 63 Trapper Cr., ID Research
4334 GREEN 7/23/2017 M (3) (68) Trapper Cr., ID Research
4335 GREEN 8/1/2017 M (6) 96 Trapper Cr., ID Research
4336 GREEN 8/24/2017 M (3) 61 Caribou Cr., ID Research
APPENDIX 2. Grizzly Bear Home Ranges
32
Figure A4. Radio locations and minimum convex (shaded) life range of male grizzly bear 144 in the Selkirk Mountains, 2008.
Figure A1. Radio locations and minimum convex (shaded) life range of male grizzly bear 103 in the Yaak River and Selkirk Mountains, 2006-07.
Figure A2. Radio locations and minimum convex (shaded) life range of male grizzly bear 119 in the Selkirk Mountains, 2008-09.
Figure A3. Radio locations and minimum convex (shaded) life range of female grizzly bear 138 in the Selkirk Mountains, 2008-09.
33
Figure A5. Radio locations and minimum convex (shaded) life range of management male grizzly bear 7005 in the Selkirk Mountains, 2008.
Figure A6. Radio locations and minimum convex (shaded) life range of female grizzly bear 150 in the Selkirk Mountains, 2008-09, 2014-16.
Figure A7. Radio locations and minimum convex (shaded) life range of male grizzly bear 155 in the Selkirk Mountains, 2008-10.
Figure A8. Radio locations and minimum convex (shaded) life range of female grizzly bear 161 in the Selkirk Mountains, 2009-10.
34
Figure A10. Radio locations and minimum convex (shaded) life range of female grizzly bear 165 in the Selkirk Mountains, 2009-10.
Figure A11. Radio locations and minimum convex (shaded) life range of female grizzly bear 171 in the Selkirk Mountains, 2009-10.
Figure A12. Radio locations and minimum convex (shaded) life range of female grizzly bear 8005 in the Selkirk Mountains, 2009-10.
Figure A9. Radio locations and minimum convex (shaded) life range of female grizzly bear 163 in the Selkirk Mountains, 2009-10.
35
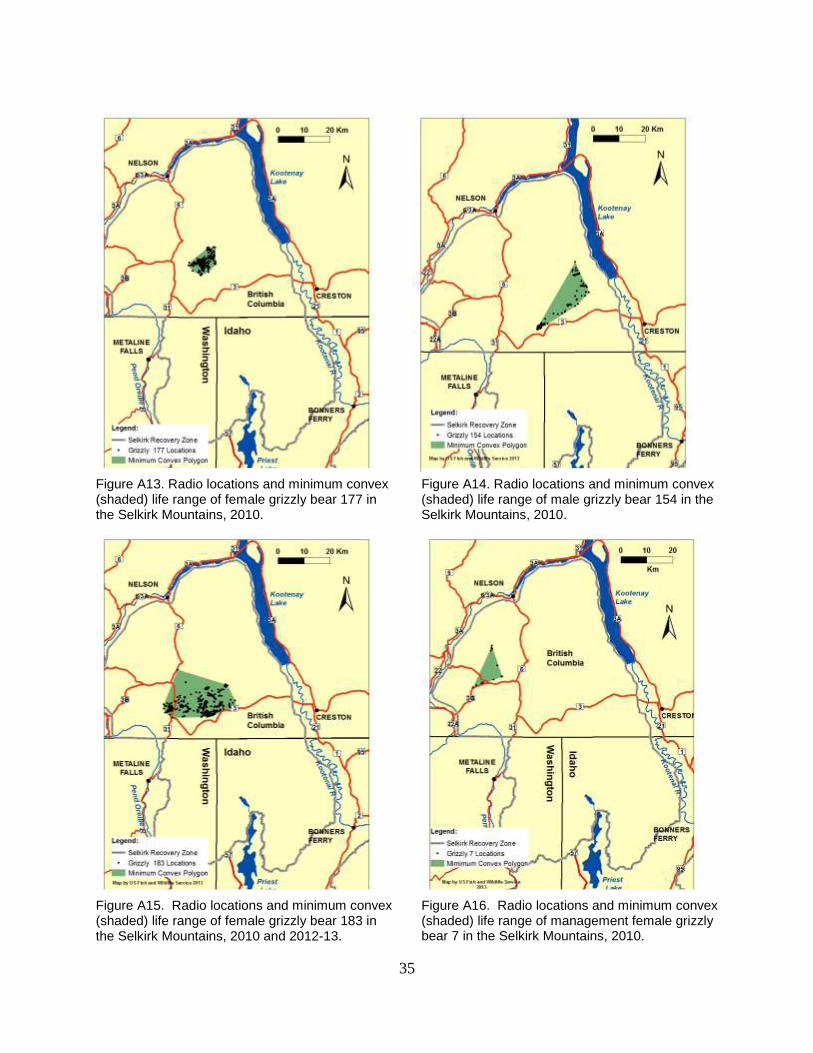
Figure A13. Radio locations and minimum convex (shaded) life range of female grizzly bear 177 in the Selkirk Mountains, 2010.
Figure A14. Radio locations and minimum convex (shaded) life range of male grizzly bear 154 in the Selkirk Mountains, 2010.
Figure A15. Radio locations and minimum convex (shaded) life range of female grizzly bear 183 in the Selkirk Mountains, 2010 and 2012-13.
Figure A16. Radio locations and minimum convex (shaded) life range of management female grizzly bear 7 in the Selkirk Mountains, 2010.
36
Figure A17. Radio locations and minimum convex (shaded) life range of management male grizzly bear 17 in the Selkirk Mountains, 2010.
Figure A18. Radio locations and minimum convex (shaded) life range of male grizzly bear 152 in the Selkirk Mountains, 2011-12.
Figure A19. Radio locations and minimum convex (shaded) life range of male grizzly bear 149 in the Selkirk Mountains, 2011.
Figure A20. Radio locations and minimum convex (shaded) life range of female grizzly bear 12003 in the Selkirk Mountains, 2012-14, 2017.
37
Figure A21. Radio locations and minimum convex (shaded) life range of female grizzly bear 12006 in the Selkirk Mountains, 2012-14.
Figure A22. Radio locations and minimum convex (shaded) life range of female grizzly bear 12008 in the Selkirk Mountains, 2012-14, 2017.
Figure A23. Radio locations and minimum convex (shaded) life range of male grizzly bear 221 in the Selkirk Mountains, 2012-13.
Figure A24. Radio locations and minimum convex (shaded) life range of male grizzly bear 174 in the Selkirk Mountains, 2012-13, 2015.
38
Figure A26. Radio locations and minimum convex (shaded) life range of female grizzly bear 13017 in the Selkirk Mountains, 2013-16.
Figure A27. Radio locations and minimum convex (shaded) life range of female grizzly bear 13021 in the Selkirk Mountains, 2013-15.
Figure A25. Radio locations and minimum convex (shaded) life range of female grizzly bear 12016 in the Selkirk Mountains, 2013-16.
Figure A28. Radio locations and minimum convex (shaded) life range of female grizzly bear 13023 in the Selkirk Mountains, 2013-15.
39
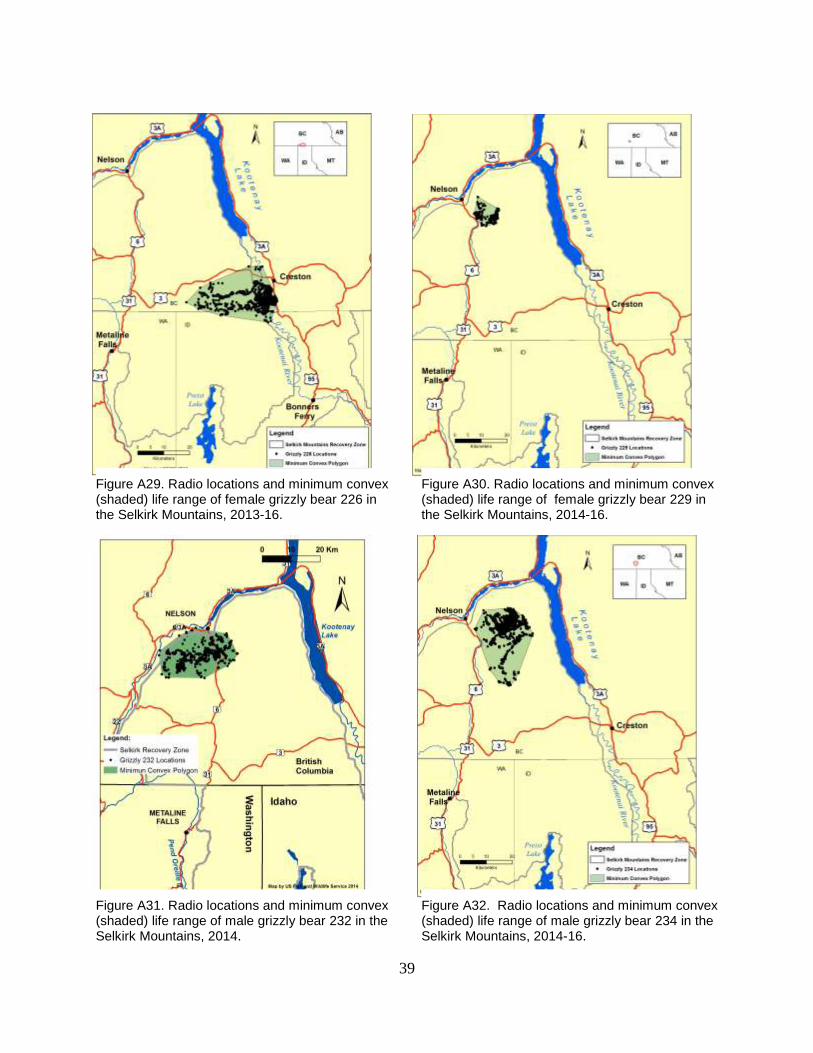
Figure A29. Radio locations and minimum convex (shaded) life range of female grizzly bear 226 in the Selkirk Mountains, 2013-16.
Figure A30. Radio locations and minimum convex (shaded) life range of female grizzly bear 229 in the Selkirk Mountains, 2014-16.
Figure A31. Radio locations and minimum convex (shaded) life range of male grizzly bear 232 in the Selkirk Mountains, 2014.
Figure A32. Radio locations and minimum convex (shaded) life range of male grizzly bear 234 in the Selkirk Mountains, 2014-16.
40
Figure A33. Radio locations and minimum convex (shaded) life range of male grizzly bear 248 in the Selkirk Mountains, 2014-16.
Figure A34. Radio locations and minimum convex (shaded) life range of male grizzly bear 250 in the Selkirk Mountains, 2014-15.
Figure A36. Radio locations and minimum convex (shaded) life range of male grizzly bear 227 in the Selkirk Mountains, 2014-15.
Figure A35. Radio locations and minimum convex (shaded) life range of male grizzly bear 4250 in the Selkirk Mountains, 2014-15.
41
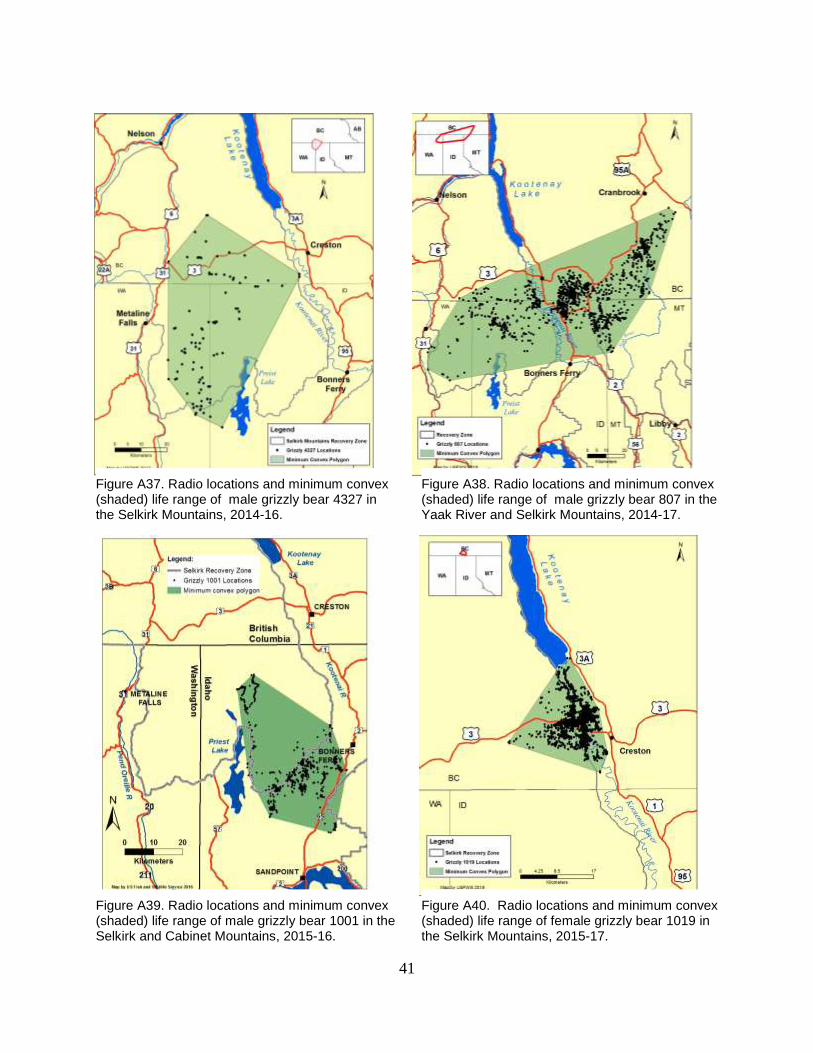
Figure A37. Radio locations and minimum convex (shaded) life range of male grizzly bear 4327 in the Selkirk Mountains, 2014-16.
Figure A38. Radio locations and minimum convex (shaded) life range of male grizzly bear 807 in the Yaak River and Selkirk Mountains, 2014-17.
Figure A39. Radio locations and minimum convex (shaded) life range of male grizzly bear 1001 in the Selkirk and Cabinet Mountains, 2015-16.
Figure A40. Radio locations and minimum convex (shaded) life range of female grizzly bear 1019 in the Selkirk Mountains, 2015-17.
42
Figure A37. Radio locations and minimum convex (shaded) life range of female grizzly bear 1020 in the Selkirk Mountains, 2014-17.
Figure A38. Radio locations and minimum convex (shaded) life range of male grizzly bear 1002 in the Selkirk Mountains, 2016-17.
Figure A39. Radio locations and minimum convex (shaded) life range of female grizzly bear 1003 in the Selkirk Mountains, 20165-17.
Figure A40. Radio locations and minimum convex (shaded) life range of male grizzly bear 1024 in the Selkirk Mountains, 2016.
43
Figure A41. Radio locations and minimum convex (shaded) life range of male grizzly bear 4011 in the Selkirk Mountains, 2016-17.
Figure A42. Radio locations and minimum convex (shaded) life range of female grizzly bear 4070 in the Selkirk Mountains, 2016-17.
Figure A43. Radio locations and minimum convex (shaded) life range of male grizzly bear 247 in the Selkirk Mountains, 2016.
Figure A44. Radio locations and minimum convex (shaded) life range of male grizzly bear 1021 in the Selkirk Mountains, 2016.
44
Figure A45. Radio locations and minimum convex (shaded) life range of management male grizzly bear 922 in the Yaak River and Selkirk Mountains, 2016-17.
Figure A46. Radio locations and minimum convex (shaded) life range of male grizzly bear 1006 in the Selkirk Mountains, 2017.
Figure A47. Radio locations and minimum convex (shaded) life range of male grizzly bear 1007 in the Selkirk Mountains, 2017.
Figure A44. Radio locations and minimum convex (shaded) life range of male grizzly bear 1008 in the Selkirk Mountains, 2017.
45
Figure A45. Radio locations and minimum convex (shaded) life range of male grizzly bear 1009 in the Selkirk Mountains, 2017.
Figure A46. Radio locations and minimum convex (shaded) life range of female grizzly bear 1010 in the Selkirk Mountains, 2017.
Figure A47. Radio locations and minimum convex (shaded) life range of male grizzly bear 23 in the Selkirk Mountains, 2017.