Proceedings of the International Academy of Ecology and Environmental Sciences, 2015, 5(4): 104-127 IAEES www.iaees.org Article Cachar tropical semi-evergreen forest type of Northeast India: status of species diversity, distribution and population structure Koushik Majumdar, B. K. Datta Plant Taxonomy and Biodiversity Laboratory, Department of Botany, Tripura University, Suryamaninagar- 799022 Tripura, India E-mail: [email protected]Received 27 April 2015; Accepted 15 June 2015; Published online 1 September 2015 Abstract Conservation of threatened species in most cases is difficult because of incomplete knowledge about their actual distribution, population and habitat ecology. Quantitative vegetation inventory was applied to analyse phytosociological structure of Cachar tropical semi–evergreen forest type in Northeast India, which is consider as a rare forest sub–type. Total 9, 500 × 10m (0.5 ha) sized line transects were laid in Tripura. Overall 3,391individuals of woody species were measured in 4.5 ha analysis, which represented total 167 species. Out of 167 species, 138 species were tree, 14 were shrubs, 10 woody climbers, 3 bamboos and 2 palm species. Again, taxonomically out of 167 species only 6 species was monocot; deciduous and evergreen ratio was 98: 69. Further, out of 167 species 95 species showed aggregated distribution than 72 random distributions. Stem density was ranged 566–964 ha –1 , basal area 19.22–52.82 m 2 ha –1 ; but most species listed with very low Important Value Index (IVI), where 51 species identified as very rare (<2 individuals). Overall density was declined linearly (r 2 adj =0.62; p>0.05) from predominant to very rare population group (r 2 adj is adjusted correlation co-efficient). Stem density–girth relation was significantly quadratic and showed highest coefficient value for sapling (r 2 adj =0.99; p<0.05) than adult density (r 2 adj =0.96; p<0.001); however, stem density was declined across the height classes (r 2 adj =0.56; p<0.05). Present findings demonstrate the high conservation value of this habitat, as umbrella species (Dipterocarpus turbinatus) was red listed as critically endangered by International Union for Conservation of Nature and Natural Resources (IUCN) with 13 globally threatened plants. Present analysis offers easy scope for effective habitat management and strategies for species conservation and restoration through ecological niche modeling tool. Keywords semi–evergreen forest; diversity and structure; population inventory; keystone and singleton taxa; species conservation. Proceedings of the International Academy of Ecology and Environmental Sciences ISSN 22208860 URL: http://www.iaees.org/publications/journals/piaees/onlineversion.asp RSS: http://www.iaees.org/publications/journals/piaees/rss.xml Email: [email protected]EditorinChief: WenJun Zhang Publisher: International Academy of Ecology and Environmental Sciences
Transcript
Proceedings of the International Academy of Ecology and Environmental Sciences, 2015, 5(4): 104-127
IAEES www.iaees.org
Article
Cachar tropical semi-evergreen forest type of Northeast India: status of species diversity, distribution and population structure
Koushik Majumdar, B. K. Datta Plant Taxonomy and Biodiversity Laboratory, Department of Botany, Tripura University, Suryamaninagar- 799022 Tripura,
and different macro–fungus species were also observed under canopy of D. turbinatus.
Table 1 Species diversity, dominance and stand structure of Cachar tropical semi– evergreen forest type of Tripura in Northeast India.
Plo
ts
No.
of
Spec
ies
No.
of
Gen
us
No.
of
Fam
ily
Sha
nnon
’s
Inde
x
Sim
pson
’s
Inde
x
Pie
lou’
s In
dex
Den
sity
ha
-1
Bas
al
Are
a m
2 ha-1
IVI
of
D. t
urbi
natu
s
P1 53 48 33 3.51 0.05 0.88 812 19.22 91.14
P2 51 41 26 3.22 0.08 0.82 566 39.84 122.3
P3 40 33 21 3.03 0.09 0.82 964 50.88 131.1
P4 53 48 35 3.22 0.08 0.81 680 47.47 127.41
P5 57 49 32 3.15 0.12 0.78 880 50.71 133.68
P6 39 34 23 3.08 0.08 0.84 764 33.99 121.31
P7 65 53 36 3.53 0.07 0.85 648 20.67 96.8
P8 63 55 37 2.97 0.17 0.72 634 44.16 150.8
P9 53 42 32 2.90 0.15 0.73 834 52.82 153.84
Mean± Sd
52.67± 8.86
44.78± 7.81
30.56± 5.81
3.18±0.22
0.10± 0.04
0.81± 0.05
753.56± 130.53
39.97± 12.81
125.38±21.15
109
Proceedings of the International Academy of Ecology and Environmental Sciences, 2015, 5(4): 104-127
IAEES www.iaees.org
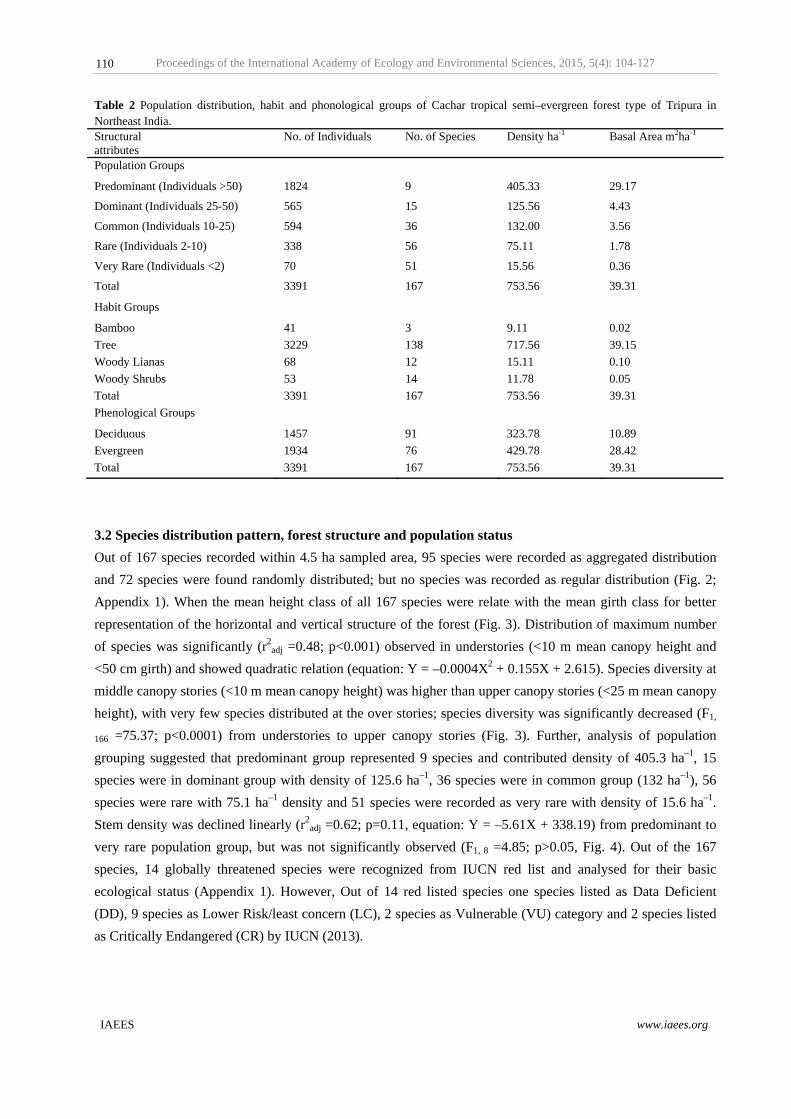
Table 2 Population distribution, habit and phonological groups of Cachar tropical semi–evergreen forest type of Tripura in Northeast India. Structural attributes
No. of Individuals No. of Species Density ha-1 Basal Area m2ha-1
Population Groups
Predominant (Individuals >50) 1824 9 405.33 29.17
Dominant (Individuals 25-50) 565 15 125.56 4.43
Common (Individuals 10-25) 594 36 132.00 3.56
Rare (Individuals 2-10) 338 56 75.11 1.78
Very Rare (Individuals <2) 70 51 15.56 0.36
Total 3391 167 753.56 39.31
Habit Groups
Bamboo 41 3 9.11 0.02
Tree 3229 138 717.56 39.15
Woody Lianas 68 12 15.11 0.10
Woody Shrubs 53 14 11.78 0.05
Total 3391 167 753.56 39.31
Phenological Groups
Deciduous 1457 91 323.78 10.89
Evergreen 1934 76 429.78 28.42
Total 3391 167 753.56 39.31
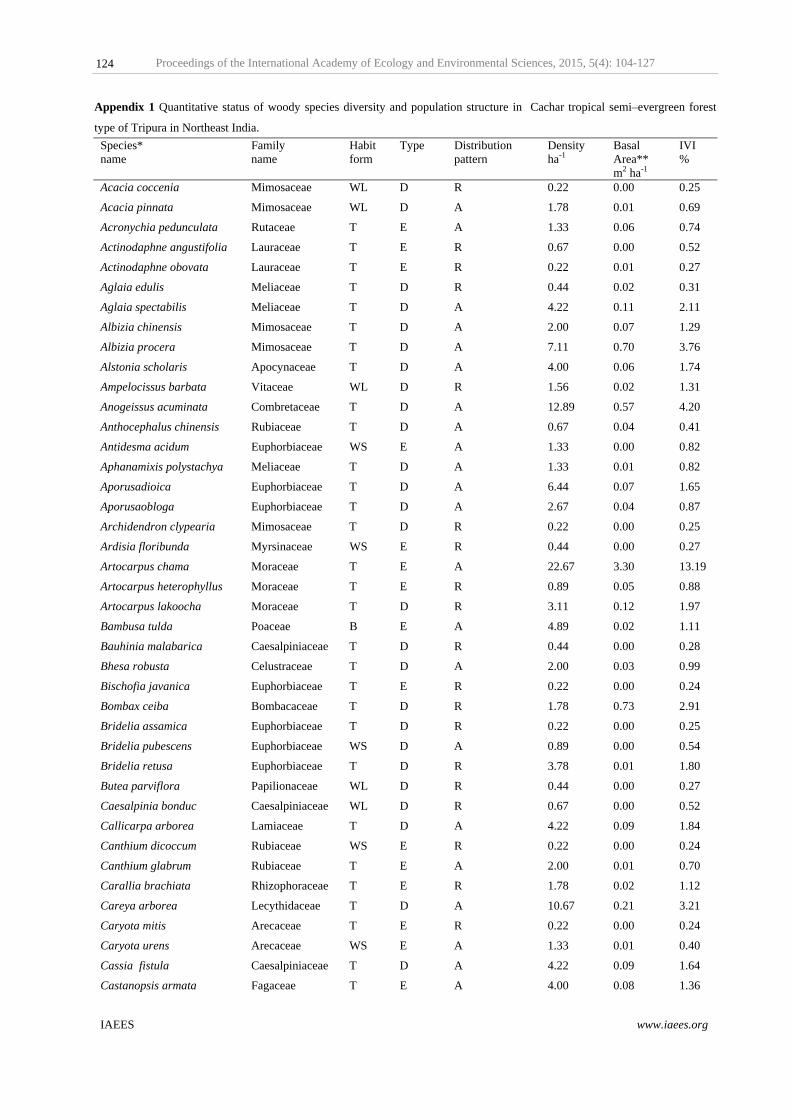
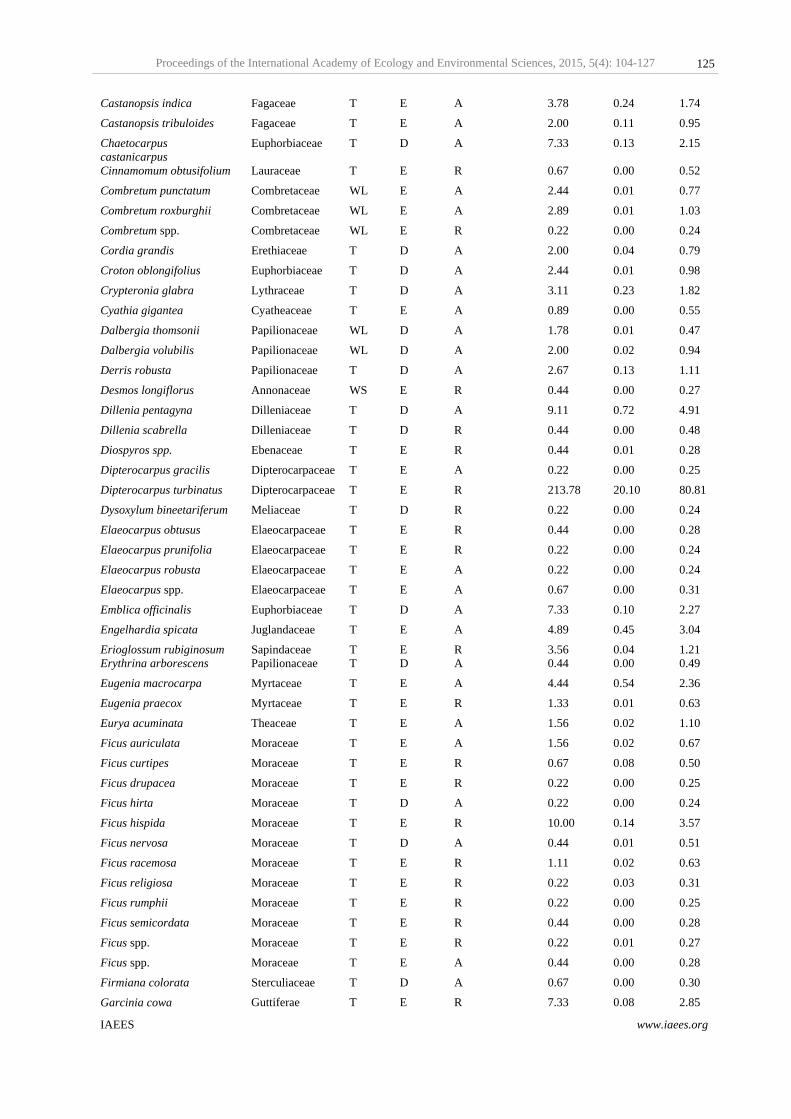
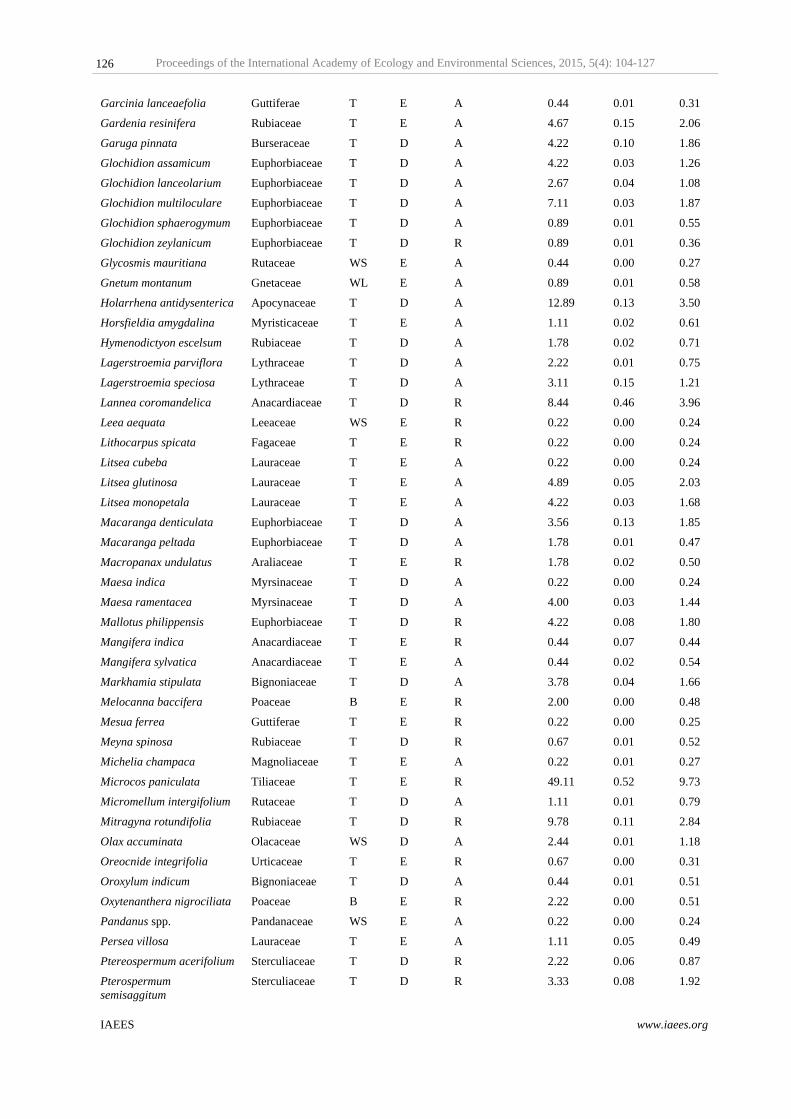
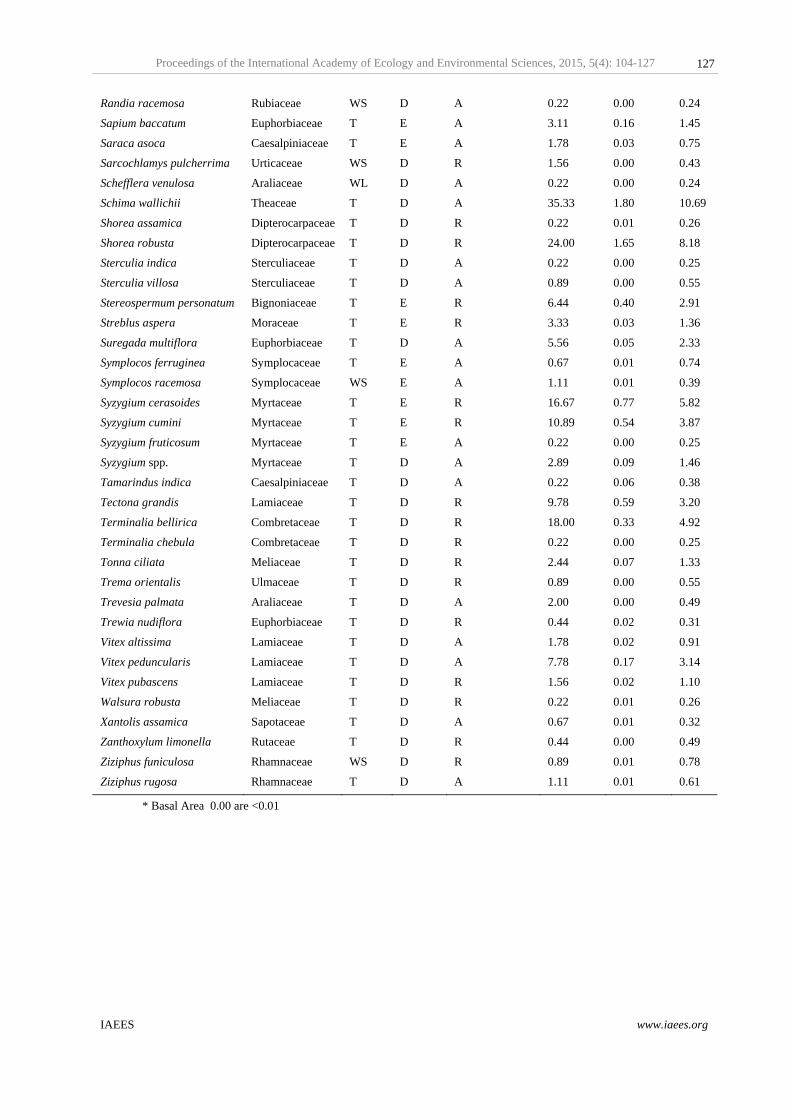
3.2 Species distribution pattern, forest structure and population status
Out of 167 species recorded within 4.5 ha sampled area, 95 species were recorded as aggregated distribution
and 72 species were found randomly distributed; but no species was recorded as regular distribution (Fig. 2;
Appendix 1). When the mean height class of all 167 species were relate with the mean girth class for better
representation of the horizontal and vertical structure of the forest (Fig. 3). Distribution of maximum number
of species was significantly (r2adj =0.48; p<0.001) observed in understories (<10 m mean canopy height and
<50 cm girth) and showed quadratic relation (equation: Y = –0.0004X2 + 0.155X + 2.615). Species diversity at
middle canopy stories (<10 m mean canopy height) was higher than upper canopy stories (<25 m mean canopy
height), with very few species distributed at the over stories; species diversity was significantly decreased (F1,
166 =75.37; p<0.0001) from understories to upper canopy stories (Fig. 3). Further, analysis of population
grouping suggested that predominant group represented 9 species and contributed density of 405.3 ha–1, 15
species were in dominant group with density of 125.6 ha–1, 36 species were in common group (132 ha–1), 56
species were rare with 75.1 ha–1 density and 51 species were recorded as very rare with density of 15.6 ha–1.
Stem density was declined linearly (r2adj =0.62; p=0.11, equation: Y = –5.61X + 338.19) from predominant to
very rare population group, but was not significantly observed (F1, 8 =4.85; p>0.05, Fig. 4). Out of the 167
species, 14 globally threatened species were recognized from IUCN red list and analysed for their basic
ecological status (Appendix 1). However, Out of 14 red listed species one species listed as Data Deficient
(DD), 9 species as Lower Risk/least concern (LC), 2 species as Vulnerable (VU) category and 2 species listed
as Critically Endangered (CR) by IUCN (2013).
110
IAEES
F
Fig. 3 Rel
Cachar tro
Proceedings
Fig. 2 Species d
lationship betw
opical semi-ever
of the Internati
distribution patt
ween mean girth
rgreen forest of
ional Academy
tern (variance to
h and height cla
f Tripura.
y of Ecology and
o mean ratio) in
asses showing t
d Environmenta
n Cachar tropic
the distribution
al Sciences, 20
al semi-evergre
n of 167 species
15, 5(4): 104-12
w
een forest of Tr
s in different ca
27
www.iaees.org
ipura.
anopy layers inn
111
IAEES
Fig. 4 Distropical se
Tota
basal cov
turbinatu
in the pre
D. turbin
coroman
total basa
obtain th
sapling (
was mor
5). Over
distribute
area (8.2
was very
Proceedings
stribution of 167emi-evergreen f
al 3,392 indi
ver area was
us alone contr
esent Cachar
natus, A.cham
ndelica and S.
al area (30.22
he distributio
(<30 cm) and
e or less reve
rall distributi
ed within 90–
26 m2ha–1) wa
y less (7.78 ha
of the Internati
7 species in difforest.
ividuals were
s 39.97 m2ha
ributed 28.37
Tropical Sem
ma, S. wallich
. cumini; whi
2 m2ha–1). W
on of stems
d juvenile gro
eres ‘J’ shape
ion of basal
–150 cm girt
as increased
a–1) compared
ional Academy
fferent populatio
e measured w
a–1 and rang
7% density (2
mi–evergreen
hii, M. panicu
ich encompas
When overall d
along differe
oup (<60 cm)
ed, suggested
area along
th and very fe
at highest gir
d to other age
y of Ecology and
on group (Pred
with mean de
ged between
213.78 ha–1),
n forest type o
ulata, S. ceras
ssed 54.40 %
density and b
ent age class
. Whereas, o
d that the indi
the girth cl
few trees wer
rth class (>30
e classes (Fig
d Environmenta
ominant, domin
ensity of 753
19.22–52.82
50.29% basa
of Tripura. To
soides, T. bel
% ( density 41
basal area wa
ses, maximum
overall distrib
ividuals pred
lasses showe
e exhibited a
00 cm), but n
. 5).
al Sciences, 20
nant, common,
3.56 ha–1 (ran
m2ha–1 amo
al area (20.10
op ten domina
llirica, D. pen
0 ha–1) of tot
as grouped in
m density w
bution of stem
dominate at th
ed that maxi
at relatively h
number of vo
15, 5(4): 104-12
w
rare and very r
nge 566–964
ong the studi
m2ha–1) and
ant tree comp
ntagyna, A. a
tal density an
n different gir
as observed
ms in differen
he lowest size
imum mature
higher girth c
oluminous tre
27
www.iaees.org
rare ) in Cachar
ha–1). Mean
ied plots. D.
80.56 % IVI
position were
acuminata, L.
nd 75.60% of
rth classes to
between the
nt age groups
es class (Fig.
e trees were
classes. Basal
ee population
r
n
I
e
f
o
e
s
.
e
l
n
112
IAEES
F
Sap
populatio
(Fig. 6a)
=0.96; p
mostly li
6c).
4 Discus
4.1 Com
Tropical
between
annual ra
by D. tu
types (2B
Adinaspp
in fragme
was foun
co–domi
and seve
anthropo
from oth
Proceedings
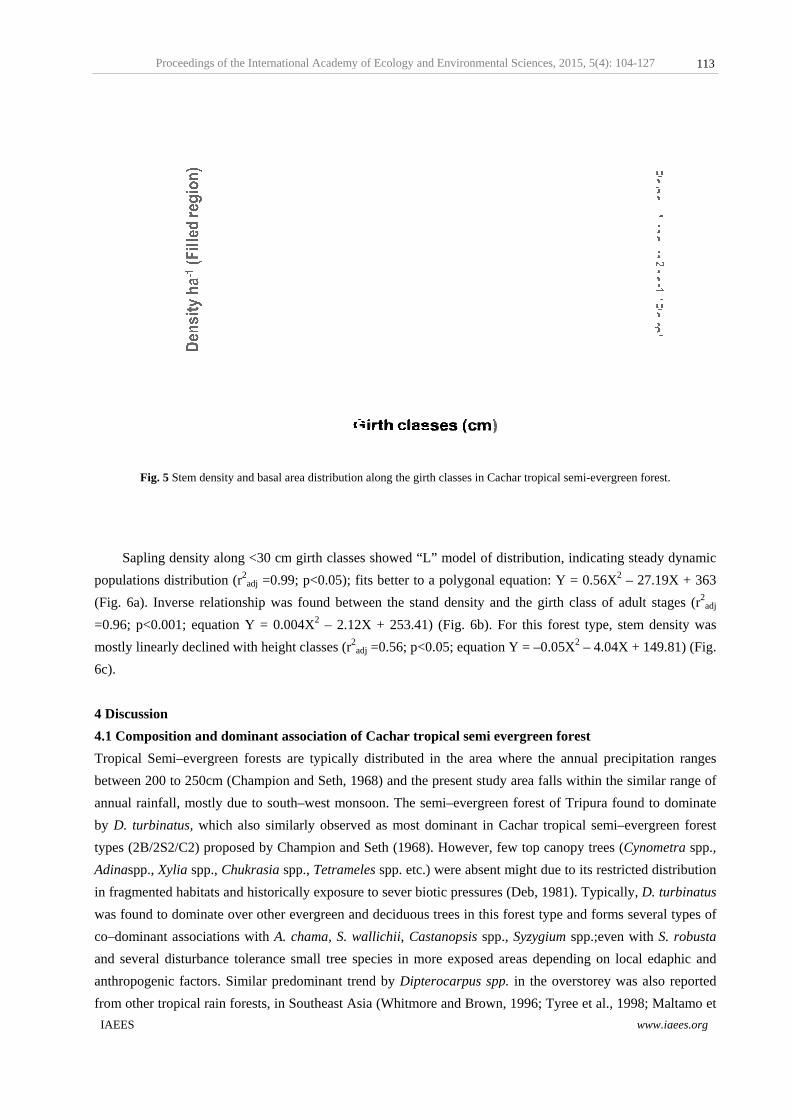
Fig. 5 Stem den
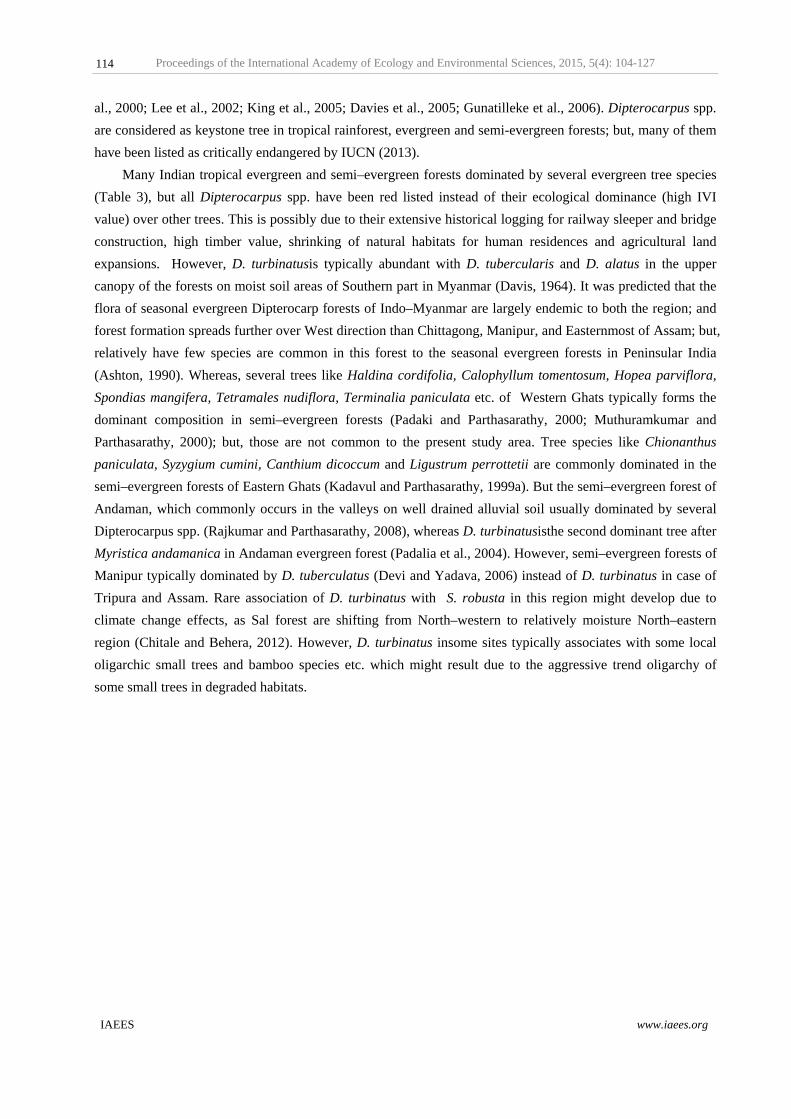
ling density a
ons distributi
). Inverse rel
<0.001; equa
inearly declin
ssion
mposition and
Semi–evergr
200 to 250cm
ainfall, mostl
rbinatus, wh
B/2S2/C2) pr
p., Xylia spp.
ented habitat
nd to dominat
nant associat
eral disturban
ogenic factors
her tropical ra
of the Internati
nsity and basal a
along <30 cm
on (r2adj =0.9
ationship wa
ation Y = 0.0
ned with heigh
d dominant a
reen forests
m (Champion
ly due to sou
hich also simi
roposed by C
, Chukrasia s
s and historic
te over other
tions with A.
nce tolerance
s. Similar pre
ain forests, in
ional Academy
area distribution
m girth classe
99; p<0.05); f
as found betw
004X2 – 2.12
ht classes (r2a
association o
are typically
n and Seth, 1
uth–west mon
ilarly observ
Champion and
spp., Tetrame
cally exposur
evergreen an
chama, S. w
small tree s
edominant tre
Southeast As
y of Ecology and
n along the girt
es showed “L
fits better to
ween the stan
2X + 253.41)
adj =0.56; p<0
f Cachar tro
y distributed
968) and the
nsoon. The se
ed as most d
d Seth (1968)
eles spp. etc.)
re to sever bio
nd deciduous
wallichii, Cas
pecies in mo
end by Dipte
sia (Whitmor
d Environmenta
th classes in Ca
L” model of d
a polygonal e
nd density an
) (Fig. 6b). F
0.05; equation
opical semi ev
in the area w
present study
emi–evergree
dominant in C
). However, f
) were absent
otic pressures
trees in this
stanopsis spp
ore exposed a
erocarpus spp
re and Brown
al Sciences, 20
char tropical se
distribution, i
equation: Y =
nd the girth c
For this fores
n Y = –0.05X
vergreen for
where the an
y area falls w
en forest of T
Cachar tropic
few top canop
t might due to
s (Deb, 1981)
forest type a
p., Syzygium s
areas depend
p. in the ove
n, 1996; Tyre
15, 5(4): 104-12
w
emi-evergreen f
indicating ste
= 0.56X2 – 2
class of adult
st type, stem
X2 – 4.04X +
rest
nnual precipit
within the sim
Tripura found
cal semi–eve
py trees (Cyn
o its restricted
). Typically, D
and forms sev
spp.;even wit
ding on local
rstorey was a
e et al., 1998
27
www.iaees.org
forest.
eady dynamic
27.19X + 363
t stages (r2adj
m density was
149.81) (Fig.
tation ranges
milar range of
d to dominate
rgreen forest
nometra spp.,
d distribution
D. turbinatus
veral types of
th S. robusta
edaphic and
also reported
8; Maltamo et
c
3
j
s
.
s
f
e
t
,
n
s
f
a
d
d
t
113
Proceedings of the International Academy of Ecology and Environmental Sciences, 2015, 5(4): 104-127
IAEES www.iaees.org
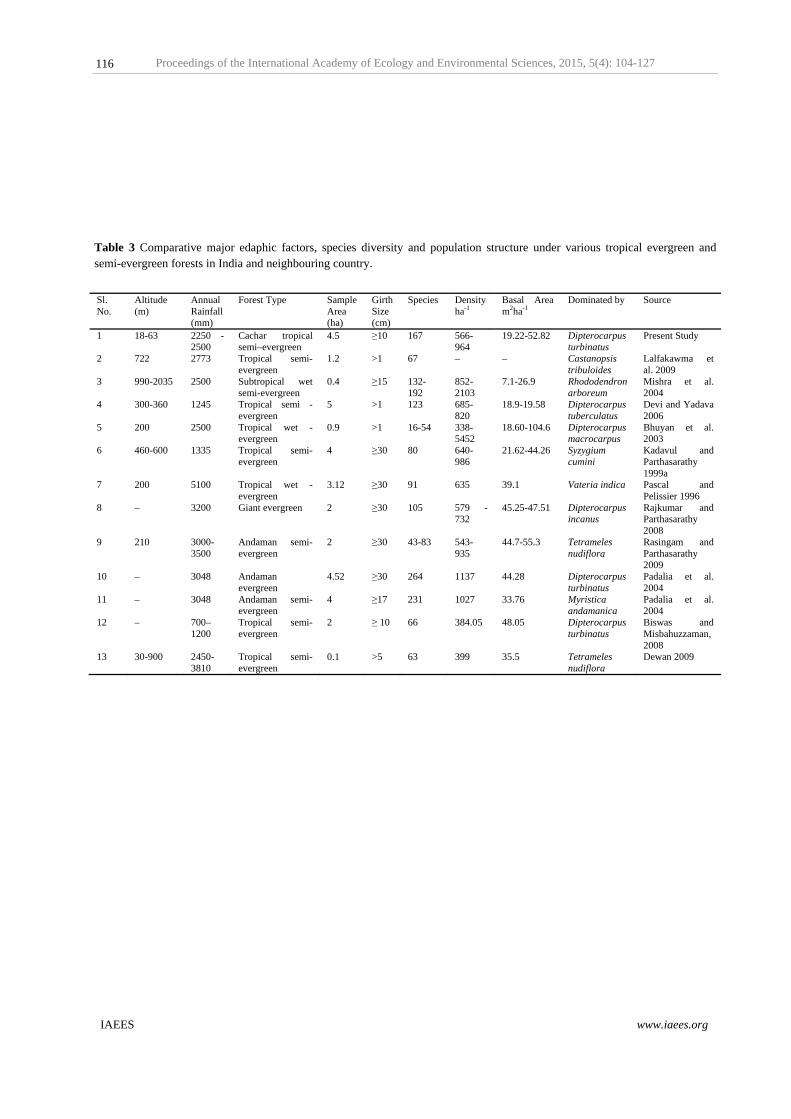
al., 2000; Lee et al., 2002; King et al., 2005; Davies et al., 2005; Gunatilleke et al., 2006). Dipterocarpus spp.
are considered as keystone tree in tropical rainforest, evergreen and semi-evergreen forests; but, many of them
have been listed as critically endangered by IUCN (2013).
Many Indian tropical evergreen and semi–evergreen forests dominated by several evergreen tree species
(Table 3), but all Dipterocarpus spp. have been red listed instead of their ecological dominance (high IVI
value) over other trees. This is possibly due to their extensive historical logging for railway sleeper and bridge
construction, high timber value, shrinking of natural habitats for human residences and agricultural land
expansions. However, D. turbinatusis typically abundant with D. tubercularis and D. alatus in the upper
canopy of the forests on moist soil areas of Southern part in Myanmar (Davis, 1964). It was predicted that the
flora of seasonal evergreen Dipterocarp forests of Indo–Myanmar are largely endemic to both the region; and
forest formation spreads further over West direction than Chittagong, Manipur, and Easternmost of Assam; but,
relatively have few species are common in this forest to the seasonal evergreen forests in Peninsular India
(Ashton, 1990). Whereas, several trees like Haldina cordifolia, Calophyllum tomentosum, Hopea parviflora,
Spondias mangifera, Tetramales nudiflora, Terminalia paniculata etc. of Western Ghats typically forms the
dominant composition in semi–evergreen forests (Padaki and Parthasarathy, 2000; Muthuramkumar and
Parthasarathy, 2000); but, those are not common to the present study area. Tree species like Chionanthus
paniculata, Syzygium cumini, Canthium dicoccum and Ligustrum perrottetii are commonly dominated in the
semi–evergreen forests of Eastern Ghats (Kadavul and Parthasarathy, 1999a). But the semi–evergreen forest of
Andaman, which commonly occurs in the valleys on well drained alluvial soil usually dominated by several
Dipterocarpus spp. (Rajkumar and Parthasarathy, 2008), whereas D. turbinatusisthe second dominant tree after
Myristica andamanica in Andaman evergreen forest (Padalia et al., 2004). However, semi–evergreen forests of
Manipur typically dominated by D. tuberculatus (Devi and Yadava, 2006) instead of D. turbinatus in case of
Tripura and Assam. Rare association of D. turbinatus with S. robusta in this region might develop due to
climate change effects, as Sal forest are shifting from North–western to relatively moisture North–eastern
region (Chitale and Behera, 2012). However, D. turbinatus insome sites typically associates with some local
oligarchic small trees and bamboo species etc. which might result due to the aggressive trend oligarchy of
some small trees in degraded habitats.
114
IAEES
Fig. 6 Den
semi-everg
Proceedings
nsity-mid value
green forest.
of the Internati
e girth of sapling
ional Academy
g (a) and adult
y of Ecology and
(b), density - m
d Environmenta
mid value of hei
al Sciences, 20
ght (c) classes r
15, 5(4): 104-12
w
relationship in
27
www.iaees.org
Cachar tropicall
115
Proceedings of the International Academy of Ecology and Environmental Sciences, 2015, 5(4): 104-127
IAEES www.iaees.org
Table 3 Comparative major edaphic factors, species diversity and population structure under various tropical evergreen and semi-evergreen forests in India and neighbouring country.
Proceedings of the International Academy of Ecology and Environmental Sciences, 2015, 5(4): 104-127
4.2 Tree species diversity and habitat structure
Total number of 167 woody species recorded in the present study was greater than 123 species (Devi and
Yadava, 2006) and 85 species (Chowdhury et al., 2000) from tropical semi–evergreen forests of Indo–
Myanmar region. Also found to be higher than the 89 species reported by Kadavul and Parthasarathy (1999a)
from Eastern Ghats and 91 species from tropical wet evergreen forest of Western Ghats (Pascal and Pelissier,
1996). Overall 167 species (range 39–65) was also greater than Hossain et al. (1997), Nath et al. (1998) and
Biswas and Misbahuzzaman (2010); where 85, 85 and 66 species respectively were reported from D.
turbinatus dominated semi–evergreen forests of Chittagong Hill Tracts of Bangladesh. High species richness
in this forest types may due to lower altitudinal areas (mean 41.95m amsl) and geographical confluence of
Indo–Myanmar biogeographic zone (Eastern Himalayan range). Because, increasing species richness at lower
elevation is expectable both in case of whole floras and smaller spatial scales (Korner, 1992). However, 167
species was also very less than 244 species in Malaysia (Manokaran and Kochummen, 1987), 214 species in
Sarawak (Proctor et al. 1983) and 198 species in Tropical forest of Asia (Nicholson 1965). Mean Shannon
diversity index obtained for the present study (3.18) was within the general limit of 1.5–3.5 reported by Kent
and Coker (1992) and Parthasarathy (2001). Diversity is quite high because of several rare species in this forest
formation. Stand density ranges between 566–964 ha–1, which was closed to Semi–evergreen forest of
Northeast (685–820 tree ha–1; Devi and Yadava, 2006) and Eastern Ghats (640–986 ha–1; Kadavul and
Parthasarathy, 1999a). Mean density value also quite higher than Hossain et al. (1997), 369 stem ha–1; Nath et
al. (1998), 381 stem ha–1 and Biswas and Misbahuzzaman (2010) 384.05 stem ha–1 in Bangladesh. The mean
basal area of the present forest type was 39.97 m2ha–1, which was ranged between 19.22–52.82 m2ha–1 and
found slightly greater than the pantropical average of 32 m2ha–1 (Dawkins 1959) and semi–evergreen forest in
Kalrayan hills (33.7 m2ha–1) and Shervarayan hills (34.9 m2ha–1) of Eastern Ghats (Kadavul and Parthasarathy,
1999a). While, mean basal area of this community was greater than 18.9–19.58 m–2 ha–1 (Devi and Yadava,
2006), closed to 48.05 m2ha–1 (Nath et al., 1998) and 52.05 m2ha–1 (Biswas and Misbahuzzaman, 2010) in the
adjacent region (Table 3). 4.3 Species distribution patterns Maximum number of trees was in aggregated distribution pattern in this forest type, from plain to undulated
land forms. Habitat undulation and degree of slope can also lead to higher patchy distributions (Hubbell and
Foster, 1983). Winged seeds of A. scholaris, B. ceiba, D. turbinatus, H. antidysenterica, P. acerifolium, S.
wallichii, S. robustaetc. randomly disperse by wind. Aggregated pattern occurs due to random dispersal of
seeds over a heterogeneous environment or due to both seeded and non–seeded regeneration capacities of
some trees (Feller, 1943). For instance, M. paniculata, M. rotundifolia, S. robusta, H. antidysenterica etc. have
high coppicing ability. Seed shape, size, presence of any special appendages and agents also determine species
distribution. However, clumping or aggregated distribution patterns of trees may occur due to relatively larger
size and weight of fruits (e.g. A. chama, C. arborea) which may not disperse over long distance. Without any
strong agents, some seeds may not distribute randomly and less frugivore diversity may also results aggregated
distribution. Especially, distribution and diversity of Ficus spp. or other wild fruit yielding trees intensely
reliant on the frugivore diversity in this forest (Majumdar et al., 2012). Present study reflected that most
dominant trees or several shrub species appears to have greater ecological amplitude with respect to this forest
formation, which might increase this patchy condition and also commonly observed in various other tropical
forests (Ashton, 1969; Whitmore and Burnham, 1975; Hubbell, 2001; Forman and Hahn, 1980; Parthasarathy
and Karthikeyan, 1997). Species which observed as random distributional pattern were mostly with small
individuals and rare may due to less dispersal and regeneration capacity in this association or any edaphic
restriction and competition by co–dominant species for resources. In general, findings of the study was
117
Proceedings of the International Academy of Ecology and Environmental Sciences, 2015, 5(4): 104-127
IAEES www.iaees.org
confirms the hypothesis that clumping or aggregated distribution pattern of tree is the typical characteristic of
natural forests in tropical to temperate climates of the world (Armesto and Pickett, 1985). 4.4 Tree girth–height attributes and population structure
The shape of overall density– girth distribution of tree species stated inverted J–curve, with increasing girth
density of trees was decreased; which is a good indication of natural forest (Nath et al., 2005). Since, historic
disturbances can be predicted by the multimodal basal area distributions (Maltamo et al., 2000); and the
productivity of the forest was decrease across adult girth classes as basal area was decreased which indicated
the historic logging activities and enormous demand for fuel wood by local inhabitants of Tripura. However,
7.78 ha–1 density (1.03%) of trees in the highest girth class (>300 cm) due to old voluminous D. turbinatus
(max. 540 cm girth), A. chama (max. 347 cm girth), B. ceiba (max. 572 cm girth) and E. spicata (max. 433 cm
girth) etc. were persisted under strict protection especially within the Sanctuary boundary and, therefore these
also representing high basal cover area (8.26 m2ha–1). However, only 3.00% individual trees were in the
highest girth class (>80 cm); D. turbinatus had the highest relative density (9.38%) and relative basal cover
area (23.30%) recorded from similar forest type in neighbouring country of Bangladesh (Biswas and
Misbahuzzaman, 2010). D. tuberculatus exhibited very low in sapling and adult population than higher
proportion of seedlings, and relatively adult trees (>40–50 cm GBH) were absent in semi–evergreen forest of
Manipur (Devi and Yadava, 2006). Though, D. turbinatus represented 28.37 % relative density, 50.54 %
relative basal cover area and 80.08 % IVI (out of 300) in present study area. These suggested the potentiality
and dynamic nature of lowland D. turbinatus dominated semi–evergreen forest of Tripura.
The greatest rates of height growth for a given girth at breast height increment were found among the
understory and midstorey species. Analysis of sapling (<30cm girth) and adult (>30cm) girth classes
distribution was also reverse J–shaped pattern. About 40.48% of trees were in advance sapling stages (<30cm
girth), which included many adult small sized tree species of understory. Significant inverse relation was
detected among the pole sized girth classes (≥ 10 –<30 cm), which indicated that the saplings population was
significantly (F2,3 =1053.05; p=0.02) established in this forest type (Fig. 6a). Population of adult trees was
declined (F2,9 =107.13; p=0.001) across higher girth classes and also showed significant inverse relation (Fig.
6b); tree density in old aged class category (>200–300 cm girth) might reduce due to historic illegal removal of
mature D. turbinatus trees. Low mature population in the larger girth classes was also similarly observed in
other tropical forests (Muthuramkumar et al., 2006). This indicated that present tropical semi–evergreen forest
understorey was dominated by shade tolerant species and their regeneration in moist forest floor and in
relatively shortage of light was fair which rather influenced by spreading canopy of D. turbinatus. However, S.
robusta and other local oligarchic small tree species has also non–seeded regeneration capabilities (Pandey and
Shukla, 2001; Majumdar et al., 2012) compared to D. turbinatus, A.chama, B. ceiba etc. Regeneration and
distribution of D. turbinatus strongly depends on its seed traits, which also has short distance dispersal aptitude,
only ≤40 m from mother tree (Biswas and Misbahuzzaman 2010) compared to >100 m distance
dispersedability of Sal seed by wind (Jackson, 1994). However, in moist deciduous forests which dominated
by S. robusta, S. wallichii etc. forced many species towards rarity and interferes with the proper seedling
establishment and growth of other species by bringing autogenic as well as allogenic changes in the
community level (Pandey and Shukla, 1999; Sapkota et al., 2009). About 67.56% trees were in shaded
understory (<15m height) and only 32.44 % trees were exceeded 15 m height. The overstory typically
dominated by D. turbinatus, A. chama, T. bellirica, A. acuminata, S. comuni and S. robusta, recorded as mean
maximum height holding trees. Regression analyses also revealed that the density of trees was mostly linearly
declined (F2,9 =6.65; p=0.02) across the height classes (Fig. 6c). Tree height increases with the light
118
Proceedings of the International Academy of Ecology and Environmental Sciences, 2015, 5(4): 104-127
IAEES www.iaees.org
requirements of the species (King 1996), pioneer or light demanding species has the advantages to grow
rapidly and efficiently in height in forest gaps to attain a position in the canopy before the gap closes (Gelder et
al., 2006). But in case of semi–evergreen formations where the canopy are typically parabolic shape (e.g.
Dipterocarpus spp., Ficus spp., Castanopsis spp. etc.), only shade–tolerant species may better adopted than
other light demanding species. But, Aporusa spp., Ficus spp., Glochidion spp., H. antidysenterica, Macaranga
spp., Mallotus spp., M. paniculata, M. rotundifolia, S. cerasoides and Z. rugosa small oligarchic tree species
were frequently adopted both in sunny gaps and in the shaded understories.However, present study revealed
that several species has already been red listed (IUCN 2013); where Mangifera indica listed as Data Deficient