Page 1
Council for Accreditation of Counseling and Related Educational Programs
1001 North Fairfax Street, Suite 510 ∙ Alexandria, VA 22314
Phone: (703) 535-5990 ∙ Fax: (703) 739-6209 ∙ www.cacrep.org
CACREP VITAL
STATISTICS
2012 Results from a National Survey of Accredited Programs
Page 2
Published in July 2013
The following reference citation is based on APA Publication Manual (6th
ed.) guidelines and is
recommended for use when citing this report:
Council for Accreditation of Counseling and Related Educational Programs. (2013). CACREP
vital statistics 2012: Results from a national survey of accredited programs. Alexandria,
VA: Author.
Page 3
i
TABLE OF CONTENTS
INTRODUCTION AND OVERVIEW ……………………………………………………………1
INSTITUTIONAL INFORMATION …………………………………………………………….2
FIGURE 1 - Types of Institutions Offering CACREP-accredited Programs
TABLE 1 - Institutions with CACREP Programs by ACES Regions
CACREP PROGRAM AREAS ……………………………………………………………………..4
TABLE 2 - Program Area Data
TABLE 3 - Program Area Averages
CACREP STUDENTS ………………………………………………………………………………..5
TABLE 4 - Student Information by Level
TABLE 5 - Masters Student Demographics
TABLE 6 - Doctoral Student Demographics
TABLE 7 - All Student Demographics
FIGURE 2 - Students by Gender
FIGURE 3 - Students with Disabilities
Page 4
1
CACREP VITAL STATISTICS 2012:
Results from a National Survey of Accredited Programs
INTRODUCTION AND OVERVIEW CACREP has collected essential information from its accredited counseling programs on an
annual basis since the early 1990s. Before the invention of the Internet, CACREP mailed a paper
form to accredited programs each year asking them to provide basic programmatic information
as well as updates regarding changes in leadership or contact information. This yearly form has
evolved over time and today it is known as the CACREP Vital Statistics Survey.
In recent years, the CACREP Vital Statistics Survey has been used for collecting more detailed
program information and soliciting feedback from accredited programs on current issues. The
results of this survey are used in reporting to government agencies, professional organizations,
and even individual researchers who contact the CACREP office. The survey results are also
used by the CACREP Board of Directors and staff to help improve the services provided to
accredited programs.
The Vital Statistics Survey underwent a number of changes in 2012, including the transition
from a paper-pencil format to an online survey. CACREP program liaisons are charged with
reporting data on the Vital Statistics Survey for the academic year, including the summer, fall,
and spring academic terms. Thus, the 2012 CACREP Vital Statistics Survey collected program
data reflective of Summer 2011 through Spring 2012; the results of which are included in this
report. CACREP intends to use the results from the 2012 Vital Statistics Survey as a baseline for
programmatic information. This data will be used each year to monitor changes and emerging
trends as future Vital Statistics Surveys are collected.
The purpose of this report is to make the results of the 2012 CACREP Vital Statistics Survey
available to CACREP-accredited programs, state and federal government agencies, counseling
licensure/certification entities, counseling researchers, and other stakeholders within the
counseling profession as well as the general public. Data concerning CACREP programs,
program areas, and students are presented along with brief narratives as appropriate. The
information in this Vital Statistics Report offers a unique description of currently accredited
counselor education programs—as well as the students they serve— which assists in providing
an environmental context that is helpful for understanding counselor preparation in 2012.
Page 5
2
INSTITUTIONAL INFORMATION All graduate counseling programs accredited by CACREP before July 2012 completed the 2012
Vital Statistics Survey. As a result, 262 institutions offering a total of 600 CACREP-accredited
counseling programs contributed to the data included in this report. Of these:
■ 220 institutions’ counseling programs are accredited under the 2001 CACREP Standards;
■ 36 institutions’ counseling programs are accredited under the 2009 Standards; and
■ 6 institutions have at least one counseling program area accredited under the 2001
Standards and at least one program area accredited under the 2009 CACREP Standards—
This occasionally happens when a new program is added mid-accreditation cycle.
Information reported on the 2012 Vital Statistics Survey regarding institution type and
geographic location is provided in the next two subsections.
INSTITUTION TYPE One approach to classifying types of post-secondary institutions is based on institutional control.
The Common Educational Data Standards (CEDS) developed by the U.S. Department of
Education outline two major types of post-secondary institutional control: those that are operated
by publically elected or appointed officials (public control) and those that are operated by
privately elected or appointed officials and derive their major source of funds from private
sources (private control). Institutions are often classified further based on other criteria; for
example, for-profit status or religious affiliation.
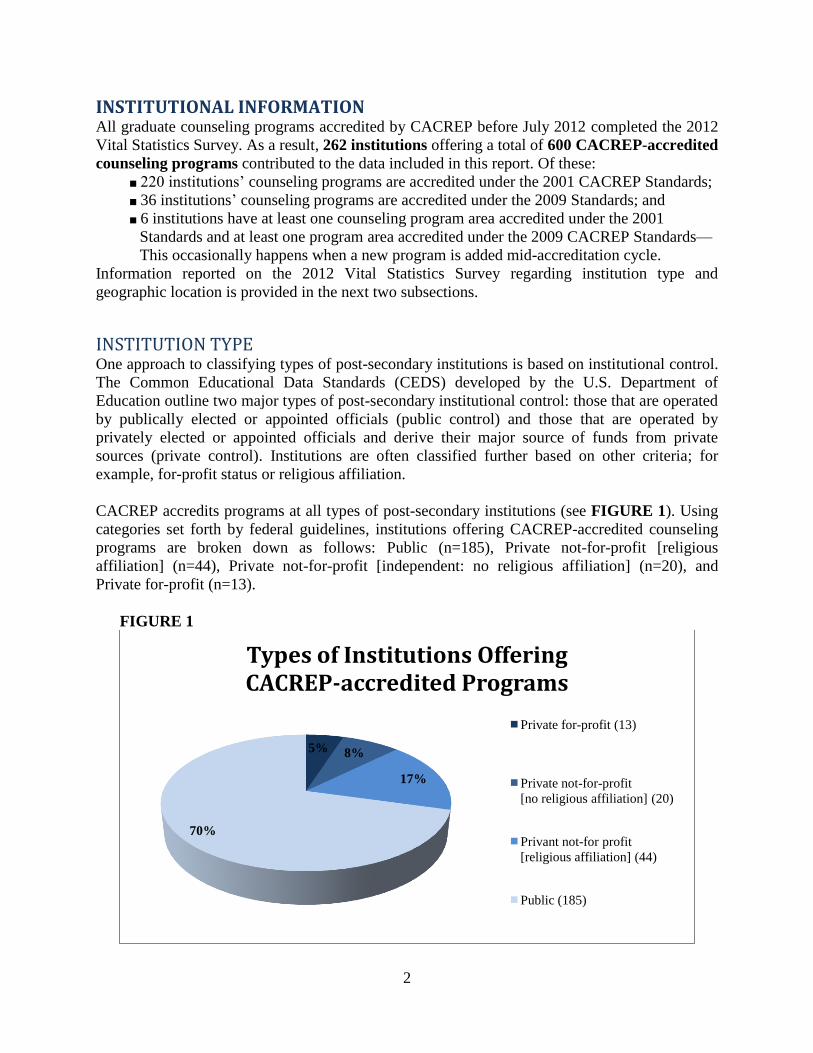
CACREP accredits programs at all types of post-secondary institutions (see FIGURE 1). Using
categories set forth by federal guidelines, institutions offering CACREP-accredited counseling
programs are broken down as follows: Public (n=185), Private not-for-profit [religious
affiliation] (n=44), Private not-for-profit [independent: no religious affiliation] (n=20), and
Private for-profit (n=13).
FIGURE 1
5% 8%
17%
70%
Types of Institutions Offering CACREP-accredited Programs
Private for-profit (13)
Private not-for-profit
[no religious affiliation] (20)
Privant not-for profit
[religious affiliation] (44)
Public (185)
Page 6
3
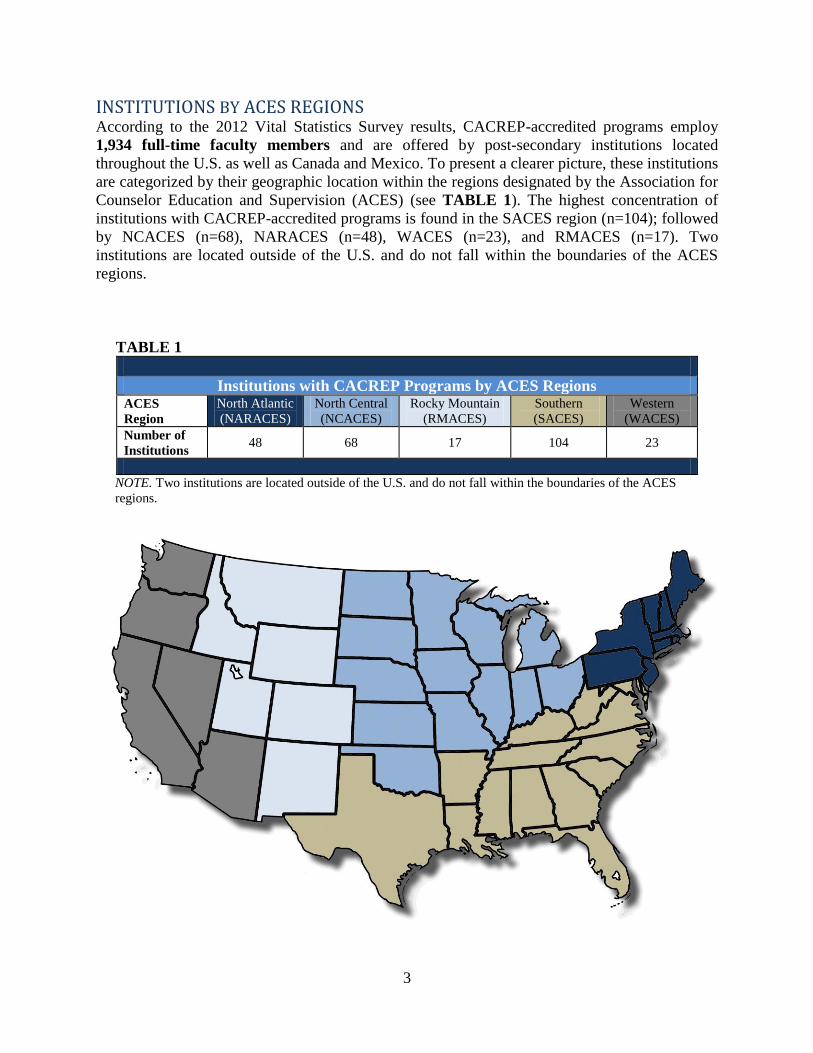
INSTITUTIONS BY ACES REGIONS According to the 2012 Vital Statistics Survey results, CACREP-accredited programs employ
1,934 full-time faculty members and are offered by post-secondary institutions located
throughout the U.S. as well as Canada and Mexico. To present a clearer picture, these institutions
are categorized by their geographic location within the regions designated by the Association for
Counselor Education and Supervision (ACES) (see TABLE 1). The highest concentration of
institutions with CACREP-accredited programs is found in the SACES region (n=104); followed
by NCACES (n=68), NARACES (n=48), WACES (n=23), and RMACES (n=17). Two
institutions are located outside of the U.S. and do not fall within the boundaries of the ACES
regions.
TABLE 1
Institutions with CACREP Programs by ACES Regions ACES
Region
North Atlantic
(NARACES)
North Central
(NCACES)
Rocky Mountain
(RMACES)
Southern
(SACES)
Western
(WACES)
Number of
Institutions 48 68 17 104 23
NOTE. Two institutions are located outside of the U.S. and do not fall within the boundaries of the ACES
regions.
Page 7
4
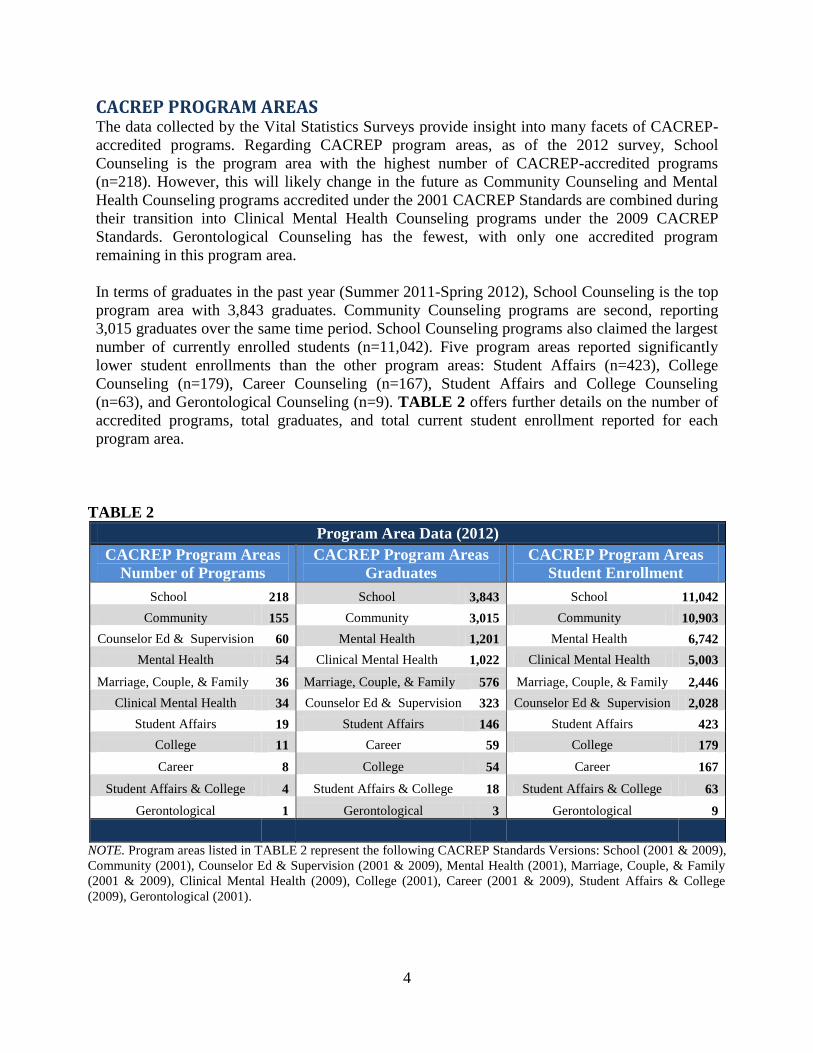
CACREP PROGRAM AREAS The data collected by the Vital Statistics Surveys provide insight into many facets of CACREP-
accredited programs. Regarding CACREP program areas, as of the 2012 survey, School
Counseling is the program area with the highest number of CACREP-accredited programs
(n=218). However, this will likely change in the future as Community Counseling and Mental
Health Counseling programs accredited under the 2001 CACREP Standards are combined during
their transition into Clinical Mental Health Counseling programs under the 2009 CACREP
Standards. Gerontological Counseling has the fewest, with only one accredited program
remaining in this program area.
In terms of graduates in the past year (Summer 2011-Spring 2012), School Counseling is the top
program area with 3,843 graduates. Community Counseling programs are second, reporting
3,015 graduates over the same time period. School Counseling programs also claimed the largest
number of currently enrolled students (n=11,042). Five program areas reported significantly
lower student enrollments than the other program areas: Student Affairs (n=423), College
Counseling (n=179), Career Counseling (n=167), Student Affairs and College Counseling
(n=63), and Gerontological Counseling (n=9). TABLE 2 offers further details on the number of
accredited programs, total graduates, and total current student enrollment reported for each
program area.
TABLE 2
Program Area Data (2012)
CACREP Program Areas
Number of Programs
CACREP Program Areas
Graduates
CACREP Program Areas
Student Enrollment
School 218 School 3,843 School 11,042
Community 155 Community 3,015 Community 10,903
Counselor Ed & Supervision 60 Mental Health 1,201 Mental Health 6,742
Mental Health 54 Clinical Mental Health 1,022 Clinical Mental Health 5,003
Marriage, Couple, & Family 36 Marriage, Couple, & Family 576 Marriage, Couple, & Family 2,446
Clinical Mental Health 34 Counselor Ed & Supervision 323 Counselor Ed & Supervision 2,028
Student Affairs 19 Student Affairs 146 Student Affairs 423
College 11 Career 59 College 179
Career 8 College 54 Career 167
Student Affairs & College 4 Student Affairs & College 18 Student Affairs & College 63
Gerontological 1 Gerontological 3 Gerontological 9
NOTE. Program areas listed in TABLE 2 represent the following CACREP Standards Versions: School (2001 & 2009),
Community (2001), Counselor Ed & Supervision (2001 & 2009), Mental Health (2001), Marriage, Couple, & Family
(2001 & 2009), Clinical Mental Health (2009), College (2001), Career (2001 & 2009), Student Affairs & College
(2009), Gerontological (2001).
Page 8
5
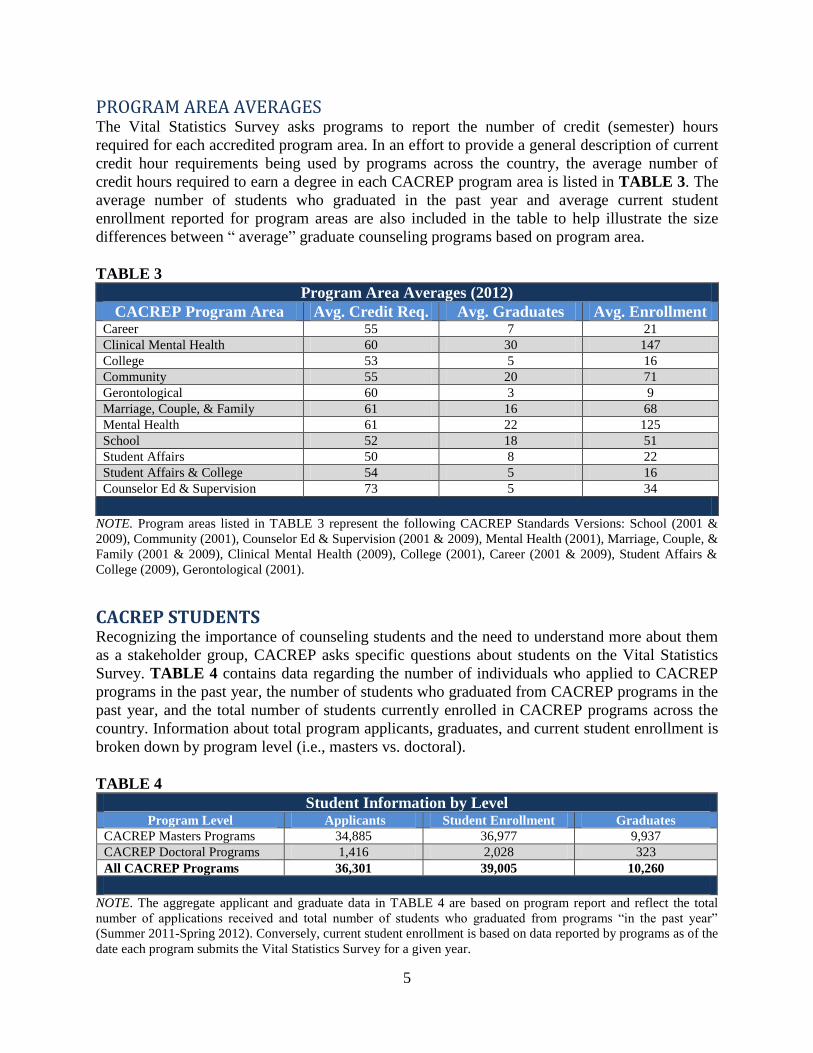
PROGRAM AREA AVERAGES The Vital Statistics Survey asks programs to report the number of credit (semester) hours
required for each accredited program area. In an effort to provide a general description of current
credit hour requirements being used by programs across the country, the average number of
credit hours required to earn a degree in each CACREP program area is listed in TABLE 3. The
average number of students who graduated in the past year and average current student
enrollment reported for program areas are also included in the table to help illustrate the size
differences between “ average” graduate counseling programs based on program area.
TABLE 3
Program Area Averages (2012)
CACREP Program Area Avg. Credit Req. Avg. Graduates Avg. Enrollment Career 55 7 21
Clinical Mental Health 60 30 147
College 53 5 16
Community 55 20 71
Gerontological 60 3 9
Marriage, Couple, & Family 61 16 68
Mental Health 61 22 125
School 52 18 51
Student Affairs 50 8 22
Student Affairs & College 54 5 16
Counselor Ed & Supervision 73 5 34
NOTE. Program areas listed in TABLE 3 represent the following CACREP Standards Versions: School (2001 &
2009), Community (2001), Counselor Ed & Supervision (2001 & 2009), Mental Health (2001), Marriage, Couple, &
Family (2001 & 2009), Clinical Mental Health (2009), College (2001), Career (2001 & 2009), Student Affairs &
College (2009), Gerontological (2001).
CACREP STUDENTS Recognizing the importance of counseling students and the need to understand more about them
as a stakeholder group, CACREP asks specific questions about students on the Vital Statistics
Survey. TABLE 4 contains data regarding the number of individuals who applied to CACREP
programs in the past year, the number of students who graduated from CACREP programs in the
past year, and the total number of students currently enrolled in CACREP programs across the
country. Information about total program applicants, graduates, and current student enrollment is
broken down by program level (i.e., masters vs. doctoral).
TABLE 4
Student Information by Level Program Level Applicants Student Enrollment Graduates
CACREP Masters Programs 34,885 36,977 9,937
CACREP Doctoral Programs 1,416 2,028 323
All CACREP Programs 36,301 39,005 10,260
NOTE. The aggregate applicant and graduate data in TABLE 4 are based on program report and reflect the total
number of applications received and total number of students who graduated from programs “in the past year”
(Summer 2011-Spring 2012). Conversely, current student enrollment is based on data reported by programs as of the
date each program submits the Vital Statistics Survey for a given year.
Page 9
6
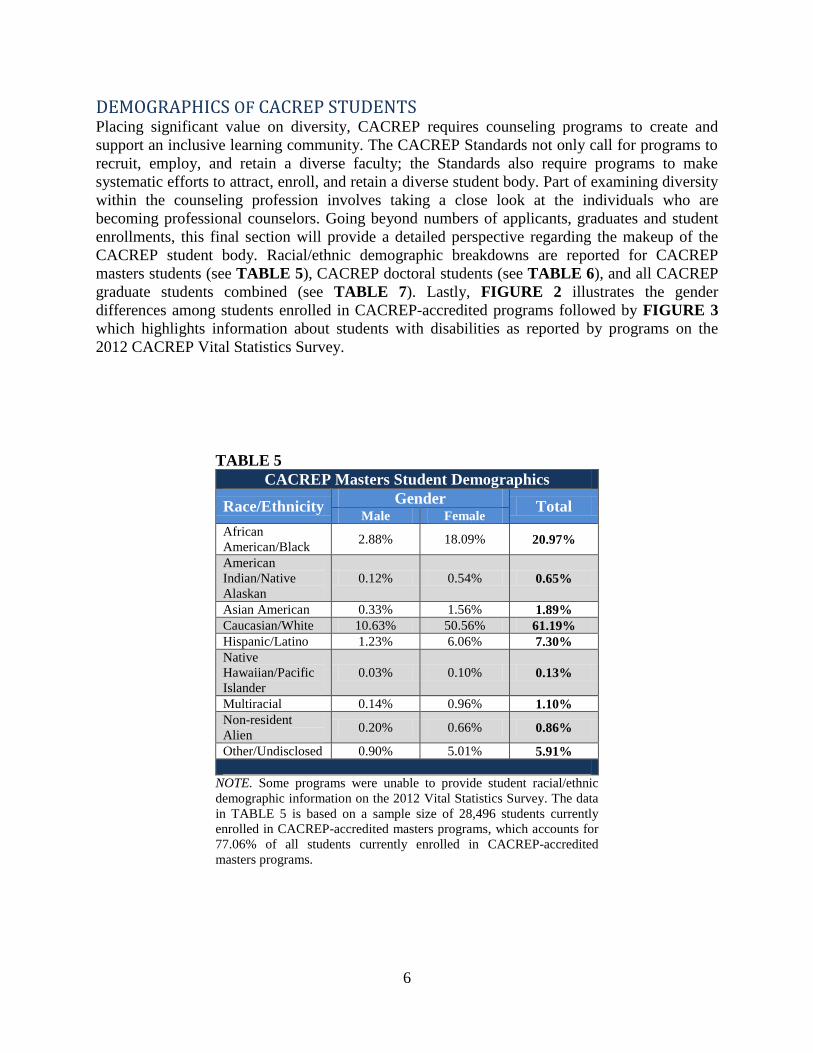
DEMOGRAPHICS OF CACREP STUDENTS Placing significant value on diversity, CACREP requires counseling programs to create and
support an inclusive learning community. The CACREP Standards not only call for programs to
recruit, employ, and retain a diverse faculty; the Standards also require programs to make
systematic efforts to attract, enroll, and retain a diverse student body. Part of examining diversity
within the counseling profession involves taking a close look at the individuals who are
becoming professional counselors. Going beyond numbers of applicants, graduates and student
enrollments, this final section will provide a detailed perspective regarding the makeup of the
CACREP student body. Racial/ethnic demographic breakdowns are reported for CACREP
masters students (see TABLE 5), CACREP doctoral students (see TABLE 6), and all CACREP
graduate students combined (see TABLE 7). Lastly, FIGURE 2 illustrates the gender
differences among students enrolled in CACREP-accredited programs followed by FIGURE 3
which highlights information about students with disabilities as reported by programs on the
2012 CACREP Vital Statistics Survey.
TABLE 5
CACREP Masters Student Demographics
Race/Ethnicity Gender
Total Male Female
African
American/Black 2.88% 18.09% 20.97%
American
Indian/Native
Alaskan
0.12% 0.54% 0.65%
Asian American 0.33% 1.56% 1.89%
Caucasian/White 10.63% 50.56% 61.19%
Hispanic/Latino 1.23% 6.06% 7.30%
Native
Hawaiian/Pacific
Islander
0.03% 0.10% 0.13%
Multiracial 0.14% 0.96% 1.10%
Non-resident
Alien 0.20% 0.66% 0.86%
Other/Undisclosed 0.90% 5.01% 5.91%
NOTE. Some programs were unable to provide student racial/ethnic
demographic information on the 2012 Vital Statistics Survey. The data
in TABLE 5 is based on a sample size of 28,496 students currently
enrolled in CACREP-accredited masters programs, which accounts for
77.06% of all students currently enrolled in CACREP-accredited
masters programs.
Page 10
7
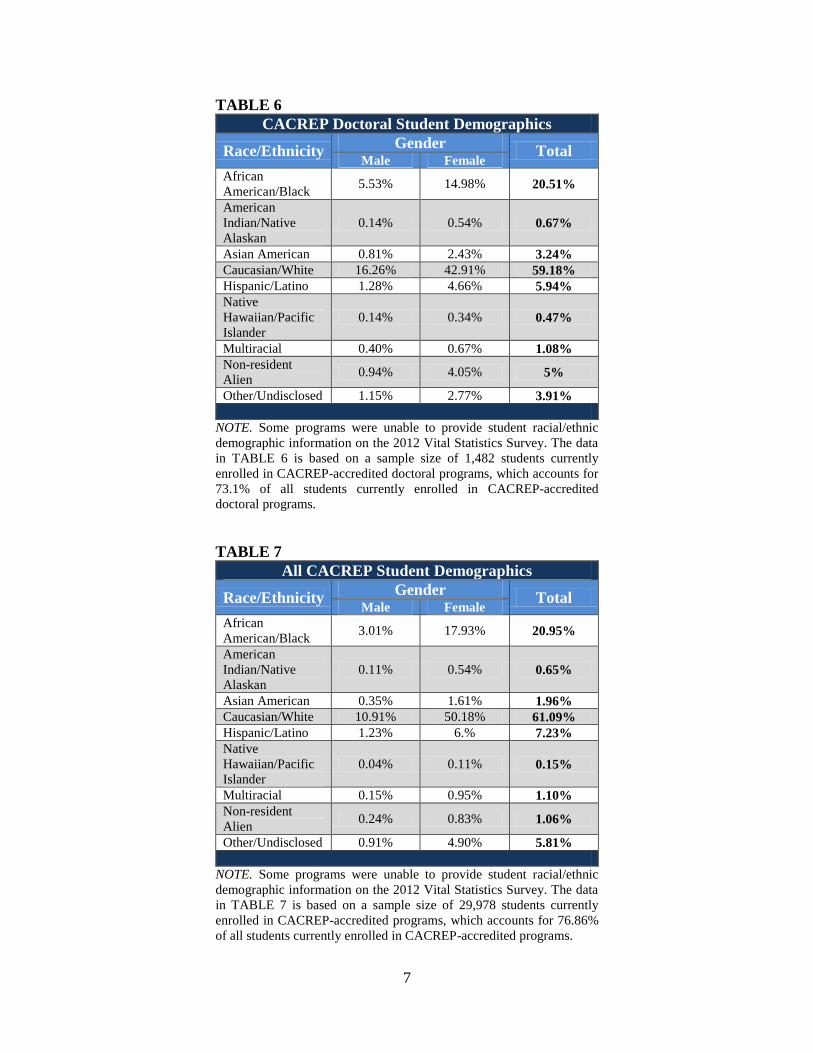
TABLE 6
CACREP Doctoral Student Demographics
Race/Ethnicity Gender
Total Male Female
African
American/Black 5.53% 14.98% 20.51%
American
Indian/Native
Alaskan
0.14% 0.54% 0.67%
Asian American 0.81% 2.43% 3.24%
Caucasian/White 16.26% 42.91% 59.18%
Hispanic/Latino 1.28% 4.66% 5.94%
Native
Hawaiian/Pacific
Islander
0.14% 0.34% 0.47%
Multiracial 0.40% 0.67% 1.08%
Non-resident
Alien 0.94% 4.05% 5%
Other/Undisclosed 1.15% 2.77% 3.91%
NOTE. Some programs were unable to provide student racial/ethnic
demographic information on the 2012 Vital Statistics Survey. The data
in TABLE 6 is based on a sample size of 1,482 students currently
enrolled in CACREP-accredited doctoral programs, which accounts for
73.1% of all students currently enrolled in CACREP-accredited
doctoral programs.
TABLE 7
All CACREP Student Demographics
Race/Ethnicity Gender
Total Male Female
African
American/Black 3.01% 17.93% 20.95%
American
Indian/Native
Alaskan
0.11% 0.54% 0.65%
Asian American 0.35% 1.61% 1.96%
Caucasian/White 10.91% 50.18% 61.09%
Hispanic/Latino 1.23% 6.% 7.23%
Native
Hawaiian/Pacific
Islander
0.04% 0.11% 0.15%
Multiracial 0.15% 0.95% 1.10%
Non-resident
Alien 0.24% 0.83% 1.06%
Other/Undisclosed 0.91% 4.90% 5.81%
NOTE. Some programs were unable to provide student racial/ethnic
demographic information on the 2012 Vital Statistics Survey. The data
in TABLE 7 is based on a sample size of 29,978 students currently
enrolled in CACREP-accredited programs, which accounts for 76.86%
of all students currently enrolled in CACREP-accredited programs.
Page 11
8
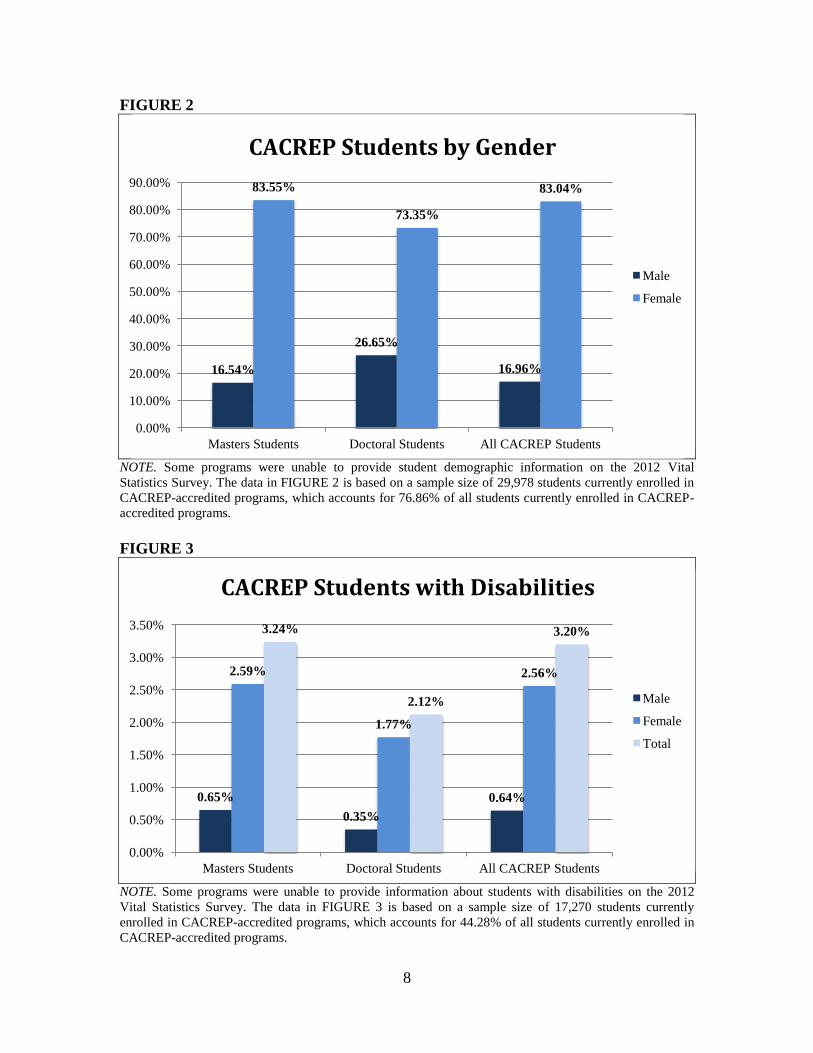
FIGURE 2
NOTE. Some programs were unable to provide student demographic information on the 2012 Vital
Statistics Survey. The data in FIGURE 2 is based on a sample size of 29,978 students currently enrolled in
CACREP-accredited programs, which accounts for 76.86% of all students currently enrolled in CACREP-
accredited programs.
FIGURE 3
NOTE. Some programs were unable to provide information about students with disabilities on the 2012
Vital Statistics Survey. The data in FIGURE 3 is based on a sample size of 17,270 students currently
enrolled in CACREP-accredited programs, which accounts for 44.28% of all students currently enrolled in
CACREP-accredited programs.
16.54%
26.65%
16.96%
83.55%
73.35%
83.04%
0.00%
10.00%
20.00%
30.00%
40.00%
50.00%
60.00%
70.00%
80.00%
90.00%
Masters Students Doctoral Students All CACREP Students
Male
Female
CACREP Students by Gender
0.65%
0.35%
0.64%
2.59%
1.77%
2.56%
3.24%
2.12%
3.20%
0.00%
0.50%
1.00%
1.50%
2.00%
2.50%
3.00%
3.50%
Masters Students Doctoral Students All CACREP Students
Male
Female
Total
CACREP Students with Disabilities