24
Manshakaur Dhillon - 91 Darshit Ajmera - 92 Mayura Joshi - 93 Swati Agarwal - 94 Mohid Cutterwala - 95 Cadila Healthcare Limited
Manshakaur Dhillon - 91Darshit Ajmera - 92Mayura Joshi - 93Swati Agarwal - 94Mohid Cutterwala - 95
Cadila Healthcare Limited

MET’s ICS
Indian Pharma Industry
4/9/2013Economics
Growing at about 8% to 9% annually.
It meets around 70% of the country's demand.
Reasons for rising demand for pharma products :1. Low drug penetration2. Rising middle-class & disposable income3. Increased government & private spending4. Increasing medical insurance penetration etc.
MET’s ICS 4/9/2013Economics
Globally, India ranks 3rd in terms of manufacturing pharma products by volume.
McKinsey & Company’s report, predicted that the Indian pharmaceuticals market will grow to US$55 billion in 2020
With aggressive growth strategies being implemented, it has further potential to reach US$70 billion by 2020
Cadila healthcare - Overview
4/9/2013MET’s ICSEconomics
Established in 1952 - Headquartered in Ahmedabad, Gujarat.
Ranked 5th in the domestic market.
Company evolved over the next four decades into one of India's renowned pharmaceutical companies.
Cadila Healthcare became the Patel family's holding company in 1995 after the Modi families split

MET’s ICS 4/9/2013Economics
IPO on Bombay Stock Exchange in 2000.
Cadila manufactures a range of products:- 1. Formulations of active pharmaceutical ingredients (API)2. Intermediates3. Biologicals4. Animal healthcare products5. Consumer wellness products
Cadila has a global presence.

4/9/2013MET’s ICSEconomics
The group now has 81 patents and around 186 more pending.
The product will have estimated sales of USD 3 billion in 2015.
Cadila healthcare reported 1.33 % increase in net profit as on 7th August 2013 for the quarter ended June 30, 2013

4/9/2013MET’s ICSEconomics
In 2012-13,Cadila’s R&D expenditure as a percentage of turnover was 12.67%
It has a 950 member strong R&D team
The company undertakes R&D activities in - Generics formulations New molecular entities Novel drug delivery systems Biologics
Research & Development
4/9/2013MET’s ICSEconomics
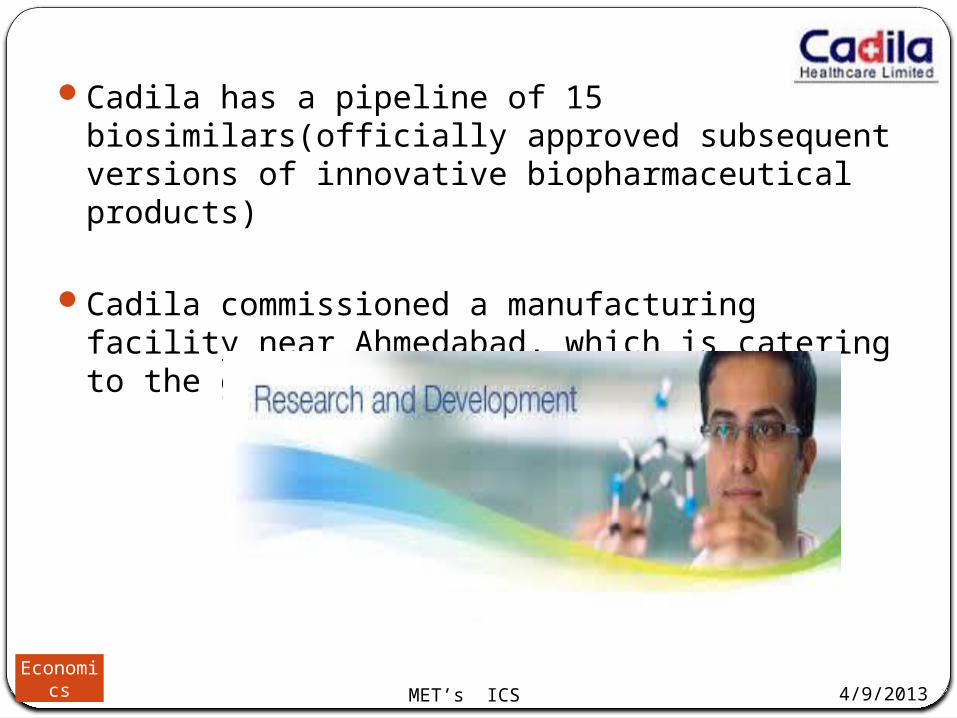
Cadila has a pipeline of 15 biosimilars(officially approved subsequent versions of innovative biopharmaceutical products)
Cadila commissioned a manufacturing facility near Ahmedabad, which is catering to the global biosimilars business

MET’s ICS
R&D Expenditure break-up in2012-13 (in crores)
4/9/2013Economics
API & Oth-ers; 26.8
NMEs & Drug
Dis-cov-ery; 59.8
Gener-ics;
120.9
MET’s ICS
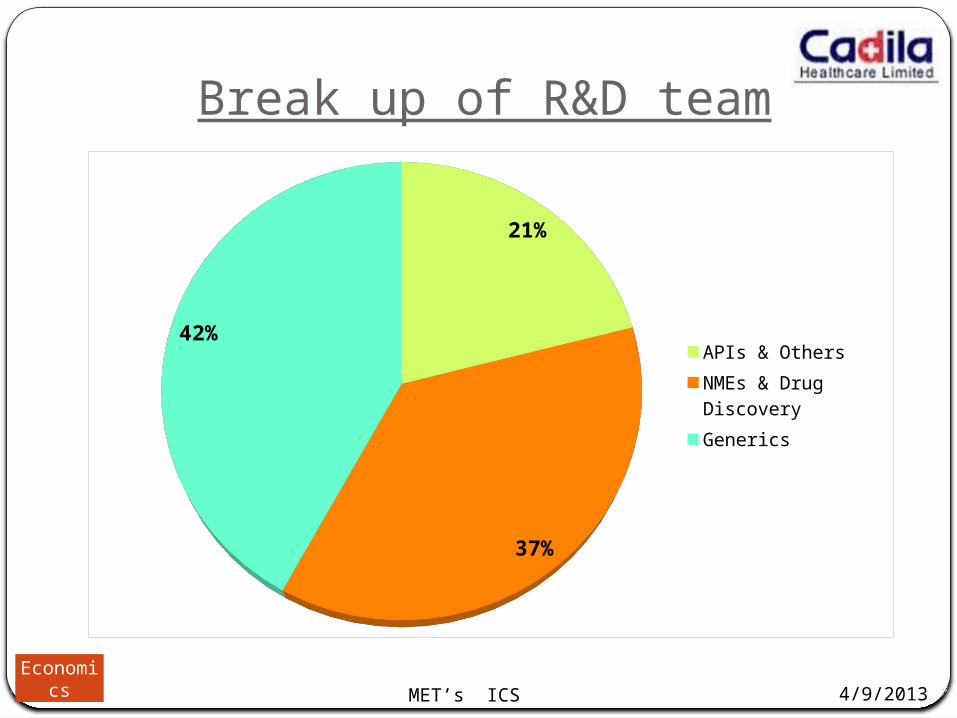
Break up of R&D team
4/9/2013Economics
21%
37%
42%APIs & OthersNMEs & Drug Dis-coveryGenerics
MET’s ICS 4/9/2013Economics
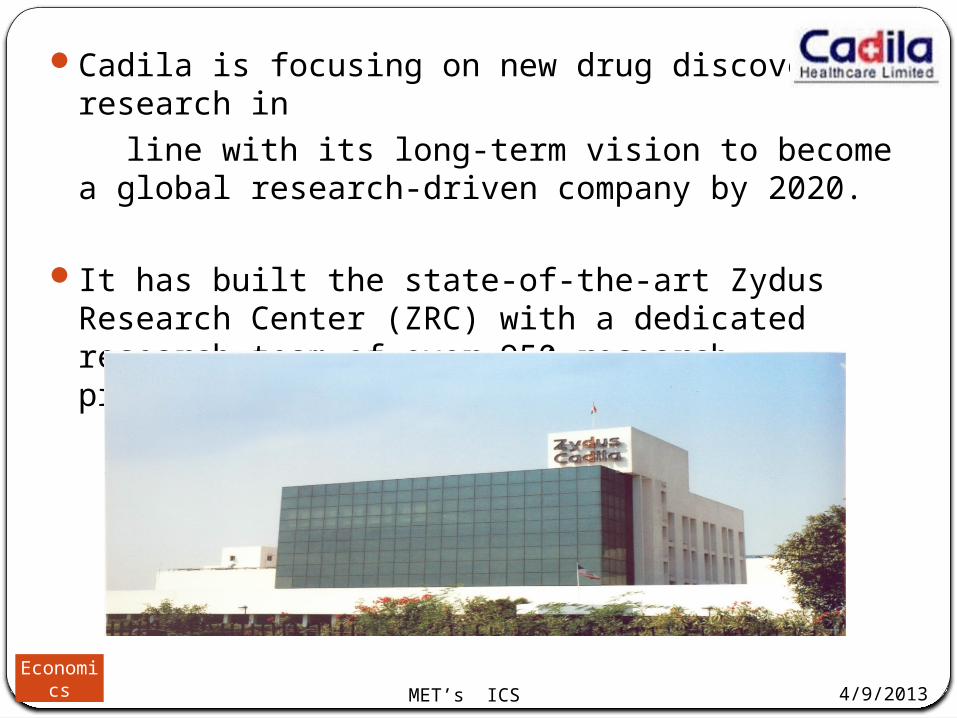
Cadila is focusing on new drug discovery research in line with its long-term vision to become a global research-
driven company by 2020.
It has built the state-of-the-art Zydus Research Center (ZRC) with a dedicated research team of over 950 research professionals.
MET’s ICS 4/9/2013Economics
Biologics - a key long-term opportunity given the intense competition in the global developed generics markets and the high entry barriers in the ‘Biologics’ field leading to lesser competition.
Vaccines – another niche opportunity.
The first achievement - the DCGI nod to start clinical trials of the vaccine for H1N1 Flu.
It is the first Indian company to get such approval.
MET’s ICS
Major collaborations in past few years.
4/9/2013Economics
Zydus - Hospira JV in yr 2009
Zydus - Abbott Laboratories alliance in yr 2010
Bayer Zydus Pharma in yr 2011
Zydus - IDRI in yr 2013
MET’s ICS
CSR Initiatives
4/9/2013Economics
Ramanbhai Foundation:
The Zydus School for ExcellenceOutreach programmesTheme - Colours of Life (to spread joy and happiness to the
community)Tree plantation drive - ‘Each one, plant one’It extends support during times of natural calamities.Social and Corporate Governance Award

MET’s ICS 4/9/2013Economics
74.79%
5.42%9.92%
9.87%
Pro-moterFIIDIIOthers
Shareholding pattern
MET’s ICS 4/9/2013Economics
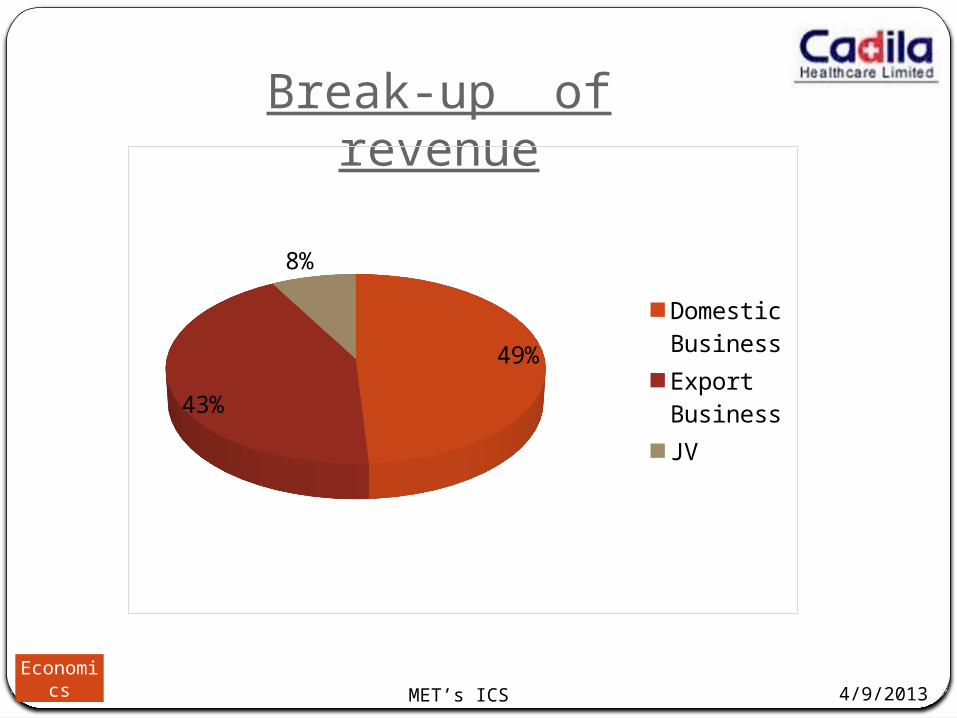
Break-up of revenue
49%43%
8%
Domestic BusinessExport BusinessJV
MET’s ICS 4/9/2013Economics
Form
ulatio
ns
Wellness
Animal
healt
h API10
110
210
310
410
510
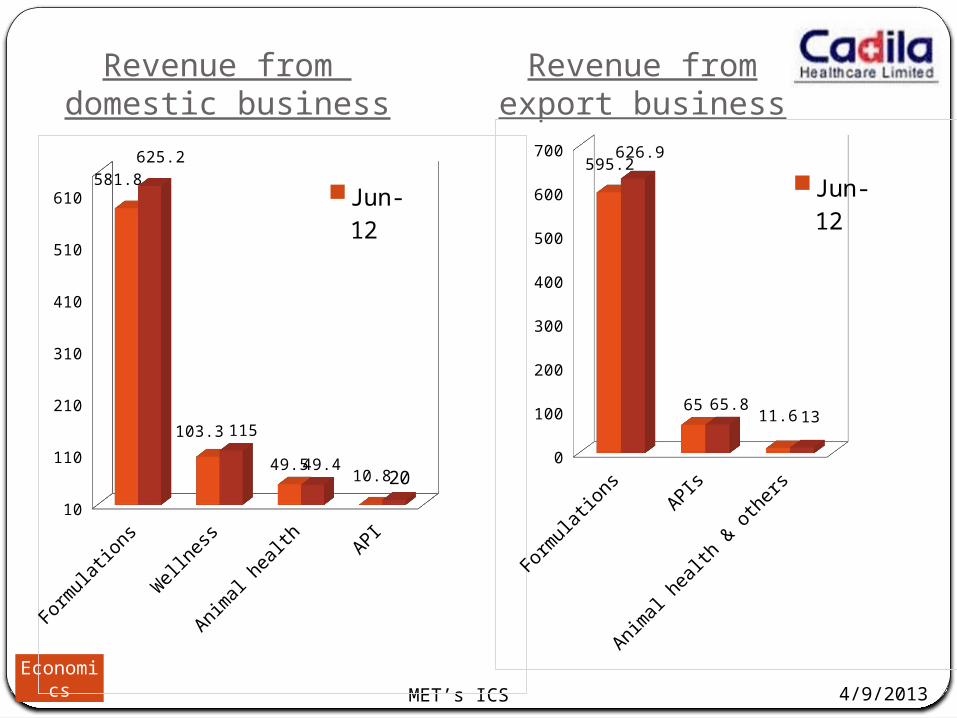
610581.8
103.349.5 10.8
625.2
115
49.4 20
Jun-12
Revenue from domestic business
Revenue from export business
Form
ulatio
ns APIs
Animal
healt
h & ot
hers
0
100
200
300
400
500
600
700595.2
65 11.6
626.9
65.813
Jun-12Jun-13
MET’s ICS 4/9/2013Economics
2009 2010 2011 2012 20130
20
40
60
80
100
120
140
160
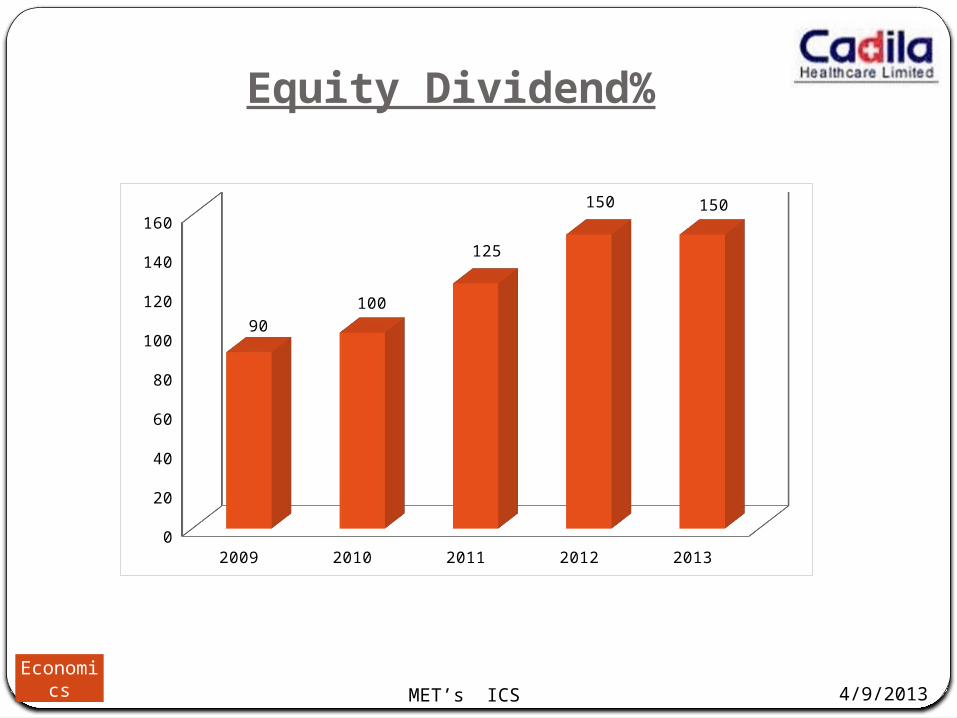
90100
125
150 150
Equity Dividend%

MET’s ICS 4/9/2013Economics
23.09%
23.09%
20.30%
20.96%
23.36%
DIVIDEND PAYOUT RATIO
20092010201120122013
4/9/2013MET’s ICSEconomics
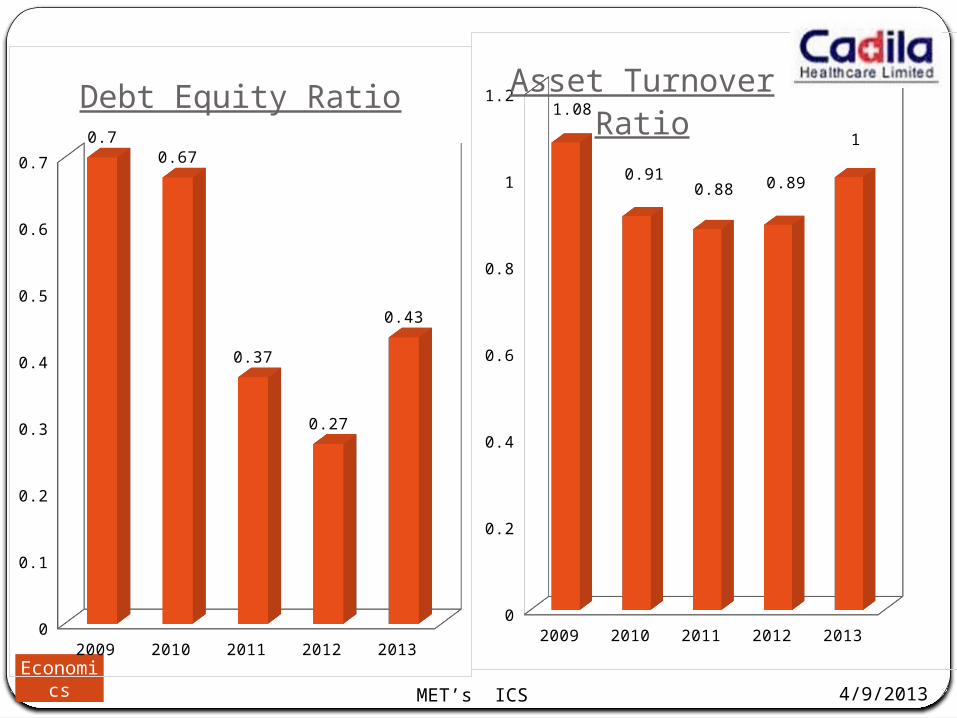
2009 2010 2011 2012 20130
0.2
0.4
0.6
0.8
1
1.21.08
0.910.88 0.89
1
Asset Turnover Ratio
2009 2010 2011 2012 20130
0.1
0.2
0.3
0.4
0.5
0.6
0.70.7
0.67
0.37
0.27
0.43
Debt Equity Ratio

4/9/2013MET’s ICSEconomics
2009 2010 2011 2012 20130
5
10
15
20
25
30
35
40
18.819.48
36.87
29.8132.11
Earnings Per Share
2009 2010 2011 2012 20130
0.2
0.4
0.6
0.8
1
1.2
1.4
1.6
1.8
10.93
1.4
1.63
1.22
Current Ratio

MET’s ICS 4/9/2013Economics
2009 2010 2011 2012 20130
100
200
300
400
500
600
700
236.2265.9
503.3
610.4657.5
Profit After Tax
MET’s ICS
Future Prospects
4/9/2013Economics
Beyond the Billion
VICA
PRISM
15 markets
India`s first Chemical Novel
MET’s ICS
Conclusion
4/9/2013Economics


![Balance Sheet as at March 31, 2006 - Cadila …...76 CADILA HEALTHCARE LIMITED Schedules forming part of the Balance Sheet Schedule : 3 - Securities for Loans - Continue: [C] [ a ]](https://static.documents.pub/doc/80x56/5e9eb7efeafee362cd187e13/balance-sheet-as-at-march-31-2006-cadila-76-cadila-healthcare-limited-schedules.jpg)


