17
CAE INVESTOR DAY CAPITAL PRIORITIES 1 CAE Inc. Proprietary Information and/or Confidential Stéphane Lefebvre March 30, 2016

CAE INVESTOR DAY
CAPITAL PRIORITIES
1 CAE Inc. Proprietary Information and/or Confidential
Stéphane Lefebvre
March 30, 2016
CAUTION REGARDING FORWARD LOOKING STATEMENTS
The following investor presentation and oral statements made by management during CAE Inc.’s March 30, 2016 Investor Day include forward-
looking statements about our activities, events and developments that we expect to or anticipate may occur in the future including, for example,
statements about our vision, strategies, market trends and outlook, future revenues, capital spending, expansions and new initiatives, financial
obligations and expected sales. Forward-looking statements normally contain words like believe, expect, anticipate, plan, intend, continue,
estimate, may, will, should, strategy, future and similar expressions. By their nature, forward-looking statements require us to make
assumptions and are subject to inherent risks and uncertainties associated with our business which may cause actual results in future periods
to differ materially from results indicated in forward-looking statements. While these statements are based on management’s expectations and
assumptions regarding historical trends, current conditions and expected future developments, as well as other factors that we believe are
reasonable and appropriate in the circumstances, readers are cautioned not to place undue reliance on these forward-looking statements as
there is a risk that they may not be accurate. You will find more information about these and other factors in our reports filed with securities
regulators in Canada and the United States. Reference should be made in particular to “Management’s Discussion and Analysis” in our annual
and interim reports and to our Annual Information Form and Form 40-F. These documents have been filed with the Canadian securities
commissions and are available on our website (www.cae.com) and on SEDAR (www.sedar.com). They have also been filed with the U.S.
Securities and Exchange Commission and are available on EDGAR (www.sec.gov). Forward-looking statements represent our expectations as
of March 30, 2016, and, accordingly, are subject to change after this date. We caution readers that the risks described are not necessarily the
only ones we face; additional risks and uncertainties that are presently unknown to us or that we may currently deem immaterial may adversely
affect our business. Additionally, differences could arise because of events that are announced or completed following the date of the
presentation, including mergers, acquisitions, other business combinations and divestitures. Except as required by law, we disclaim any
intention or obligation to update or revise any forward-looking statements whether as a result of new information, future events or otherwise.
Any forward-looking information and statements made during the presentation or contained herein are expressly qualified by this cautionary
statement.
CAE INVESTOR DAY
CAE Inc. Proprietary Information and/or Confidential 2
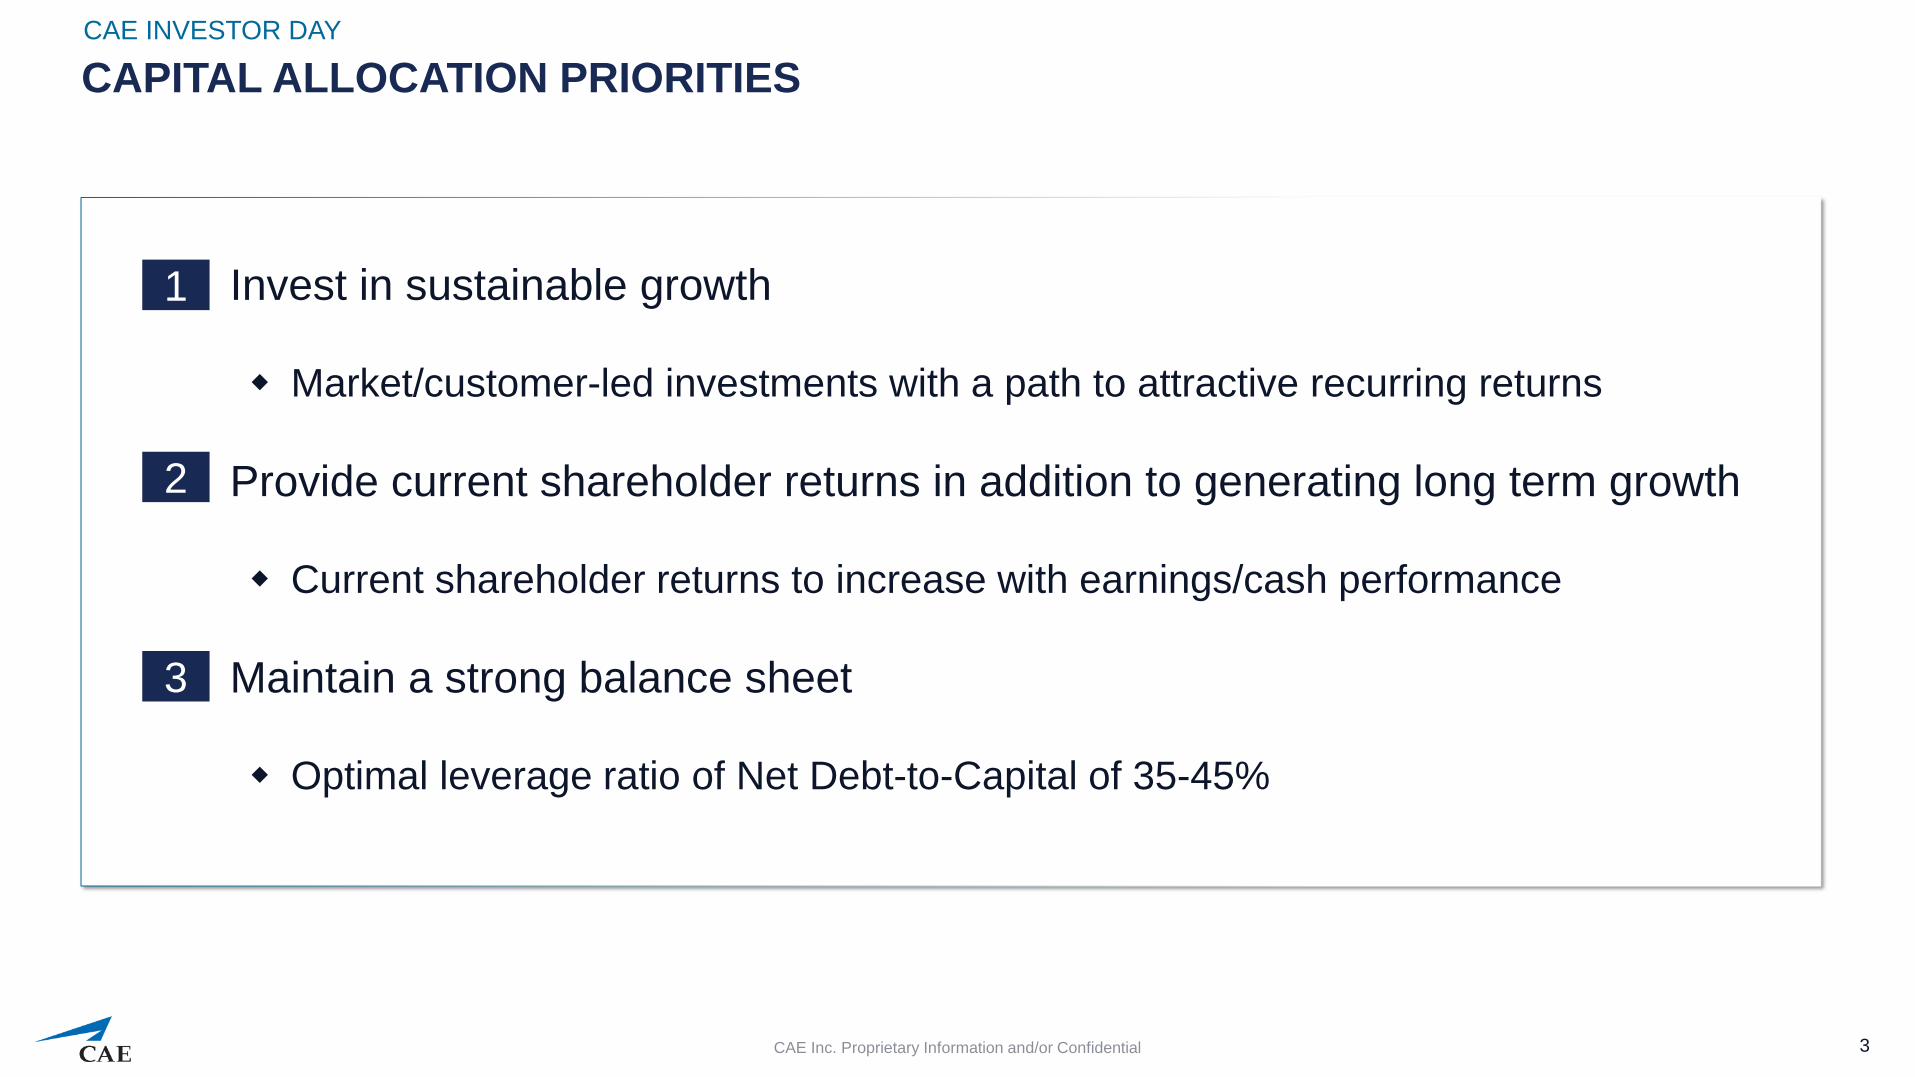
CAPITAL ALLOCATION PRIORITIES
► Invest in sustainable growth
Market/customer-led investments with a path to attractive recurring returns
► Provide current shareholder returns in addition to generating long term growth
Current shareholder returns to increase with earnings/cash performance
► Maintain a strong balance sheet
Optimal leverage ratio of Net Debt-to-Capital of 35-45%
CAE INVESTOR DAY
3
1
2
3
CAE Inc. Proprietary Information and/or Confidential
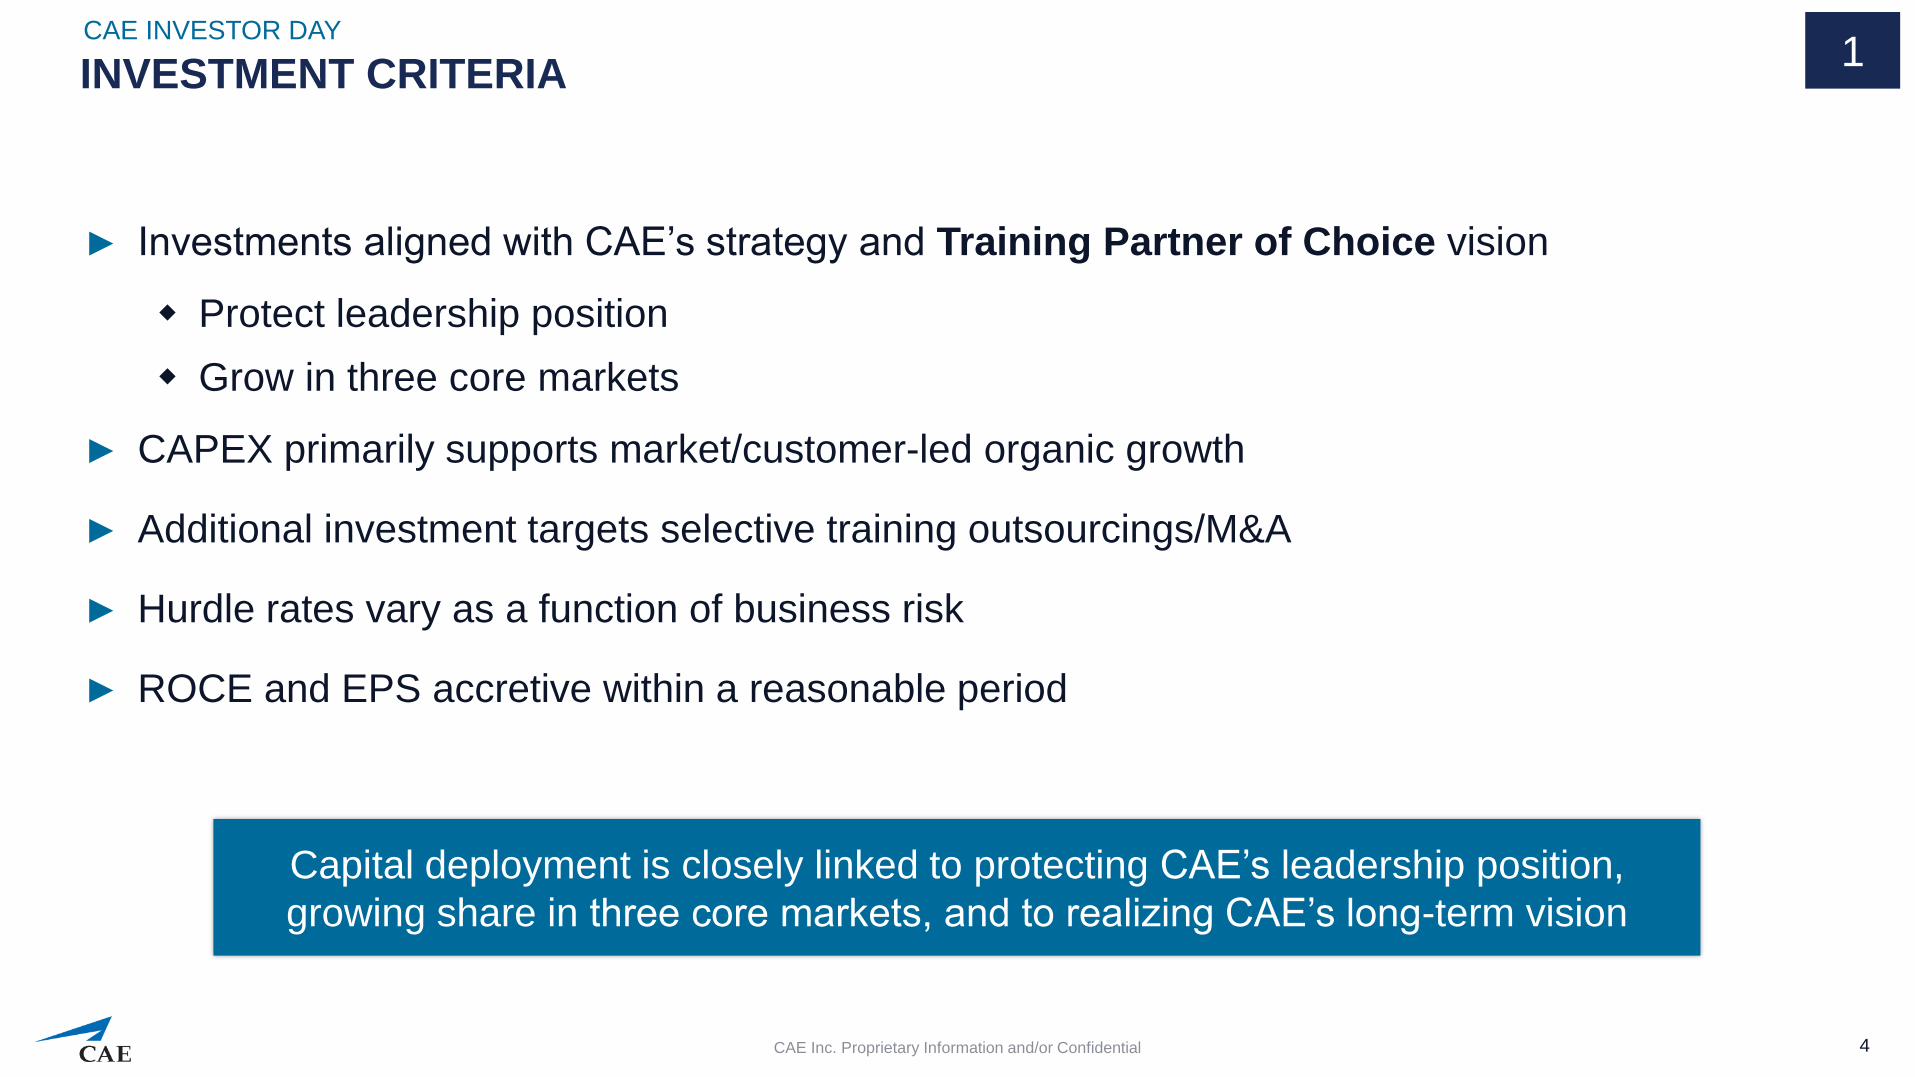
INVESTMENT CRITERIA
► Investments aligned with CAE’s strategy and Training Partner of Choice vision
Protect leadership position
Grow in three core markets
► CAPEX primarily supports market/customer-led organic growth
► Additional investment targets selective training outsourcings/M&A
► Hurdle rates vary as a function of business risk
► ROCE and EPS accretive within a reasonable period
CAE INVESTOR DAY
4 CAE Inc. Proprietary Information and/or Confidential
Capital deployment is closely linked to protecting CAE’s leadership position,
growing share in three core markets, and to realizing CAE’s long-term vision
1
2%
9%
18%
21%
3%
14%
25%
8%
27%
0%
10%
20%
30%
FY13 FY14 FY15 FY16
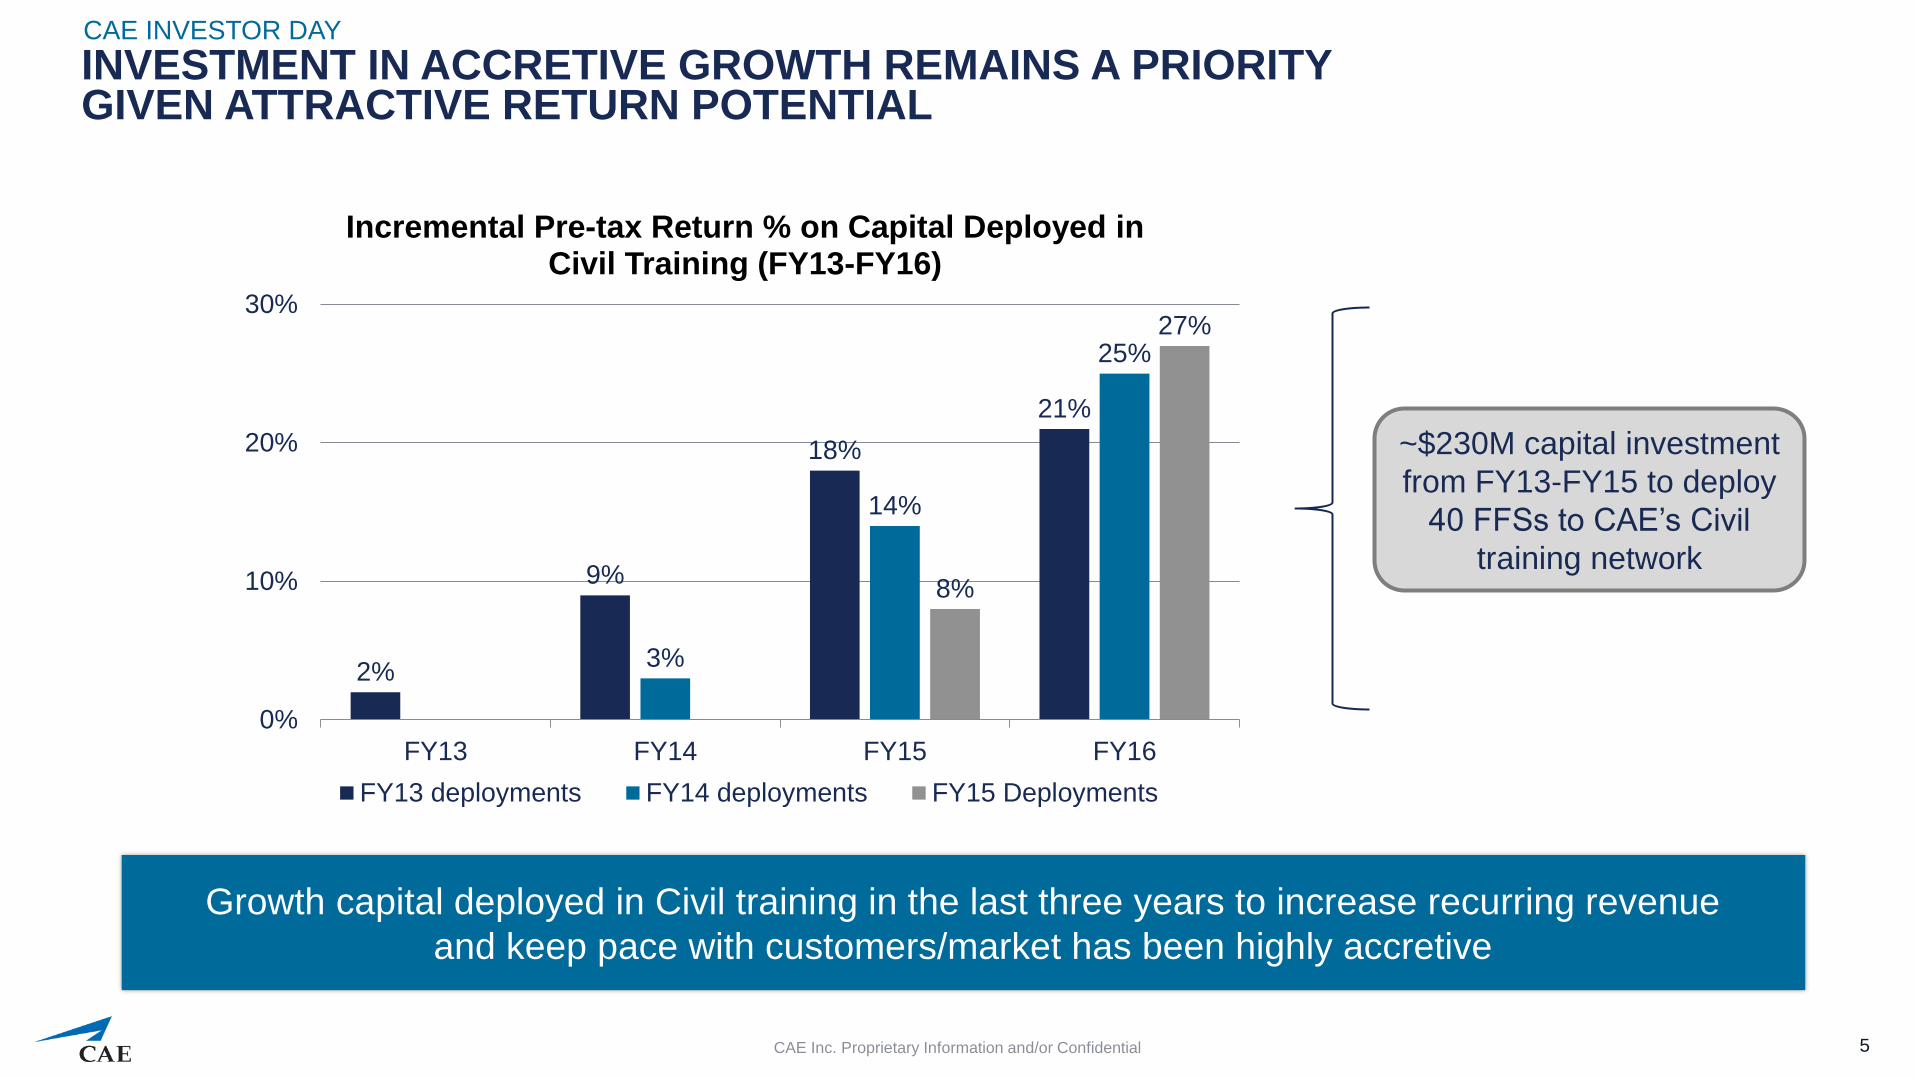
Incremental Pre-tax Return % on Capital Deployed in Civil Training (FY13-FY16)
FY13 deployments FY14 deployments FY15 Deployments
INVESTMENT IN ACCRETIVE GROWTH REMAINS A PRIORITY GIVEN ATTRACTIVE RETURN POTENTIAL
CAE INVESTOR DAY
5 CAE Inc. Proprietary Information and/or Confidential
Growth capital deployed in Civil training in the last three years to increase recurring revenue
and keep pace with customers/market has been highly accretive
~$230M capital investment
from FY13-FY15 to deploy
40 FFSs to CAE’s Civil
training network
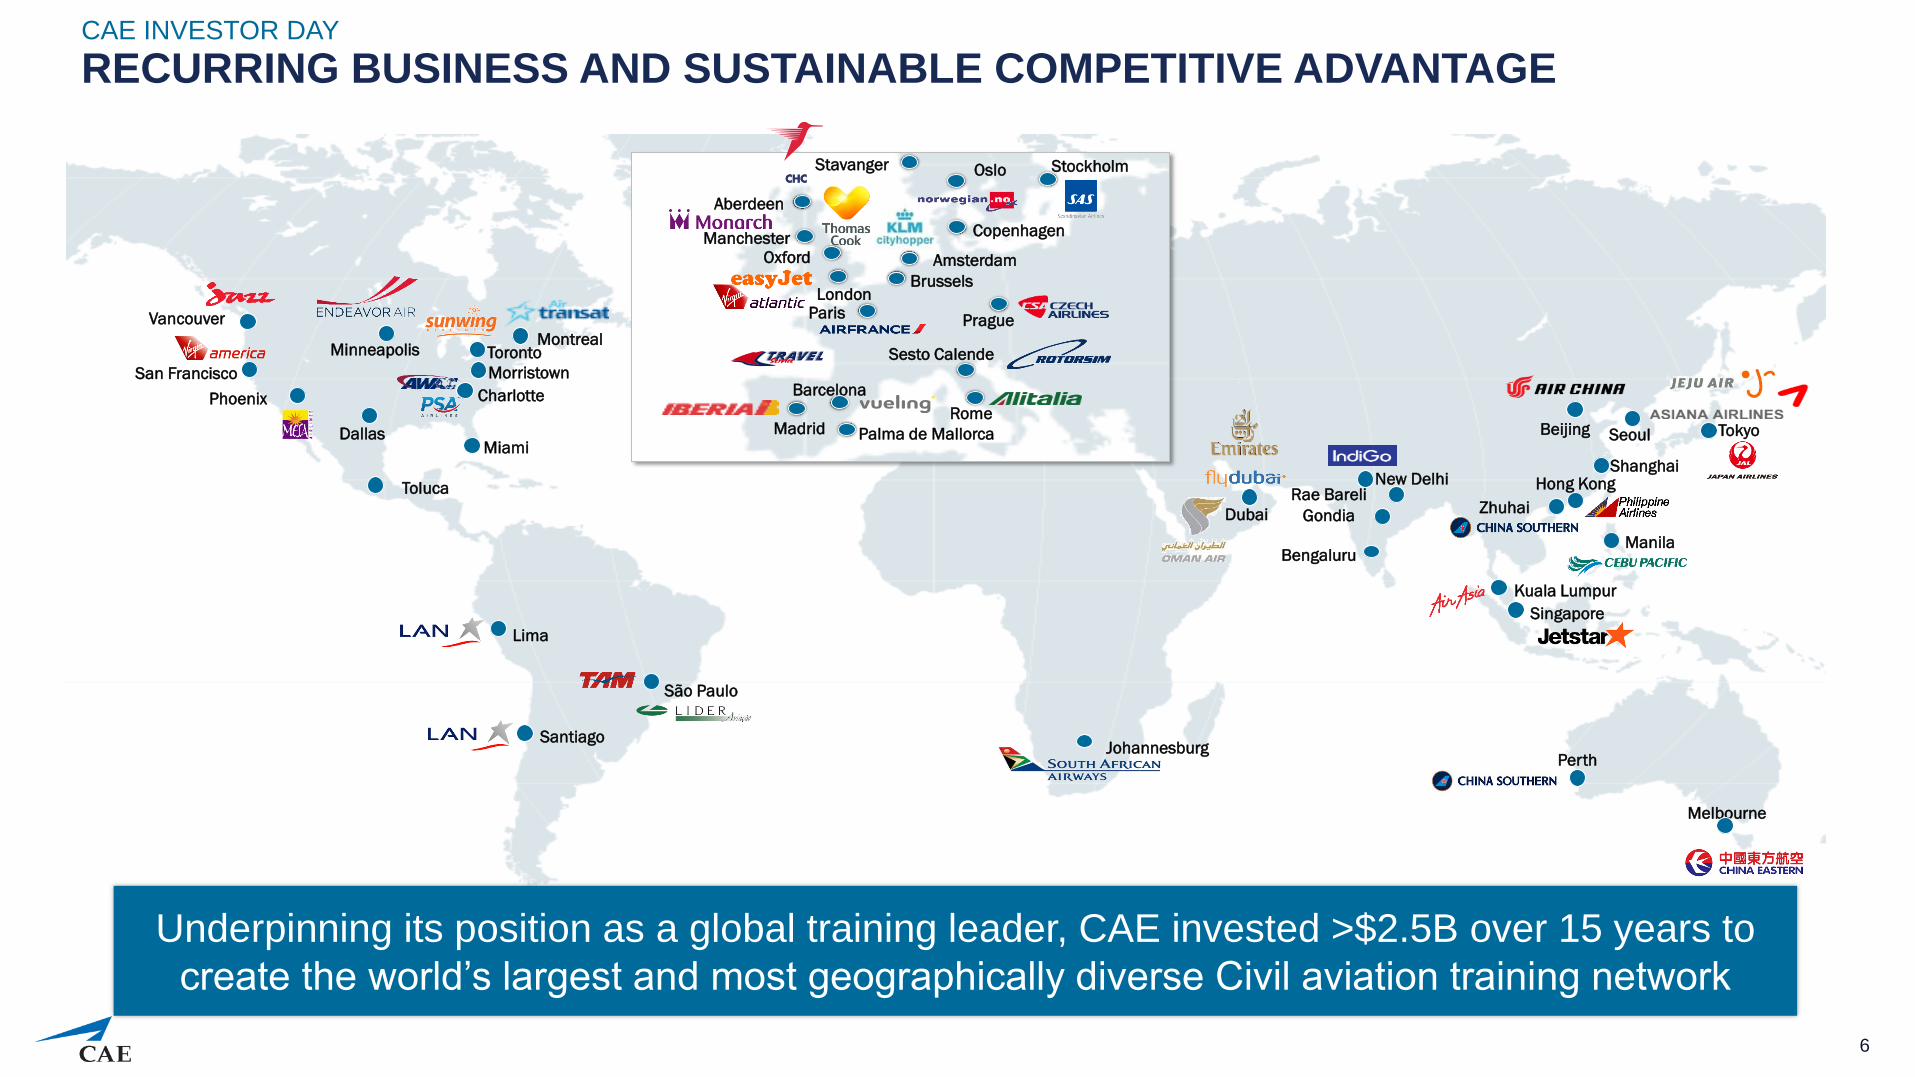
RECURRING BUSINESS AND SUSTAINABLE COMPETITIVE ADVANTAGE
6
CAE INVESTOR DAY
Singapore
Kuala Lumpur
Zhuhai
São Paulo
Montreal Toronto
Charlotte
Miami
Santiago
Vancouver
Phoenix
Brussels
Rome Madrid
Dubai
Bengaluru
San Francisco
Prague Paris
Seoul Palma de Mallorca Beijing
Amsterdam
Lima
New Delhi
Manila
Manchester
Stockholm Oslo
Copenhagen
Hong Kong
Barcelona
Dallas
Toluca
Morristown Sesto Calende
Melbourne
Aberdeen
Stavanger
Oxford
Shanghai
Johannesburg
Gondia
Rae Bareli
Perth
Minneapolis
London
Tokyo
Underpinning its position as a global training leader, CAE invested >$2.5B over 15 years to
create the world’s largest and most geographically diverse Civil aviation training network
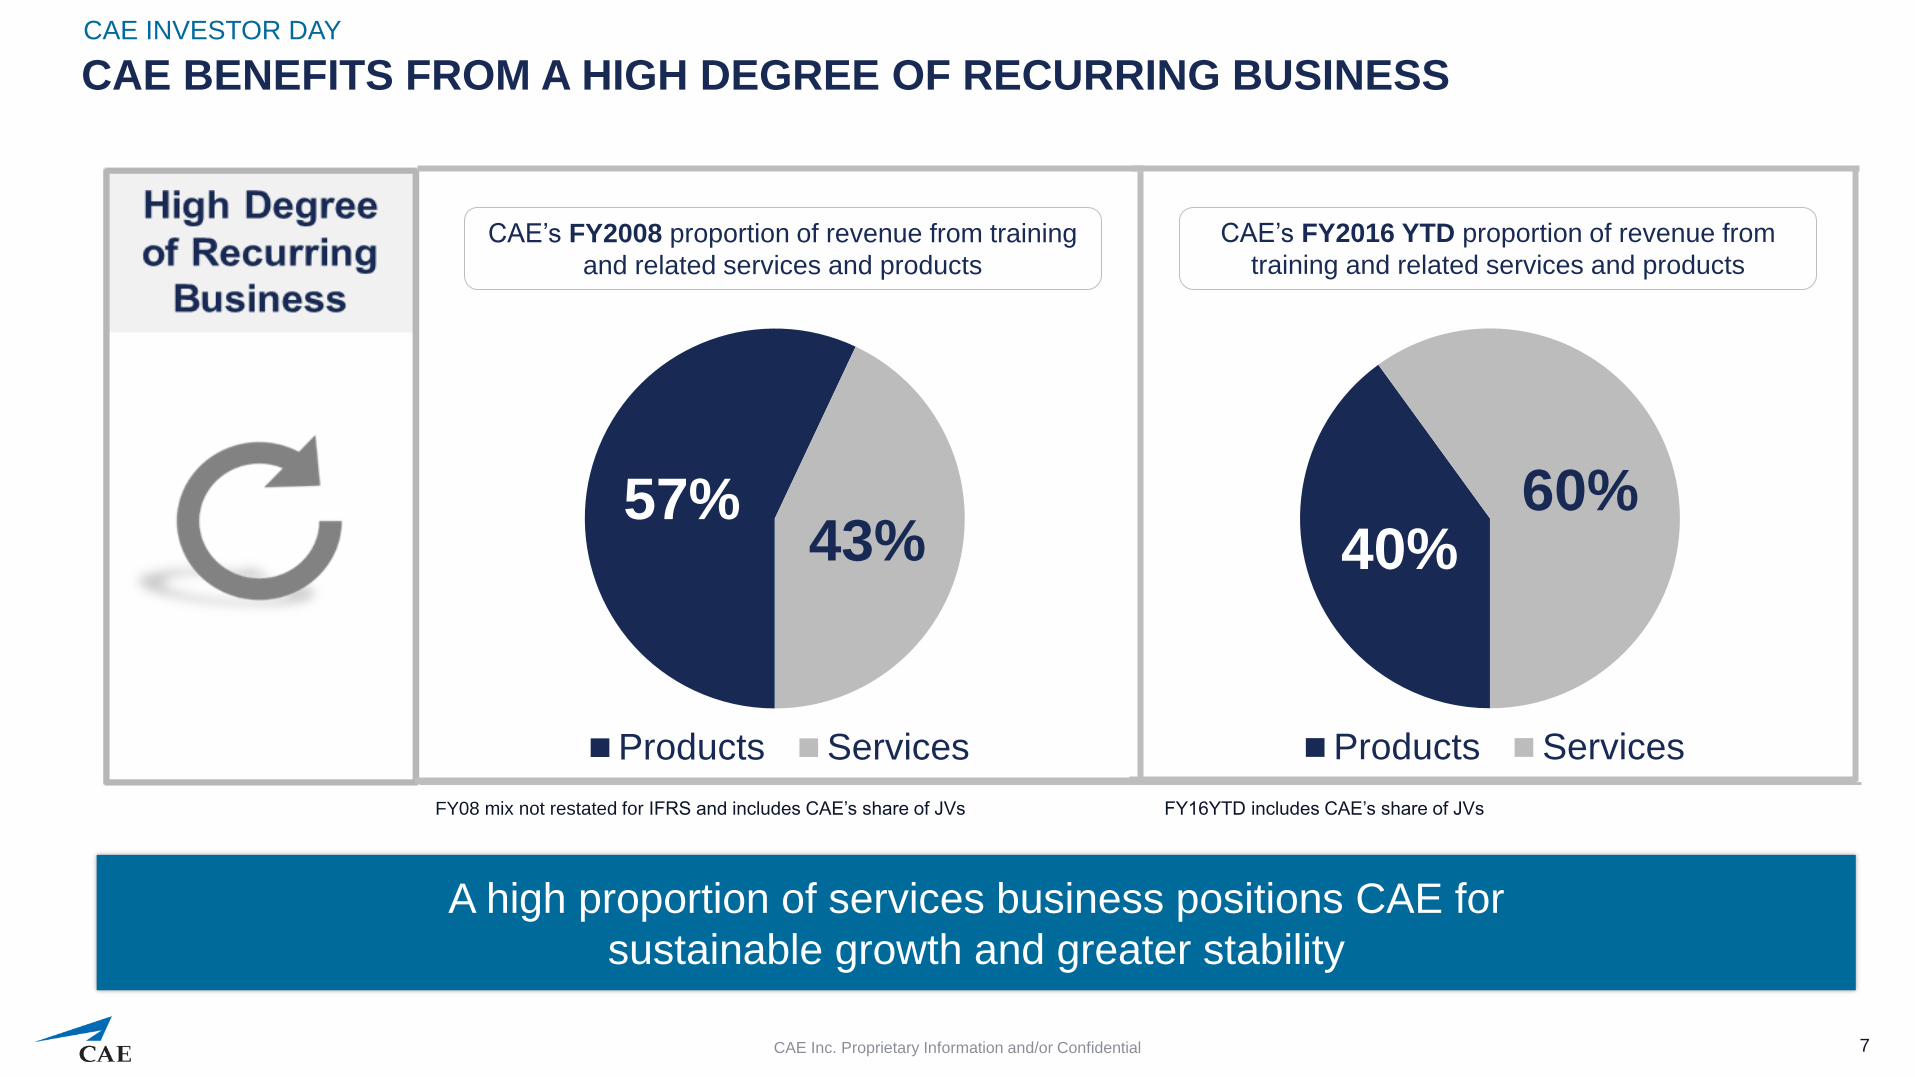
CAE BENEFITS FROM A HIGH DEGREE OF RECURRING BUSINESS
CAE INVESTOR DAY
7 CAE Inc. Proprietary Information and/or Confidential
57% 43%
Products Services
A high proportion of services business positions CAE for
sustainable growth and greater stability
CAE’s FY2008 proportion of revenue from training
and related services and products
40% 60%
Products Services
CAE’s FY2016 YTD proportion of revenue from
training and related services and products
FY08 mix not restated for IFRS and includes CAE’s share of JVs FY16YTD includes CAE’s share of JVs
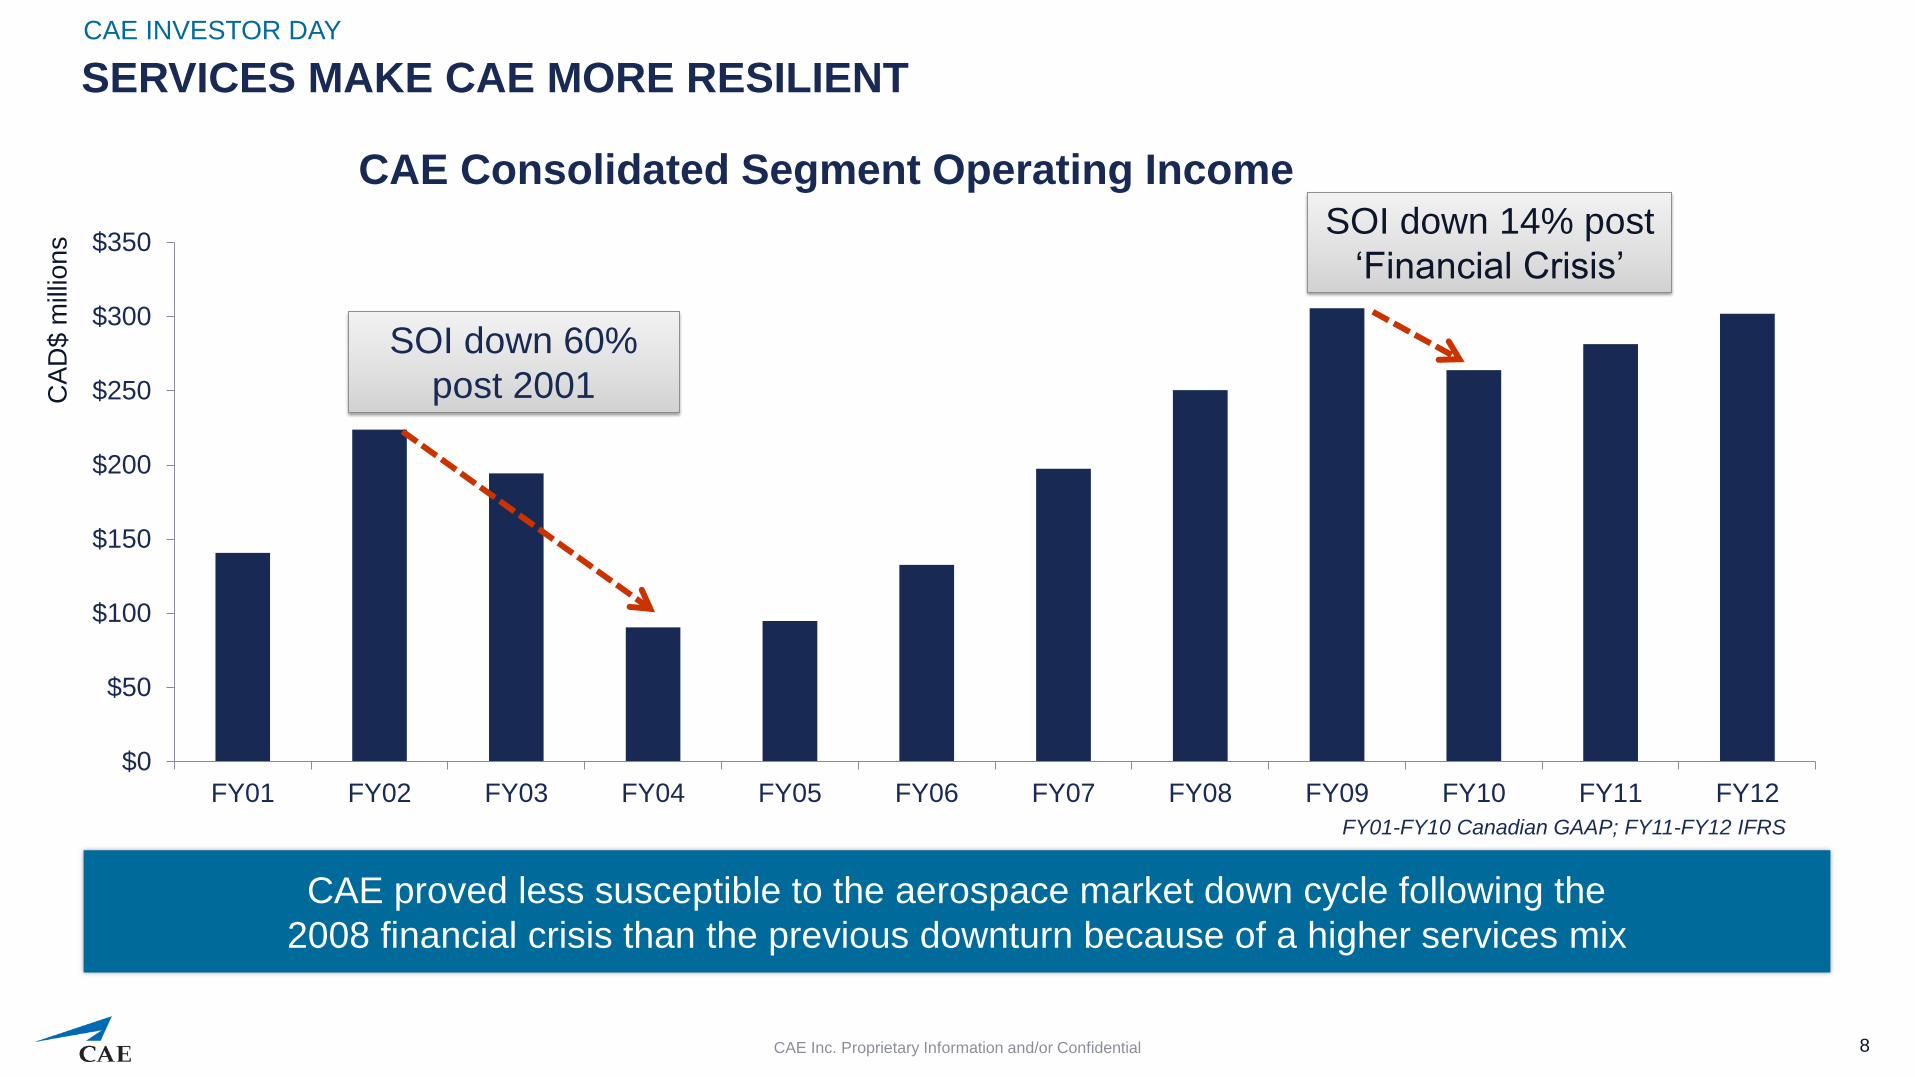
SERVICES MAKE CAE MORE RESILIENT
CAE INVESTOR DAY
8 CAE Inc. Proprietary Information and/or Confidential
CAE proved less susceptible to the aerospace market down cycle following the
2008 financial crisis than the previous downturn because of a higher services mix
$0
$50
$100
$150
$200
$250
$300
$350
FY01 FY02 FY03 FY04 FY05 FY06 FY07 FY08 FY09 FY10 FY11 FY12
SOI down 60%
post 2001
SOI down 14% post
‘Financial Crisis’
CAE Consolidated Segment Operating Income
CA
D$
mill
ion
s
FY01-FY10 Canadian GAAP; FY11-FY12 IFRS
0%
2%
4%
6%
8%
10%
12%
14%
16%
18%
Q1 Q2 Q3 Q4 Q1 Q2 Q3 Q4 Q1 Q2 Q3 Q4 Q1 Q2 Q3 Q4 Q1 Q2 Q3 Q4 Q1 Q2 Q3 Q4 Q1 Q2 Q3 Q4 Q1 Q2 Q3 Q4 Q1 Q2 Q3 Q4
FY08 FY09 FY10 FY11 FY12 FY13 FY14 FY15 FY16
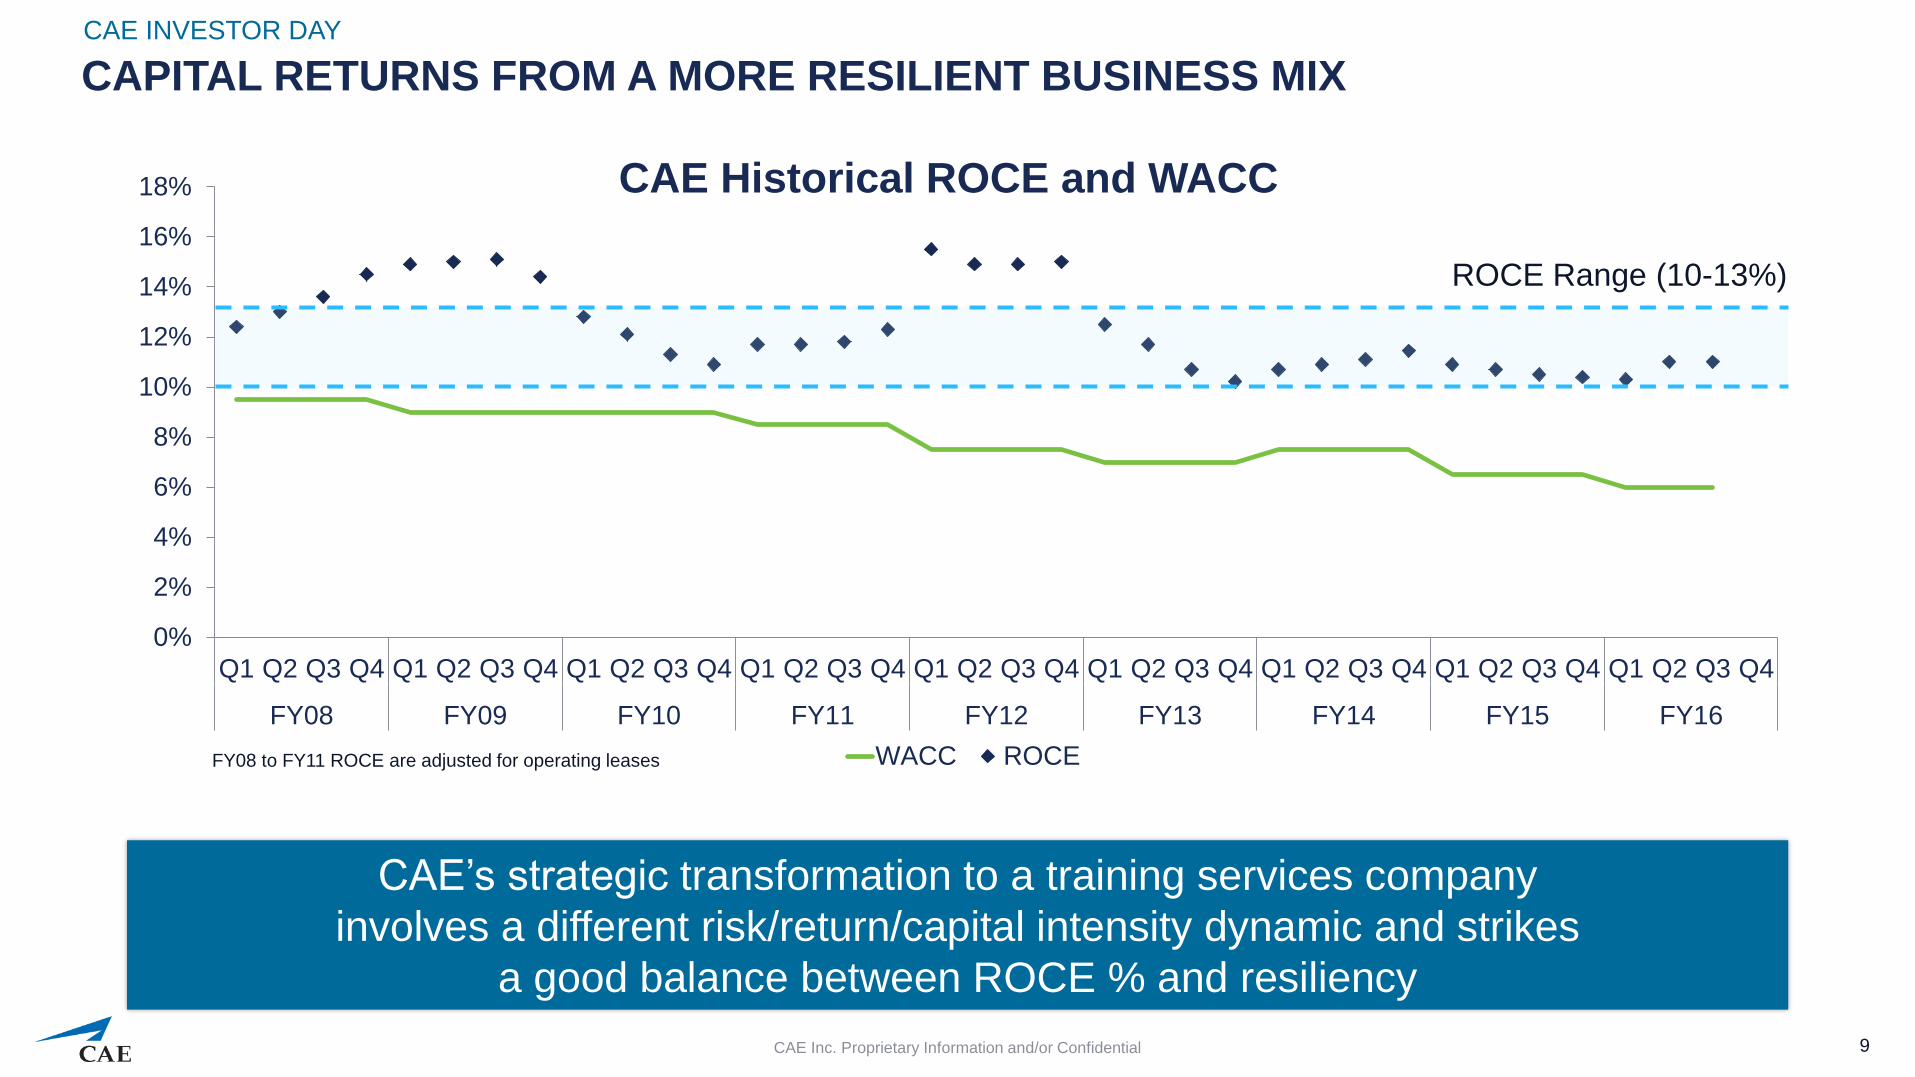
WACC ROCEFY08 to FY11 ROCE are adjusted for operating leases
CAPITAL RETURNS FROM A MORE RESILIENT BUSINESS MIX
CAE INVESTOR DAY
9 CAE Inc. Proprietary Information and/or Confidential
CAE’s strategic transformation to a training services company
involves a different risk/return/capital intensity dynamic and strikes
a good balance between ROCE % and resiliency
CAE Historical ROCE and WACC
ROCE Range (10-13%)
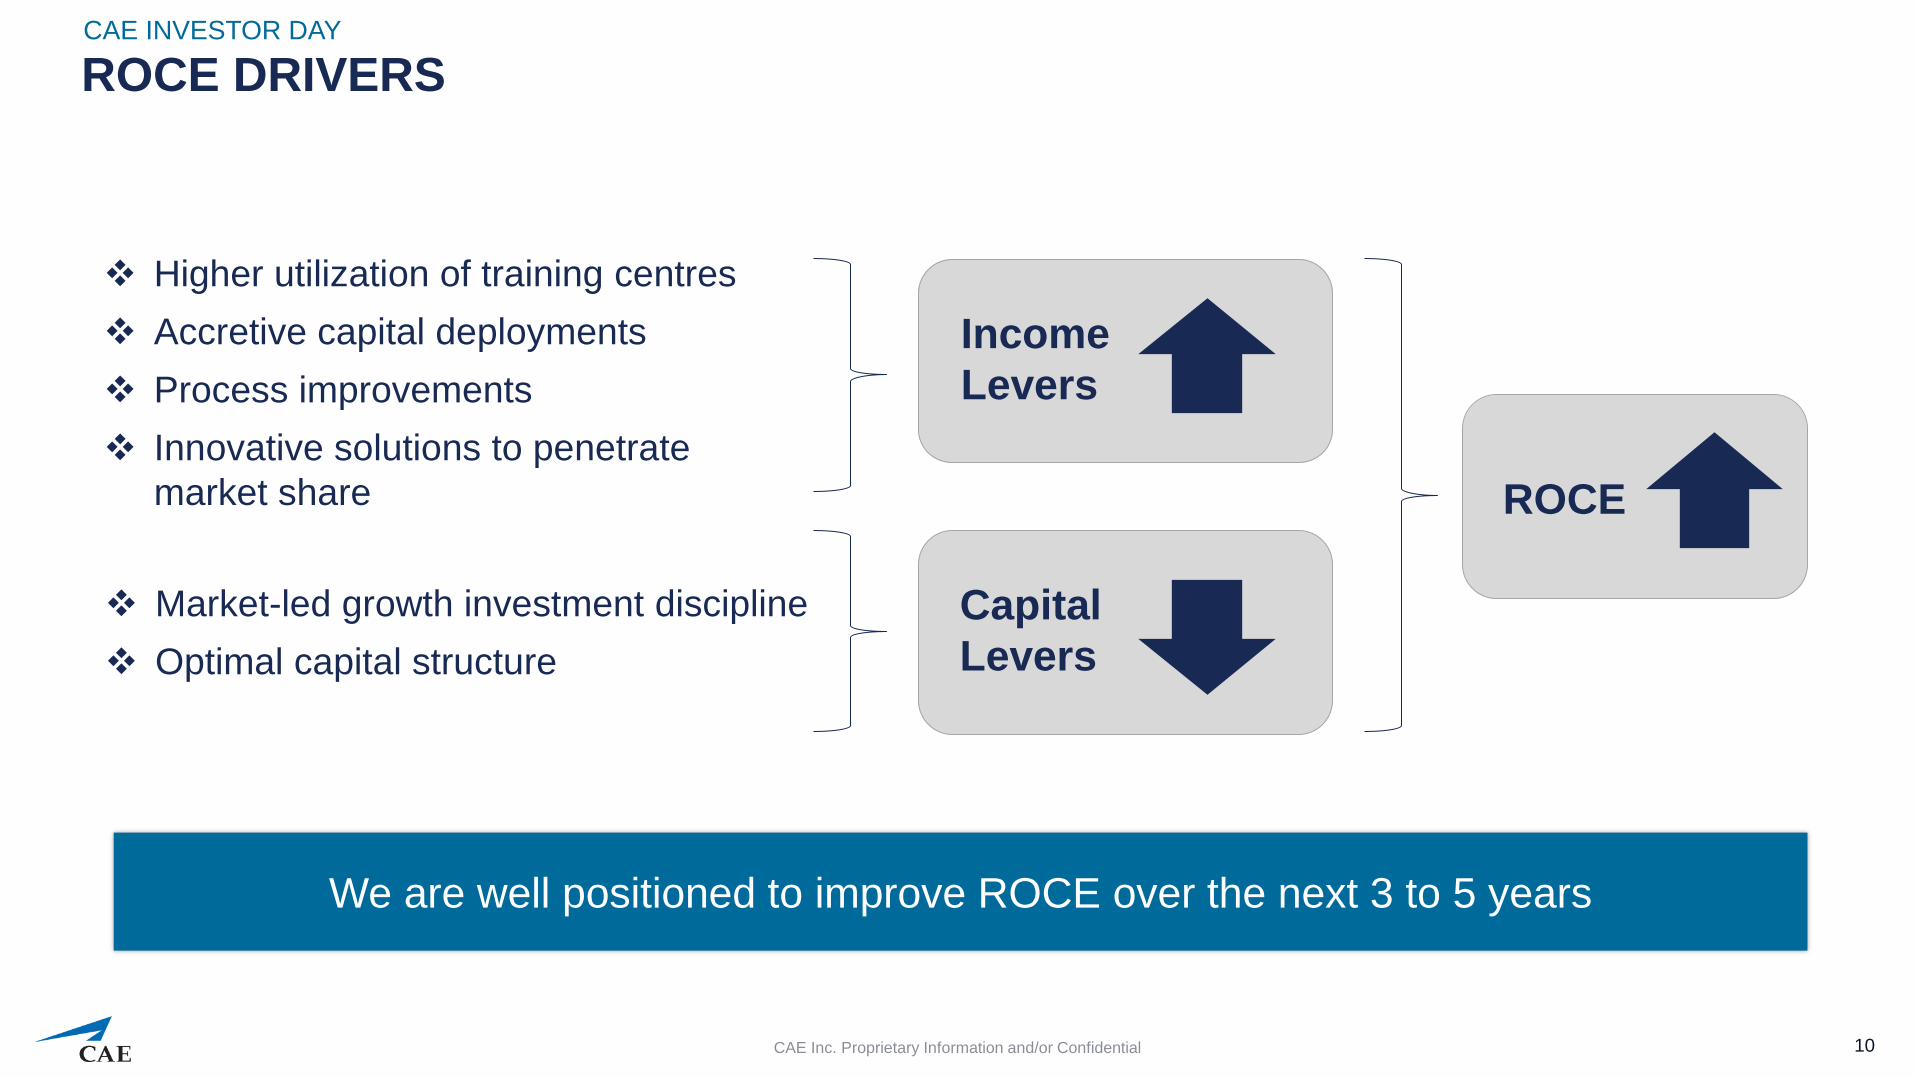
ROCE DRIVERS CAE INVESTOR DAY
10
Higher utilization of training centres
Accretive capital deployments
Process improvements
Innovative solutions to penetrate
market share
Income
Levers
Capital
Levers
ROCE
Market-led growth investment discipline
Optimal capital structure
We are well positioned to improve ROCE over the next 3 to 5 years
CAE Inc. Proprietary Information and/or Confidential

CAPITAL ALLOCATION PRIORITIES
► Invest in sustainable growth
Market/customer-led investments with a clear path to attractive recurring returns
► Provide current shareholder returns in addition to generating long term growth
Current shareholder returns to increase with earnings/cash performance
CAE INVESTOR DAY
11
1
2
CAE Inc. Proprietary Information and/or Confidential

24%
35%
10%
15%
20%
25%
30%
35%
40%
$0.00
$0.05
$0.10
$0.15
$0.20
$0.25
$0.30
$0.35
FY11 FY12 FY13 FY14 FY15 FY16 YTD
CAE Dividend Payout Ratio
Dividend per share Payout Ratio
CURRENT SHAREHOLDER RETURNS CAE INVESTOR DAY
12 CAE Inc. Proprietary Information and/or Confidential
2
Enhancing current returns remains a priority and reflects the Company’s desire to
balance long-term capital appreciation and cash returns to shareholders
The normal course issuer bid now gives CAE a second avenue to return capital to shareholders
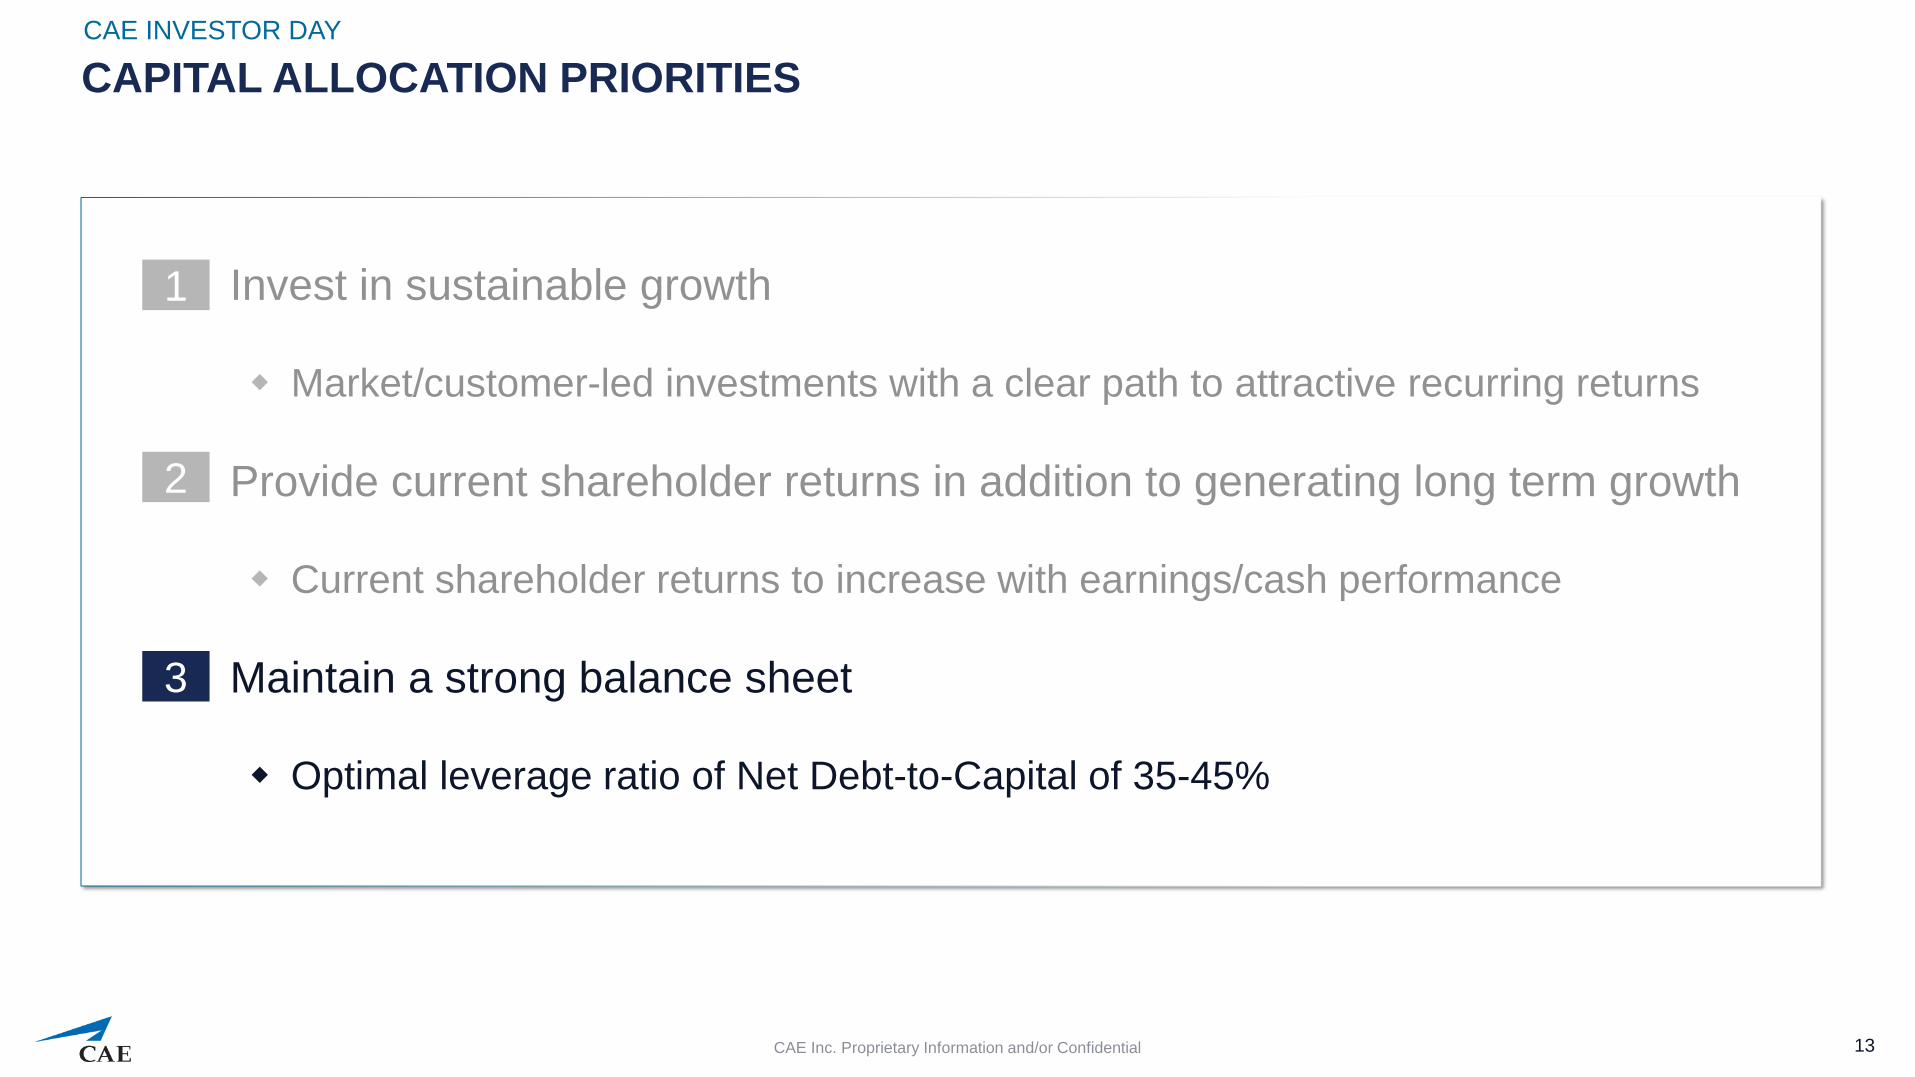
CAPITAL ALLOCATION PRIORITIES
► Invest in sustainable growth
Market/customer-led investments with a clear path to attractive recurring returns
► Provide current shareholder returns in addition to generating long term growth
Current shareholder returns to increase with earnings/cash performance
► Maintain a strong balance sheet
Optimal leverage ratio of Net Debt-to-Capital of 35-45%
CAE INVESTOR DAY
13
1
2
3
CAE Inc. Proprietary Information and/or Confidential
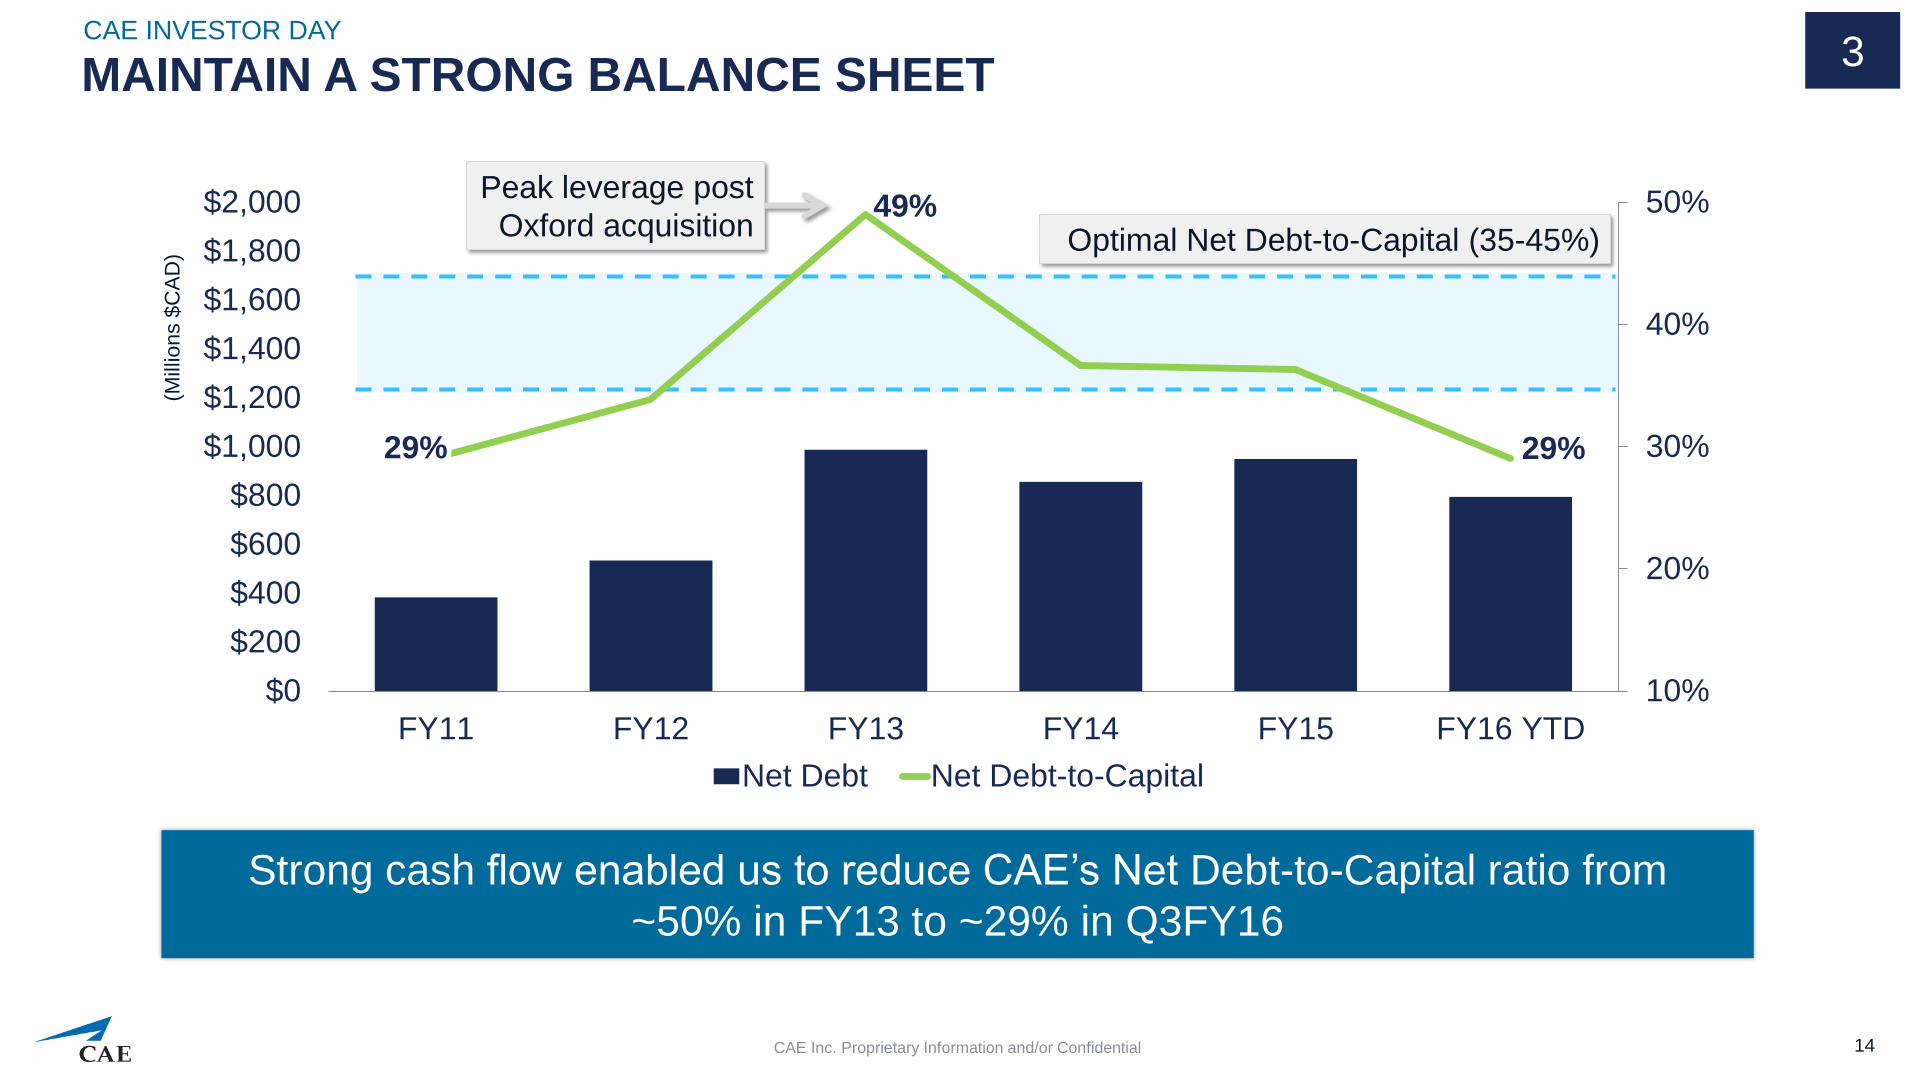
29%
49%
29%
10%
20%
30%
40%
50%
$0
$200
$400
$600
$800
$1,000
$1,200
$1,400
$1,600
$1,800
$2,000
FY11 FY12 FY13 FY14 FY15 FY16 YTD
Net Debt Net Debt-to-Capital
MAINTAIN A STRONG BALANCE SHEET CAE INVESTOR DAY
14 CAE Inc. Proprietary Information and/or Confidential
3
Strong cash flow enabled us to reduce CAE’s Net Debt-to-Capital ratio from
~50% in FY13 to ~29% in Q3FY16
(Mill
ions $
CA
D)
Optimal Net Debt-to-Capital (35-45%)
Peak leverage post
Oxford acquisition
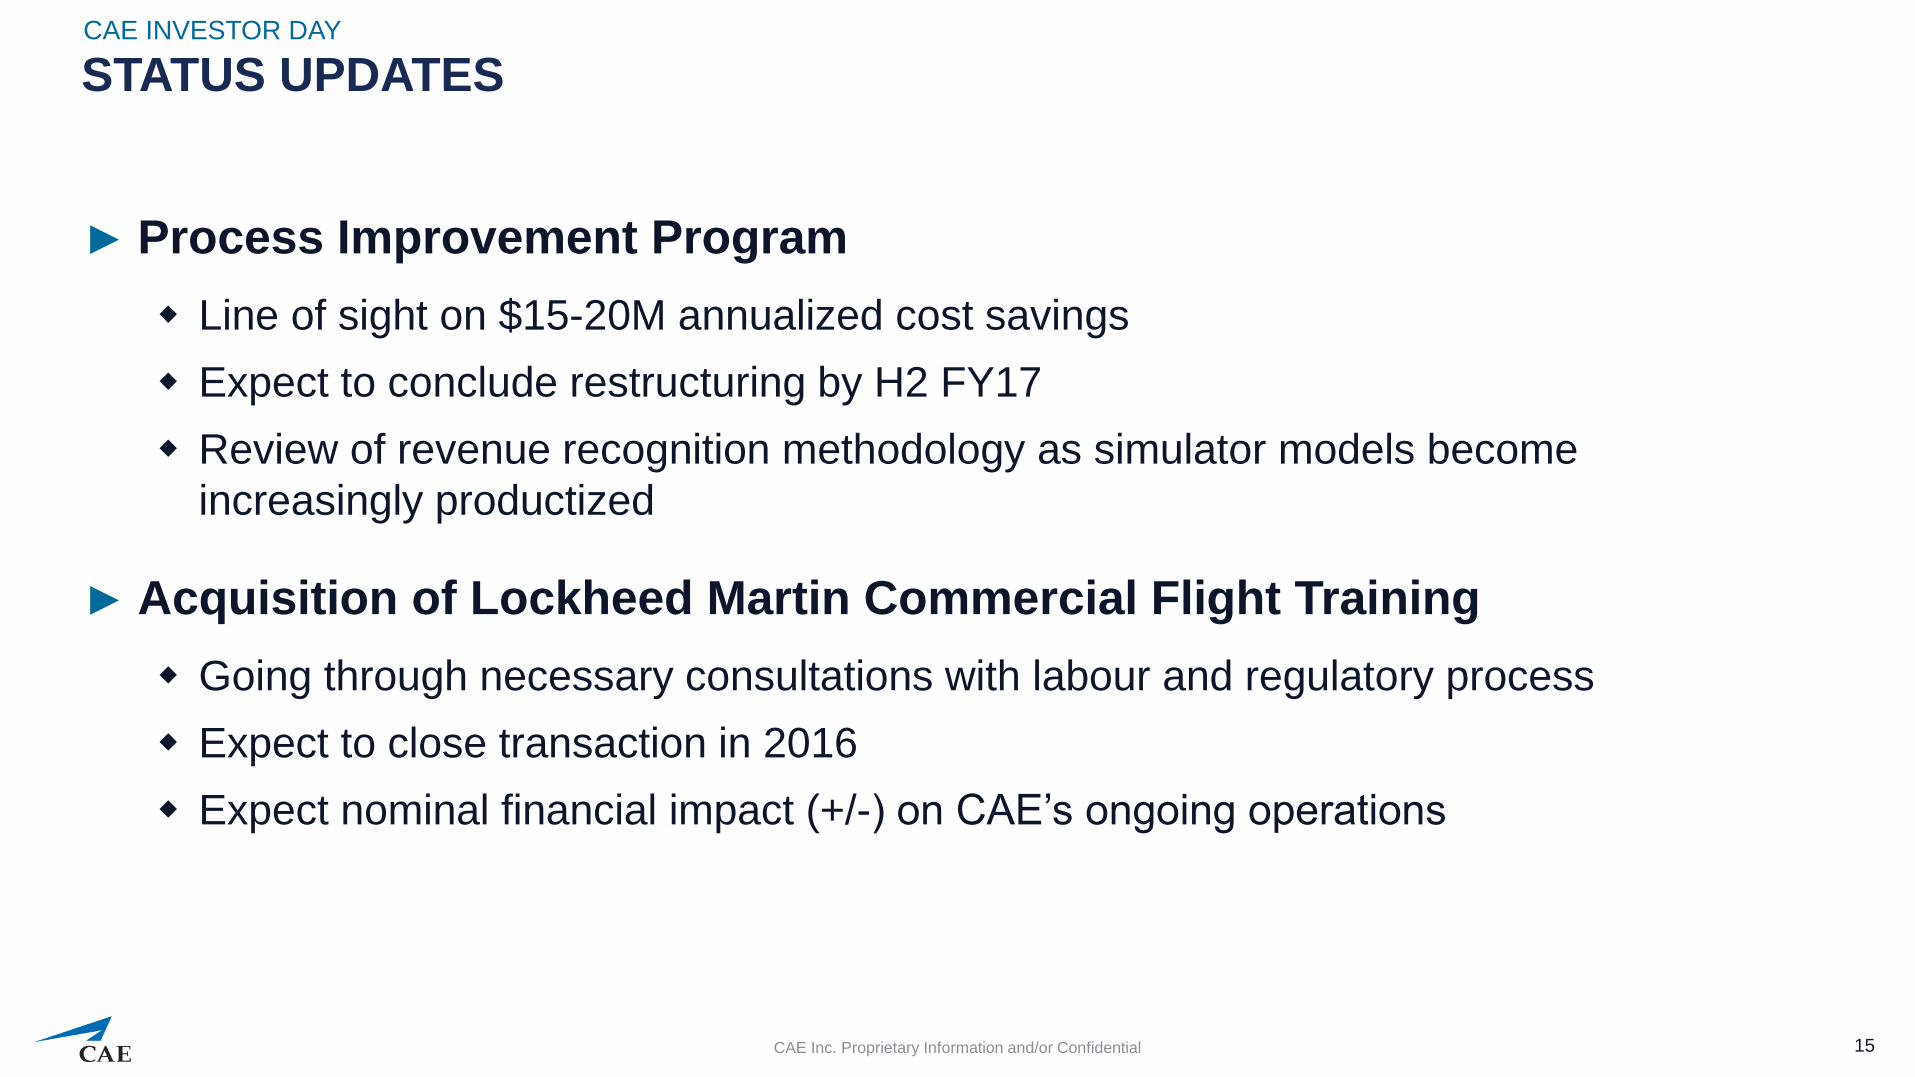
STATUS UPDATES
► Process Improvement Program
Line of sight on $15-20M annualized cost savings
Expect to conclude restructuring by H2 FY17
Review of revenue recognition methodology as simulator models become
increasingly productized
► Acquisition of Lockheed Martin Commercial Flight Training
Going through necessary consultations with labour and regulatory process
Expect to close transaction in 2016
Expect nominal financial impact (+/-) on CAE’s ongoing operations
CAE INVESTOR DAY
15 CAE Inc. Proprietary Information and/or Confidential
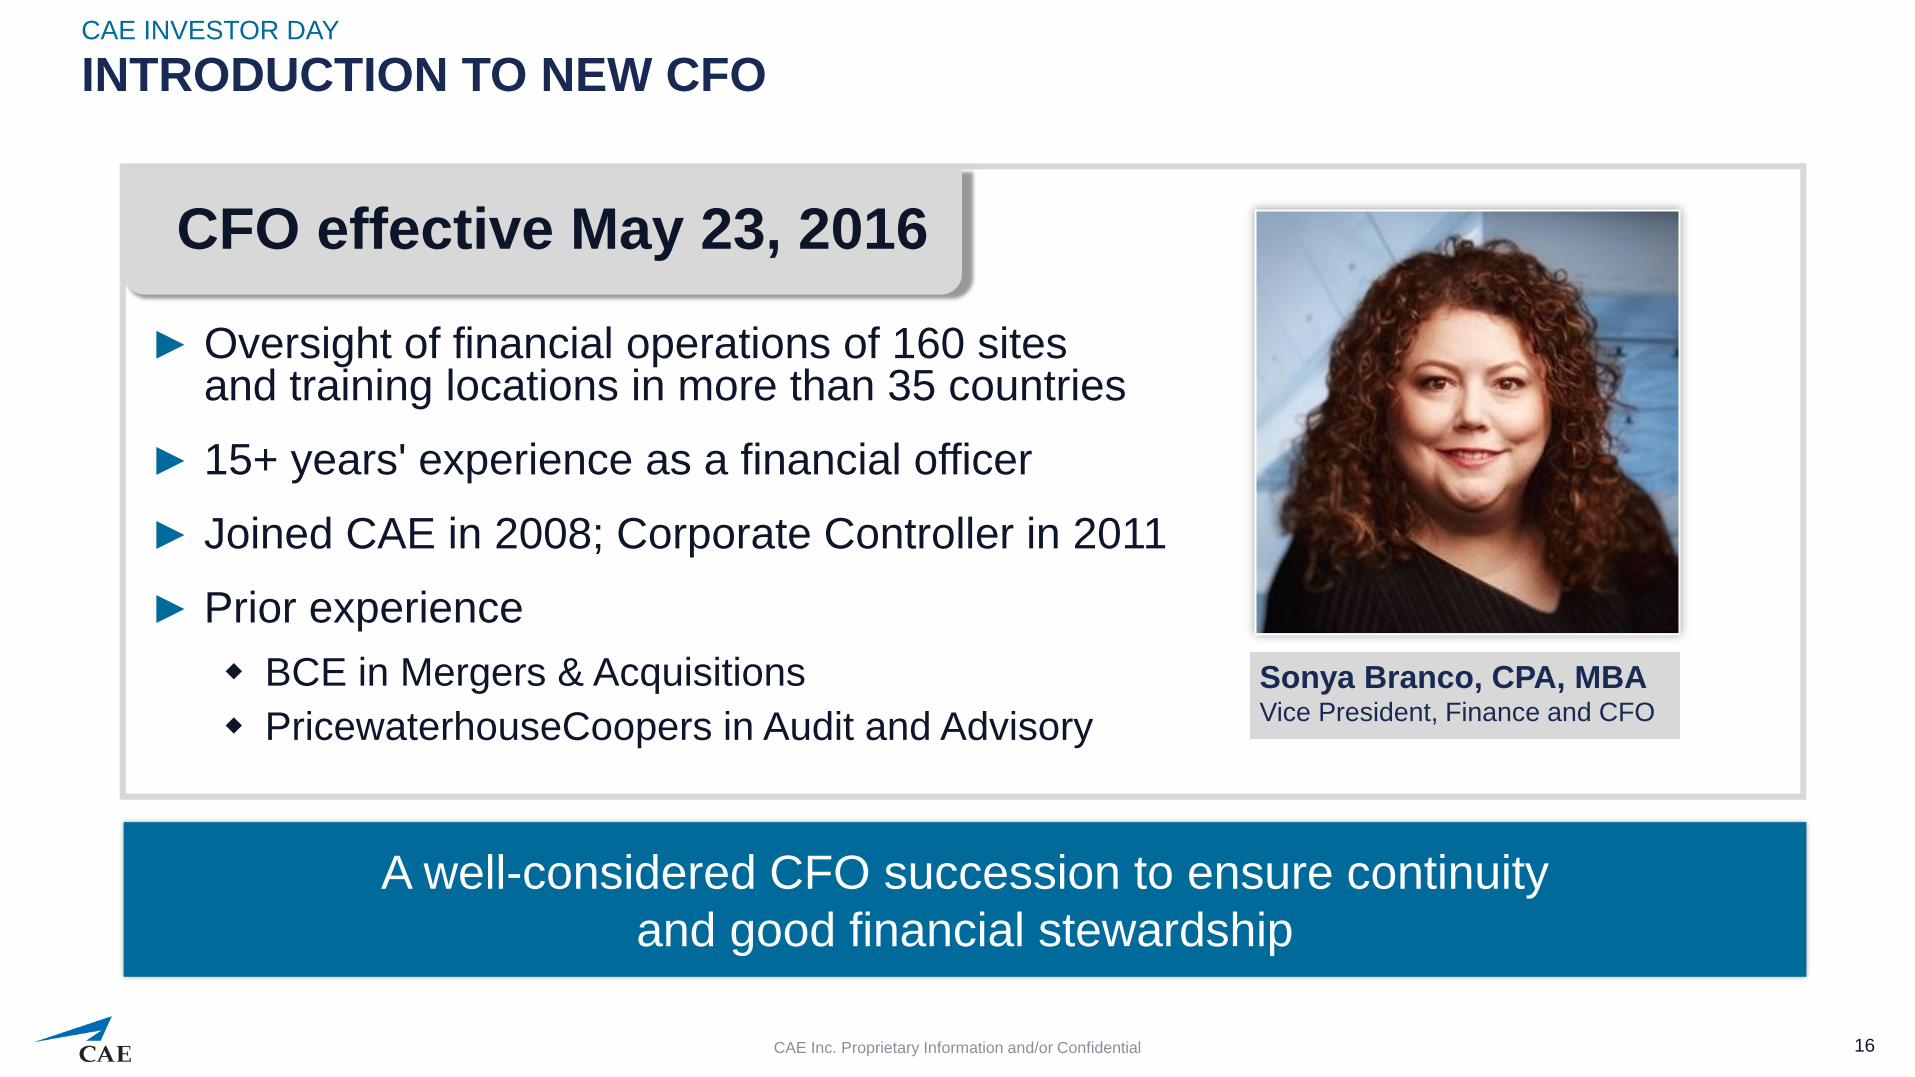
► Oversight of financial operations of 160 sites and training locations in more than 35 countries
► 15+ years' experience as a financial officer
► Joined CAE in 2008; Corporate Controller in 2011
► Prior experience
BCE in Mergers & Acquisitions
PricewaterhouseCoopers in Audit and Advisory
INTRODUCTION TO NEW CFO CAE INVESTOR DAY
CAE Inc. Proprietary Information and/or Confidential 16
Sonya Branco, CPA, MBA Vice President, Finance and CFO
A well-considered CFO succession to ensure continuity
and good financial stewardship
CFO effective May 23, 2016

NON-GAAP MEASURES ► Free cash flow is a non-GAAP measure that shows us how much cash we have available to invest in growth opportunities, repay debt and meet ongoing financial obligations. We use
it as an indicator of our financial strength and liquidity. We calculate it by taking the net cash generated by our continuing operating activities, subtracting maintenance capital
expenditures, investment in other assets not related to growth and dividends paid and adding proceeds from the disposal of property, plant and equipment, dividends received from
equity accounted investees and proceeds, net of payments, from equity accounted investees.
► Net debt is a non-GAAP measure we use to monitor how much debt we have after taking into account liquid assets such as cash and cash equivalents. We use it as an indicator of
our overall financial position, and calculate it by taking our total long-term debt, including the current portion of long-term debt, and subtracting cash and cash equivalents. Net debt-to-
capital is calculated as net debt divided by the sum of total equity plus net debt.
► Total backlog is non-GAAP measure that includes obligated backlog, joint venture backlog and unfunded backlog. Obligated backlog represents the expected value of orders we have
received but have not yet executed. Joint venture backlog is obligated backlog that represents the expected value of our share of orders that our joint ventures have received but have
not yet executed. Unfunded backlog represents firm Defence and Security orders we have received but have not yet executed and for which funding authorization has not yet been
obtained. We include unexercised negotiated options which we view as having a high probability of being exercised, but exclude indefinite-delivery/indefinite-quantity (IDIQ) contracts.
► The book-to-sales ratio is the total orders divided by total revenue in a given period.
► Capital employed is a non-GAAP measure we use to evaluate and monitor how much we are investing in our business. For each segment, we take the total assets (not including
cash and cash equivalents, tax accounts and other non-operating assets), and subtract total liabilities (not including tax accounts, long-term debt and the current portion of long-term
debt, royalty obligations, employee benefit obligations and other non-operating liabilities)
► Segment operating income (SOI) is a non-GAAP measure and our key indicator of each segment’s financial performance. This measure gives us a good indication of the profitability
of each segment because it does not include the impact of any items not specifically related to the segment’s performance. We calculate it by taking the operating profit and excluding
the impact of restructuring costs.
► Maintenance capital expenditure is a non-GAAP measure we use to calculate the investment needed to sustain the current level of economic activity. Growth capital expenditure is a
non-GAAP measure we use to calculate the investment needed to increase the current level of economic activity.
► Return on capital employed (ROCE) is a non-GAAP measure we use to evaluate the profitability of our invested capital. We calculate this ratio over a rolling four-quarter period by
taking net income attributable to equity holders of the Company excluding net finance expense, after tax, divided by the average capital employed
► Utilization rate is an operating measure we use to assess the performance of our Civil simulator training network. We calculate it by taking the number of training hours sold on our
simulators during the period divided by the practical training capacity available for the same period.
CAE INVESTOR DAY
CAE Inc. Proprietary Information and/or Confidential 17


