21
www.newport.gov.uk/airquality [email protected] Caerleon Traffic Light Gateway: Feasibility Study 10 – 12 th May 2016 Newport City Council Environmental Health
www.newport.gov.uk/airquality [email protected]
Caerleon Traffic Light
Gateway:
Feasibility Study
10 – 12th May 2016
Newport City Council
Environmental Health

1
Introduction
Caerleon High Street has been designated as an Air Quality Management Area (AQMA) since 2001. The volume, composition of traffic, the narrow High Street flanked by relatively tall buildings and the wider road infrastructural all contribute to the poor air quality. Since the designation of the AQMA, the air quality in the High Street has shown little sign of improving. This has been compounded with additional developments in the area generating additional traffic and subsequently impacting local air quality.
In 2014 Newport City Council commissioned a study by AECOM to identify practical
improvements to the road structure that could help traffic flow and improve air quality. The
report was published in 2015 and identified a number of issues that were causing the traffic
to slow or stop. Primarily these were the pedestrian crossings and bus stops. The report also
highlighted the high traffic volume associated with the Primary and Secondary Schools
caused significant issues.
The report recommended a review of all crossings and bus stops around the one way
system. This has resulted in one bus stop being removed (at the junction near the museum)
and the extension of the bus stop at Goldcroft Common, to allow buses to pull in fully.
Another proposal made by AECOM is a traffic light gateway system. This involves holding
traffic outside of the one way system and allowing it to pass in pulses through the AQMA
rather than idling. Theoretically this has the potential to allow the traffic fumes in the High
Street to dissipate before the next pulse of traffic is allowed to pass.
To test the feasibility of this proposal, a field trial was undertaken for three consecutive
weekday afternoons between 14:00 – 18:00 starting on the 10th May and concluding on the
12th May 2016. This report will present and discuss the findings of the study. It will also
provide recommendations for further work. This study and report has been undertaken by
Newport City Council Environmental Health staff.

2
Options Appraisal
All options for the configuration of traffic light signals were considered for their advantages
and disadvantages from an Air Quality / Environmental Health perspective. Five schemes
were considered for the trial:
1 Three way traffic light signals positioned at the Belmont Hill (New Road) / Caerleon Road Junction. Pros: This configuration would have the advantage of allowing traffic to flow out of Belmont Hill more easily at the same time allowing a pulse of traffic to flow through the one way system. Cons: Traffic would be held on Caerleon Road for longer and traffic may back up over the bridge at the pinch point – possibly extending into Castle Street. Whilst an air quality improvement in the High Street is possible, this system may prove detrimental to air quality in Castle Street. Furthermore it may be detrimental to the air quality at the Toll House and Gwent Cottage.
Figure 1 Three way signal
2 Three way traffic signals placed before and after the bridge. Pros: Would resolve the Belmont Hill (New Road) / Caerleon Road traffic congestion and allow pulses of traffic through the AQMA. Also would allow the pinch point on the bridge to remain clear. Cons: Traffic may start to build up along Castle Street causing air quality to deteriorate. Air quality may also deteriorate further at the Toll House and Gwent Cottage.
Figure 2 Extended three way signal
3
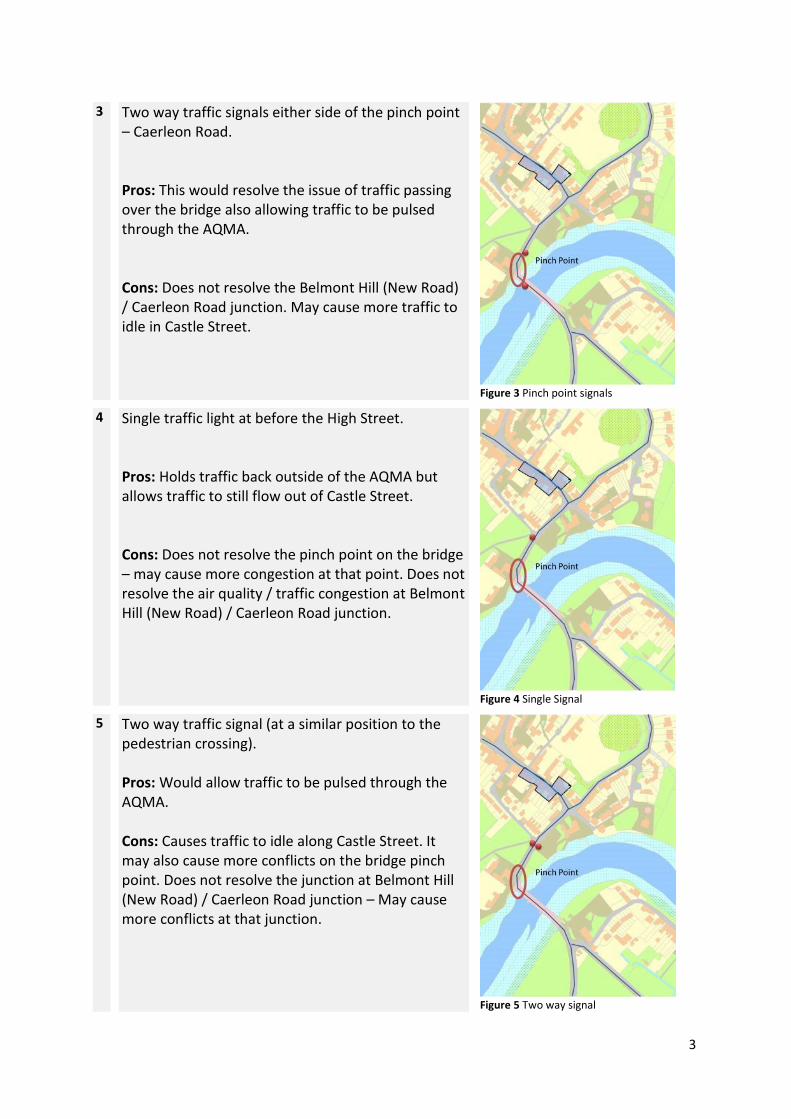
3 Two way traffic signals either side of the pinch point – Caerleon Road. Pros: This would resolve the issue of traffic passing over the bridge also allowing traffic to be pulsed through the AQMA. Cons: Does not resolve the Belmont Hill (New Road) / Caerleon Road junction. May cause more traffic to idle in Castle Street.
Figure 3 Pinch point signals
4 Single traffic light at before the High Street. Pros: Holds traffic back outside of the AQMA but allows traffic to still flow out of Castle Street. Cons: Does not resolve the pinch point on the bridge – may cause more congestion at that point. Does not resolve the air quality / traffic congestion at Belmont Hill (New Road) / Caerleon Road junction.
Figure 4 Single Signal
5 Two way traffic signal (at a similar position to the pedestrian crossing). Pros: Would allow traffic to be pulsed through the AQMA. Cons: Causes traffic to idle along Castle Street. It may also cause more conflicts on the bridge pinch point. Does not resolve the junction at Belmont Hill (New Road) / Caerleon Road junction – May cause more conflicts at that junction.
Figure 5 Two way signal
4
As this is an initial feasibility trial, the simplest of the possible options was considered the most
appropriate and controllable – Option 4: A single light for the afternoon peak traffic flow (including
the school traffic).
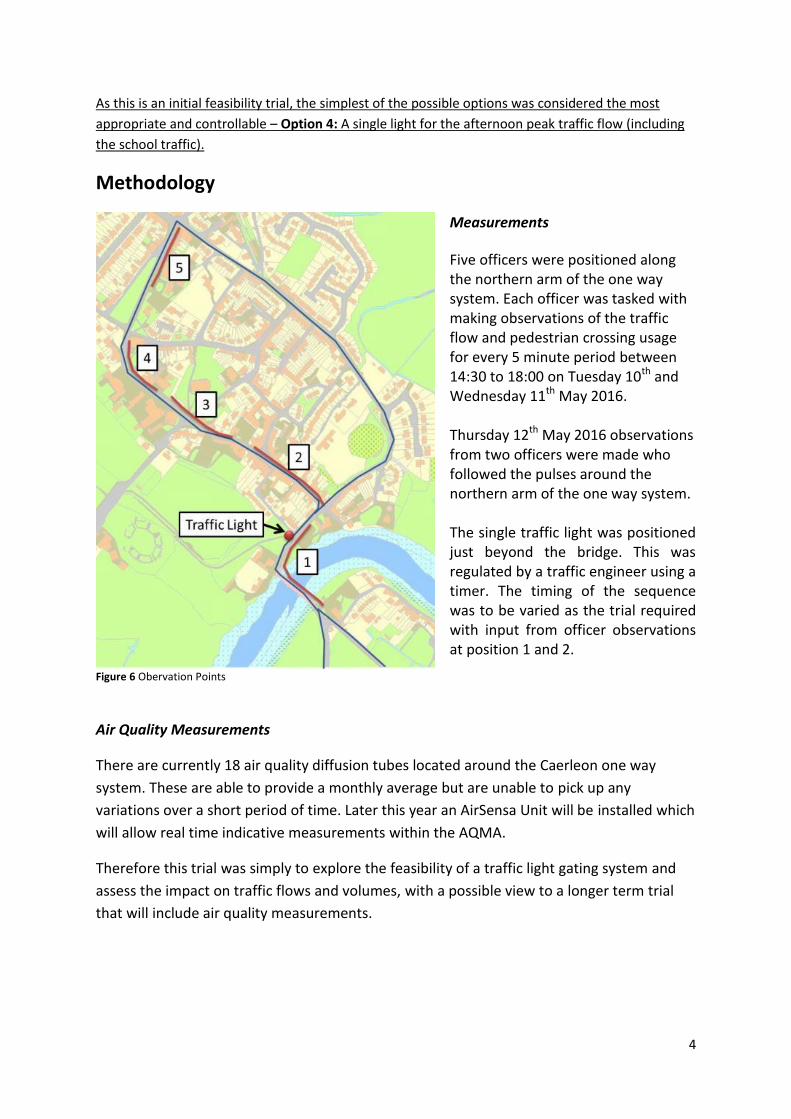
Methodology
Figure 6 Obervation Points
Measurements
Five officers were positioned along the northern arm of the one way system. Each officer was tasked with making observations of the traffic flow and pedestrian crossing usage for every 5 minute period between 14:30 to 18:00 on Tuesday 10th and Wednesday 11th May 2016. Thursday 12th May 2016 observations from two officers were made who followed the pulses around the northern arm of the one way system. The single traffic light was positioned just beyond the bridge. This was regulated by a traffic engineer using a timer. The timing of the sequence was to be varied as the trial required with input from officer observations at position 1 and 2.
Air Quality Measurements
There are currently 18 air quality diffusion tubes located around the Caerleon one way
system. These are able to provide a monthly average but are unable to pick up any
variations over a short period of time. Later this year an AirSensa Unit will be installed which
will allow real time indicative measurements within the AQMA.
Therefore this trial was simply to explore the feasibility of a traffic light gating system and
assess the impact on traffic flows and volumes, with a possible view to a longer term trial
that will include air quality measurements.

5
Results
The trial was undertaken during the afternoon of the 10th 11th and 12th May 2016 between
14:00 – 18:00. It should be noted that Year 11 Pupils were on study leave during this period
which is likely to have had an impacted upon the overall volume of traffic, amongst other
factors (i.e. weather).
Ahead of the trial road markings were refreshed around the Hanbury Pub side of the bridge
(yellow hashed markings), the bus stop opposite the museum was removed and the bus
stop on Goldcroft Common was extended in length.
Weather Conditions
10th May 2016 – Warm damp, over cast with constant light rain 11th May 2016 – Warm damp, over cast with frequent heavy rain 12th May 2016 – Warm, sunny with rare cloud.
Officer Observations
Position 1 Observation
Over the three day period the volume and peak periods of traffic appeared to vary significantly. Large vehicles (Buses, Coaches, HGVs etc) struggled to pass on the bridge. Traffic rarely kept the yellow hashed area clear and had a knock on affect causing traffic to back up to/along Castle Street. However the lack of visibility of the traffic signals may account for this. A high volume of traffic was observed turning from Caerleon Road to Belmont Hill (New Road) and from Belmont Hill turning towards Caerleon. Traffic was frequently building at this junction resulting in almost constant idling of traffic between Gwent Cottage and the Toll House. The timing of the traffic light sequence varied based upon the officer observations. A summary is provided in the following table.
Figure 7 Position 1 observations

6
10th May 2016
Time Red Green Comments
14:30 3 minute 1 minute 30 seconds (minimum green period possible)
Traffic began to back up beyond the 30/40 mph sign on Caerleon Road. Conflict with large vehicles on bridge pinch point. Traffic began to back up significantly along Belmont Hill being blocked at the Caerleon Road Junction.
15:00 2 minute
15:05 1 minute
15:30 30 seconds
Traffic was quickly cleared and obstructions at the bridge pinch point were quickly resolved. 16:10 45
seconds 11th May & 12th May 2016
(No Change)
45 seconds
1 minute 30 seconds
From first day of the trial this timing sequence appeared to be the most appropriate.
Positon 2 Observations
The entrance to the High Street is a relatively tight up hill corner. It was observed that many
vehicles had to change gear whilst going up the incline, this led to a variation in speed
between vehicles causing bunching.
It was observed a pulse was able to pass the majority of the AQMA with a 30/45 second
green period but the tail end may still be struggling to clear the AQMA completely. At times,
traffic quickly started backing up into the AQMA which appeared to be due to restrictions
outlined below, or for reasons beyond the area observed. Each pulse approximately 30
vehicles were allowed to pass. A summary of the main observations is provided below.
Observation Impact on Traffic Flow
Figure 8 Position 2 Observations
Scaffolding truck double parked outside of the White Heart Public House causing
restriction in traffic flow. Bus struggles to pass causing traffic to come to a standstill.
Slow – Stationary
Parking on double yellow lines within AQMA causing traffic to slow.
Slows
Royal Mail Van double parked with Hazards on outside of Post Office, causes
traffic to slow
Slows
2 point turn within AQMA for vehicle to access private driveway – causes traffic to
stop
Stationary
Reverse / poor parking within area of the row of shops causes traffic to slow
Slows
Pedestrian crossing usage was infrequent (full results provided later in the report)
Infrequently slows traffic

7
Position 3 Observations
The section of road near the museum is relatively open compared to the lower part of the High Street. However several conflicts occurred that hindered traffic flow, these are outlined below.
Observation Impact on Traffic Flow
Figure 9 Position 4 Observations
Conflicts at the junction with the high school traffic.
Slow - Stationary
Frequent parking on the double yellow lines was
observed. Slow - Stationary
Buses were observed to be still stopping at the bus stop that
had been removed. Slow - Stationary
Use of the pedestrian crossing was also observed to
occasionally hamper traffic flow.
Occasionally Slows Traffic
Position 4 Observations
Located outside of the primary school it was observed that school closing time caused significant impact upon traffic flows.
Observation Impact on Traffic Flow
Figure 10 Position 4 Observations
Parking conflicts outside of the school. From both legal
parking with cars pulling in and out, but also from illegal
parking on double yellow lines.
Slow - Stationary
The zebra crossing was observed to be in constant use
when the school closed.
Stationary (when school closed)
Occasionally other parking conflicts occurred outside of
school closing times. Slows (rare)

8
Position 5 Observations
Position 5 located at the top of the one way system near the mini-roundabout. This section is a busy area for parking for local businesses.
Observation Impact on Traffic Flow
Figure 11 Position 5 Observations
The Goldcroft Common bus stop has been recently extended to allow buses to pull in
fully. Unfortunately these buses were occasionally seen to not to pull in fully.
Slows – Stationary
The zebra crossing observed at the top of Goldcroft Common was observed to be in frequent use, especially during the end of
the school day.
Slows – Stationary
Compression Waves
It was observed that activities that impede the traffic flow on the one way system have
significant knock on effects throughout the system. To demonstrate these impacts a
summary of traffic flow rates based the observations made on the 10th and 11th May has
been constructed shown in figures 12 and 13 below.

9
Figure 12 Summary of traffic observations 10th May 2016 Green = Free flowing; Orange = Slow moving; Red = Stationary Traffic; Grey = No Observation Made; DYP = Double Yellow Line Parking causing obstruction; PP = Poor Parking
Position 2 3 4 514:30 School Bus DYP
14:35 DYP
14:40 DYP Funeral + Lorry
14:45 Funeral Bus Lorry Conflict
14:50
14:55 DYP
15:00
15:05 BUS block traffic
15:10 DYP PP
15:15 DYP DYP
15:20 Zebra Crossing
15:25 Zebra Crossing
15:30 Zebra Crossing
15:35 DYP BUS block traffic
15:40
15:45 DYP
15:50
15:55 DYP
16:00 Stalled Car
16:05
16:10 PP BUS block traffic
16:15 DYP Lag due to BUS
16:20
16:25
16:30 PP
16:35
16:40
16:45
16:50
16:55
17:00 Bus Holds up Traffic
17:05
17:10
17:15
17:20
17:25 Bus Blocks Traffic
17:30
17:35
17:40
17:45 ~ 18:00
Main Observations
Tuesday 10th May 2016
10
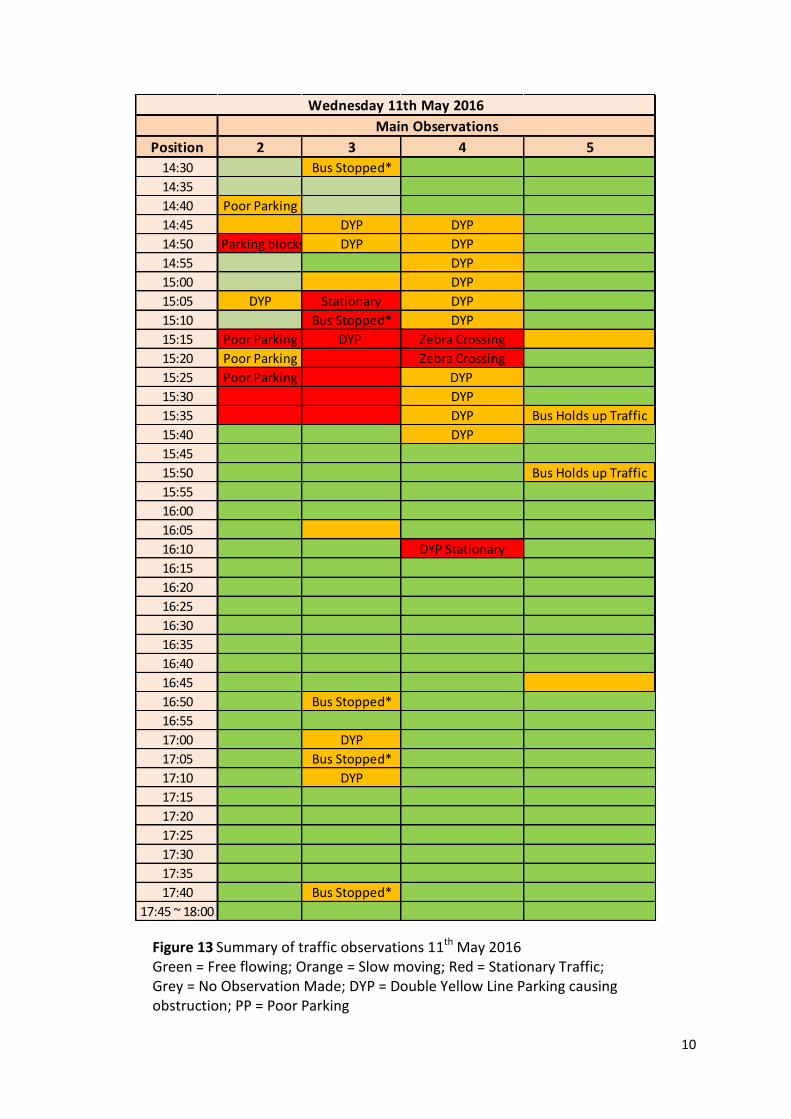
Figure 13 Summary of traffic observations 11th May 2016 Green = Free flowing; Orange = Slow moving; Red = Stationary Traffic; Grey = No Observation Made; DYP = Double Yellow Line Parking causing obstruction; PP = Poor Parking
Position 2 3 4 5
14:30 Bus Stopped*
14:35
14:40 Poor Parking
14:45 DYP DYP
14:50Poor Parking blocks Bus DYP DYP
14:55 DYP
15:00 DYP
15:05 DYP Stationary DYP
15:10 Bus Stopped* DYP
15:15 Poor Parking DYP Zebra Crossing
15:20 Poor Parking Zebra Crossing
15:25 Poor Parking DYP
15:30 DYP
15:35 DYP Bus Holds up Traffic
15:40 DYP
15:45
15:50 Bus Holds up Traffic
15:55
16:00
16:05
16:10 DYP Stationary
16:15
16:20
16:25
16:30
16:35
16:40
16:45
16:50 Bus Stopped*
16:55
17:00 DYP
17:05 Bus Stopped*
17:10 DYP
17:15
17:20
17:25
17:30
17:35
17:40 Bus Stopped*
17:45 ~ 18:00
Wednesday 11th May 2016
Main Observations

11
Pedestrian Crossing Usage
Through the northern arm of the one way system four zebra crossings are present. The
number of times a crossing was used in a 5 minute period in each section was recorded (NB
– the number pedestrian using the crossings was not observed).
10th May 2016 – The observations of the zebra crossing indicate a significant surge at 15:10,
which is associated with end of the school day. A second peak of zebra crossing usage
occurred around 16:05. Pedestrian crossings were observed to be used a total of 403 times
on the 10th May.
Figure 14 Pedestrian crossing usage -10th May 2016
12
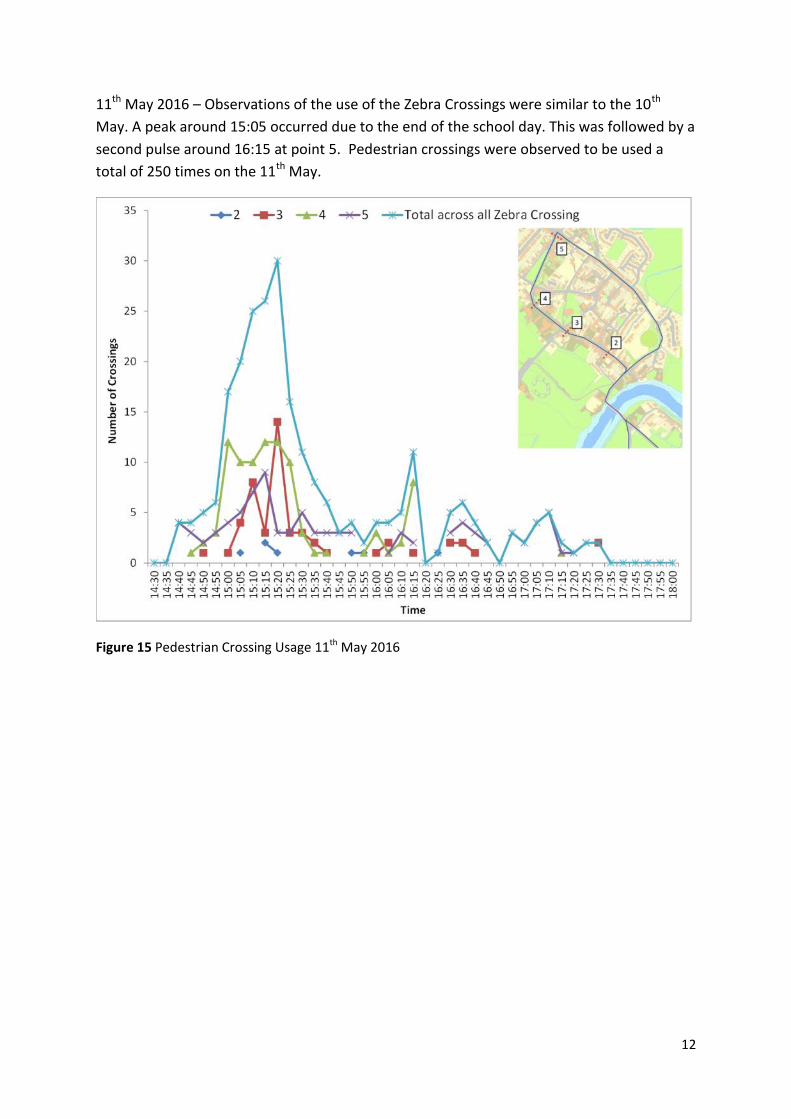
11th May 2016 – Observations of the use of the Zebra Crossings were similar to the 10th
May. A peak around 15:05 occurred due to the end of the school day. This was followed by a
second pulse around 16:15 at point 5. Pedestrian crossings were observed to be used a
total of 250 times on the 11th May.
Figure 15 Pedestrian Crossing Usage 11th May 2016

13
Capacity
The Caerleon one way system is a closed loop with a finite traffic capacity. As shown with
the observations made during this study there are a number of pinch points that can
significantly restrict the capacity.
Figure 16 Capacity analysis and major impediment issues identified SECTION 4 roundabout (A) – school zebra (B), SECTION 3 school zebra (B) – museum junction (C), SECTION 2 museum junction (C) – High Street junction (D), SECTION 1 High Street junction (D) – traffic light.
The northern arm of the one way system is approximately 820 meters long. Assuming an average car length (ACL) is 4.5m rounded up to 5m to allow for a small gap between vehicles (a very conservative underestimate) would provide an approximate capacity of 164 vehicles (this assumes the road is clear and excludes HGVs and buses). From the traffic light timing sequence an average of 30 vehicles were able to pass in one pulse during a 1 minute 30 second green period. Using this data and using four main points of traffic impediments identified a very approximate calculation can be carried out to demonstrate the reduction in capacity along the northern arm of the one way system at each of the main pinch points observed.

14
Point Restriction Calculation %
Reduction
A* Roundabout
and zebra crossing
Total Length 820m / 5.0m (average car length*)
= 164 road capacity
Road capacity 164 / 30 cars per pulse = 5.4 pulse capacity
*Please note for the ease of these calculations at point A it assumes no congestion at the roundabout / zebra crossing.
0%*
B School area
(zebra crossing)
Total Length 820m – Section 4 = 530m
530m / 5m (ACL) = 106 reduced road capacity
106 / 30 (cars per pulse) = 3.5 pulse capacity
5.4 (full capacity) – 3.5 = 2 pulse reduction
Or
106 reduced road capacity / 164 total road capacity
Reduced to 64.6 %
35.4%
C Museum
junction area (junction)
Total length 820m – Sections 3 & 4 = 365m
365m / 5 (ACL) = 73 road capacity
73 road capacity /30 (cars per pulse) = 2.4 pulse capacity
5.4 (full capacity) - 2.4 = 3 Road capacity reduction Or
73 reduced road capacity / 164 total road capacity
Reduced to 44.4%
55.6%
D
High Street junction (zebra
crossing / junction)
Total length 820m – Sections 2,3 & 4 640m= 180m
180m / 5 (ACL) = 36 road capacity
36 road capacity / 30 (cars per pulse) = 1.2 pulse capacity
5.4 (full capacity) - 1.2 = 4.2 Road capacity reduction
Or 36 reduced road capacity / 164 total road capacity
Reduced to 21.9%
78.1%

15
Each of these pinch points described above contribute to a significant reduction in road
capacity. However, from the observations made there are many other reasons why traffic
flow can become restricted anywhere around the one way system. In particular the frequent
poor parking practices observed at all observations points in the one way system.
Traffic Light Timings
Initially on the 10th May the traffic lights were set for a 3 minute period of red. From the officer observations this caused significant tail backs of traffic along both Belmont Hill (New Road) and Caerleon Road during the period the schools closed (15:00). The traffic light sequence was subsequently reduced to 2 minute red period which still caused traffic issues on both of these stretches of road.
Subsequently the timing sequence was reduced to 1 minute 30 green with a period of 45 seconds red. This remained constant throughout trial period 11th and 12th May. This appeared to allow traffic to flow more easily on both stretches of road outside of Caerleon. However it should be noted that a significant change in the volume of traffic was noted on the 11th May compared to the 10th May. From the public feedback it appeared that alternative routes in to Caerleon were being used. This included Pillmawr Road and Ponthir Road. Neither of these routes was observed by officers during the trial, therefore it is not possible to confirm this was the case.
16
During times of relatively light traffic, compared to the school rush period, the traffic light
appeared to produce observable pulses of traffic through the one way system.
Unfortunately at times of high traffic flow and the various impediments to traffic the pulse
from the traffic light were no longer observed.
It is clear that high traffic volumes cause the timed traffic light sequence to fail due to:
1 – Build-up of traffic before the bridge causing additional conflicts at the Belmont Hill /
Caerleon Junction.
2 – Conflicts within the one way system which forms compression waves that block the
AQMA. If these are not cleared in time the traffic light sequence does not produce a pulse of
traffic.
An alternative approach such as a traffic light based on a sensor at the top of the AQMA to
prove it is clear before the next pulse is allowed through may be more appropriate.
However this may cause more issues outside of Caerleon before the bridge and a sensor
system in this location may not be practical / reliable potentially causing more traffic issues.
Furthermore it is unclear if a reliable traffic light sensor system to suit this purpose is
currently available.
Public Feedback
During the trial a public feedback form was available on the Council’s Website
(www.newport.gov.uk/airquality). A number of both positive and negative comments about
the trial were received.
Generally the comments centred on the traffic lights causing issues at the Belmont Hill /
Caerleon Road Junction and the neighbouring Isca Road. The feedback also made reference
to increased traffic along Pillmawr Road due to commuters who were finding alternative
routes due to the traffic lights.
Wider points raised included the high number of HGVs, refuse collections, poor parking
practices including parking on double yellow lines and stopping right turns from Lodge Road
south into Cold Bath Road.
All the comments received will be taken on board with any additional studies / proposals.

17
Parking & Traffic Regulations
During the trial a number of parking / traffic offences were
observed throughout the monitoring period. These were not
insignificant instances and caused substantial congestion in a
very short period of time. An example of such issues is
shown in the photograph to the right. This was taken on a
different day to the trial period but is very similar to
instances observed during the trial period.
In particular on the 11th May at position 2 a wagon was
observed double parked at the top of the High Street which
blocked the path of the bus for several minutes. This
immediately caused standing traffic in the High Street.
It is clear that the enforcement of the current road markings
is essential to ensure traffic can flow freely.
18
Conclusions
The overall aim of the study was to investigate the feasibility of keeping standing or idling
traffic free of the AQMA as recommended in the AECOM 2015 study. Unfortunately the high
traffic flow combined with the numerous impediments to traffic flow throughout the
northern arm of the one way system suggest a simplistic single traffic light system on a
timer would not be suitable.
There are numerous factors that cause traffic to slow or stop throughout the one way
system (zebra crossings, school traffic, poor parking, buses and junction conflicts). This has a
significant impact upon the capacity of the one way system to cope with the current volume
of traffic. For example a simple act of careless parking at the top of the High Street can
reduce the road capacity by 78.1%.
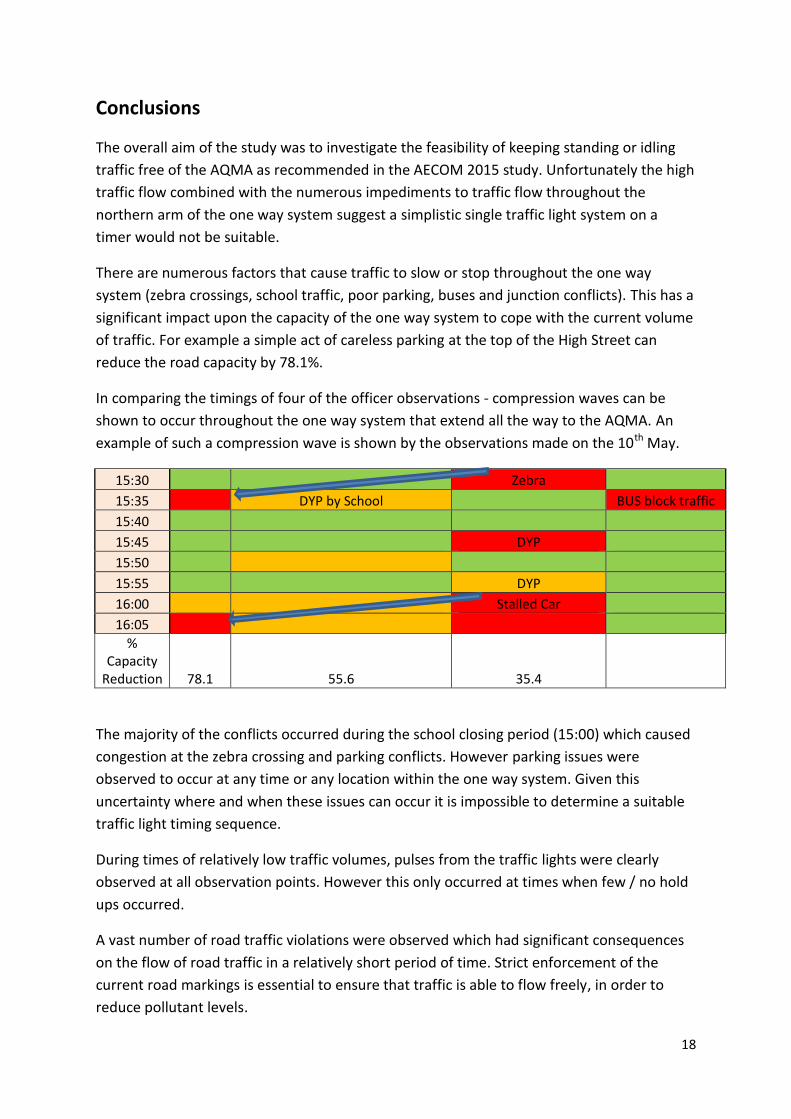
In comparing the timings of four of the officer observations - compression waves can be
shown to occur throughout the one way system that extend all the way to the AQMA. An
example of such a compression wave is shown by the observations made on the 10th May.
15:30 Zebra
15:35 DYP by School BUS block traffic
15:40
15:45 DYP
15:50
15:55 DYP
16:00 Stalled Car
16:05
% Capacity
Reduction 78.1 55.6 35.4
The majority of the conflicts occurred during the school closing period (15:00) which caused
congestion at the zebra crossing and parking conflicts. However parking issues were
observed to occur at any time or any location within the one way system. Given this
uncertainty where and when these issues can occur it is impossible to determine a suitable
traffic light timing sequence.
During times of relatively low traffic volumes, pulses from the traffic lights were clearly
observed at all observation points. However this only occurred at times when few / no hold
ups occurred.
A vast number of road traffic violations were observed which had significant consequences
on the flow of road traffic in a relatively short period of time. Strict enforcement of the
current road markings is essential to ensure that traffic is able to flow freely, in order to
reduce pollutant levels.

19
It should also be noted that the tight corner of the High Street and incline may cause the
pulse of traffic to bunch resulting in higher traffic emissions. Without air quality monitoring
it is not possible to determine if this is the case.
No air quality equipment capable of monitoring short variations was available during the
study. Even if equipment had been in place during the study, a trial over such a short period
would not have produced enough data on which long-term decisions could have been
based.
The road improvements with the bus stop on the High Street being removed and Goldcroft
Common bus stop being extended were both observed not being used to their maximum
benefit: Officers observed buses stopping on the High Street (near the Museum) and buses
at Goldcroft Common were not pulling in to the kerb fully, bringing traffic to a halt.
Many of the observations made in this report echo the findings of the AECOM Caerleon
Report 2015. All small scale street improvements recommended by AECOM have been
investigated, and any practical street improvements have been implemented.
This suggests little else on a small scale can be physically achieved to improve the structure
of the road network. If the composition and volume of the vehicles that travel through
Caerleon are not altered in some form, only large scale improvements that deflect the
volume of traffic out of the one way system are likely to have any significant impact upon air
quality. A traffic light gating system to reduce pollutant levels in the High Street may be part
of the large scale system but in isolation it is unlikely to prove beneficial and if not
undertaken without due diligence may prove detrimental to both traffic flow and air quality.

20
Further Work
Modelling
The AECOM report 2015 recommended a computerised microsimulation of the Caerleon
one way system. This would allow various road traffic light sequences, road junction
improvements and large scale improvements to be explored in a virtual way. The
microsimulation model would also include an air quality dispersion modelling to
demonstrate an improvement in air quality, at the same time ensuring no additional areas
of poor air quality are generated.
It is recommended this model is developed by independent experts with input from the
Council’s road traffic engineers and from Environmental Health regarding air quality and
noise. The model should be large enough to include the whole of the one way system and
the Belmont Hill (New Road) / Caerleon junction (and potentially Pillmawr Road).
Traffic Enforcement
Numerous examples of poor parking practices were observed throughout the one way
system that had a significant impact upon traffic flow. Enforcement of the current parking
restrictions would help alleviate traffic flow. Until the existing road traffic measures are
enforced more consistently it is not considered appropriate to recommend additional
restrictions.
Other Work
All feasibly small scale road improvements identified in the AECOM study have been
implemented where appropriate. Large scale changes are beyond the scope of this report.
The only remaining approach in the short term is a concerted effort to reduce the volume
and change the composition of the traffic. Further actions on how this will be pursued will
be outlined in a revised Air Quality Action Plan.


![Controllable Sliding Bearings and Controllable Lubrication ... · Review Controllable Sliding Bearings and Controllable ... or evolutionary [5], but it does not change the fact that](https://static.documents.pub/doc/80x56/5fc50df11ca4e1756528a85b/controllable-sliding-bearings-and-controllable-lubrication-review-controllable.jpg)


