CAHIER D’ÉTUDES WORKING PAPER N° 10 4 EMPLOYMENT, WAGES AND PRICES: HOW DID FIRMS ADJUST DURING THE ECONOMIC AND FINANCIAL CRISIS? EVIDENCE FROM A SURVEY OF LUXEMBOURG FIRMS OCTOBRE 2016 THOMAS Y. MATHÄ CINDY VEIGA LADISLAV WINTR
Transcript
CAHIER D’ÉTUDESWORKING PAPER
N° 104
EMPLOYMENT, WAGES AND PRICES:HOW DID FIRMS ADJUST DURING
THE ECONOMIC AND FINANCIAL CRISIS? EVIDENCE FROM A SURVEY OF LUXEMBOURG FIRMS
1.1 MACROECONOMIC AND LABOUR MARKET PERFORMANCE DURING THE CRISIS ............................... 6 1.2 MAIN INSTITUTIONAL CHARACTERISTICS OF THE LABOUR AND PRODUCT MARKETS ....................... 8 1.3 CHANGES IN IMPORTANT INSTITUTIONAL AND LABOUR MARKET CHARACTERISTICS ...................... 9
1.3.1 Labour contract regulation and employment protection .................................................... 10 1.3.2 Collective bargaining system, wages and regulation of employment ................................. 10 1.3.3 labour market policies ........................................................................................................ 11
2 THE SURVEY................................................................................................................................. 12
3 MAIN RESULTS ON ADJUSTMENTS AND CHANGES TO WAGE SETTING.................. 16
3.1 SOURCES AND SIZE OF SHOCKS ..................................................................................................... 16 3.2 ADJUSTMENT METHODS: COSTS AND WAGES VERSUS LABOUR FORCE SIZE AND COMPOSITION ..... 21 3.3 CHANGES IN WAGE SETTING ......................................................................................................... 25
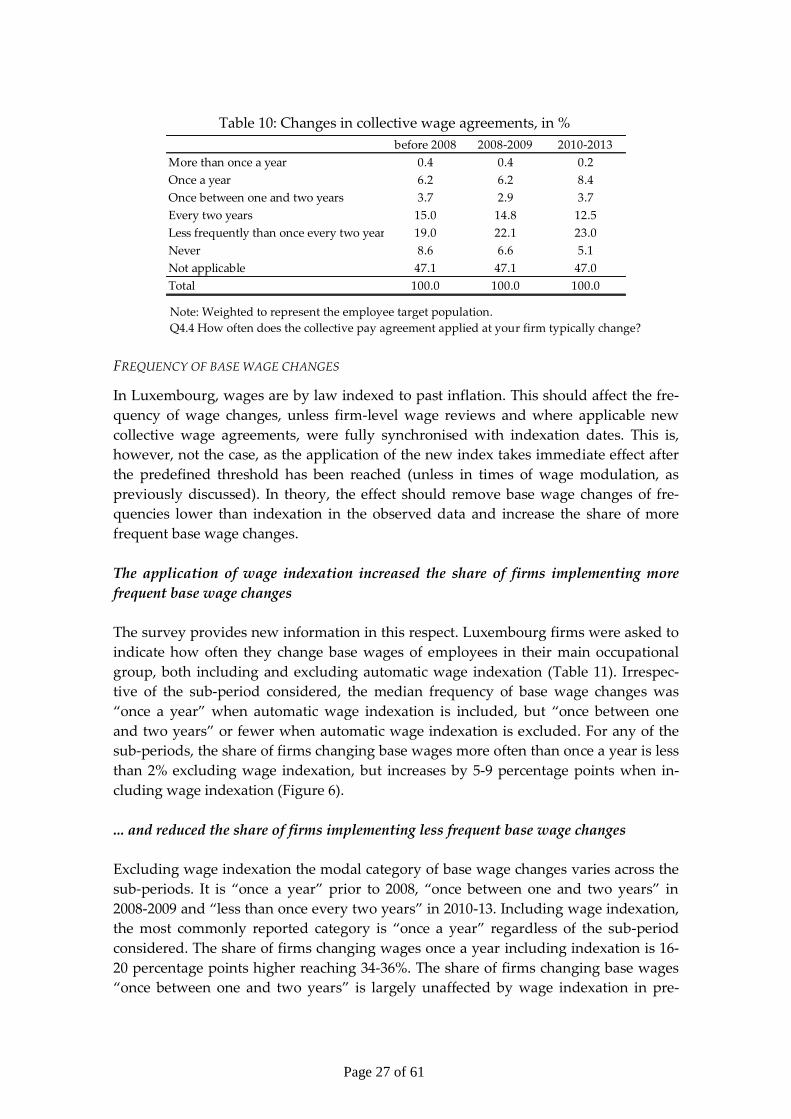
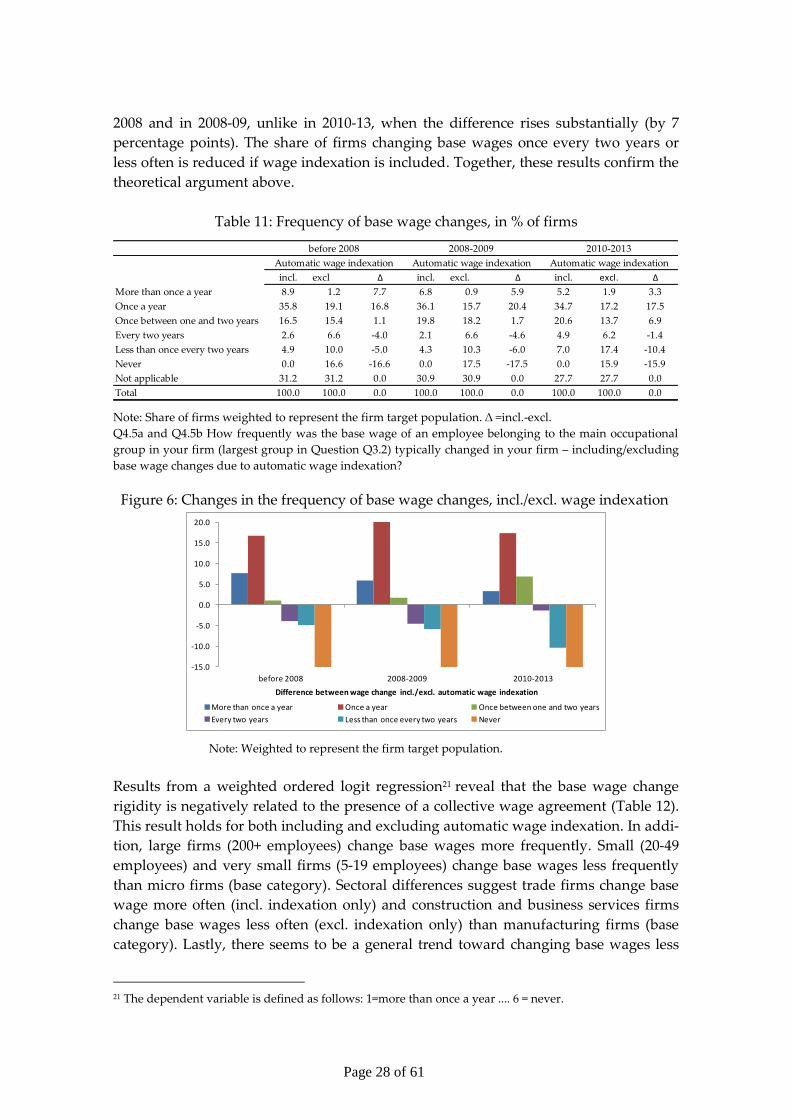
Coverage, scope and level of collective bargaining ......................................................................... 25 Frequency of base wage changes ...................................................................................................... 27 Incidence of frozen/cut wages ........................................................................................................... 29
3.4 MAIN OBSTACLES TO HIRING AND LABOUR COSTS OF NEWLY HIRED WORKERS ............................ 31 3.5 USE OF SPECIFIC LABOUR MARKET POLICIES ................................................................................. 32
4 MAIN RESULTS ON PRICE SETTING CHANGES ................................................................. 35
4.1 CHANGES IN PRICE SETTING DUE TO LABOUR MARKET AND WAGES SETTING CHANGES ................ 36
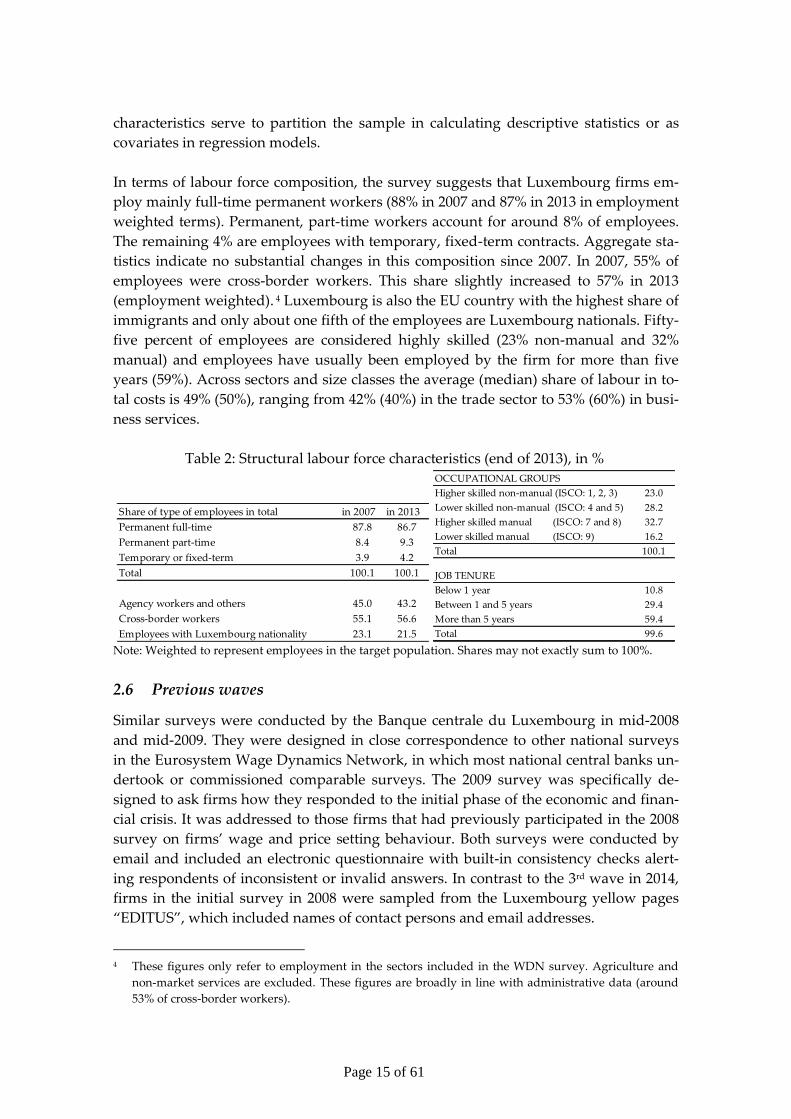
Table 1: Final sample composition ........................................................................................................ 14 Table 2: Structural labour force characteristics (end of 2013), in % .................................................. 15 Table 3 : The most negative shocks (% of firms, by year) .................................................................. 17 Table 4: Source, size and persistence of shocks, in % ......................................................................... 18 Table 5: Most important issues faced by firms during the crisis, in % ............................................. 20 Table 6: Labour cost adjustment, in % .................................................................................................. 22 Table 7: Firms reporting a decrease (strong or moderate) in labour cost components, ................. 23 Table 8: Methods used to adjust labour input, by sector and size class, .......................................... 24 Table 9: Collective wage agreements in 2013, in % ............................................................................. 26 Table 10: Changes in collective wage agreements, in % ..................................................................... 27 Table 11: Frequency of base wage changes, in % of firms ................................................................. 28 Table 12: Weighted ordered logit estimates for wage rigidity .......................................................... 29 Table 13: Wage freezes and cuts, in % of firms................................................................................... 30 Table 14: Flexible wage components paid by firms, in % ................................................................. 30 Table 15: Obstacles to hiring new employees, in % of firms ............................................................ 31 Table 16: Entry wages compared to similar workers, in % of firms ................................................ 31 Table 17: Use of labour market measures, in % of firms .................................................................... 32 Table 18: Use of short-time work, in % of firms .................................................................................. 34 Table 19: Jobs preserved by short-time work ...................................................................................... 35 Table 20: Price setting policy of Luxembourg firms, in % ................................................................. 35 Table 21: Degree of competition in firms’ product markets, in % ................................................... 36 Table 22: Changes in competition in firms’ product markets, in % ................................................. 36 Table 23: Did firms change the frequency of price changes?, in % of firms ................................... 36 Table 24: Reasons for change in the frequency of price changes, in % of firms ............................. 37 Table 25: Price change frequency, in % of firms ................................................................................. 38 Table 26: Weighted ordered logit estimates for price rigidity ........................................................... 38
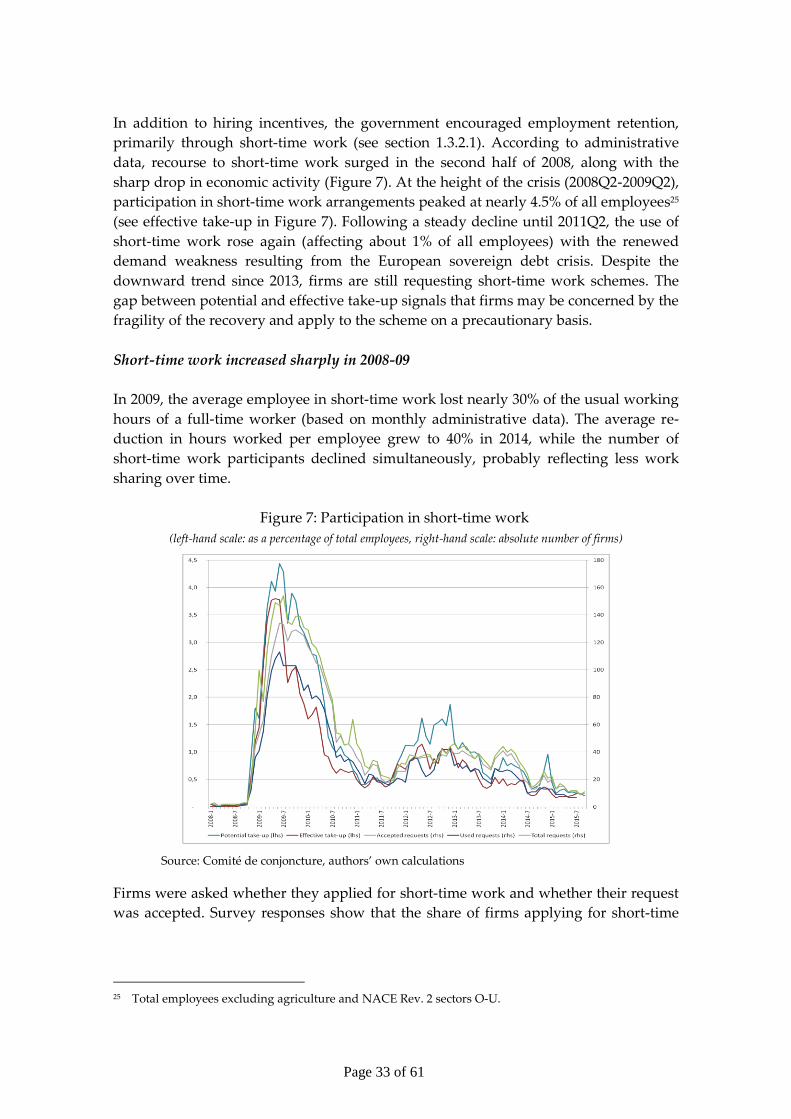
List of Figures Figure 1: GDP and employment .............................................................................................................. 7 Figure 2: Unemployment development ................................................................................................. 8 Figure 3: Shocks, GVA and economic sentiment ................................................................................ 17 Figure 4: Share of firms facing a negative shock that reported labour costs as .............................. 20 Figure 5: Collective wage agreements, in 2013 by sector and size class .......................................... 26 Figure 6: Changes in the frequency of base wage changes, incl./excl. wage indexation ............... 28 Figure 7: Participation in short-time work ........................................................................................... 33
Page 4 of 61
Résumé non technique
Durant la phase initiale de la récente crise économique et financière, l’économie
luxembourgeoise a été plongée dans la récession du deuxième trimestre 2008 au deu-
xième trimestre 2009. Entre son point haut et son point bas, le PIB en volume s’est con-
tracté de 9,2%. Ce recul, plus sévère que celui observé initialement au niveau de la
zone euro (-5,8%), s’est expliqué par l’exposition de l’économie luxembourgeoise aux
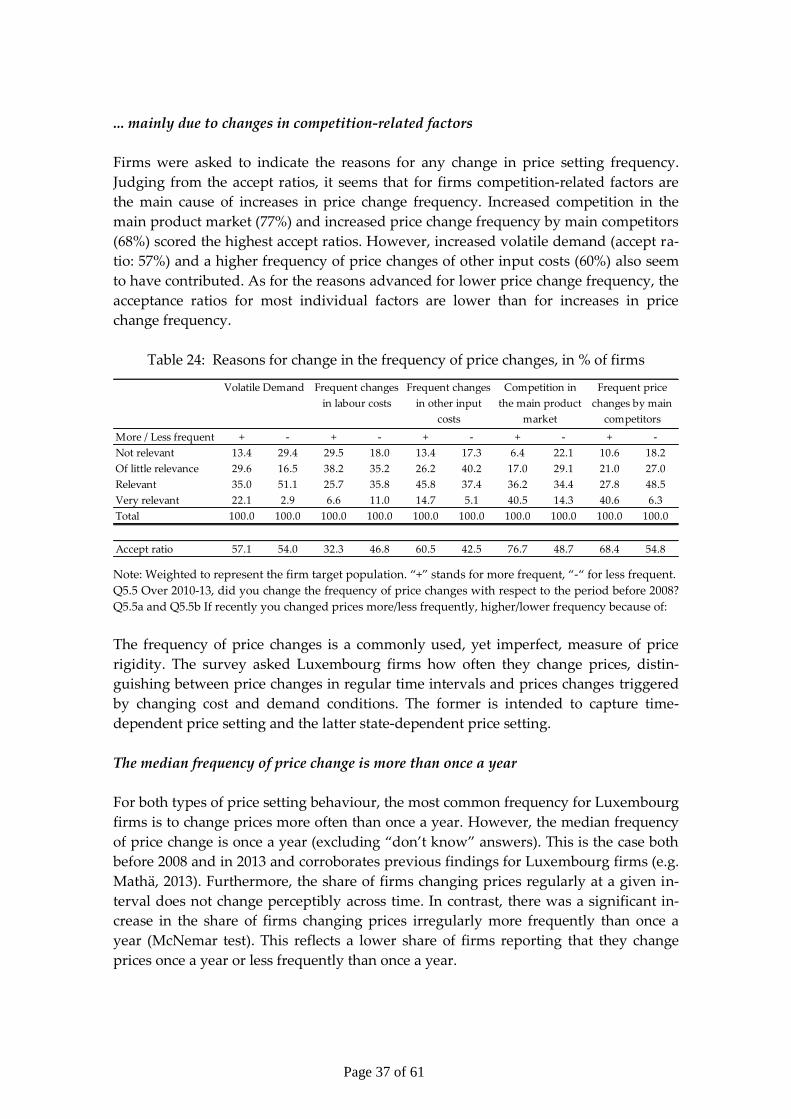
services financiers et l’effondrement du commerce international.
Cette étude documente l’impact de la crise sur les entreprises luxembourgeoises.
L’analyse se base sur les résultats d’une enquête, réalisée par la Banque centrale du
Luxembourg auprès d’un échantillon représentatif d’entreprises en fin d’année 2014.
Cette enquête s’est inscrite dans le cadre d’un réseau de recherche (le Wage Dynamics
Network) du Système Européen de Banques Centrales (SEBC). L’objectif était de mieux
comprendre la réaction des entreprises face à un choc (en l’occurrence la récente crise)
et de mieux appréhender les mécanismes d’ajustement et de fixation des salaires et des
prix. Une enquête similaire avait déjà été réalisée en 2008 puis mise à jour en 2009 afin
d’obtenir des informations sur la réaction des entreprises à la crise naissante. L’enquête
de 2014 s’est inscrite dans la lignée des enquêtes précédentes. Par souci
d’harmonisation avec d’autres enquêtes du SEBC, la principale période de référence
couvre les années 2010 à 2013. Cependant, étant donné qu’au Luxembourg la phase la
plus aigüe de la crise a eu lieu au tournant des années 2008-2009, les informations ré-
coltées ont (dans la mesure du possible) été étendues à cette période.
Les résultats de l’enquête ont révélé qu’au Luxembourg, les trois quarts des entreprises
ont subi un choc négatif entre l’année 2008 et l’année 2013. Cependant, ce constat au
niveau agrégé masque le fait que les entreprises ont été touchées par différents types
de chocs, dans différents secteurs et à des moments différents. Durant la phase initiale
de la crise, en 2008-09, les entreprises ont principalement pâti des effets défavorables
du choc de demande négatif. Cependant, un quart des entreprises interrogées a signalé un
effet positif de l’évolution de la demande sur son activité au cours de cette phase. Le
choc de demande négatif a été le plus prononcé en 2008 dans les services financiers et
en 2009 dans l’industrie et les services aux entreprises. Les entreprises de la construc-
tion et du commerce ont au contraire indiqué avoir subi le choc de demande le plus
sévère en 2013. Sur la période allant de 2010 à 2013, c’est la capacité des clients à respecter
leurs engagements qui a le plus marqué l’activité des entreprises, suivie des effets liés à
la détérioration de la demande. Aussi, lorsqu’on compare les deux périodes clés sous
étude, on constate une dégradation des perceptions des entreprises en matière de per-
sistance des chocs subis. Cette détérioration s’est principalement expliquée par les
chocs de demande (perçus comme persistants par ¾ des entreprises en 2010-2013
contre un tiers seulement durant la phase initiale de la crise). La crise s’est également
soldée par un accroissement des coûts salariaux et dans une moindre mesure des coûts
d’approvisionnement. Il s’ensuit qu’outre la concurrence et la capacité à trouver des
clients, les coûts de la main-d’œuvre ont constitué une source additionnelle de préoc-
Page 5 of 61
cupation pour plus de la moitié des entreprises ayant subi un choc négatif sur la pé-
riode 2010 à 2013.
En réponse à des chocs économiques, les entreprises peuvent avoir recours à différents
modes d’ajustement. Les entreprises qui ont subi un choc négatif et pour lesquelles les
coûts de la main-d’œuvre ont constitué un élément pertinent ont privilégié une réduc-
tion de leurs effectifs permanents à une baisse des salaires de base. Sur la période 2008-
2013, la majorité des entreprises a d’ailleurs enregistré une hausse des salaires de base.
Notons que le choix des stratégies d’ajustement a fortement varié en fonction de la
taille de l’entreprise et de la branche d’activité. Durant la crise, certaines entreprises se
sont également vues confrontées au besoin de réduire leur main-d’œuvre ou d’en mo-
difier la composition. A cette fin, elles ont privilégié le gel ou la baisse du nombre
d’embauches, les licenciements individuels, la diminution du nombre de travailleurs
ou encore la réduction (non-subventionnée) des heures de travail.
Au niveau des mécanismes d’ajustement des salaires, il est apparu que, globalement,
les entreprises ont eu tendance à changer les salaires de base une fois par an (valeur
médiane). Durant la crise, une part croissante d’entreprises a procédé à des gels de sa-
laire. En moyenne, 3% des entreprises interrogées ont indiqué avoir diminué les sa-
laires sur la période 2008-2013.
L’enquête a aussi révélé qu’outre les conditions cycliques, les décisions de recrutement
des entreprises dépendent de différents facteurs du marché du travail : le niveau des
salaires et la pénurie de main-d’œuvre qualifiée sont apparus comme les principaux
obstacles à l’embauche de salariés avec des contrats à durée indéterminée. La plupart
des entreprises a indiqué rémunérer les nouvelles recrues à un salaire similaire à celui
des employés établis, mais cette part a diminué entre 2008 et 2013. Les résultats de
l’enquête révèlent aussi que les entreprises ont eu recours à certaines politiques pu-
bliques pour l’emploi, en particulier à des mesures d’incitation à l’embauche ou de
préservation de l’emploi (notamment le chômage partiel).
Une large majorité des entreprises a déclaré disposer d’une certaine autonomie dans sa
politique de fixation des prix. Sur le marché domestique, les prix ont été principale-
ment fixés en fonction des coûts, avec une marge bénéficiaire préétablie ou ont été né-
gociés individuellement avec les clients. Sur les marchés étrangers en revanche, les en-
treprises ont été davantage « preneuses de prix » et se sont alignées sur leurs princi-
paux concurrents. Trente-six pourcent des entreprises ont déclaré avoir changé la fré-
quence d’ajustement de leurs prix durant la crise, essentiellement à la hausse. Cet ac-
croissement s’est expliqué, selon elles, par une concurrence accrue, la hausse de la fré-
quence des changements de prix des principaux concurrents, la volatilité accrue de la
demande et les changements plus fréquents des prix d’autres facteurs de production.
Page 6 of 61
1 Introduction
This report summarises the answers of Luxembourg firms to a survey on the economic
and financial crisis and their adjustment. The survey was conducted by the Banque
centrale du Luxembourg (BCL) at the end of 2014 within the framework of the Euro-
system Wage Dynamics Network (WDN), including 25 national central banks in the
European System of Central Banks. The survey asked firms to assess how they were
affected by changes in the economic environment during the periods 2008-09 and 2010-
13 and to indicate how they adjusted to these changes.1 The survey focuses on labour
market responses of firms both in terms of wages and employment and provides de-
tailed information on the various adjustment measures taken along these margins.
The results show that a substantial share of firms was negatively affected by the reces-
sion, mainly through effects of the level and uncertainty/volatility of demand but also
through customers’ ability to pay. Firms’ response to the crisis varied according to
their size and sector of economic activity. Overall, more firms adjusted via cuts in em-
ployment than wages. The report discusses the extent to which institutional changes in
the Luxembourg labour market through various public support measures helped alle-
viate the effects of the economic crisis. About 34% of firms made use of public support
measures during the crisis. Short-time working applications soared in 2008-09, mainly
in the manufacturing sector. Firms reported that about 20-25% of jobs involved in
short-time working were saved this way.
Automatic wage indexation affects the frequency of base wage changes in the economy
by reducing the share of firms having less frequent base wage changes. About one
third of the firms adjusted the frequency of price changes during the crisis, of which
almost three quarters changed prices more often, mainly reflecting changes in competi-
tion.
1.1 Macroeconomic and labour market performance during the crisis
After a long period of sustained growth, Luxembourg was severely hit in the initial
phase of the global economic and financial crisis that started in late 2007. The economy
plunged into a deep recession between 2008Q2 and 2009Q2. Over the initial phase of
the crisis in 2008-09, real GDP fell by 9.2% peak to trough, a sharper drop than the euro
area average, reflecting the country’s large exposure to financial services and the col-
lapse in international trade (OECD, 2010). The sharp contraction of banking activity
was partially offset by the resilience of Luxembourg’s mutual fund industry and insur-
ance services that helped to mitigate the effect on the domestic economy. By contrast,
output fell by around one fourth in the export-oriented manufacturing sector, and in-
dustrial production is still lagging behind its pre-crisis levels in 2015 Q3. Construction,
transportation and business services were also hit hard by the recession. After a short-
1 A similar survey within the WDN was conducted in 2008. As the economic and financial market crisis
developed, a short follow-up survey was conducted among participating firms to analyse firms’ initial
reactions. See BCL (2009) and Lünnemann and Mathä (2011).
Page 7 of 61
lived rebound in 2010, real GDP slowed again in 2011 and receded the following year (-
0.8%). Subsequently, Luxembourg’s economy has been expanding at more than 4%
each year.
Figure 1: GDP and employment
(year-on-year growth)
Source: STATEC, authors’ own calculations
The onset of the financial crisis led to a standstill in job creation, with employment (ex-
cluding independent workers) virtually unchanged in the second half of 2009 (after a
4.9% rise the year before). However, given the severity of the fall in GDP, employment
adjustment has been relatively muted (-0.4% from peak to trough, between 2008Q4 and
2009Q2), reflecting significant labour hoarding. Firms’ preference to reduce hours
worked (labour hoarding) rather than employment levels relates to extensive use of
short-time work schemes (e.g. in manufacturing) and shortages of skilled labour (e.g.
in the banking sector). In the latter case firms may be reluctant to cut jobs as they fore-
see difficulties in recruiting new employees with the required skills once the economy
picks up again. Cross-border workers, who account for more than 40% of total domes-
tic employment, were particularly hit by the crisis. This mainly reflects the sectoral dis-
tribution of cross-border workers, who are overrepresented in temporary contracts or
internationally-oriented sectors (e.g. manufacturing, finance, business services and
transportation).
During the financial and economic crisis of 2008-09, the “narrow” unemployment rate2
rose from 4.1% in the second quarter of 2008 to 5.6% one year later. Despite the obvious
impact of the crisis, cyclical factors alone do not appear to explain the surge in unem-
ployment, which was increasing well before the onset of the recession (in contrast to
the downward trend at the euro-area level). The number of long-term unemployed in-
creased dramatically, probably reflecting structural problems in the labour market
(BCL, 2013; 2015).
2 This concept excludes unemployed that benefit from a public employment support measure.
Page 8 of 61
Figure 2: Unemployment development
(left-hand scale: as a percentage of the labour force, right-hand scale: as a percentage of total unemployed)
Sources: ADEM, STATEC, authors’ own calculations
1.2 Main institutional characteristics of the labour and product markets
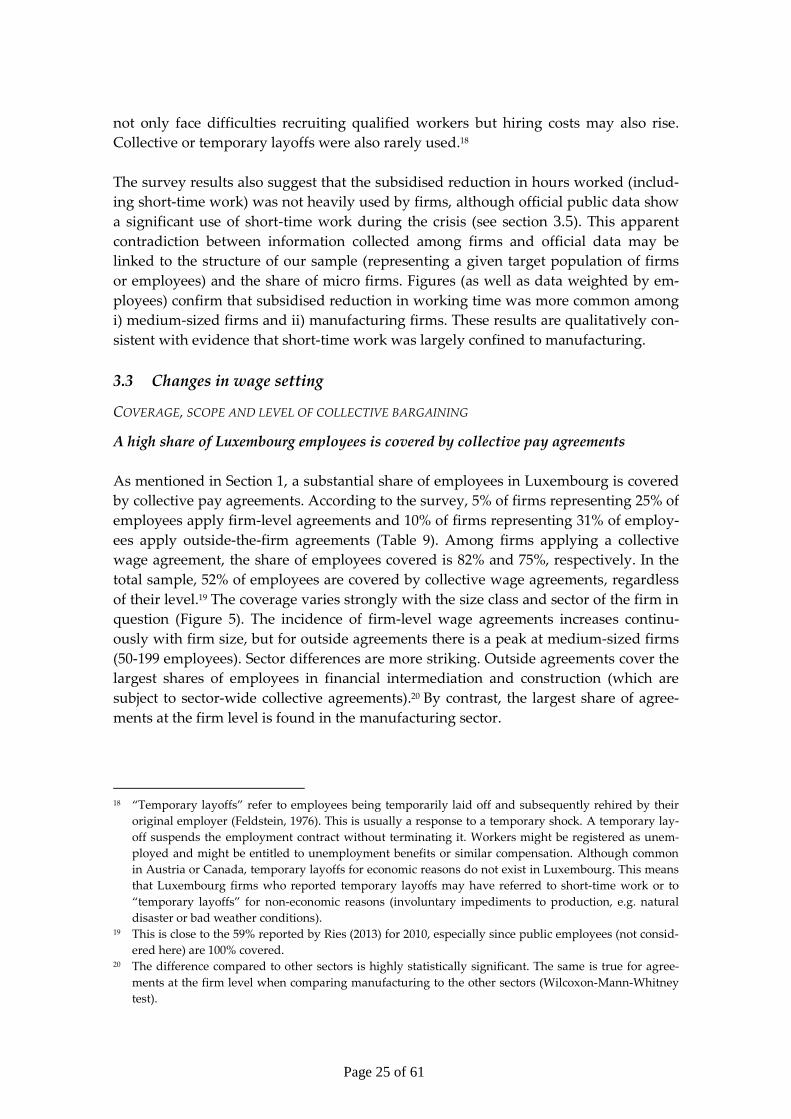
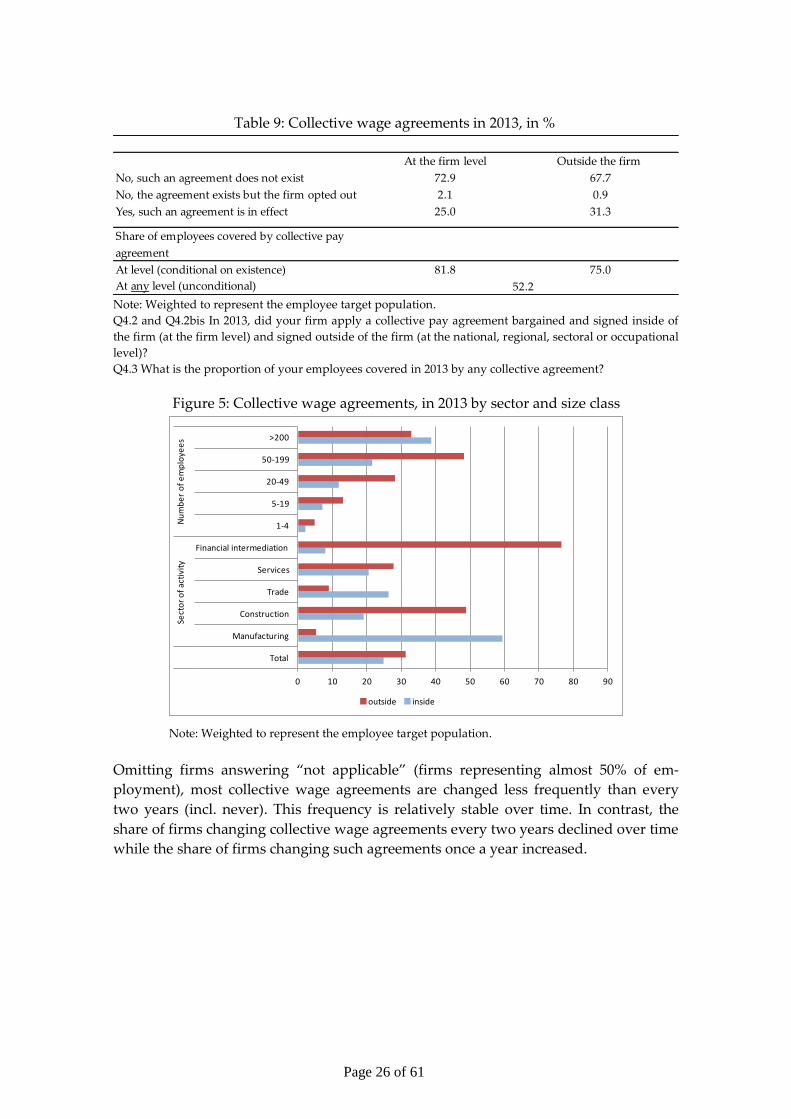
Wages are either set by law (e.g. minimum wages), by collective agreements or negoti-
ated individually. Luxembourg is characterised by a decentralised wage setting mecha-
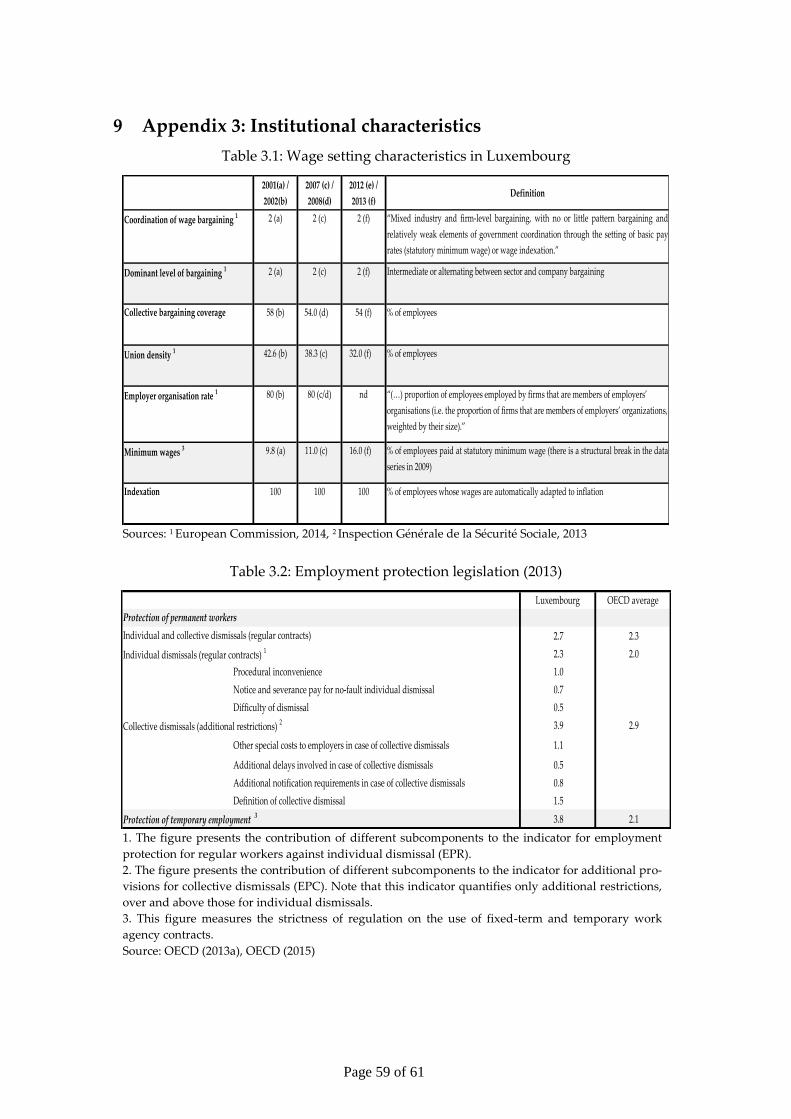
nism, with most wage negotiations at the sectoral / industry or company-level (see Ta-
ble 3.1 in Appendix 3 for further details). Sector-level agreements are at first applicable
only to firms associated with the employers’ organisation signing the agreement. How-
ever, these agreements are most often extended by law to the entire sector as opt-out
provisions do not exist. In 2013, around 55% of domestic employees were covered by
collective agreements; this is similar to 2008 (European Commission, 2014). However,
sectoral differences are important: coverage ranges from 12% in the hotel, restaurant
and catering sector (HORECA) to 100% in public administration. Firm-level agree-
ments are common in the retail sector. The duration of collective agreements is usually
two to three years. During the recent crisis, negotiations were difficult for several firms
and sectors and one-off premia were increasingly preferred to base wage increases.
Collective wage bargaining is deep-rooted in the so-called Luxembourg social model,
which is based on a tripartite social dialogue (including government, employers’ and
trade unions’ representatives). Within this consensus-oriented decision-making model,
important agreements are reached at the central (national) level (e.g. on wage indexa-
tion). During the crisis, the tripartite dialogue was put under substantial strain and bi-
partite agreements emerged, either between employers’ associations and trade unions
or between the government and employers’ / employees’ representatives.
Wage setting in Luxembourg is also characterised by the statutory minimum wage set by
law at the national level and covering all workers and employees of the economy. The
minimum wage is pegged to developments in the cost of living (through the automatic
wage indexation scheme). In addition to consumer price index induced changes, the
Page 9 of 61
minimum wage was adjusted three times during 2008-2013 to reflect past real wage
developments (+2.0% in 2009, +1.9% in 2011 and +1.5% in 2013). This adjustment
mechanism has not been modified since 2008.
Luxembourg law requires that all wages are automatically increased by 2.5% whenever
the six-month moving average of the National Index of Consumer Prices (NICP) ex-
ceeds a pre-specified threshold. The threshold itself (wage indexation scale) changes in
steps of 2.5% on each payout. Unlike in other countries, wage increases do not occur at
pre-specified dates such as the beginning or the end of the year, but are triggered by
inflation developments. Although the indexation system is automatic, in the past it has
been modified or temporarily suspended by the Tripartite Coordination Committee
(including representatives of the government, employers’ organisations and trade un-
ions) or the government alone (in the absence of consensus).
Employment Protection Legislation (EPL) is another important feature of Luxembourg’s
labour market. According to the OECD, for permanent workers, protection against in-
dividual dismissal is slightly above the OECD average. However, protection against
collective dismissal in Luxembourg is significantly higher than the OECD average
(OECD, 2013a), as is legislation regarding temporary employment. In addition, redun-
dancy payments must be paid in their entirety at the end of the notice period, which
might weigh on firms’ financial situation (see Table 3.2 in Appendix 3 for further de-
tails). While strict job protection provisions may prevent massive layoffs during down-
turns, they may also discourage firms from hiring during upturns (because of the po-
tential future costs in case of a new drop in activity).
By OECD standards, entrepreneurial barriers are also high in network sectors, especially
for railways, electricity, gas and telecoms (see Table 3.3 in Appendix 3 for further de-
tails). Regulation is also strict in retail trade, mainly reflecting strict provisions in li-
censing (e.g. permissions to engage in commercial activities, regulation on shop open-
ing hours etc.). Barriers to entrepreneurship also remain high in professional services
(e.g. accounting, legal etc.) principally due to strict entry conditions (OECD, 2013b).
1.3 Changes in important institutional and labour market characteristics
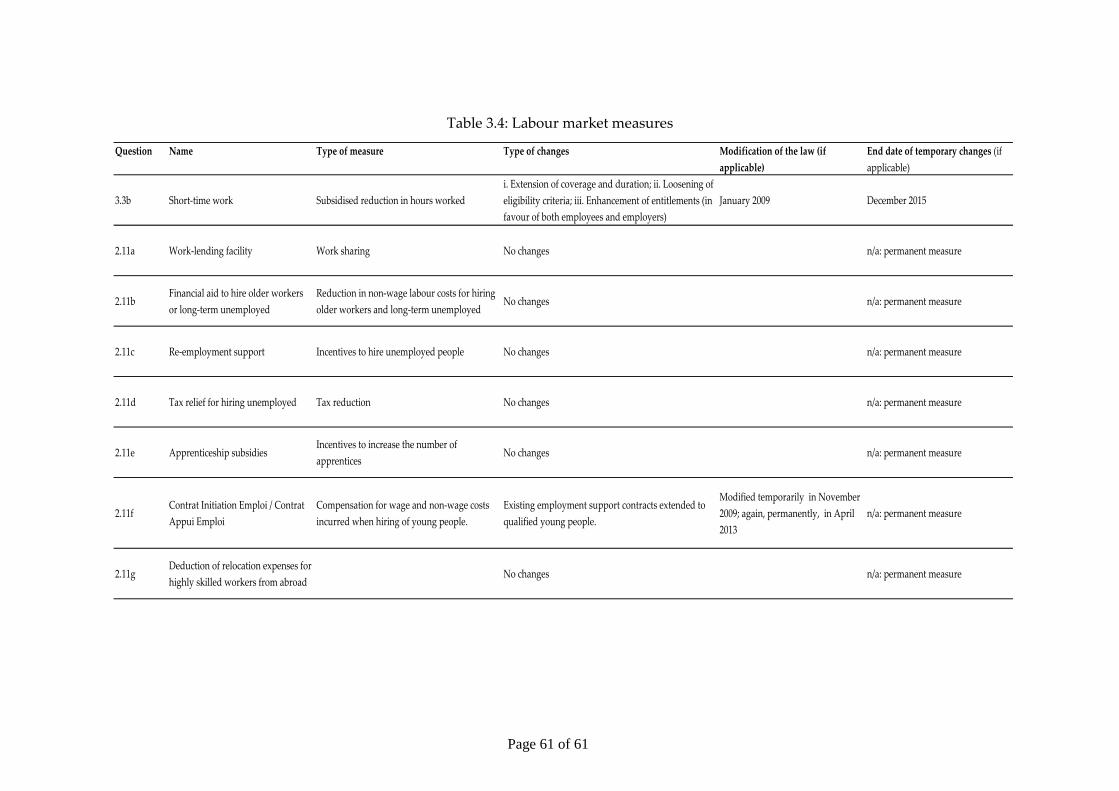
In the past few years, Luxembourg authorities have introduced a broad range of labour
market policies to cushion the labour market from the effects of the recession. The
package included a mix of i.) activation measures to increase job opportunities for the
unemployed and improve matching between labour supply and demand, ii.) passive
income replacement measures for those who lost their jobs and iii.) other measures to sup-
port and maintain labour demand (e.g. by encouraging employment retention) (see
Table 3.4 in Appendix 3 for further details).
Page 10 of 61
1.3.1 LABOUR CONTRACT REGULATION AND EMPLOYMENT PROTECTION
1.3.1.1 Changes in firing costs and firing regulations
In 2009, the long-planned so-called single statute reform came into force. The reform
merged the former “blue-collar” and “white-collar” statutes into a single statute for all
private sector employees. The major changes were (i.) equal treatment of paid sick
leave for all employees, (ii.) creation of a mutual insurance framework to cover em-
ployers against extra wage costs due to the first point, (iii.) a single contribution rate
for sickness insurance and iv.) higher firing costs (severance payments for blue-collar
employees were raised to match redundancy pay of white-collar workers).
1.3.1.2 Incentives to job creation and subsidies for new hires
Hiring subsidies were introduced or scaled up to focus on new hires and target specific
groups (e.g. young, older or long-term unemployed). In 2009, existing employment
support contracts targeted at the unskilled young were extended to qualified young
workers. These contracts provide youths with work experience and practi-
cal/theoretical training, while (partly) compensating firms for the wage and non-wage
costs incurred. These (initially temporary) employment contracts were reformed and
became permanent in 2013. In 2014, the government introduced the so-called youth
guarantee, ensuring that all young job-seekers receive a reasonable offer (job, appren-
ticeship or training) within four months of registering with the national employment
agency ADEM. The government also modified existing subsidies and social security
rebates for employers hiring long-term or older unemployed. These temporary meas-
ures were successively extended to the end of 2016.
1.3.2 COLLECTIVE BARGAINING SYSTEM, WAGES AND REGULATION OF EMPLOYMENT
1.3.2.1 Changes in the regulation of wage setting
The wage indexation scheme came under substantial strain in the crisis and was adapted
on several occasions. The timing of the automatic wage increases was no longer linked
mechanically to inflation developments, but, once triggered, was delayed by some
months to pre-specified dates. The objective was to dampen wage growth and, in par-
ticular, to avoid the overlap of two successive automatic wage increases within a year.
These discretionary delays were intended to be temporary. They were initially an-
nounced for the period 2006-2009 only, but the government reintroduced them in 2010-
2011 and 2012-2014, as the threat of potentially overlapping automatic wage hikes re-
curred.3 Following the expiration of these temporary adjustments, in January 2015, the
mechanism prevailing prior to 2012 became effective again. However, the government
3 More precisely, in autumn 2010, the social partners agreed to a one-off change to the automatic indexa-
tion mechanism, postponing any wage increase in 2011 to October at the earliest. Along the same lines,
in December 2011, the government decided to postpone any wage increase in 2012 to October at the
earliest. In addition, over the period 2012 to 2014, at least twelve months were required between any
two automatic wage hikes. This measure introduced a de facto cap of 2.5pp for the contribution of
wage indexation to year-on-year nominal wage growth.
Page 11 of 61
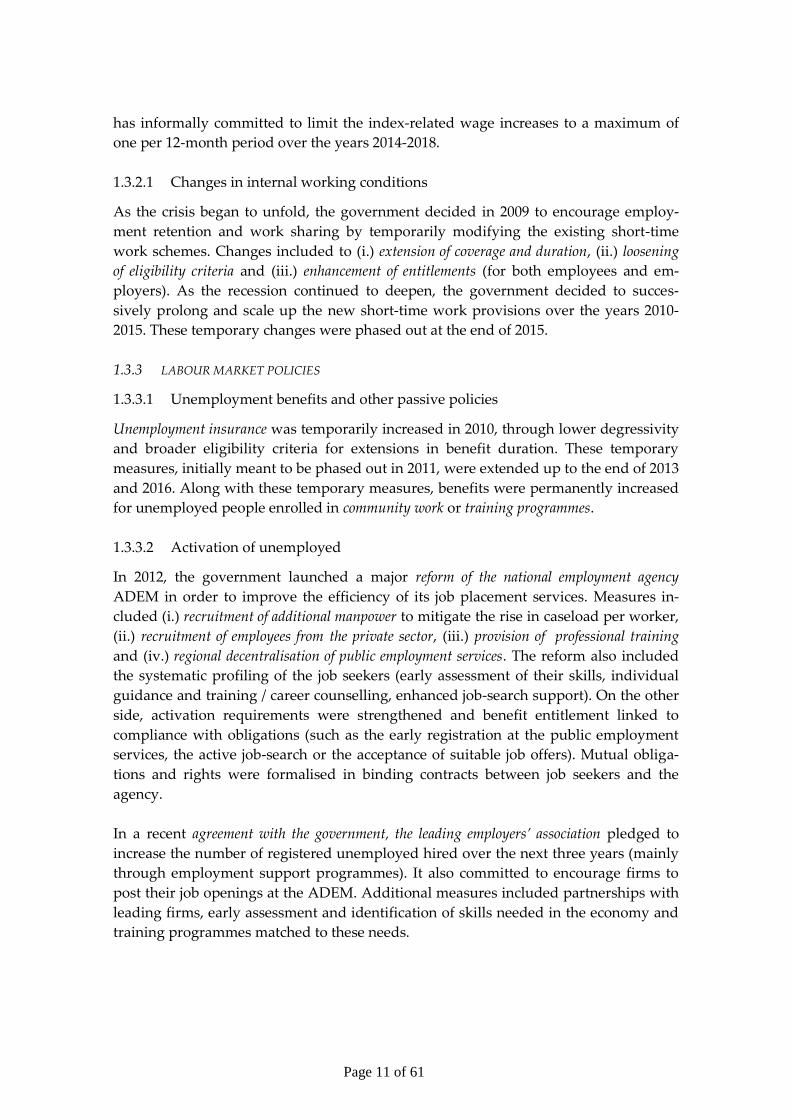
has informally committed to limit the index-related wage increases to a maximum of
one per 12-month period over the years 2014-2018.
1.3.2.1 Changes in internal working conditions
As the crisis began to unfold, the government decided in 2009 to encourage employ-
ment retention and work sharing by temporarily modifying the existing short-time
work schemes. Changes included to (i.) extension of coverage and duration, (ii.) loosening
of eligibility criteria and (iii.) enhancement of entitlements (for both employees and em-
ployers). As the recession continued to deepen, the government decided to succes-
sively prolong and scale up the new short-time work provisions over the years 2010-
2015. These temporary changes were phased out at the end of 2015.
1.3.3 LABOUR MARKET POLICIES
1.3.3.1 Unemployment benefits and other passive policies
Unemployment insurance was temporarily increased in 2010, through lower degressivity
and broader eligibility criteria for extensions in benefit duration. These temporary
measures, initially meant to be phased out in 2011, were extended up to the end of 2013
and 2016. Along with these temporary measures, benefits were permanently increased
for unemployed people enrolled in community work or training programmes.
1.3.3.2 Activation of unemployed
In 2012, the government launched a major reform of the national employment agency
ADEM in order to improve the efficiency of its job placement services. Measures in-
cluded (i.) recruitment of additional manpower to mitigate the rise in caseload per worker,
(ii.) recruitment of employees from the private sector, (iii.) provision of professional training
and (iv.) regional decentralisation of public employment services. The reform also included
the systematic profiling of the job seekers (early assessment of their skills, individual
guidance and training / career counselling, enhanced job-search support). On the other
side, activation requirements were strengthened and benefit entitlement linked to
compliance with obligations (such as the early registration at the public employment
services, the active job-search or the acceptance of suitable job offers). Mutual obliga-
tions and rights were formalised in binding contracts between job seekers and the
agency.
In a recent agreement with the government, the leading employers’ association pledged to
increase the number of registered unemployed hired over the next three years (mainly
through employment support programmes). It also committed to encourage firms to
post their job openings at the ADEM. Additional measures included partnerships with
leading firms, early assessment and identification of skills needed in the economy and
training programmes matched to these needs.
Page 12 of 61
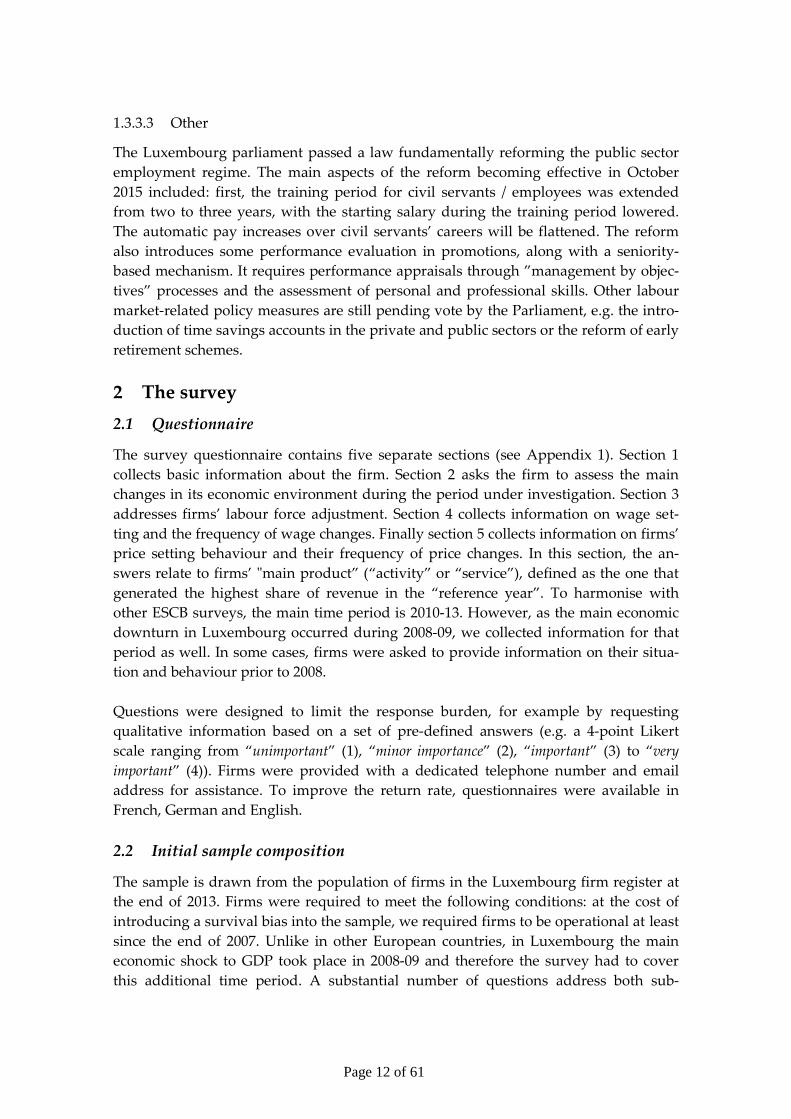
1.3.3.3 Other
The Luxembourg parliament passed a law fundamentally reforming the public sector
employment regime. The main aspects of the reform becoming effective in October
2015 included: first, the training period for civil servants / employees was extended
from two to three years, with the starting salary during the training period lowered.
The automatic pay increases over civil servants’ careers will be flattened. The reform
also introduces some performance evaluation in promotions, along with a seniority-
based mechanism. It requires performance appraisals through ”management by objec-
tives” processes and the assessment of personal and professional skills. Other labour
market-related policy measures are still pending vote by the Parliament, e.g. the intro-
duction of time savings accounts in the private and public sectors or the reform of early
retirement schemes.
2 The survey
2.1 Questionnaire
The survey questionnaire contains five separate sections (see Appendix 1). Section 1
collects basic information about the firm. Section 2 asks the firm to assess the main
changes in its economic environment during the period under investigation. Section 3
addresses firms’ labour force adjustment. Section 4 collects information on wage set-
ting and the frequency of wage changes. Finally section 5 collects information on firms’
price setting behaviour and their frequency of price changes. In this section, the an-
swers relate to firms’ "main product” (“activity” or “service”), defined as the one that
generated the highest share of revenue in the “reference year”. To harmonise with
other ESCB surveys, the main time period is 2010-13. However, as the main economic
downturn in Luxembourg occurred during 2008-09, we collected information for that
period as well. In some cases, firms were asked to provide information on their situa-
tion and behaviour prior to 2008.
Questions were designed to limit the response burden, for example by requesting
qualitative information based on a set of pre-defined answers (e.g. a 4-point Likert
scale ranging from “unimportant” (1), “minor importance” (2), “important” (3) to “very
important” (4)). Firms were provided with a dedicated telephone number and email
address for assistance. To improve the return rate, questionnaires were available in
French, German and English.
2.2 Initial sample composition
The sample is drawn from the population of firms in the Luxembourg firm register at
the end of 2013. Firms were required to meet the following conditions: at the cost of
introducing a survival bias into the sample, we required firms to be operational at least
since the end of 2007. Unlike in other European countries, in Luxembourg the main
economic shock to GDP took place in 2008-09 and therefore the survey had to cover
this additional time period. A substantial number of questions address both sub-
Page 13 of 61
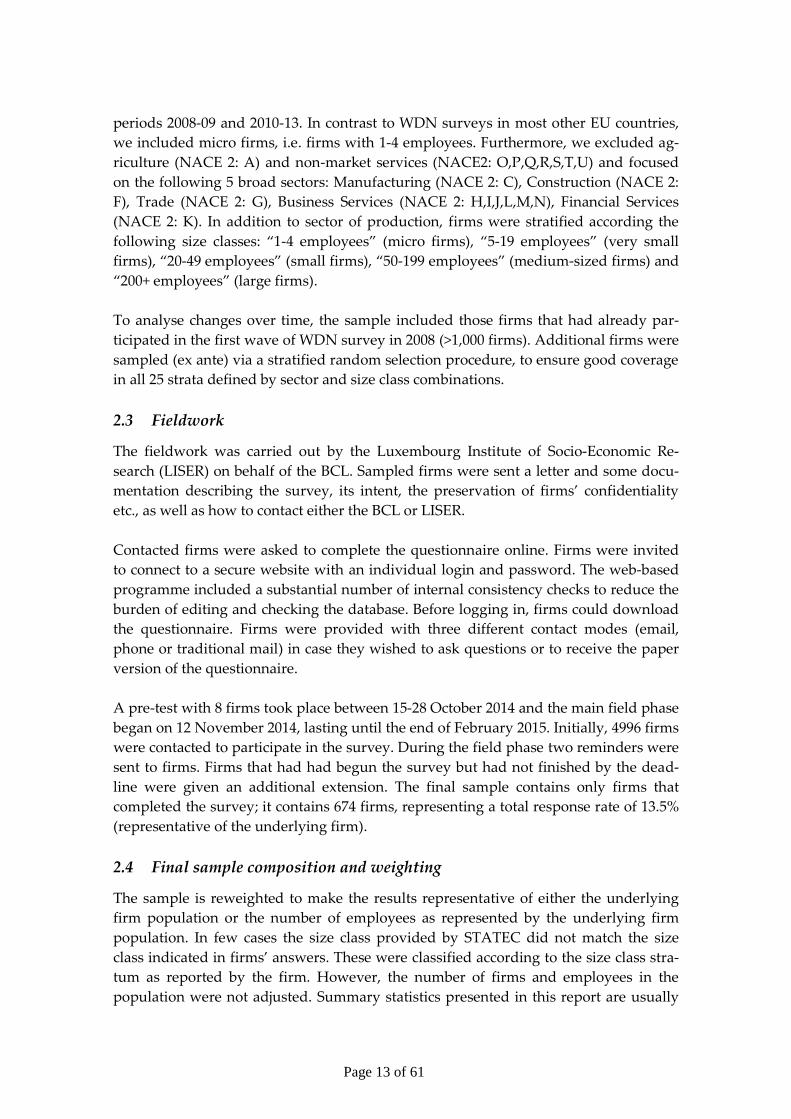
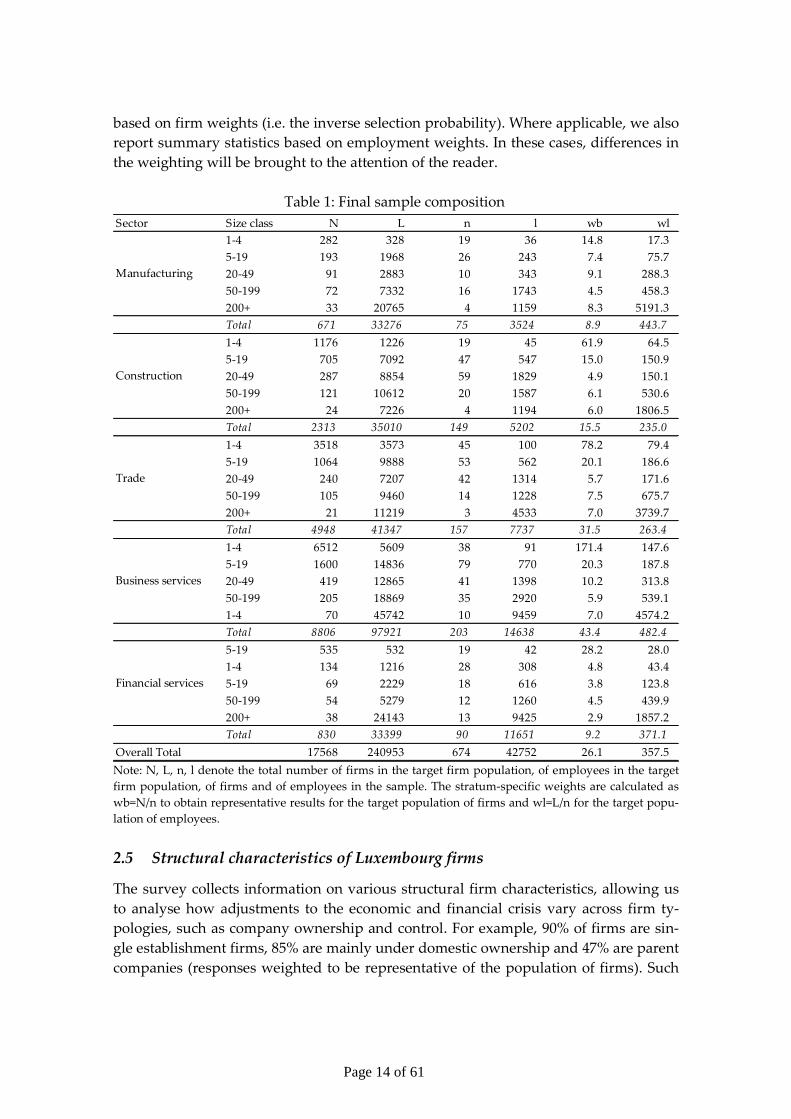
periods 2008-09 and 2010-13. In contrast to WDN surveys in most other EU countries,
we included micro firms, i.e. firms with 1-4 employees. Furthermore, we excluded ag-
riculture (NACE 2: A) and non-market services (NACE2: O,P,Q,R,S,T,U) and focused
on the following 5 broad sectors: Manufacturing (NACE 2: C), Construction (NACE 2:
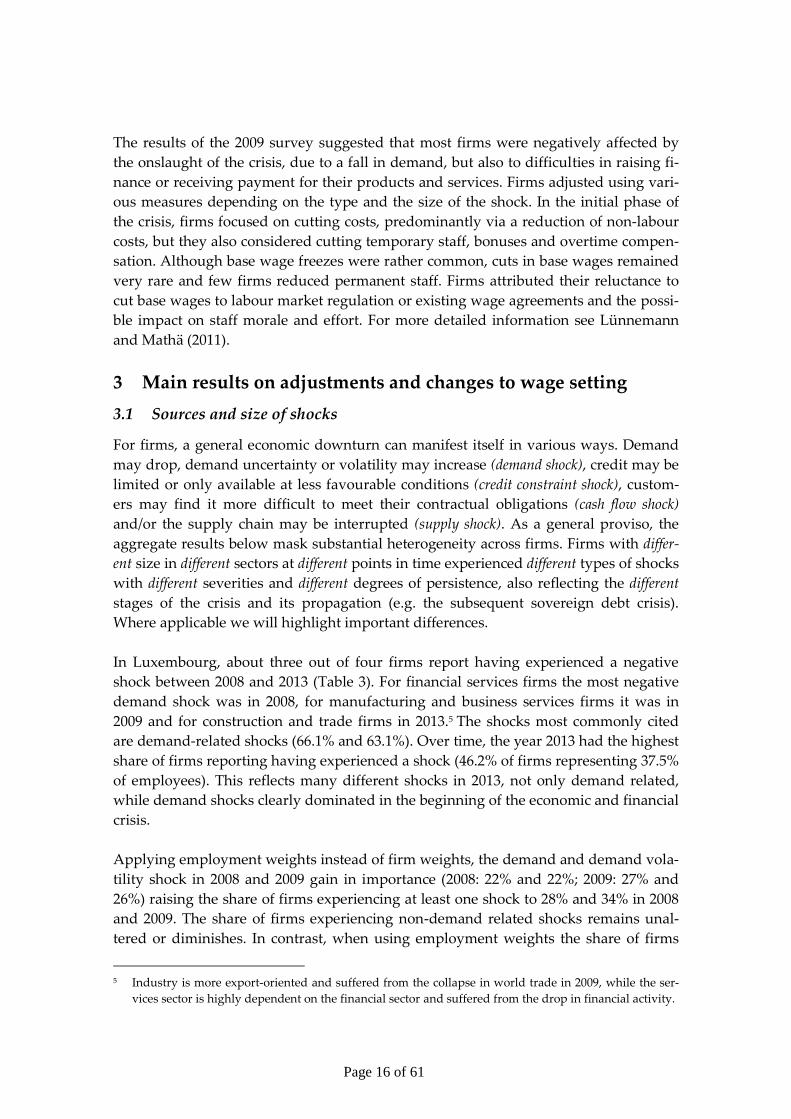
At least one shock 18.9 30.9 27.8 30.0 37.0 46.2 76.5
Note: Weighted to represent the firm target population. “At least in one year” refers to the share of
firms reporting having experienced a shock in at least one of the years considered.
Q2.9 In which years did the most negative shocks occur?
Figure 3: Shocks, GVA and economic sentiment
-15
-10
-5
0
5
10
15
2008 2009 2010 2011 2012 2013
Level of demand Volatility/uncertainty of demand
ESI (inverted) Real yoy GVA (inverted)
Nominal yoy GVA (inverted)
-15
-10
-5
0
5
10
15
2008 2009 2010 2011 2012 2013
Access to external financing Customers’ ability to pay
Access to supplies from suppliers Any non-demand shock
ESI (inverted) Source: STATEC; DG ECFIN, BCL
Note: y-o-y growth figures for real gross value added (GVA) aggregated for sectors included in the sample
(in inverted scale, in %). ‘Demeaned’ absolute change in the Economic Sentiment Indicator (ESI, in in-
verted scale, in ppts) and share of firms’ in employment weighted terms (in %) indicating in Q2.9 that
most negative shocks occurred in specific years (Q2.9 In which years did the most negative shocks occur?)
The answers of firms are broadly line with the evolution of real year-on-year gross
value added (y-o-y GVA) aggregated for sectors included in the sample or the eco-
nomic sentiment indicator (ESI) (Figure 3). This is particularly the case during the ini-
tial phase of the economic and financial crisis. During the subsequent period, more di-
vergence is observed. In 2013 in particular, a high share of firms report a negative
shock, reflecting a combination of demand and non-demand shocks. Customers’ inabil-
Page 18 of 61
ity to pay or to meet contractual terms is important, growing steadily between 2008
and 2013. The economic sentiment indicator picks this up, but real y-o-y GVA does not
- real GVA improved between 2012 and 2013.
Demand related factors at the heart of firms’ initial problems
The predominance of demand related factors during the initial phase of the crisis
(2008-09) also appears from the answers to question 2.1 in the survey (Table 4). Thirty-
six percent of firms (representing of employment) report that their activity was nega-
tively affected by demand in 2008-09. However, one out of four firms actually reported
a positive effect of demand on their activity during this period. Presenting the results
in terms of the net percentage change and assigning double weights to answers indicat-
ing strong (as opposed to moderate) decreases and increases reveals that the overall
figures are heavily influenced by the large share of micro firms (1-4 employees) in the
sample. The net percentage change is -22% in firm weighted terms and -13% in em-
ployment weighted terms.6
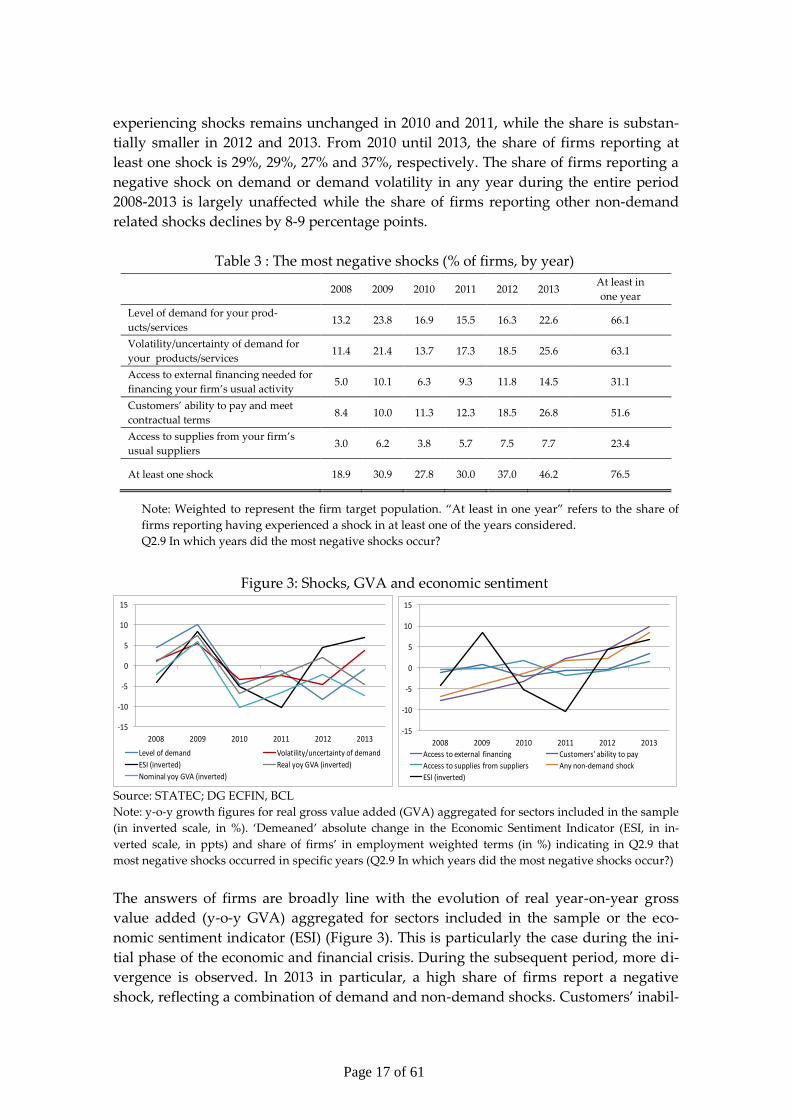
Table 4: Source, size and persistence of shocks, in %
Factors Period
Effect on firms’ activity Persistence of the shocks (conditional on strong shock)
Decrease Unchanged Increase Weighted
net %∆ Transitory
Only partly
persistent
Long-
lasting
The level of demand for
your products/services
2008-09 36.1 38.0 25.8 -21.6 24.4 39.1 36.5
2010-13 41.3 23.9 34.8 -18.9 7.1 25.6 67.3
Volatility/uncertainty of
demand for your prod-
ucts/services
2008-09 29.0 57.0 13.9 -24.3 19.2 44.6 36.2
2010-13 31.8 47.0 21.3 -19.1 1.0 22.7 76.3
Access to external fi-
nancing through the
usual financial channels
2008-09 18.3 79.2 2.5 -21.6 18.6 31.0 50.4
2010-13 26.0 68.8 5.3 -31.7 3.3 40.0 56.7
Customers’ ability to
pay and meet contrac-
tual terms
2008-09 26.8 68.1 5.1 -25.1 15.8 40.6 43.6
2010-13 43.5 48.7 7.8 -46.5 9.1 40.4 50.5
Availability of supplies
from your usual suppli-
ers
2008-09 10.0 85.8 4.2 -7.6 13.1 1.9 85.0
2010-13 12.2 83.6 4.2 -10.9 3.3 9.8 86.9
Note: Weighted to represent the firm target population. The “weighted net %∆” (weighted net percentage
change), also called “diffusion index”, is the difference between the shares of firms reporting increases and
decreases weighted according to the intensity of the response, i.e. assigning double weight to strong de-
creases (-2) and increases (+2).
Q2.1 How did the following factors affect your firm’s activity during 2008-09 and 2010-13?
Q2.2 For those factors which affected your firm strongly, were the effects transitory, partly persistent or
long-lasting for 2008-09 and 2010-13?
6 Micro firms represent 68% of firms but only 5% of employment.
Page 19 of 61
In 2010-13, customers’ ability to pay became the most relevant factor negatively affecting
Luxembourg firms, followed by demand related shocks. In contrast to demand related
shocks, however, few firms reported a positive impact of customers’ ability to pay on
their activity. A negative impact from customers’ ability to pay was most often re-
ported in construction, business services and manufacturing, as well as among smaller
firms. Apart from financial services, all other sectors identified 2013 as the year in
which customers’ ability to pay had the largest negative impact on their activity. Most
Luxembourg firms were not affected by restricted access to external finance through
the usual channels and few firms reported a decrease in the availability of inputs from
their usual suppliers. Again, a substantial fraction of firms (35%) reported a positive
demand effect on their activity during this period (e.g. due to a substitution effect to-
wards less expensive products).
Overall, a higher share of firms reported that their activity was affected (positively or
negatively) by the above factors in 2010-13 than in the initial phase of the crisis. Ac-
cording to the non-parametric McNemar test, the difference between the shares of
firms reporting that their activity was affected in 2008-09 and 2010-13 is statistically
highly significant for all factors. However, assigning higher weights to factors that af-
fected firms strongly and presenting factors as weighted net percentage change reveals
that demand related factors were more relevant in 2008-09 than in 2010-13. This reflects
the sharp (foreign) demand contraction in 2008-09 (e.g. OECD, 2010). For the other fac-
tors, the changes in the weighting of answers do not overturn the above statements.
Potentially long-lasting effects of the crisis
Firms that reported they were strongly affected (positively or negatively) by shocks
found their effects to become longer-lasting over time (Table 4). In the initial phase of
the crisis (2008-09), a significantly higher share of firms that reported they were
strongly affected considered their effects to be transitory.7 This mainly reflects demand
related factors (perceived as long-lasting by 75% of firms in 2010-13 against 33% during
the initial phase of the crisis). It should be noted that the persistence of shocks will de-
termine how firms react. For example, when shocks are perceived to be transitory,
firms are likely to be more reluctant to shed labour, discontinue temporary contracts,
cut bonuses etc. (because of the cost of such adjustments).
The cost of labour: a major concern for firms
For most firms, total costs increased. This was driven by growing labour costs and, to a
lesser extent, rising supply costs, such as raw materials (especially in manufacturing,
construction and trade). The evolution of labour costs was a major concern for Luxem-
bourg firms along with competition and finding customers. In 2008-2009, 43% of firms
(50% in 2010-2013) identify labour costs as a relevant concern (Table 5). Focusing on
7 According to the Wilcoxon-Mann-Whitney non-parametric version of the t-test (with exception of ac-
cess to external finance).
Page 20 of 61
firms hit by a negative shock, this share increases to 49% (51% in 2010-2013) (Figure 4).8
Labour costs are considered a more important concern in the manufacturing and con-
struction sectors. Moreover, the cost of labour seems to have become a greater source
of concern for manufacturing firms in 2010-13. In contrast, labour costs are least rele-
vant in the financial intermediation sector.
Table 5: Most important issues faced by firms during the crisis, in %
Factors 2008-09 2010-13
Finding customers 61.5 72.9
Competition 57.3 67.0
Cost of labour 43.0 50.1
Of which – automatic wage indexation 43.0 46.5
Of which – minimum wage 28.2 32.8
Availability of skilled staff or experienced managers 45.2 53.4
Regulation 44.7 53.3
Other 13.3 15.7
Note: Weighted to represent the firm target population. The accept ratio is the sum of the answers "rele-
vant" and "very relevant" expressed as a percentage of all answers.
Q2.10 What are the most important issues your firm faced during the period 2008-09 and 2010-13?
Figure 4: Share of firms facing a negative shock that reported labour costs as
a relevant or very relevant issue, in %
Note: Weighted to represent the firm target population. Conditional on firms reporting a negative shock
and reporting labour costs to be of relevant concern (354 responses representing 57% of firms or 75% of
employment).
Q2.10 What are the most important issues your firm faced during the period 2008-09 and 2010-13?
8 Again, this aggregate result is driven by micro firms. Only considering firms with 5 and more employ-
ees hit by a negative shock, this share increases to about 75%.
Page 21 of 61
3.2 Adjustment methods: costs and wages versus labour force size and com-
position
Firms’ adjustment to adverse economic shocks is likely to depend on the nature of
these shocks. Since labour costs are of particular relevance for most of the firms, this
section focuses on labour adjustment (labour demand and/or labour costs).
Cut in base wages seen as a last resort option
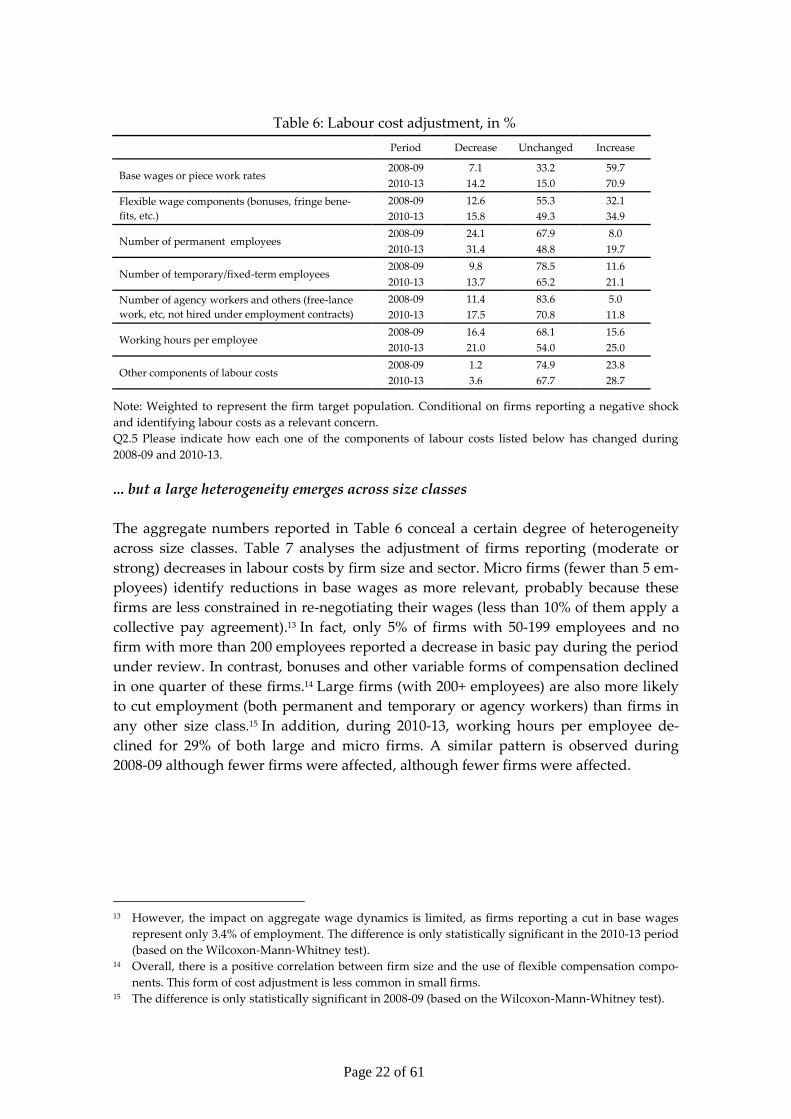
Table 6 captures the adjustment of firms that reported a negative shock and identified
labour costs as a relevant issue. During 2010-13, firms adjusted primarily via cuts in
permanent employment, with wage cuts less common: base wages increased in 71% of
firms but decreased in 14% of firms. In this context, it should be noted that the rise in
base wages is also attributable to the automatic indexation of wages to past inflation.
Despite the temporary modulation of this mechanism, there were 4 indexation-induced
wage hikes during 2010-13. Flexible wage components contributed little to the adjust-
ment process. These declined in 16% and increased in 35% of firms.9 The number of
permanent employees declined in nearly 33% of firms while it increased in 20% of
firms. Conversely, during 2010-13, many firms shifted their labour force from perma-
nent staff to temporary/fixed-term employees. The share of firms reporting an increase
in temporary staff is higher than the share of firms reporting a decrease.10 Increasing
demand uncertainty and volatility may encourage firms to hire temporary employees
rather than permanent ones (usually covered by stricter employer protection legisla-
tion).11
Table 6 documents the general adjustment pattern also during 2008-09, when the share
of firms reporting decreases was always below that in 2010-13.12 This could be related
to the results in Table 4: fewer firms reported a negative shock in 2008-09 and among
those that were hit, a smaller share perceived the shock(s) to be long-lasting.
9 The rise in flexible wage components may indicate that during times of economic uncertainty firms
prefer one-off bonuses to increases in base wages. 10 Firms tend to use temporary or agency workers as a sort of employment buffer to absorb cyclical fluc-
tuations. This type of employment allows them to react quickly and at lower cost to changing eco-
nomic conditions. In Luxembourg, the share of temporary workers remained virtually unchanged dur-
ing the crisis, at around 4% of total employees, below OECD average (11% in 2013), probably reflecting
strict employment protection legislation. Only 2% of firms in the sample employ temporary workers.
This share is highest in the manufacturing sector (9% in 2013). 11 Results are conditional on firms reporting a negative shock and identifying labour costs as a relevant
concern. Thus, they may not reflect developments in employment composition at the aggregate level. 12 The difference is statistically significant for all labor costs adjustment channels except for the number
of agency workers and “other components” (based on the McNemar test).
Page 22 of 61
Table 6: Labour cost adjustment, in %
Period Decrease Unchanged Increase
Base wages or piece work rates 2008-09 7.1 33.2 59.7
2010-13 14.2 15.0 70.9
Flexible wage components (bonuses, fringe bene-
fits, etc.)
2008-09 12.6 55.3 32.1
2010-13 15.8 49.3 34.9
Number of permanent employees 2008-09 24.1 67.9 8.0
2010-13 31.4 48.8 19.7
Number of temporary/fixed-term employees 2008-09 9.8 78.5 11.6
2010-13 13.7 65.2 21.1
Number of agency workers and others (free-lance
work, etc, not hired under employment contracts)
2008-09 11.4 83.6 5.0
2010-13 17.5 70.8 11.8
Working hours per employee 2008-09 16.4 68.1 15.6
2010-13 21.0 54.0 25.0
Other components of labour costs 2008-09 1.2 74.9 23.8
2010-13 3.6 67.7 28.7
Note: Weighted to represent the firm target population. Conditional on firms reporting a negative shock
and identifying labour costs as a relevant concern.
Q2.5 Please indicate how each one of the components of labour costs listed below has changed during
2008-09 and 2010-13.
... but a large heterogeneity emerges across size classes
The aggregate numbers reported in Table 6 conceal a certain degree of heterogeneity
across size classes. Table 7 analyses the adjustment of firms reporting (moderate or
strong) decreases in labour costs by firm size and sector. Micro firms (fewer than 5 em-
ployees) identify reductions in base wages as more relevant, probably because these
firms are less constrained in re-negotiating their wages (less than 10% of them apply a
collective pay agreement).13 In fact, only 5% of firms with 50-199 employees and no
firm with more than 200 employees reported a decrease in basic pay during the period
under review. In contrast, bonuses and other variable forms of compensation declined
in one quarter of these firms.14 Large firms (with 200+ employees) are also more likely
to cut employment (both permanent and temporary or agency workers) than firms in
any other size class.15 In addition, during 2010-13, working hours per employee de-
clined for 29% of both large and micro firms. A similar pattern is observed during
2008-09 although fewer firms were affected, although fewer firms were affected.
13 However, the impact on aggregate wage dynamics is limited, as firms reporting a cut in base wages
represent only 3.4% of employment. The difference is only statistically significant in the 2010-13 period
(based on the Wilcoxon-Mann-Whitney test). 14 Overall, there is a positive correlation between firm size and the use of flexible compensation compo-
nents. This form of cost adjustment is less common in small firms. 15 The difference is only statistically significant in 2008-09 (based on the Wilcoxon-Mann-Whitney test).
Page 23 of 61
Table 7: Firms reporting a decrease (strong or moderate) in labour cost components,
by sector and size class, (2008-09 / 2010-13), in %
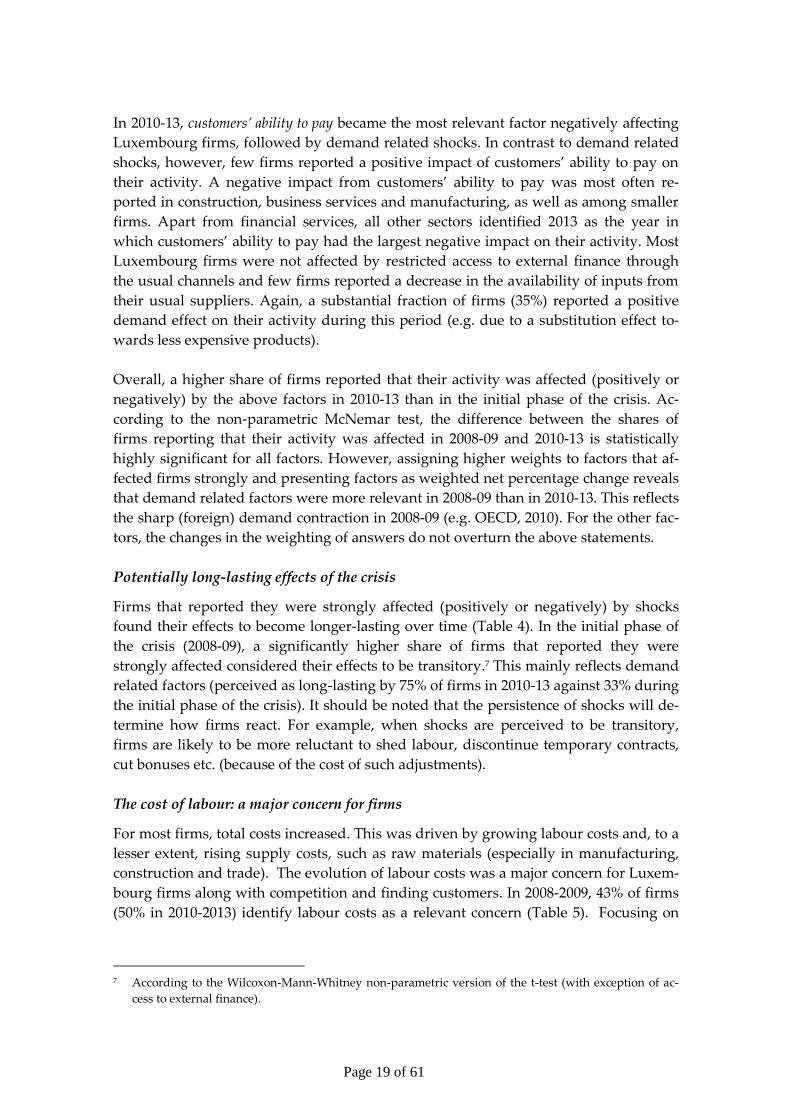
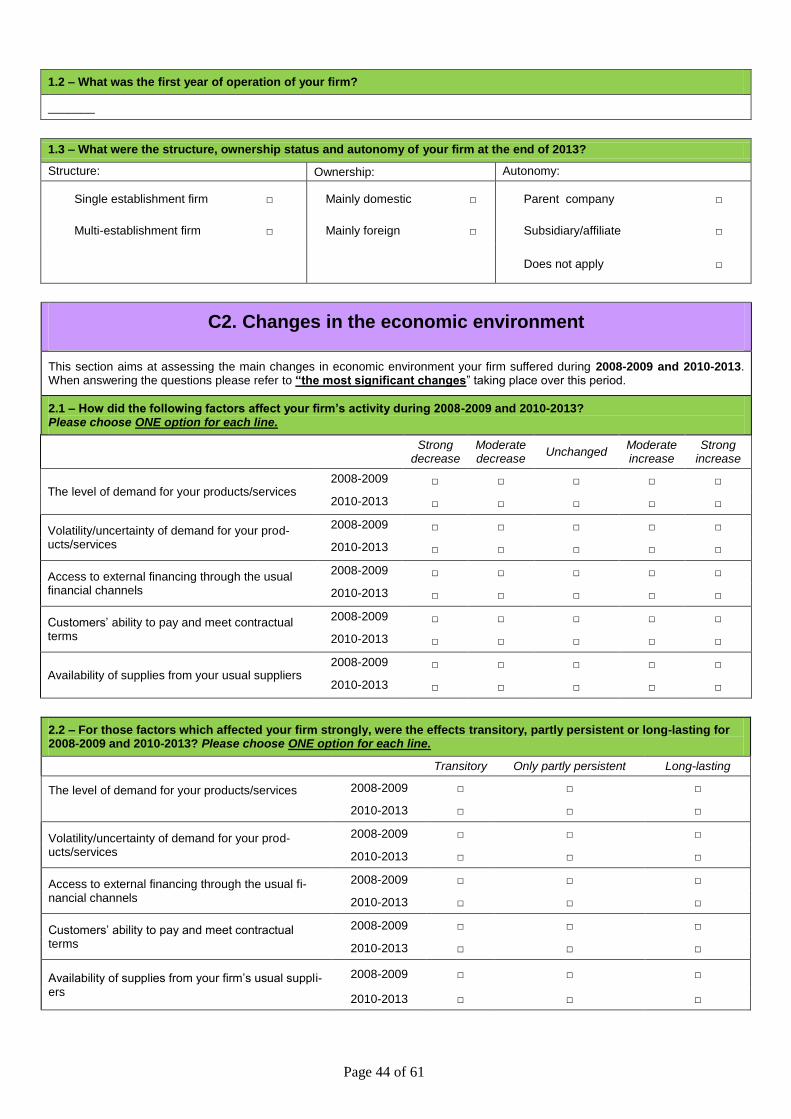
This section aims at assessing the main changes in economic environment your firm suffered during 2008-2009 and 2010-2013. When answering the questions please refer to “the most significant changes” taking place over this period.
2.1 – How did the following factors affect your firm’s activity during 2008-2009 and 2010-2013? Please choose ONE option for each line.
Strong
decrease Moderate decrease
Unchanged Moderate increase
Strong increase
The level of demand for your products/services 2008-2009 □ □ □ □ □
2010-2013 □ □ □ □ □
Volatility/uncertainty of demand for your prod-ucts/services
2008-2009 □ □ □ □ □
2010-2013 □ □ □ □ □
Access to external financing through the usual financial channels
2008-2009 □ □ □ □ □
2010-2013 □ □ □ □ □
Customers’ ability to pay and meet contractual terms
2008-2009 □ □ □ □ □
2010-2013 □ □ □ □ □
Availability of supplies from your usual suppliers 2008-2009 □ □ □ □ □
2010-2013 □ □ □ □ □
2.2 – For those factors which affected your firm strongly, were the effects transitory, partly persistent or long-lasting for 2008-2009 and 2010-2013? Please choose ONE option for each line.
Transitory Only partly persistent Long-lasting
The level of demand for your products/services
2008-2009 □ □ □
2010-2013 □ □ □
Volatility/uncertainty of demand for your prod-ucts/services
2008-2009 □ □ □
2010-2013 □ □ □
Access to external financing through the usual fi-nancial channels
2008-2009 □ □ □
2010-2013 □ □ □
Customers’ ability to pay and meet contractual terms
2008-2009 □ □ □
2010-2013 □ □ □
Availability of supplies from your firm’s usual suppli-ers
2008-2009 □ □ □
2010-2013 □ □ □
Page 45 of 61
2.3 – With regard to finance, please indicate for 2008-2009 and 2010-2013 how relevant each of the following events were for your firm? Please choose ONE option for each line. Note: credit here refers to any kind of credit, not only bank credit
Not
relevant
Of little
relevance Relevant
Very
relevant
Credit was not available to finance working capital 2008-2009 □ □ □ □
2010-2013 □ □ □ □
Credit was not available to finance new investment 2008-2009 □ □ □ □
2010-2013 □ □ □ □
Credit was not available to refinance debt 2008-2009 □ □ □ □
2010-2013 □ □ □ □
Credit was available to finance working capital, but conditions (interest rate and other contractual terms) were too onerous
2008-2009 □ □ □ □
2010-2013 □ □ □ □
Credit was available to finance new investment, but conditions (interest rate and other contractual terms) were too onerous
2008-2009 □ □ □ □
2010-2013 □ □ □ □
Credit was available to refinance debt, but condi-tions (interest rate and other contractual terms) were too onerous
2008-2009 □ □ □ □
2010-2013 □ □ □ □
2.4 – How did total costs and its components evolve during 2008-2009 and 2010-2013?
Please choose ONE option for each line. See definitions in the Appendix.
Strong
decrease Moderate decrease
Unchanged Moderate increase
Strong in-crease
Total Costs 2008-2009 □ □ □ □ □
2010-2013 □ □ □ □ □
Labour Costs 2008-2009 □ □ □ □ □
2010-2013 □ □ □ □ □
Financing costs 2008-2009 □ □ □ □ □
2010-2013 □ □ □ □ □
Costs of supplies 2008-2009 □ □ □ □ □
2010-2013 □ □ □ □ □
Other costs (please spec-ify______________________)
2008-2009 □ □ □ □ □
2010-2013 □ □ □ □ □
Page 46 of 61
2.5 – Please indicate how each of the labour cost components below changed during 2008-2009 and 2010-2013. Please choose ONE option for each line. See definitions in the Appendix.
Strong
decrease Moderate decrease
Unchanged Moderate increase
Strong increase
Base wages or piece work rates 2008-2009 □ □ □ □ □
Number of temporary/fixed-term employees 2008-2009 □ □ □ □ □
2010-2013 □ □ □ □ □
Number of agency workers and others (free-lance work, etc, not hired under employment contracts)
2008-2009 □ □ □ □ □
2010-2013 □ □ □ □ □
Working hours per employee 2008-2009 □ □ □ □ □
2010-2013 □ □ □ □ □
Other components of labour costs
(please specify____________________)
2008-2009 □ □ □ □ □
2010-2013 □ □ □ □ □
2.6 – How did prices and demand for your main product evolve during 2008-2009 and 2010-2013? Please choose ONE option for each line as applicable.
Strong
decrease
Moderate decrease
Unchanged Moderate increase
Strong increase
Domestic demand for your main product/service
2008-2009 □ □ □ □ □
2010-2013 □ □ □ □ □
Foreign demand for your main product/service 2008-2009 □ □ □ □ □
2010-2013 □ □ □ □ □
Prices of your main product in domestic markets 2008-2009 □ □ □ □ □
2010-2013 □ □ □ □ □
Prices of your main product in foreign markets 2008-2009 □ □ □ □ □
2010-2013 □ □ □ □ □
2.7 – How did the following factors evolve in your firm during 2008-2009 and 2010-2013? Please choose ONE option for each line
Strong
decrease Moderate decrease
Unchanged Moderate increase
Strong increase
Average productivity per employee (as com-pared to labour costs per employee)
2008-2009 □ □ □ □ □
2010-2013 □ □ □ □ □
Output Prices (as compared to total costs) 2008-2009 □ □ □ □ □
2010-2013 □ □ □ □ □
Other (non-labour) costs (as compared to la-bour costs)
2008-2009 □ □ □ □ □
2008-2009 □ □ □ □ □
Page 47 of 61
2.8 – Has your firm off-shored or out-sourced part of its activity during 2008-2009 and 2010-2013?
2008-2009 2010-2013
Off-shored
Yes
No, but it was considered
No and we did not consider it
□ □
□ □
□ □
Out-sourced
Yes
No, but it was considered
No and we did not consider it
□ □
□ □
□ □
2.9 – In which years did the most significant NEGATIVE shocks occur?
Please choose as many years as applicable
2008 2009 2010 2011 2012 2013 No negative shock took
place
Level of demand for your products/services □ □ □ □ □ □ □
Volatility/uncertainty of demand for your products/services □ □ □ □ □ □ □
Access to external financing for your firm’s usual activity □ □ □ □ □ □ □
Customers’ ability to pay and meet contractual terms □ □ □ □ □ □ □
Access to supplies from your firm’s usual suppliers □ □ □ □ □ □ □
2.10 – What are the most important issues your firm faced over the periods 2008/2009 and 2010-2013?
Please choose ONE option for each line.
Not
relevant
Of little
relevance Relevant
Very
relevant
Finding customers 2008-2009 □ □ □ □
2010-2013 □ □ □ □
Competition 2008-2009 □ □ □ □
2010-2013 □ □ □ □
Cost of labour 2008-2009 □ □ □ □
2010-2013 □ □ □ □
of which - wage indexation 2008-2009 □ □ □ □
2010-2013 □ □ □ □
of which - minimum wage 2008-2009 □ □ □ □
2010-2013 □ □ □ □
Availability of skilled staff or experienced managers 2008-2009 □ □ □ □
2010-2013 □ □ □ □
Regulation 2008-2009 □ □ □ □
2010-2013 □ □ □ □
Other, please specify:
_________________________________
2008-2009 □ □ □ □
2010-2013 □ □ □ □
Page 48 of 61
2.11 – During the period 2008/2009 or 2010/2013, did your firm benefit from public measures (other than short-time work), such as hiring incentives or measures aimed at avoiding job or wage cuts? If yes, select the appropriate option. See defini-tions in the Appendix.
Yes No
Workforce lending facility 2008-2009 □ □
2010-2013 □ □
Financial aid to hire older workers or long-term unemployed 2008-2009 □ □
2010-2013 □ □
Re-employment support 2008-2009 □ □
2010-2013 □ □
Tax relief for hiring an unemployed person 2008-2009 □ □
3.1. – How many employees did your firm have on the payroll at the end of 2007 and 2013? How many agency workers and other workers did your firm have at the end of 2007 and 2013? For definitions see Appendix
End 2007 End 2013
Total Number of employees _______ _______
A. Of which:
Permanent full-time _______ _______
Permanent part-time _______ _______
Temporary or fixed-term _______ _______
B. Of which:
Resident in Luxembourg _______ _______
Cross-border workers _______ _______
C. Of which:
Employees with Luxembourg nationality _______ _______
Total number of agency workers and others
(Note: not part of total no. employees) _______
_______
Page 49 of 61
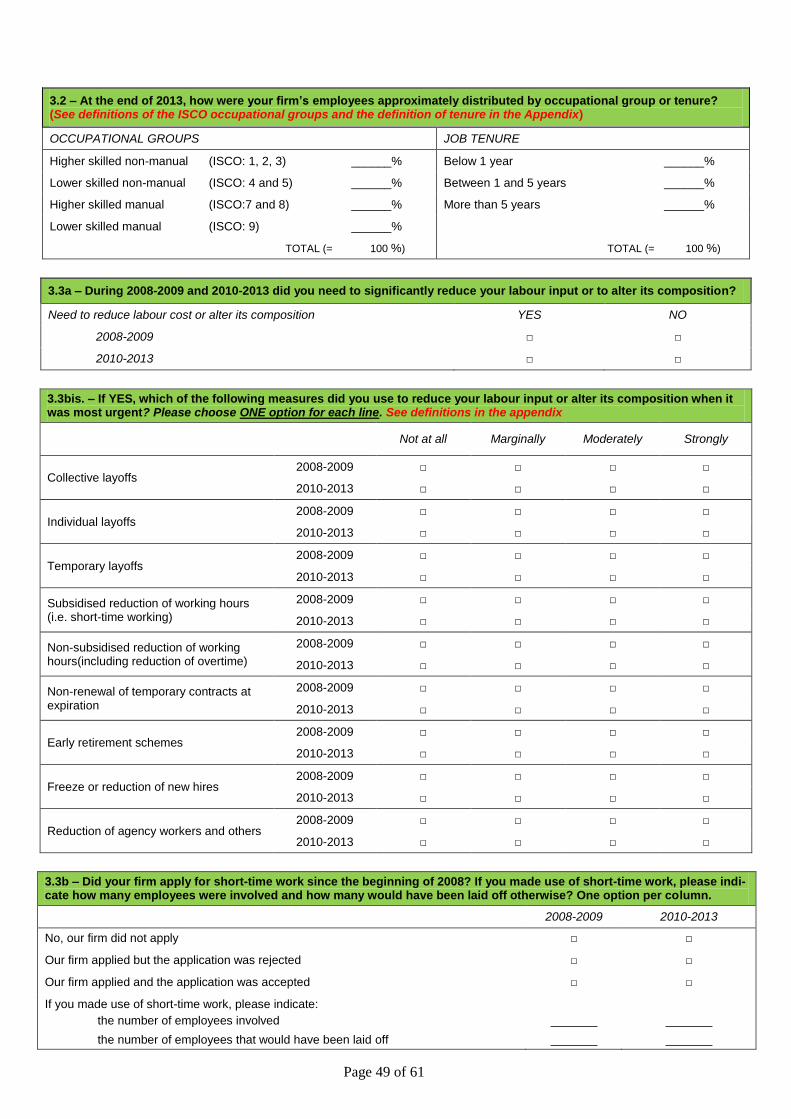
3.2 – At the end of 2013, how were your firm’s employees approximately distributed by occupational group or tenure? (See definitions of the ISCO occupational groups and the definition of tenure in the Appendix)
Lower skilled non-manual (ISCO: 4 and 5) ______% Between 1 and 5 years ______%
Higher skilled manual (ISCO:7 and 8) ______% More than 5 years ______%
Lower skilled manual (ISCO: 9) ______%
TOTAL (= 100 %) TOTAL (= 100 %)
3.3a – During 2008-2009 and 2010-2013 did you need to significantly reduce your labour input or to alter its composition?
Need to reduce labour cost or alter its composition YES NO
2008-2009 □ □
2010-2013 □ □
3.3bis. – If YES, which of the following measures did you use to reduce your labour input or alter its composition when it was most urgent? Please choose ONE option for each line. See definitions in the appendix
Not at all Marginally Moderately Strongly
Collective layoffs 2008-2009 □ □ □ □
2010-2013 □ □ □ □
Individual layoffs 2008-2009 □ □ □ □
2010-2013 □ □ □ □
Temporary layoffs 2008-2009 □ □ □ □
2010-2013 □ □ □ □
Subsidised reduction of working hours (i.e. short-time working)
2008-2009 □ □ □ □
2010-2013 □ □ □ □
Non-subsidised reduction of working hours(including reduction of overtime)
2008-2009 □ □ □ □
2010-2013 □ □ □ □
Non-renewal of temporary contracts at expiration
2008-2009 □ □ □ □
2010-2013 □ □ □ □
Early retirement schemes 2008-2009 □ □ □ □
2010-2013 □ □ □ □
Freeze or reduction of new hires 2008-2009 □ □ □ □
2010-2013 □ □ □ □
Reduction of agency workers and others 2008-2009 □ □ □ □
2010-2013 □ □ □ □
3.3b – Did your firm apply for short-time work since the beginning of 2008? If you made use of short-time work, please indi-cate how many employees were involved and how many would have been laid off otherwise? One option per column.
2008-2009 2010-2013
No, our firm did not apply □ □
Our firm applied but the application was rejected □ □
Our firm applied and the application was accepted □ □
If you made use of short-time work, please indicate:
the number of employees involved _______ _______
the number of employees that would have been laid off _______ _______
Page 50 of 61
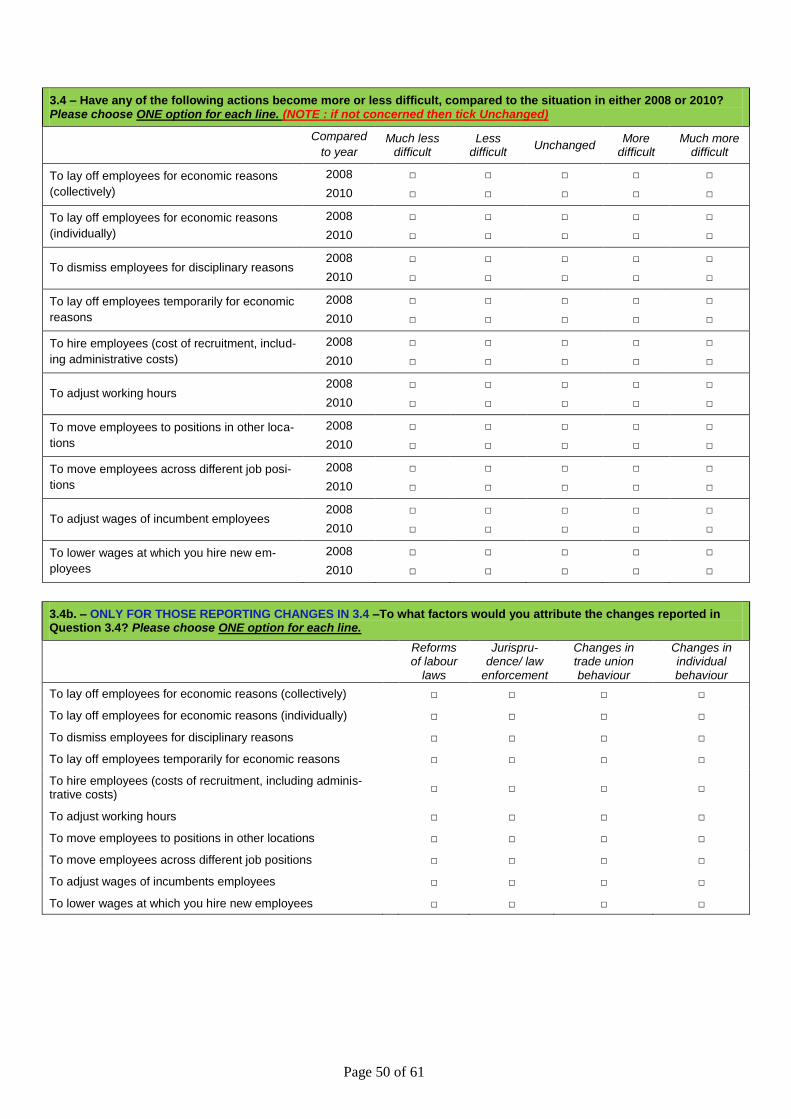
3.4 – Have any of the following actions become more or less difficult, compared to the situation in either 2008 or 2010? Please choose ONE option for each line. (NOTE : if not concerned then tick Unchanged)
Compared
to year Much less
difficult Less
difficult Unchanged
More difficult
Much more difficult
To lay off employees for economic reasons
(collectively)
2008
2010
□
□
□
□
□
□
□
□
□
□
To lay off employees for economic reasons
(individually)
2008
2010
□
□
□
□
□
□
□
□
□
□
To dismiss employees for disciplinary reasons 2008
2010
□
□
□
□
□
□
□
□
□
□
To lay off employees temporarily for economic
reasons
2008
2010
□
□
□
□
□
□
□
□
□
□
To hire employees (cost of recruitment, includ-
ing administrative costs)
2008
2010
□
□
□
□
□
□
□
□
□
□
To adjust working hours 2008
2010
□
□
□
□
□
□
□
□
□
□
To move employees to positions in other loca-
tions
2008
2010
□
□
□
□
□
□
□
□
□
□
To move employees across different job posi-
tions
2008
2010
□
□
□
□
□
□
□
□
□
□
To adjust wages of incumbent employees 2008
2010
□
□
□
□
□
□
□
□
□
□
To lower wages at which you hire new em-
ployees
2008
2010
□
□
□
□
□
□
□
□
□
□
3.4b. – ONLY FOR THOSE REPORTING CHANGES IN 3.4 –To what factors would you attribute the changes reported in Question 3.4? Please choose ONE option for each line.
Reforms of labour
laws
Jurispru-dence/ law
enforcement
Changes in trade union behaviour
Changes in individual behaviour
To lay off employees for economic reasons (collectively) □ □ □ □
To lay off employees for economic reasons (individually) □ □ □ □
To dismiss employees for disciplinary reasons □ □ □ □
To lay off employees temporarily for economic reasons □ □ □ □
To hire employees (costs of recruitment, including adminis-trative costs)
□ □ □ □
To adjust working hours □ □ □ □
To move employees to positions in other locations □ □ □ □
To move employees across different job positions □ □ □ □
To adjust wages of incumbents employees □ □ □ □
To lower wages at which you hire new employees □ □ □ □
Page 51 of 61
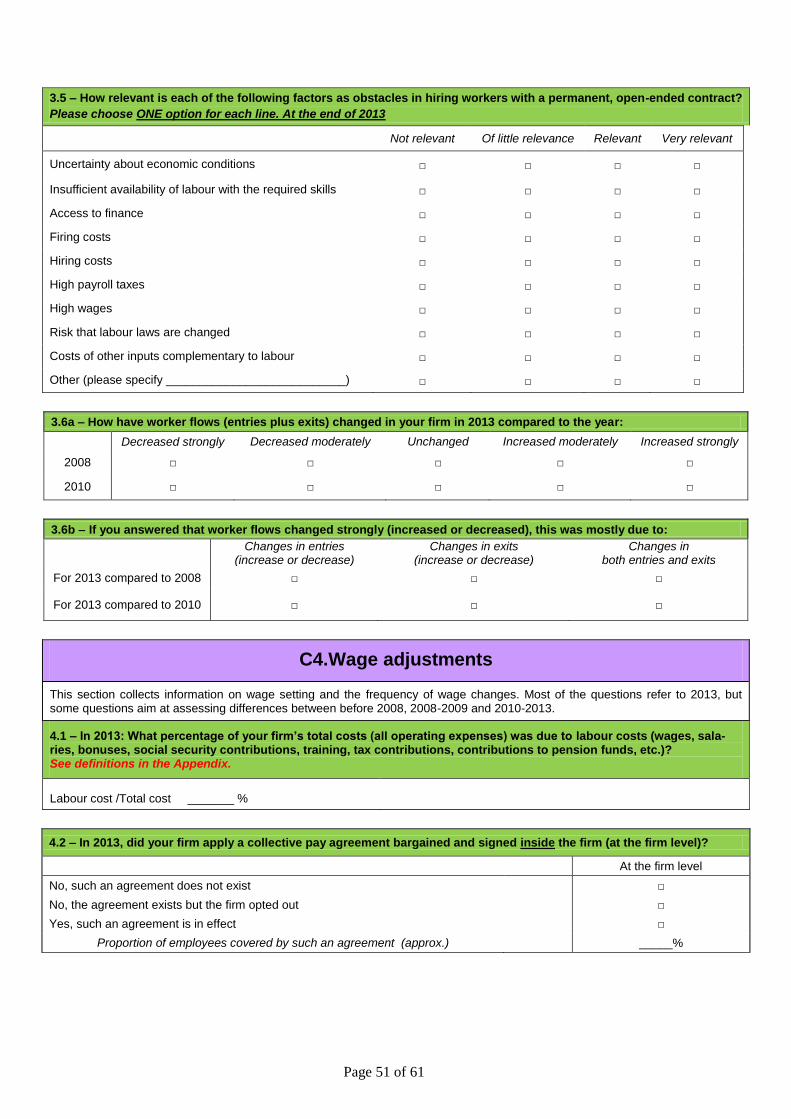
3.5 – How relevant is each of the following factors as obstacles in hiring workers with a permanent, open-ended contract?
Please choose ONE option for each line. At the end of 2013
Not relevant Of little relevance Relevant Very relevant
Uncertainty about economic conditions □ □ □ □
Insufficient availability of labour with the required skills □ □ □ □
Access to finance □ □ □ □
Firing costs □ □ □ □
Hiring costs □ □ □ □
High payroll taxes □ □ □ □
High wages □ □ □ □
Risk that labour laws are changed □ □ □ □
Costs of other inputs complementary to labour □ □ □ □
Other (please specify ___________________________) □ □ □ □
3.6a – How have worker flows (entries plus exits) changed in your firm in 2013 compared to the year:
3.6b – If you answered that worker flows changed strongly (increased or decreased), this was mostly due to:
Changes in entries
(increase or decrease) Changes in exits
(increase or decrease) Changes in
both entries and exits
For 2013 compared to 2008 □ □ □
For 2013 compared to 2010 □ □ □
C4.Wage adjustments
This section collects information on wage setting and the frequency of wage changes. Most of the questions refer to 2013, but some questions aim at assessing differences between before 2008, 2008-2009 and 2010-2013.
4.1 – In 2013: What percentage of your firm’s total costs (all operating expenses) was due to labour costs (wages, sala-ries, bonuses, social security contributions, training, tax contributions, contributions to pension funds, etc.)? See definitions in the Appendix.
Labour cost /Total cost _______ %
4.2 – In 2013, did your firm apply a collective pay agreement bargained and signed inside the firm (at the firm level)?
At the firm level
No, such an agreement does not exist □
No, the agreement exists but the firm opted out □
Yes, such an agreement is in effect □
Proportion of employees covered by such an agreement (approx.) _____%
Page 52 of 61
4.2bis – In 2013, did your firm apply a collective pay agreement bargained and signed outside the firm (at the national, re-gional, sectoral or occupational level)?
Outside the firm
No, such an agreement does not exist □
No, the agreement exists but the firm opted out □
Yes, such an agreement is in effect □
Proportion of employees covered by such an agreement (approx.) _____%
4.3 – What is the proportion of your employees covered in 2013 by any collective pay agreement?
Proportion of employees covered by any collective pay agreement (approx.) _____%
4.4 – How often does the collective pay agreement applied at you firm typically change?
More than once a year
Once a year Once between one and two years
Every two years Less frequently than once every two years
Never/Not applicable
Before 2008 □ □ □ □ □ □
2008-2009 □ □ □ □ □ □
2010-2013 □ □ □ □ □ □
4.5a – How frequently was the base wage of an employee belonging to the main occupational group in your firm (largest group in Question 3.2) typically changed in your firm – including base wage changes due to automatic wage indexation?
Please choose ONE option for each line
More than once a year
Once a year Once between one and two years
Every two years
Less frequently than once every
two years
Never/Not applicable
Before 2008 □ □ □ □ □ □
During 2008-2009 □ □ □ □ □ □
During 2010-2013 □ □ □ □ □ □
4.5b – Excluding base wage changes due to automatic wage indexation, how frequently was the base wage of an employee belonging to the main occupational group in your firm (largest group in Question 3.2) typically changed in your firm? Please choose ONE option for each line
More than once a year
Once a year Once between one and two years
Every two years
Less frequently than once every
two years
Never/Not applicable
Before 2008 □ □ □ □ □ □
During 2008-2009 □ □ □ □ □ □
During 2010-2013 □ □ □ □ □ □
4.6 – Over 2008-2013, did you freeze or cut base wages in a given year (please indicate in which years)?
Wages were frozen
Wages were cut
Wages were neither
frozen nor cut
YES % Workers
affected YES % Workers
affected (average wage cut) YES
2008 □ ______% □ ______% ( % ) □
2009 □ ______% □ ______% ( % ) □
2010 □ ______% □ ______% ( % ) □
2011 □ ______% □ ______% ( %) □
2012 □ ______% □ ______% ( %) □
2013 □ ______% □ ______% ( %) □
Page 53 of 61
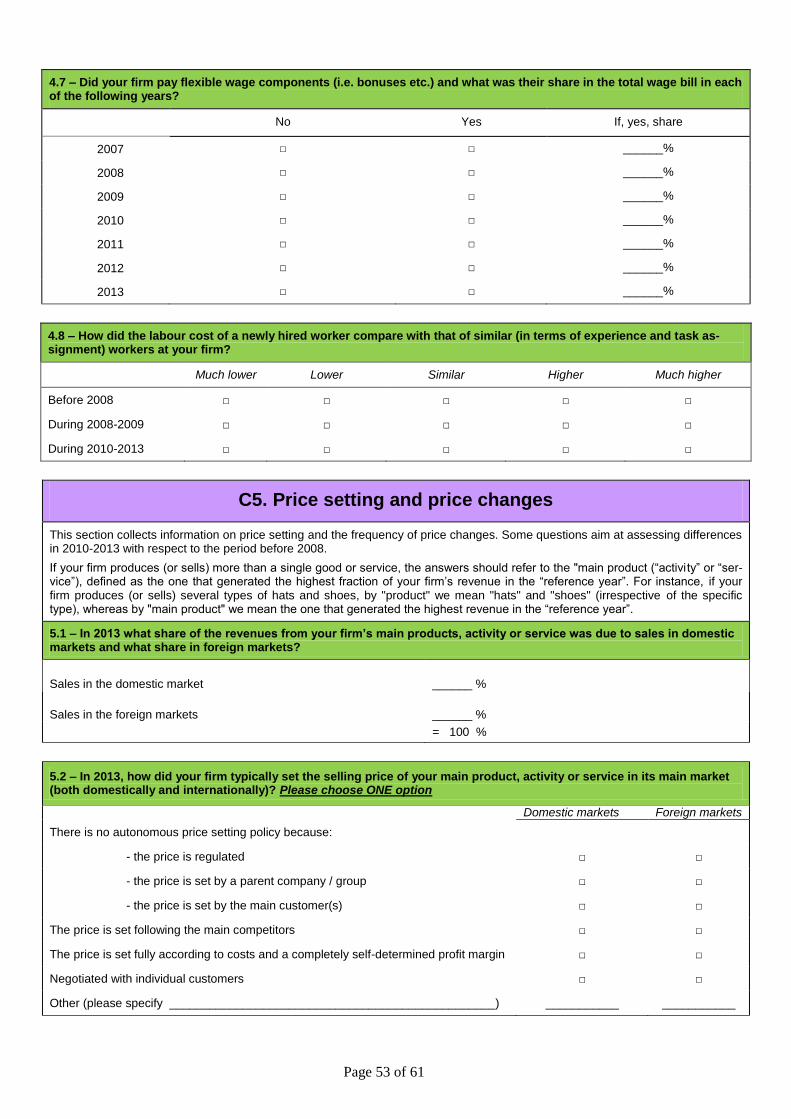
4.7 – Did your firm pay flexible wage components (i.e. bonuses etc.) and what was their share in the total wage bill in each of the following years?
No Yes If, yes, share
2007 □ □ ______%
2008 □ □ ______%
2009 □ □ ______%
2010 □ □ ______%
2011 □ □ ______%
2012 □ □ ______%
2013 □ □ ______%
4.8 – How did the labour cost of a newly hired worker compare with that of similar (in terms of experience and task as-signment) workers at your firm?
Much lower Lower Similar Higher Much higher
Before 2008 □ □ □ □ □
During 2008-2009 □ □ □ □ □
During 2010-2013 □ □ □ □ □
C5. Price setting and price changes
This section collects information on price setting and the frequency of price changes. Some questions aim at assessing differences in 2010-2013 with respect to the period before 2008.
If your firm produces (or sells) more than a single good or service, the answers should refer to the "main product (“activity” or “ser-vice”), defined as the one that generated the highest fraction of your firm’s revenue in the “reference year”. For instance, if your firm produces (or sells) several types of hats and shoes, by "product" we mean "hats" and "shoes" (irrespective of the specific type), whereas by "main product" we mean the one that generated the highest revenue in the “reference year”.
5.1 – In 2013 what share of the revenues from your firm’s main products, activity or service was due to sales in domestic markets and what share in foreign markets?
Sales in the domestic market ______ %
Sales in the foreign markets ______ %
= 100 %
5.2 – In 2013, how did your firm typically set the selling price of your main product, activity or service in its main market (both domestically and internationally)? Please choose ONE option
Domestic markets Foreign markets
There is no autonomous price setting policy because:
- the price is regulated □ □
- the price is set by a parent company / group □ □
- the price is set by the main customer(s) □ □
The price is set following the main competitors □ □
The price is set fully according to costs and a completely self-determined profit margin □ □
Negotiated with individual customers □ □
Other (please specify _________________________________________________) ___________ ___________
Page 54 of 61
5.3 – How would you characterise the degree of competition on domestic and foreign markets for your main prod-uct?Please choose ONE option for each line
Weak Moderate Severe Very severe Non applicable
Domestic markets □ □ □ □ □
Foreign markets □ □ □ □ □
5.4 – Compared to the situation before 2008, how has the competitive pressure on your main product on domestic and foreign markets changed in the period 2008-2009 and 2010-2013? Please choose ONE option for each line.