44
2 1 Cal-Maine Foods, Inc. Annual Report to Shareholders
| Date post: | 16-Apr-2018 |
| Category: |
Documents |
| Upload: | truongcong |
| View: | 215 times |
| Download: | 2 times |

2 1Cal-Maine Foods, Inc.
Annual Reportto Shareholders
Cal-Maine Foods, Inc.
3320 Woodrow Wilson Drive
Post Office Box 2960
Jackson, Mississippi 39207
(601) 948-6813

Corporate OfficesCal-Maine Foods, Inc.3320 Woodrow Wilson DrivePost Office Box 2960Jackson, Mississippi 39207(601) 948-6813calmainefoods.com
Transfer AgentSunTrust Bank,AtlantaCorporate Trust Department58 Edgewood Avenue, Room 225 AnnexAtlanta, Georgia 30303(404) 588-7817
Independent AuditorsErnst & Young LLPOne Jackson Place, Suite 400188 East Capitol StreetJackson, Mississippi 39201
Annual Meeting2:00 p.m.December 11, 2001Cal-Maine Corporate Offices3320 Woodrow Wilson DriveJackson, Mississippi
Form 10-KThe Form 10-K, including the
financial statements and schedulesthereto, for the year ended June 2, 2001,as well as other information about Cal-Maine Foods, Inc. may be obtainedwithout charge by writing to Ms.Delores McMillin, Investor Relations,at the Company’s corporate offices.
Stock Price InformationThe Company’s common stock trades on
the Nasdaq National Market under the symbolCALM. The number of stockholders, includingbeneficial owners holding shares in nomineeor “street” name, as of June 2, 2001, wasapproximately 1,000.
The following table shows quarterly highand low prices for the common stock for thepast two fiscal years. National Market Systemquotations are based on actual sales prices.
Stock PriceFiscal Year 2001 High Low
First Quarter $ 4.38 $ 3.25Second Quarter $ 4.31 $ 3.13Third Quarter $ 6.63 $ 4.00Fourth Quarter $ 5.38 $ 4.41
Stock PriceFiscal Year 2000 High Low
First Quarter $ 5.50 $ 4.38Second Quarter $ 4.88 $ 3.34Third Quarter $ 4.38 $ 2.50Fourth Quarter $ 4.09 $ 3.25
Corporate Information
ArkansasHopeLincolnSearcy
GeorgiaGainesvilleHartwellShady Dale
KansasChase
KentuckyBremenGuthrie
LouisianaHammondPine Grove
MississippiEdwardsJackson (Corporate Offices)Mendenhall
New MexicoAlbuquerque
North CarolinaGreenvilleLouisburg
OhioRossburgUnion City
OklahomaWestville
South CarolinaBethune
TennesseeClarksville
TexasFlatoniaHarwoodIdalouWaelder
UtahDelta
Color indicatesCal-Maine’s majormarket areas.
Cal-Maine Foods, Inc. is engaged in the production, cleaning, grading, packing and sale of fresh shell eggs. The Company is the nation’s largest producer and distributor of fresh shell eggs,with fiscal 2001 sales of 545 million dozen shell eggs, representing approximately 13% of all shelleggs sold in the United States. Cal-Maine primarily markets its shell eggs in 26 states, chiefly inthe southwestern, southeastern, mid-western and mid-Atlantic regions of the United States.
The common shares of Cal-Maine Foods, Inc. are traded on the Nasdaq National Marketunder the symbol CALM.
Cal-Maine Foods, Inc.
Cal-Maine Locations


UNITED STATES SECURITIES AND EXCHANGE COMMISSION Washington, DC 20549
FORM 10-K
⌧ ANNUAL REPORT PURSUANT TO SECTION 13 OR 15(d) OF THE SECURITIES EXCHANGE ACT OF 1934 FOR FISCAL YEAR ENDED JUNE 2, 2001
TRANSITION REPORT PURSUANT TO SECTION 13 OR 15(d) OF THE SECURITIES EXCHANGE ACT OF 1934 Commission file number: 000-04892
CAL-MAINE FOODS, INC. (Exact name of registrant as specified in its charter)
Delaware 64-0500378 (State or other Jurisdiction of (I.R.S. Employer Identification No.) Incorporation or Organization)
3320 Woodrow Wilson Avenue, Jackson, Mississippi 39209 (Address of principal executive offices) (Zip Code)
(601) 948-6813
(Registrant’s telephone number, including area code) Securities registered pursuant to Section 12 (b) of the Act: NONE Securities registered pursuant to Section 12 (g) of the Act: Common Stock, $0.01 par value Indicate by check mark whether the registrant (1) has filed all reports required to be filed by Section 13 or 15(d) of the Securities Exchange Act of 1934 during the preceding 12 months (or for such shorter period that the registrant was required to file such reports), and (2) has been subject to such filing requirements for the past 90 days.
Yes X No________
Indicate by check mark if disclosure of delinquent filers pursuant to Item 405 of Regulation S-K is not contained herein, and will not be contained, to the best of registrant’s knowledge, in definitive proxy or information statements incorporated by reference in Part III of this Form 10-K or any amendment to this Form 10-K. (X) As of July 31, 2001, 10,672,588 shares of the registrant’s Common Stock, $0.01 par value, and 1,200,000 shares of the registrant’s Class A Common Stock, $0.01 par value, were outstanding. The aggregate market value of the common stock held by non-affiliates of the registrant on that date was $9,090,800, computed at the closing price on that date as reported by the National Association of Securities Dealers Automated Quotation System.
DOCUMENTS INCORPORATED BY REFERENCE
Pursuant to General Instruction G(3), the responses to Items, 10, 11, 12 and 13 of Part III of this report are incorporated herein by reference to the information contained in the Company’s Proxy Statement for its 2001 Annual Meeting of Shareholders to be held on October 11, 2001, to be filed with the Securities and Exchange Commission on or about September 11, 2001.

2
TABLE OF CONTENTS
Part I
Page Item Number
1. Business………..…………………………………………………………………………………………. 3 2. Properties…………………………………………………………………………………………………. 7 3. Legal Proceedings………………………………………………………………………………………… 8 4. Submission of Matters to a Vote of Security Holders……..……………………………………………… 8
Part II
5. Market for the Registrant’s Common Stock and Related Stockholder Matters………………………….. 9 6. Selected Financial Data………………………………………………………………………………….. 10
7. Management’s Discussion and Analysis of Financial Condition and Results of Operations………………………………………………………………………………… 10
7A. Quantitative and Qualitative Disclosures About Market Risk……..……………………………………. 16 8. Financial Statements and Supplementary Data…..……………………………………………………… 16
9. Changes in and Disagreements with Accountants on Accounting and Financial Disclosure…………….…………………………………………………………………… 16
Part III
10. Directors and Executive Officers of the Registrant……………………………………………………… 17 11. Executive Compensation………..…………………………………………………………………….…. 17 12. Security Ownership of Certain Beneficial Owners and Management……….…………………………… 17 13. Certain Relationships and Related Transactions…..…………………………………………………….. 17
Part IV
14. Exhibits, Financial Statement Schedules and Reports on Form 8-K……….……………………………. 17

3
PART I
ITEM 1. BUSINESS General Cal-Maine Foods, Inc. (“Cal-Maine” or the “Company”) was incorporated in Delaware in 1969. The Company’s
primary business is the production, cleaning, grading, and packaging of fresh shell eggs for sale to shell egg retailers. Shell egg sales, including feed sales to outside egg producers, accounted for approximately 98% of the Company’s net sales in fiscal 2001 and 2000. The Company is the largest producer and distributor of fresh shell eggs in the United States and during fiscal 2001, had sales of approximately 545 million dozen shell eggs. This volume represents approximately 13% of all shell eggs sold in the United States. The Company markets the majority of its eggs in 26 states, primarily in the southwestern, southeastern, mid-western and mid-Atlantic regions of the United States.
The Company’s principal executive offices are located at 3320 Woodrow Wilson Avenue, Jackson, Mississippi
39209, and its telephone number is 601-948-6813. Except as otherwise indicated by the context, references herein to the “Company” or “Cal-Maine” include all subsidiaries of the Company.
Growth Strategy and Acquisitions The Company pursues an aggressive growth strategy, including the acquisition of existing shell egg production and
processing facilities, as well as the construction of new and more efficient facilities. Since the beginning of fiscal 1989, the Company has consummated ten acquisitions, adding an aggregate of 21 million layers to its capacity, and built six new “in-line” shell egg production and processing facilities and one pullet growing facility, adding 6.5 million layers and 1.5 million growing pullets to its capacity. Each of the new shell egg production facilities generally provides for the processing of approximately 400 cases of shell eggs per hour. These increases in capacity have been accompanied by the retirement of older and less efficient facilities and a reduction in eggs produced by contract producers. The new “in-line” facilities result in the gathering, cleaning, grading and packaging of shell eggs by less labor-intensive, more efficient, mechanical means.
As a result of the Company’s growth strategy, the Company’s total flock, including pullets, layers and breeders, has
increased from approximately 6.8 million at May 28, 1988 to an average of approximately 20.6 million for each of the past five fiscal years. Also, the number of dozens of shell eggs sold has increased from approximately 117 million in the fiscal year ended May 28, 1988 to an average of approximately 449 million for each of the past five fiscal years. Net sales amounted to $358.4 million in fiscal 2001, more than five times net sales of $69.9 million in fiscal 1988.
The Company’s acquisitions and construction of larger facilities, described in the tables below, reflect the continuing
concentration of shell egg production in the United States in a decreasing number of shell egg producers. The Company believes that a continuation of that concentration trend may result in the reduced cyclicality of shell egg prices, but no assurance can be given in that regard.

4
Acquisitions of Egg Production and Processing Facilities
Layers
Purchase
Fiscal Year (1) Seller Location Acquired Price
1989 Egg City, Inc. Arkansas 1,300,000 $ 6,716,000 1990 Sunny Fresh Foods, Inc. (2) 7,500,000 21,629,000 1991 Sunnyside Eggs, Inc. North Carolina 1,800,000 6,000,000 1994 Wayne Detling Farms Ohio 1,500,000 12,194,000 1995 A & G Farms Kentucky 1,000,000 2,883,000 1997 Sunbest Farms Arkansas 600,000 1,302,000 1997 Southern Empire Egg Farm, Inc. Georgia 1,300,000 10,654,000 1998 J&S Farms / Savannah Valley Egg Georgia 900,000 3,745,000 1999 Hudson Brothers, Inc. Kentucky 1,200,000 11,534,000 2000 Smith Farms Texas/Arkansas 3,900,000 36,205,000
Total 21,000,000 $ 112,862,000 (1) The Company’s fiscal year ends on the Saturday closest to May 31.
(2) New Mexico, Kansas, Texas, Alabama, Oklahoma, Arkansas and North Carolina
Construction of Egg Production, Pullet Growing and Processing Facilities (1)
Fiscal Year Layer Pullet ApproximateCompleted Location Capacity Capacity Cost
1990 Mississippi 1,000,000 200,000 $ 10,000,0001992 Louisiana 1,000,000 — 10,000,0001992 Mississippi — 500,000 3,500,0001994 Mississippi 1,000,000 — 9,200,0001996 Texas 1,000,000 250,000 14,000,0001999 Kansas 1,250,000 250,000 21,500,0002001 Texas 1,300,000 300,000 19,000,000
Total 6,550,000 1,500,000 $ 87,200,000 (1) Does not include construction in Guthrie, Kentucky, commenced in fiscal 2001, and to be completed in fiscal
2003 at an estimated cost of $18.0 million, adding approximately 1,500,000 layer capacity. The Company proposes to continue a growth strategy calling for the acquisition of other companies engaged in the
production and sale of shell eggs. Federal anti-trust laws require regulatory approval of acquisitions that exceed certain threshold levels of significance. Also, the Company is subject to federal and state laws generally prohibiting anti-competitive conduct. Because the shell egg production and distribution industry is so fragmented, the Company believes that its sales of shell eggs during its last fiscal year represented only approximately 13% of domestic shell egg sales notwithstanding that it is the largest producer and distributor of shell eggs in the United States based on independently prepared industry statistics. The Company believes that regulatory approval of any future acquisitions either will not be required, or, if required, that such approvals will be obtained.
The construction of new, more efficient production and processing facilities is an integral part of the Company’s
growth strategy. Any such construction will require compliance with applicable environmental laws and regulations, including the receipt of permits, that could cause schedule delays, although the Company has not experienced any significant delays in the past.

5
Shell Eggs Production. The Company’s operations are fully integrated. At its facilities, it hatches chicks, grows pullets,
manufactures feed and produces and distributes shell eggs. Company-owned facilities accounted for approximately 84% of its total fiscal 2001 egg production, with the balance attributable to contract producers used by the Company.
Under Cal-Maine’s arrangements with its contract producers, the Company owns the entire flock, furnishes all feed
and supplies, owns the shell eggs produced, and assumes all market risks. The contract producers own their facilities and are paid a fee based on production with incentives for performance.
The commercial production of shell eggs requires a source of baby chicks for laying flock replacement. The
Company produces approximately 98% of its chicks in its own hatcheries and obtains the balance from commercial sources. Feed for the laying flocks is produced by Company-owned and operated mills located in Alabama, Arkansas, Georgia, Louisiana, Mississippi, New Mexico, Ohio, Oklahoma, South Carolina, Tennessee, and Texas. All ingredients necessary for feed production are readily available in the open market and most are purchased centrally from Jackson, Mississippi. Approximately 97% of the feed for Company flocks is manufactured at feed mills owned and operated by the Company. Poultry feed is formulated using a computer model to determine the least-cost ration to meet the nutritional needs of the flocks. Although most feed ingredients are purchased on an as-needed basis, from time-to-time, when deemed advantageous, the Company purchases ingredients in advance with a delayed delivery of several weeks.
Feed cost represents the largest element of the Company’s farm egg production cost, ranging from 55% to 64% of
total cost in the last five years, or an average of approximately 58%. Although feed ingredients are available from a number of sources, the Company has little, if any, control over the prices of the ingredients it purchases, which are affected by weather and by various supply and demand factors. Increases in feed costs not accompanied by increases in the selling price of eggs can have a material adverse effect on the results of the Company’s operations. However, higher feed costs may encourage producers to reduce production, possibly resulting in higher egg prices. Alternatively, low feed costs can encourage industry overproduction, possibly resulting in lower egg prices. Historically, the Company has tended to have higher profit margins when feed costs are higher. However, this may not be the case in the future.
After the eggs are produced, they are cleaned, graded, and packaged. Substantially all of the Company-owned farms
have modern “in-line” facilities that mechanically gather, clean, grade and package the eggs produced. The increased use of in-line facilities has generated significant cost savings as compared to the cost of eggs produced from non-in-line facilities. In addition to greater efficiency, the in-line facilities produce a higher percentage of grade A eggs, which sell at higher prices. Eggs produced on farms owned by contractors are brought to the Company’s processing plants where they are cleaned, graded and packaged. A small percentage of eggs are sold unprocessed to other processors.
The Company’s egg production activities are subject to risks inherent in the agriculture industry, such as weather
conditions and disease factors. These risks are not within the Company’s control and could have a material adverse effect on its operations. Also, the marketability of the Company’s shell eggs is subject to risks such as possible changes in food consumption opinions and practices reflecting perceived health concerns.
The Company operates in a cyclical industry with total demand that is generally level and a product which is price-
inelastic. Thus, small increases in production or decreases in demand can have a large adverse effect on prices and vice-versa. However, economic conditions in the egg industry are expected to exhibit less cyclicality in the future. The industry is concentrating into fewer but stronger hands, which should help lessen the extreme cyclicality of the past.
Marketing. Of the 545 million dozen shell eggs sold by the Company in the fiscal year ended June 2, 2001, 419
million were produced by Company flocks.

6
Sales of shell eggs primarily are made to national and regional supermarket chains that buy direct from the Company.
During fiscal 2001, one customer, a major Texas grocery retailer, accounted for 13.2% of net sales, and the top 10 customers accounted for 55% of net sales in the aggregate. The majority of eggs sold are merchandised on a daily or short-term basis. Most sales to established accounts are on open account with terms ranging from seven to 30 days. Although the Company has established long-term relationships with many of its customers, they are free to acquire shell eggs from other sources.
The Company sells its shell eggs at prices generally related to independently quoted wholesale market prices.
Wholesale prices are subject to wide fluctuations. The prices of its shell eggs reflect fluctuations in the quoted market, and the results of the Company’s shell egg operations are materially affected by changes in market quotations. Egg prices reflect a number of economic conditions, such as the supply of eggs and the level of demand, which, in turn, are influenced by a number of factors that the Company cannot control. No representation can be made as to the future level of prices.
Shell eggs are perishable. Consequently, the Company maintains very low shell egg inventories, usually consisting
of approximately four days of production. Retail sales of shell eggs are greatest during the fall and winter months and lowest during the summer months. Prices for shell eggs fluctuate in response to seasonal demand factors and a natural increase in egg production during the spring and early summer. The Company generally experiences lower sales and net income, and generally losses, in its fourth and first fiscal quarters ending in May and August, respectively.
According to U.S. Department of Agriculture reports, the annual per capita consumption of shell eggs in the United
States since 1990 has ranged from 235 to 258, averaging 242, with the peak consumption of 258 occurring in 2000. While the Company believes that increased fast food restaurant consumption, reduced egg cholesterol levels and industry advertising campaigns may result in a continuance of the recent increases in current per capita egg consumption levels, no assurance can be given that per capita consumption will not decline in the future.
The Company sells the majority of its shell eggs in approximately 26 states across the southwest, southeast, mid-west
and mid-Atlantic regions of the United States. Cal-Maine is a major factor in egg marketing in a majority of these states. Many states in Cal-Maine’s market area are egg deficit regions; that is, production of fresh shell eggs is less than total consumption. Competition from other producers in specific market areas is generally based on price, service, and quality of product. Strong competition exists in each of the Company’s markets.
Specialty Eggs. The Company also produces specialty eggs such as Egg• land’s Best and Farmhouse eggs. Egg•
land’s Best eggs are patented eggs that are believed by its developers, based on scientific studies, to cause no increase in serum cholesterol when eaten as part of a low fat diet. Cal-Maine produces and processes Egg• land’s Best eggs, under license from Egg• land’s Best, Inc. (“EB”), at its existing facilities, under EB guidelines. The product is marketed to the Company’s established base of customers at prices that reflect a premium over ordinary shell eggs. Egg• land’s Best eggs accounted for approximately 4.4% of the Company’s net sales in fiscal 2001. “Farmhouse” brand eggs are produced at Company facilities by hens that are not caged, and are provided with a diet of natural grains and drinking water that is free of hormones or other chemical additives. Farmhouse eggs account for l.4% of net sales. They are intended to meet the demands of consumers who are sensitive to environmental and animal welfare issues.
Livestock. The Company’s livestock operations currently consist of the operation of a 1,440 head dairy facility, from
which milk sales are made to a major milk processor. Milk and cattle sales were approximately 2% of the Company’s net sales in fiscal 2001.
Competition. The production, processing, and distribution of shell eggs is an intensely competitive business which,
traditionally, has attracted large numbers of producers. Shell egg competition is generally based on price, service, and quality of production. Although the Company is the largest combined producer, processor, and distributor of shell eggs in the United States, it does not occupy a controlling market position in any area where its eggs are sold.
The shell egg production and processing industry has been characterized by a growing concentration of production.
In 2000, 63 producers with one million or more layers owned 79% of the 273 million total U.S. layers, compared with the 56 producers with one million or more layers owning 63.6% of the 231.9 million total U.S. layers in 1990, and 61 producers

7
with one million or more layers owning 56.2% of the 248.0 million total U.S. layers in 1985. The Company believes that a continuation of that concentration trend may result in the reduced cyclicality of shell egg prices, but no assurance can be given in that regard.
Patents and Tradenames. The Company does not own any patents or proprietary technologies, but does market
products under tradenames including Rio Grande, Farmhouse, and Sunups. Cal-Maine produces and processes Egg•land’s Best eggs, under license from EB, as indicated above.
Government Regulation. The Company is subject to federal and state regulations relating to grading, quality
control, labeling, sanitary control, and waste disposal. As a fully-integrated egg producer, the Company’s shell egg facilities are subject to USDA and FDA regulation. The Company’s shell egg facilities are subject to periodic USDA inspections. Cal-Maine maintains its own inspection program to assure compliance with the Company’s own standards and customer specifications.
Cal-Maine is subject to federal and state environmental laws and regulations and has all necessary permits. Employees. As of June 2, 2001, the Company had a total of approximately 1,750 employees of whom 1,580 worked
in egg production, processing and marketing, 100 were engaged in feed mill operations, 30 in dairy activities, and 40 were administrative employees, including officers, at the Company’s executive offices. About 7% of the Company’s personnel is part-time. None of the Company’s employees are covered by a collective bargaining agreement. The Company considers its relations with employees to be good. ITEM 2. PROPERTIES The Company owns or leases farms, processing plants, hatcheries, feed mills, warehouses, offices and other property located in Alabama, Arkansas, Georgia, Kansas, Kentucky, Louisiana, Mississippi, New Mexico, North Carolina, Ohio, Oklahoma, South Carolina, Tennessee, and Texas, as follows: two breeding facilities, two hatcheries, 15 feed mills, 19 production facilities, 14 pullet growing facilities, 22 processing and packing facilities, two wholesale distribution facilities, and a dairy farm. Most of the Company’s property is owned and encumbered. See Notes 5, 6, and 7 of the Notes to Consolidated Financial Statements of the Company.
The Company operates 304 over-the-road tractors and 370 trailers, of which 173 and 219 are owned, respectively, and the balance are leased.
At June 2, 2001, the Company owned approximately 16,000 acres of land and owned facilities to:
Operation Capacity Hatch 16,000,000 - pullet chicks per year Grow (1) 11,000,000 - pullets per year House (2) 19,000,000 - hens Produce 600 - tons of feed per hour Process (3) 7,000 - cases of eggs per hour
(1) The Company uses contract growers for the production of an additional 1.3 million pullets. (2) The Company controls approximately 21 million layers, of which 3.8 million are cared for by contract producers. (3) One case equals 30 dozen eggs. Over the past five fiscal years, Cal-Maine’s capital expenditures have totaled approximately $135.5 million, including the acquisition of the operations of other businesses. The Company’s facilities currently are maintained in good operable condition and are insured to an extent the Company deems adequate. ITEM 3. LEGAL PROCEEDINGS

8
The Company is not a party to any litigation which, in the opinion of management, is likely to have a material adverse effect on the Company’s consolidated financial position or results of operations. ITEM 4. SUBMISSION OF MATTERS TO A VOTE OF SECURITY HOLDERS No matters were submitted to a vote of security holders, through the solicitation of proxies or otherwise, during the fourth quarter ended June 2, 2001.

9
PART II.
ITEM 5. MARKET FOR REGISTRANT’S COMMON EQUITY AND RELATED SHAREHOLDER MATTERS The Company’s Common Stock is traded on the NASDAQ National Market under the symbol CALM. At June 2, 2001, there were approximately 251 record holders of the Company’s Common Stock and approximately 800 beneficial owners whose shares were held by nominees or broker dealers. The following table sets forth the high and low daily sale prices and dividends for four quarters of fiscal 2001 and fiscal 2000.
Cash Dividend Sales Price Declared
Year Ended Fiscal Quarter High Low June 2, 2001 First Quarter $ 4.375 $ 3.250 $ .0125 Second Quarter 4.313 3.125 .0125 Third Quarter 6.625 4.00 .0125 Fourth Quarter 5.38 4.406 .0125 June 3, 2000 First Quarter $ 5.50 $ 4.375 $ .0125 Second Quarter 4.875 3.344 .0125 Third Quarter 4.375 2.50 .0125 Fourth Quarter 4.094 3.250 .0125
There is no public trading market for the Class A Common Stock, the majority outstanding shares of which are owned by Fred R. Adams, Jr., Chairman of the Board of Directors and Chief Executive Officer of the Company.
The Company’s current cash dividend is $.0125 per share on Common Stock, representing an annual cash dividend of $.05 per share. The cash dividend is $.011875 per share on Class A Common Stock, representing an annual cash dividend of $.0475 per share. Under the terms of the Company’s agreements with its principal lenders, Cal-Maine is subject to various financial covenants limiting its ability to pay dividends. The Company is required to maintain minimum levels of working capital and net worth, to limit capital expenditures, leasing transactions and additional long-term borrowings, and to maintain various current and cash-flow coverage ratios, among other restrictions. For the foreseeable future, the Company expects to retain the majority of earnings for use in its business.

10
ITEM 6. SELECTED FINANCIAL DATA Fiscal Years Ended June 2, June 3, May 29, May 30, May 31, 2001 2000 1999 1998 1997
(Amounts in thousands, except per share data)
Statement of Operations Data: Net sales $ 358,412 $ 287,055 $ 287,954 $ 309,071 $ 292,526 Cost of sales 299,417 268,937 242,022 264,636 236,273 Gross profit 58,995 18,118 45,932 44,435 56,253 Selling, general and administrative 42,337 40,059 36,406 34,089 28,930 Operating income (loss) 16,658 (21,941) 9,526 10,346 27,323 Other income (expense): Interest expense (8,736) (7,726) (5,195) (4,583) (4,277) Equity in income of affiliates 415 130 326 294 524 Other 2,378 2,525 3,330 2,268 783 (5,943) (5,071) (1,539) (2,021) (2,970) Income (loss) before income taxes 10,715 (27,012) 7,987 8,325 24,353 Income tax expense (benefit) (3,891) (9,633) 2,907 2,946 9,508 Net income (loss) $ 6,824 $ (17,379) $ 5,080 $ 5,379 $ 14,845 Net income (loss) per common share: Basic $ .57 $ (1.41) $ 0.39 $ 0.41 $ 1.21 Diluted $ .56 $ (1.41) $ 0.39 $ 0.40 $ 1.18 Cash dividends declared per share $ 0.050 $ 0 .048 $ 0.045 $ 0.020 $ .00 Weighted average shares outstanding: Basic 12,051 12,362 12,999 13,191 12,285 Diluted 12,120 12,362 13,114 13,428 12,560 Balance Sheet Data: Working capital $ 28,386 $ 18,485 $ 48,501 $ 56,591 $ 45,390 Total assets 234,752 231,899 213,682 203,188 182,294 Total debt (including current portion) 118,340 119,736 84,004 75,498 64,436 Total stockholders’ equity 66,196 61,353 80,584 79,547 74,642 ITEM 7. MANAGEMENTS’S DISCUSSION AND ANALYSIS OF FINANCIAL
CONDITION AND RESULTS OF OPERATIONS OVERVIEW The Company is primarily engaged in the production, cleaning, grading, packing, and sale of fresh shell eggs. The Company’s fiscal year end is the Saturday nearest to May 31 which was June 2, 2001 (52 weeks), June 3, 2000 (53 weeks) and May 29, 1999 (52 weeks) for the most recent three fiscal years.

11
The Company’s operations are fully integrated. At its facilities it hatches chicks, grows pullets, manufactures feed, and produces, processes, and distributes shell eggs. The Company currently is the largest producer and distributor of fresh shell eggs in the United States. Shell eggs accounted for over 98% of the Company’s net sales in fiscal 2001 and 2000. The Company primarily markets its shell eggs in the southwestern, southeastern, mid-western and mid-Atlantic regions of the United States. Shell eggs are sold directly by the Company primarily to national and regional supermarket chains.
The Company currently uses contract producers for approximately 16% of its total egg production. Contract
producers operate under agreements with the Company for the use of their facilities in the production of shell eggs by layers owned by the Company, which owns the eggs produced. Also, shell eggs are purchased, as needed, for resale by the Company from outside producers.
The Company’s operating income or loss is significantly affected by wholesale shell egg market prices, which can fluctuate widely and are outside of the Company’s control. Retail sales of shell eggs are greatest during the fall and winter months and lowest during the summer months. Prices for shell eggs fluctuate in response to seasonal factors and a natural increase in egg production during the spring and early summer.
The Company’s cost of production is materially affected by feed costs, which average about 58% of Cal-Maine's total farm egg production cost. Changes in feed costs result in changes in the Company’s cost of goods sold. The cost of feed ingredients is affected by a number of supply and demand factors such as crop production and weather, and other factors, such as the level of grain exports, over which the Company has little or no control. RESULTS OF OPERATIONS The following table sets forth, for the years indicated, certain items from the Company’s consolidated statements of operations expressed as a percentage of net sales.
Percentage of Net Sales Fiscal Years Ended
June 2, 2001 June 3, 2000 May 29, 1999 Net sales 100.0% 100.0% 100.0% Cost of sales 83.5 93.7 84.0 Gross profit 16.5 6.3 16.0 Selling, general & administrative expenses 11.8 14.0 12.6 Operating income (loss) 4.7 (7.7) 3.4 Other income (expense) (1.7) (1.7) (0.6) Income (loss) before taxes 3.0 (9.4) 2.8 Income tax expense (benefit) 1.1 (3.3) 1.0 Net income (loss) 1.9% (6.1)% 1.8%

12
Fiscal Year Ended June 2, 2001 Compared to Fiscal Year Ended June 3, 2000 Net Sales. Net sales for the fiscal year ended June 2, 2001 were $358.4 million, an increase of $71.3 million, or 24.9%, from net sales of $287.1 million for the preceeding fiscal year. The increase resulted from increases in dozens sold and selling prices of shell eggs. In fiscal 2001, total dozens of shell eggs sold were 545.1 million, an increase of 18.9 million dozen, or 3.6%, compared to 526.2 million dozen sold in fiscal 2000. Good consumer demand and a lower, balanced egg supply resulted in higher egg selling prices during the current fiscal year. The Company’s average selling price of shell eggs increased from $.507 per dozen for fiscal 2000 to $.625 per dozen for fiscal 2001, an increase of $.118 per dozen, or 23.3%. Cost of Sales. Cost of sales for the fiscal year ended June 2, 2001 was $299.4 million, an increase of $30.5 million, or 11.3%, as compared to cost of sales of $268.9 million for last fiscal year. The increase is due to increases in dozens sold, cost of purchases from outside egg producers, and cost of feed ingredients. The 3.6% increase in dozens sold was the net result of an increase in dozens produced in Company facilities and a decrease in the number of dozens purchased from outside egg producers. The increase in the cost of the eggs purchased from outside producers was due to improved egg market conditions. Feed cost for fiscal 2001 was $.197 per dozen, compared to $.188 per dozen for last fiscal year, an increase of 4.8%. A 23.3% increase in egg selling prices, offset by a 11.3% increase in cost of goods sold resulted in an increase in gross profit from 6.3% of net sales for fiscal 2000 to 16.5% of net sales for fiscal 2001. Selling, General and Administrative Expenses. Selling, general and administrative expense in fiscal 2001 was $42.3 million, an increase of $2.2 million, or 5.7%, as compared to $40.1 million for fiscal 2000. The increase in cost is due to increased dozens sold and higher delivery costs, especially in fuel and outside contract hauling. On a cost per dozen sold basis, selling, general and administrative remained approximately the same, $.078 per dozen for fiscal 2001, as compared to $.076 per dozen for last fiscal year. As a percent of net sales, selling, general and administrative expense decreased from 14.0% for fiscal 2000 to 11.8% for fiscal 2001. Operating Income (Loss). As a result of the above, the Company’s operating income was $16.7 million for fiscal 2001, as compared to an operating loss of $21.9 million for fiscal 2000. As a percent of net sales, the operating income for fiscal 2001 was 4.7%, as compared to an operating loss of 7.7% for fiscal 2000. Other Income (Expense). Other expense for fiscal 2001 was $5.9 million, an increase of $872,000, as compared to other expense of $5.1 million for fiscal 2000. For fiscal 2001, interest expense increased $1.3 million and net other income increased $474,000. Interest expense increased due to increased borrowing during fiscal 2001, primarily on the Company’s line of credit. The line of credit increased through the first quarter of fiscal 2001 and was repaid during the third quarter. As a percent of net sales, other expense was 1.7% in both fiscal 2001 and 2000. Income Taxes. As a result of the above, the Company’s pre-tax income was $10.7 million for the current fiscal year, compared to a pre-tax loss of $27.0 million for fiscal 2000. For the current fiscal year, income tax expense totaled $3.9 million with an effective tax rate of 36.3%, as compared to an income tax benefit of $9.6 million with an effective rate of 35.7% for fiscal 2000. Net Income (Loss). As a result of the above, net income for fiscal 2001 was $6.8 million or $0.57 per basic share and $0.56 per diluted share, compared to net loss of $17.4 million, or $1.41 per basic and diluted share for fiscal 2000.

13
Fiscal Year Ended June 3, 2000 Compared to Fiscal Year Ended May 29, 1999 Net Sales. Net sales for the fiscal year ended June 3, 2000 were $287.1 million, a decrease of $899,000 from net sales of $288.0 million for the fiscal year ended May 29, 1999. The decrease resulted from a $4.9 million decrease in net sales of feed to outside producers, offset by $4.0 million increase in sales of shell eggs. The increase in shell egg sales is attributable to a 23.7% increase in dozens sold and an 18.6% decrease in average selling price per dozen. Although domestic demand was good, increased egg supply and weak export demand caused egg market prices to decrease. In fiscal 2000, total dozens of shell eggs sold were 526.2 million, an increase of 100.7 million dozen, compared to 425.5 million dozen sold in fiscal 1999. Of the increased dozens sold, 70% resulted from the acquisition of the egg production and processing operations of Hudson Brothers in May 1999 and of Smith Farms in September 1999. The balance of the increase in dozens sold was purchased from outside egg producers. As a result of the decline in shell egg market prices, the Company’s average selling price of shell eggs decreased from $.623 for fiscal 1999 to $.507 per dozen, a decrease of $.116 per dozen. Feed sales to outside producers decreased as a result of lower tons sold and slightly lower cost of feed ingredients during fiscal 2000 which reduced market prices for feed. Cost of Sales. The cost of sales in fiscal 2000 was $268.9 million, an increase of $26.9 million, or 11.1%, above fiscal 1999 cost of sales of $242.0 million. The increase is the net result of an increase in dozens sold and a slight decrease in feed cost per dozen produced. As discussed above, dozens sold for fiscal 2000 increased 100.7 million dozen, or 23.7%. Of the increase in dozens sold, 27.7 million dozens were purchased from outside egg producers, an increase of 25.0% above the 1999 fiscal year. During weak egg market conditions as described above, the Company is able to purchase outside eggs at more favorable net prices which mitigates the normally higher cost of purchasing eggs from outside sources. A good 1999 corn and soybean harvest resulted in slight decreases in cost of feed ingredients. Feed cost for fiscal 2000 was $.188 per dozen, compared to $.195 per dozen for the 1999 fiscal year, a decrease of $.007 per dozen, or 3.6%. Decreased feed cost and cost of outside egg purchases were not enough to offset the 18.6% drop in egg selling prices, and the net result was a decrease in gross profit from 16.0% of net sales for fiscal 1999 to 6.3% for fiscal 2000. Selling, General and Administrative Expenses. Selling, general, and administrative expense in fiscal 2000 was $40.1 million, an increase of $3.7 million, or 10.0%, as compared to $36.4 million for fiscal 1999. The increase is due to increased payroll and related expenses from the acquisitions of Hudson Brothers in May 1999 and Smith Farms in September 1999 and due to increased delivery costs from the increased dozens sold. On a cost per dozen sold basis, selling, general and administrative expense decreased from $.086 per dozen for fiscal 1999 to $.076 per dozen for fiscal 2000, a decrease of $.01 per dozen sold, or 11.6%. As a percent of net sales, selling, general and administrative expense increased from 12.6% from fiscal 1999 to 14.0% for fiscal 2000. Operating Income (Loss) . As a result of the above, the Company’s operating loss was $21.9 million, as compared to an operating income of $9.5 million for fiscal 1999. As a percent of net sales, the operating loss for fiscal 2000 was 7.7%, as compared to an operating income of 3.4% for fiscal 1999. Other Income (Expense). Other expense for fiscal 2000 was $5.1 million, an increase of $3.6 million, as compared to other expense of $1.5 million for fiscal 1999. For fiscal 2000, interest expense increased $2.5 million and net other income decreased $1.0 million. Interest expense increased due to increased borrowings. Other income decreased primarily from a decrease in interest earned due to lower cash equivalent investments. As a percent of net sales, other expense was 1.7% for fiscal 2000, compared to 0.6% for fiscal 1999. Income Taxes. As a result of the above, the Company’s pre-tax loss was $27.0 million, compared to pre-tax income of $8.0 million for fiscal 1999. For fiscal 2000, the Company’s income tax benefit totaled $9.6 million with an effective rate of 35.7%, as compared to income tax expense of $2.9 million with an effective rate of 36.4% for fiscal 1999. Net Income (Loss). As a result of the above, net loss for fiscal 2000 was $17.4 million or $1.41 per basic and diluted share, compared to net income of $5.1 million, or $.039 per basic and diluted share for fiscal 1999.

14
Capital Resources and Liquidity. The Company’s working capital at June 2, 2001 was $28.4 million compared to $18.5 million at June 3, 2000. The Company’s current ratio was 1.59 at June 2, 2001 as compared with 1.36 at June 3, 2000. The Company’s need for working capital generally is highest in the last and first fiscal quarters ending in May and August, respectively, when egg prices are normally at seasonal lows. Seasonal borrowing needs frequently are higher during these quarters than during other fiscal quarters. The Company has a $35.0 million line of credit with three banks, none of which was outstanding at June 2, 2001. The Company’s long-term debt at June 2, 2001, including current maturities, amounted to $118.3 million, as compared to $119.7 million at June 3, 2000.
For the fiscal year ended June 2, 2001, $30.4 million was provided by operating activities. The Company had additional long-term borrowings of $5.0 million, $736,000 net proceeds from the disposal of property, plant and equipment and $366,000 net proceeds from notes receivable and investments. In the 2001 fiscal year, $8.3 million was used for construction projects and $5.8 million for purchases of property, plant and equipment. Approximately $1.4 million was used for purchases of common stock for treasury and $607,000 for dividend payments on the common stock. Principal payments of $6.4 million were made on long-term debt and $7.5 million was repaid on borrowings on the line of credit. The net result of these activities was an increase in cash and cash equivalents of $6.6 million for fiscal 2001. The egg industry has placed more baby chicks during the first six months of calendar 2001 than previously forecast. This could result in increased egg production and downward pressure on egg prices. Egg demand is very good for domestic use, with export demand down slightly. Cost of feed is projected to continue at moderate price levels for the fiscal year ahead.
Substantially all trade receivables and inventories collateralize the Company’s line of credit, and property, plant and equipment collateralize the Company’s long-term debt. The Company is required by certain provisions of these loan agreements to (1) maintain minimum levels of working capital and net worth; (2) limit dividends, capital expenditures, lease obligations and additional long-term borrowings; and (3) maintain various current and cash-flow coverage ratios, among other restrictions. At June 2, 2001, the Company did not meet certain of these provisions on its long-term debt agreements. The Company has obtained waivers of these requirements through fiscal 2002. Under certain of the loan agreements, the lenders have the option to require the prepayment of any outstanding borrowings in the event of a change in the control of the Company. In fiscal 2001, the Company began construction of a new shell egg production and processing facility in Guthrie, Kentucky, with completion of the facility expected in fiscal 2003. The total cost of the facility is approximately $18.0 million, of which $1.0 million was incurred through June 2, 2001. The Company has commitments from an insurance company to receive $10.0 million in long-term borrowings and from a leasing company to receive $7.5 million applicable to the Guthrie facility. In addition to the construction, the Company has projected capital expenditures of $15.5 million fiscal 2002, which will be funded by cash flows from operations and additional long-term borrowings. As part of the Smith Farms purchase in September 1999, the Company is continuing the construction of egg production and processing facilities in Searcy, Arkansas and Flatonia, Texas. The projects are being funded by a leasing company. Total cost of the Searcy facility is approximately $20.0 million and completion is expected in the first quarter of fiscal 2002. Total cost of the Flatonia facility is approximately $16.0 million and completion is anticipated in the second quarter of fiscal 2002. These facilities will be leased with seven year terms and accounted for as operating leases. The Company has $2.9 million of deferred tax liability due to a subsidiary’s change from a cash basis to an accrual basis taxpayer on May 29, 1988. The Taxpayer Relief Act of 1997 provides that the taxes on the cash basis temporary differences as of that date are generally payable over the 20 years beginning in fiscal 1999 or in the first fiscal year in which there is a change in ownership control. Payment of the $2.9 million deferred tax liability would reduce the Company’s cash, but would not impact the Company’s consolidated statement of operations or stockholders’ equity, as these taxes have been accrued and are reflected on the Company’s consolidated balance sheet. See Note 10 of Notes to Consolidated Financial Statements.

15
Impact of Recently Issued Accounting Standards. The Company will adopt the provisions of Financial Accounting Standards No. 133, “Accounting for Derivative Instruments and Hedging Activities” (SFAS No. 133) in the first quarter of fiscal 2002. Because the Company is not a party to derivative financial instruments, the adoption of SFAS No. 133 will have no effect on the consolidated financial statements of the Company. On June 29, 2001, the Financial Accounting Standards Board issued Financial Accounting Standards No. 141, “Business Combinations” (SFAS No. 141) and No. 142, “Goodwill and Other Intangible Assets” (SFAS No. 141). SFAS No. 141 eliminates the pooling-of-interests method of accounting for business combinations except for qualifying business combinations that were initiated prior to July 1, 2001. SFAS No. 141 also includes new criteria to recognize intangible assets separately from goodwill. The requirements of SFAS 141 are effective for any business combination accounted for by the purchase method that is completed after June 30, 2001. Under SFAS No. 142, goodwill and intangible assets with indefinite lives are no longer amortized but are reviewed at least annually for impairment. Separable intangible assets that are not deemed to have an indefinite life will continue to be amortized over their useful lives. The amortization provisions of SFAS No. 142 requiring nonamortization of goodwill and indefinite lived intangible assets apply to goodwill and indefinite lived intangible assets acquired after June 30, 2001. With respect to goodwill and intangible assets acquired prior to July 1, 2001, the Company is required to adopt the SFAS No. 142 in the first quarter of fiscal 2003, with early adoption permitted in the first quarter of fiscal 2002. Management has not determined the effect of the adoption of this statement on the earnings and financial position of the Company. Management has not made a final decision, but is considering early adoption of SFAS No. 142 in the first quarter of fiscal 2002. Forward Looking Statements. The foregoing statements contain forward-looking statements which involve risks and uncertainties and the Company’s actual experience may differ materially from that discussed above. Factors that may cause such a difference include, but are not limited to, those discussed in “Factors Affecting Future Performance” below, as well as future events that have the effect of reducing the Company’s available cash balances, such as unanticipated operating losses or capital expenditures related to possible future acquisitions. Readers are cautioned not to place undue reliance on forward-looking statements, which reflect management’s analysis only as the date hereof. The Company assumes no obligation to update forward-looking statements. See also the Company’s reports to be filed from time to time with the Securities and Exchange Commission pursuant to the Securities Exchange Act of 1934. Factors Affecting Future Performance. The Company’s future operating results may be affected by various trends and factors which are beyond the Company’s control. These include adverse changes in shell egg prices and in the grain markets. Accordingly, past trends should not be used to anticipate future results and trends. Further, the Company’s prior performance should not be presumed to be an accurate indication of future performance.
16
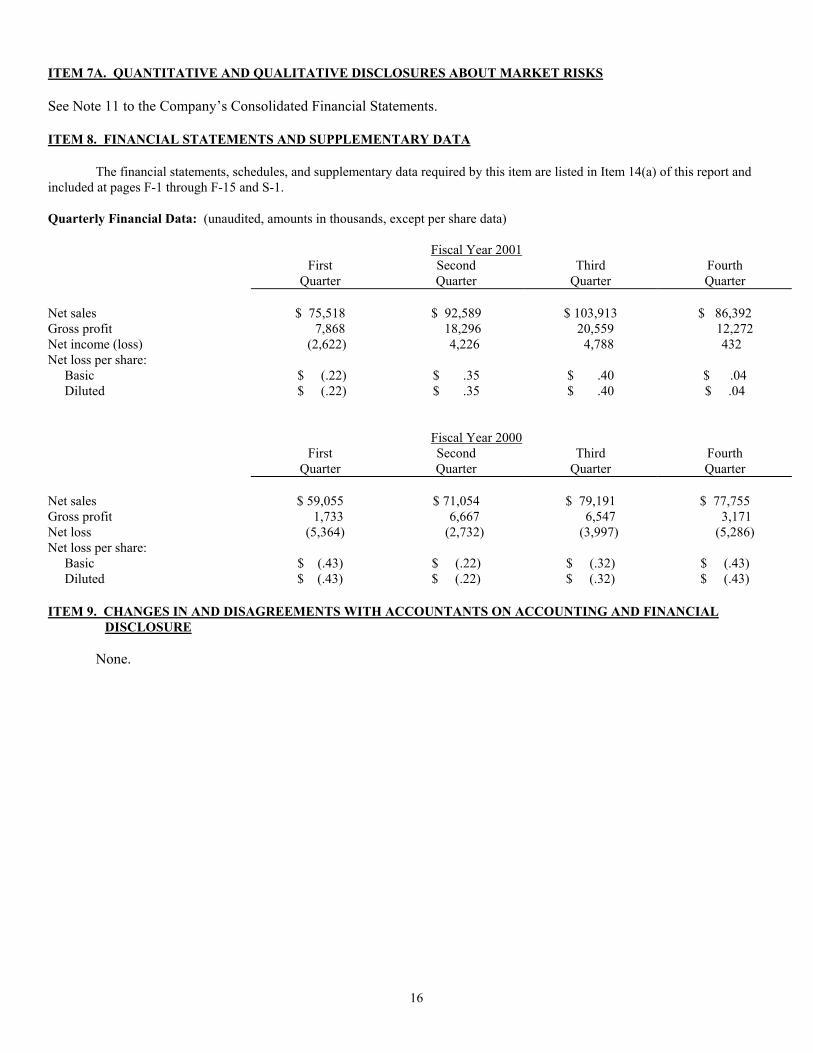
ITEM 7A. QUANTITATIVE AND QUALITATIVE DISCLOSURES ABOUT MARKET RISKS See Note 11 to the Company’s Consolidated Financial Statements. ITEM 8. FINANCIAL STATEMENTS AND SUPPLEMENTARY DATA The financial statements, schedules, and supplementary data required by this item are listed in Item 14(a) of this report and included at pages F-1 through F-15 and S-1. Quarterly Financial Data: (unaudited, amounts in thousands, except per share data) Fiscal Year 2001 First Second Third Fourth Quarter Quarter Quarter Quarter Net sales $ 75,518 $ 92,589 $ 103,913 $ 86,392 Gross profit 7,868 18,296 20,559 12,272 Net income (loss) (2,622) 4,226 4,788 432 Net loss per share: Basic $ (.22) $ .35 $ .40 $ .04 Diluted $ (.22) $ .35 $ .40 $ .04
Fiscal Year 2000 First Second Third Fourth Quarter Quarter Quarter Quarter Net sales $ 59,055 $ 71,054 $ 79,191 $ 77,755 Gross profit 1,733 6,667 6,547 3,171 Net loss (5,364) (2,732) (3,997) (5,286) Net loss per share: Basic $ (.43) $ (.22) $ (.32) $ (.43) Diluted $ (.43) $ (.22) $ (.32) $ (.43) ITEM 9. CHANGES IN AND DISAGREEMENTS WITH ACCOUNTANTS ON ACCOUNTING AND FINANCIAL DISCLOSURE None.

17
PART III ITEM 10. DIRECTORS AND EXECUTIVE OFFICERS OF THE REGISTRANT The information concerning directors and executive officers is incorporated by reference from the Company’s definitive proxy statement which is to be filed pursuant to Regulation 14A under the Securities Exchange Act of 1934 in connection with the Company’s 2001 Annual Meeting of Shareholders. ITEM 11. EXECUTIVE COMPENSATION The information concerning executive compensation is incorporated by reference from the Company’s definitive proxy statement which is to be filed pursuant to Regulation 14A under the Securities Exchange Act of 1934 in connection with the Company’s 2001 Annual Meeting of Shareholders. ITEM 12. SECURITY OWNERSHIP OF CERTAIN BENEFICIAL OWNERS AND MANAGEMENT The information concerning security ownership of certain beneficial owners and management is incorporated by reference from the Company’s definitive proxy statement which is to be filed pursuant to Regulation 14A under the Securities Exchange Act of 1934 in connection with the Company’s 2001 Annual Meeting of Shareholders. ITEM 13. CERTAIN RELATIONSHIPS AND RELATED TRANSACTIONS The information concerning certain relationships and related transactions is incorporated by reference from the Company’s definitive proxy statement which is to be filed pursuant to Regulation 14A under the Securities Exchange Act of 1934 in connection the Company’s 2001 Annual Meeting of Shareholders.
PART IV
ITEM 14. EXHIBITS, FINANCIAL STATEMENTS, SCHEDULES AND REPORTS ON FORM 8-K
(a) Financial Statements The consolidated financial statements of the Company listed on the accompanying index to consolidated financial statements are filed as part of this report. The financial schedule required by Regulation S-X is filed at page S-1.
(b) Reports on Form 8-K
No Current Report on Form 8-K was filed by the Company covering an event during the fourth quarter of fiscal 2001. No amendments to previously filed Forms 8-K were filed during the fourth quarter of fiscal
2001.
(c) Exhibits Required by Item 601 of Regulation S-K
The following exhibits are filed herewith or incorporated by reference: Exhibit Number Exhibit 2 Sale and exchange agreements dated September 13, 1999, by and among B & N Poultry, et al., and Cal-Maine Foods,
Inc. (Omitted exhibits will be furnished supplementally to the Commission upon request) *******
3.1 Amended and Restated Certificate of Incorporation of the Registrant.*

18
3.2 By-Laws of the Registrant, as amended.* 4.1 See Exhibits 3.1 and 3.2 as to be the rights of holders of the Registrant’s common stock. 4.2 Form of Warrant Agreement (including form of Common Stock Purchase Warrant).* 10.1 Amended and Restated Term Loan Agreement, dated as of May 29, 1990, between Cal-Maine Foods, Inc. and
Cooperative Centrale Raiffeisen - Boerenleenbank B.A., “Rabobank Nederland,” New York Branch, and Amended and Restated Revolving Credit Agreement among Cal-Maine Foods, Inc., and Barclays Banks PLD (New York) and Cooperatieve Centrale Raiffeisen-Borenleenbank B.A., dated as of 29 May 1990, and amendments thereto (without exhibits).*
10.1(a) Amendment to Term Loan Agreement (see Exhibit 10.1) dated as of June 3, 1997 (without exhibits). ** 10.2 Note Purchase Agreement, dated as of November 10, 1993, between John Hancock Mutual Life Insurance Company
and Cal-Maine Foods, Inc., and amendments thereto (without exhibits).* 10.3 Loan Agreement, dated as of May 1, 1991, between Metropolitan Life Insurance Corporation and Cal-Maine Foods,
Inc., and amendments thereto (without exhibits).* 10.4 Employee Stock Ownership Plan, as Amended and Restated.* + 10.5 1993 Stock Option Plan, as Amended.* + 10.6 Wage Continuation Plan, dated as of January1, 1986, among R.K. Looper, B.J. Raines, and the Registrant.* + 10.6(a) Amendment dated October 29, 1997 to Wage Continuation Plan, dated as of January 1, 1986, between B.J. Raines and the Registrant. ****+ 10.7 Wage Continuation Plan, dated as of July 1, 1986, between Jack Self and the Registrant, as amended on September 2,
1994.* + 10.8 Wage Continuation Plan, dated as of April 15, 1988, between Joe Wyatt and the Registrant.* + 10.9 Redemption Agreement, dated March 7, 1994, between the Registrant and Fred R. Adams, Jr.* 10.10 Note Purchase Agreement, dated December 18, 1997, among Cal-Maine Foods, Inc., Cal-Maine Farms, Inc., Cal-Maine Egg Products, Inc., Cal-Maine Partnership, LTD, CMF of Kansas LLC and First South Production Credit Association and Metropolitan Life Insurance Company (without exhibits, except names of guarantors and forms of notes) *** 10.11 Wage Continuation Plan, dated as of January 14, 1999, among Stephen Storm, Charles F. Collins, Bob Scott, and the
Registrant *****+ 10.12 Secured note purchase agreement dated September 28, 1999 among Cal-Maine Foods, Inc., Cal-Maine Partnership,
LTD, and John Hancock Mutual Life Insurance Company, and John Hancock Variable Life Insurance Company (without exhibits, annexes and disclosure schedules) ******
10.13 1999 Stock Option Plan *********+ 21 Subsidiaries of the Registrant

19
23 Consent of Independent Auditors
+ Management contract or compensatory plan. * Incorporated by reference to the same exhibit number in Registrant’s Form S-1 Registration Statement No.
333-14809. ** Incorporated by reference to the same exhibit number in Registrant’s Form 10-K for fiscal year ended May
31,1997. *** Incorporated by reference to the same exhibit number in Registrant’s Form 10-Q for the quarter ended November 29, 1997. **** Incorporated by reference to the same exhibit number in Registrant’s Form 10-K for fiscal year ended May
30, 1998. ***** Incorporated by reference to the same exhibit number in Registrant’s Form 10-K for fiscal year ended May
29, 1999. ****** Incorporated by reference to the same exhibit number in Registrant’s Form 10-Q for the quarter ended
November 27, 1999. ******* Incorporated by reference to the same exhibit number in Registrant’s Form 8-K, dated September 30, 1999. ******** Incorporated by reference to Registrant’s form S-8 Registration Statement No. 333-39940, dated June 23,
2000. The Company agrees to file with the Securities and Exchange Commission, upon request, copies of any instrument defining the rights of the holders of its consolidated long-term debt. (d) Financial Statement Schedules Required by Regulation S-X
The financial statement schedule required by Regulation S-X is filed at page S-1. All other schedules for which provision is made in the applicable accounting regulations of the Securities and Exchange Commission are not required under the related instructions or are inapplicable and therefore have been omitted.

20
SIGNATURES
Pursuant to the requirements of Section 13 or 15(d) of the Securities Exchange Act of 1934, the registrant has duly caused this report to be signed on its behalf by the undersigned, thereunto duly authorized, in Jackson, Mississippi, on this 13th day of August, 2001. CAL-MAINE FOODS, INC.
/s/ Fred R. Adams, Jr. Fred R. Adams, Jr.
Chairman of the Board and Chief Executive Officer
Pursuant to the requirements of the Securities Exchange Act of 1934, this report has been signed below by the following persons on behalf of the registrant and in the capacities and on the dates indicated: Signature Title Date /s/ Fred R. Adams, Jr. Chairman of the Board and August 13, 2001 Fred R. Adams, JR Chief Executive Officer (Principal Executive Officer) /s/ Richard K. Looper Vice Chairman of the Board August 13, 2001 Richard K. Looper and Director /s/ Adolphus B. Baker President and Director August 13, 2001
Adolphus B. Baker /s/ Bobby J. Raines Vice President, Chief Financial August 13, 2001 Bobby J. Raines Officer, Treasurer, Secretary and Director (Principal Financial Officer) /s/ Charles F. Collins Vice President, Controller August 13, 2001 Charles F. Collins and Director (Principal Accounting Officer) /s/ Jack B. Self Vice President and Director August 13, 2001 Jack B. Self /s/ Joe M. Wyatt Vice President and Director August 13, 2001 Joe M. Wyatt Director
W. D. Cox Director
R. Faser Triplett
Director Letitia C. Hughes

21
INDEX TO CONSOLIDATED FINANCIAL STATEMENTS
Page
Report of Independent Auditors…………………………………………………..………………………………… F-2
Consolidated Balance Sheets as of June 2, 2001 and June 3, 2000…………………….….…………………….. F-3
Consolidated Statements of Operations for the years ended June 2, 2001, June 3, 2000 and May 29, 1999………..…………………………..…………………………………………………….. F-4
Consolidated Statements of Stockholders’ Equity for the years ended June 2, 2001, June 3, 2000 and May 29, 1999………..…………………………..…………………………………………………….. F-5 Consolidated Statements of Cash Flows for the years ended June 2, 2001, June 3, 2000 and May 29, 1999..…… F-6 Notes to Consolidated Financial Statements………………………………………………………………………… F-7
F-1

22
Report of Independent Auditors The Board of Directors and Stockholders Cal-Maine Foods, Inc. We have audited the accompanying consolidated balance sheets of Cal-Maine Foods, Inc. and subsidiaries as of June 2, 2001 and June 3, 2000, and the related consolidated statements of operations, stockholders' equity and cash flows for each of the three years in the period ended June 2, 2001. Our audits also included the financial statement schedule listed in the index at Item 14(a). These financial statements and schedule are the responsibility of the Company's management. Our responsibility is to express an opinion on these financial statements and schedule based on our audits. We conducted our audits in accordance with auditing standards generally accepted in the United States. Those standards require that we plan and perform the audit to obtain reasonable assurance about whether the financial statements are free of material misstatement. An audit includes examining, on a test basis, evidence supporting the amounts and disclosures in the financial statements. An audit also includes assessing the accounting principles used and significant estimates made by management, as well as evaluating the overall financial statement presentation. We believe that our audits provide a reasonable basis for our opinion. In our opinion, the consolidated financial statements referred to above present fairly, in all material respects, the consolidated financial position of Cal-Maine Foods, Inc. and subsidiaries at June 2, 2001 and June 3, 2000, and the consolidated results of their operations and their cash flows for each of the three years in the period ended June 2, 2001, in conformity with accounting principles generally accepted in the United States. Also, in our opinion, the related financial statement schedule, when considered in relation to the basic financial statements taken as a whole, presents fairly in all material respects the information set forth therein. /s/ Ernst & Young LLP Jackson, Mississippi July 12, 2001
F-2

23
Cal-Maine Foods, Inc. and Subsidiaries
Consolidated Balance Sheets (in thousands, except share amounts)
June 2 June 3 2001 2000 Assets Current assets: Cash and cash equivalents $ 13,129 $ 6,541 Receivables: Trade receivables, less allowance for doubtful accounts of $590 in 2001 and $305 in 2000 15,254 13,075 Other 763 1,495 16,017 14,570 Recoverable federal and state income taxes – 4,509 Inventories 47,122 43,913 Prepaid expenses and other current assets 569 797 Total current assets 76,837 70,330 Other assets: Notes receivable and investments 7,673 7,072 Goodwill 3,147 3,390 Other 2,447 2,970 13,267 13,432 Property, plant and equipment, less accumulated depreciation 144,648 148,137 Total assets $234,752 $231,899
Liabilities and stockholders' equity Current liabilities: Note payable to bank $ – $ 7,500 Trade accounts payable 18,952 17,113 Accrued wages and benefits 5,628 4,962 Accrued expenses and other liabilities 4,912 3,878 Current maturities of long-term debt 7,184 7,105 Deferred income taxes 11,775 11,287 Total current liabilities 48,451 51,845 Long-term debt, less current maturities 111,156 112,631 Other noncurrent liabilities 1,450 1,489 Deferred income taxes 7,499 4,581 Total liabilities 168,556 170,546 Stockholders' equity: Common stock, $.01 par value: Authorized shares - 30,000,000 Issued and outstanding shares - 17,565,200 176 176 Class A common stock, $.01 par value: Authorized shares - 1,200,000 Issued and outstanding shares - 1,200,000 12 12 Paid-in capital 18,784 18,784 Retained earnings 59,752 53,535 Common stock in treasury (6,863,512 shares in 2001 and 6,550,912 shares in 2000) (12,528) (11,154) Total stockholders' equity 66,196 61,353 Total liabilities and stockholders' equity $234,752 $231,899 See accompanying notes.
F-3

24
Cal-Maine Foods, Inc. and Subsidiaries
Consolidated Statements of Operations (in thousands, except per share amounts)
Fiscal year ended June 2 June 3 May 29 2001 2000 1999 Net sales $358,412 $287,055 $287,954 Cost of sales 299,417 268,937 242,022 Gross profit 58,995 18,118 45,932 Selling, general and administrative 42,337 40,059 36,406 Operating income (loss) 16,658 (21,941) 9,526 Other income (expense): Interest expense (9,072) (7,726) (5,195) Interest income 336 748 2,202 Equity in income of affiliates 415 130 357 Other, net 2,378 1,777 1,097 (5,943) (5,071) (1,539) Income (loss) before income taxes 10,715 (27,012) 7,987 Income tax expense (benefit) 3,891 (9,633) 2,907 Net income (loss) $ 6,824 $ (17,379) $ 5,080 Net income (loss) per share: Basic $ .57 $ (1.41) $ .39 Diluted $ .56 $ (1.41) $ .39 Weighted average shares outstanding: Basic 12,051 12,362 12,999 Diluted 12,120 12,362 13,114
See accompanying notes.
F-4

25
Cal-Maine Foods, Inc. and Subsidiaries
Consolidated Statements of Stockholders' Equity
(in thousands, except per share amounts)
Common Stock Class A Class A Treasury Treasury Paid-in Retained Shares Amount Shares Amount Shares Amount Capital Earnings Total Balance at May 30, 1998 17,565 $176 1,200 $12 5,608 $ (6,456) $18,784 $67,031 $79,547 Purchases of common stock for treasury – – – – 650 (3,457) – – (3,457) Cash dividends paid ($.045 per – – – – – – – (586) (586) common share) Net income for fiscal 1999 – – – - – – – 5,080 5,080 Balance at May 29, 1999 17,565 176 1,200 12 6,258 (9,913) 18,784 71,525 80,584 Purchases of common stock for treasury – – – – 293 (1,241) – – (1,241) Cash dividends paid ($.048 per common share) – – – – – – – (611) (611) Net loss for fiscal 2000 – – – – – – – (17,379) (17,379)Balance at June 3, 2000 17,565 176 1,200 12 6,551 (11,154) 18,784 53,535 61,353 Purchases of common stock for treasury – – – – 313 (1,374) – – (1,374) Cash dividends paid ($.05 per common share) – – – – – – – (607) (607) Net income for fiscal 2001 – – – – – – – 6,824 6,824 Balance at June 2, 2001 17,565 $176 1,200 $12 6,864 $(12,528) $18,784 $59,752 $66,196 See accompanying notes.
F-5
26
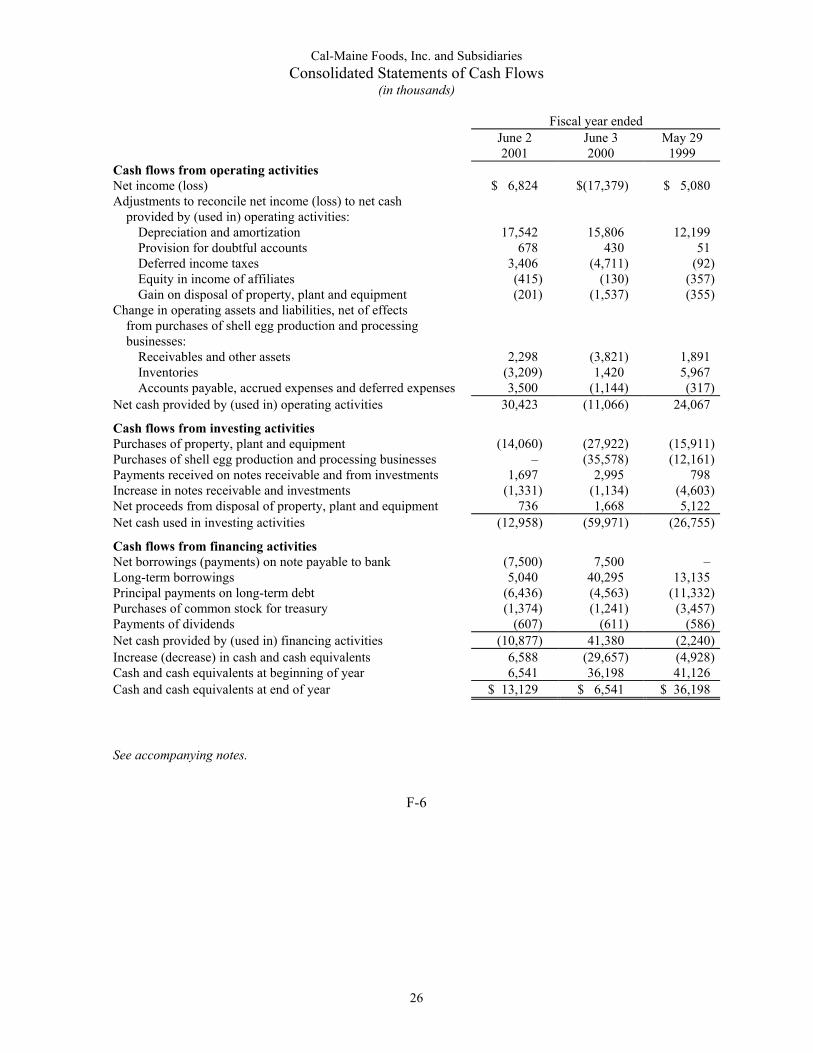
Cal-Maine Foods, Inc. and Subsidiaries Consolidated Statements of Cash Flows
(in thousands)
Fiscal year ended June 2 June 3 May 29 2001 2000 1999 Cash flows from operating activities Net income (loss) $ 6,824 $(17,379) $ 5,080 Adjustments to reconcile net income (loss) to net cash provided by (used in) operating activities: Depreciation and amortization 17,542 15,806 12,199 Provision for doubtful accounts 678 430 51 Deferred income taxes 3,406 (4,711) (92) Equity in income of affiliates (415) (130) (357) Gain on disposal of property, plant and equipment (201) (1,537) (355)Change in operating assets and liabilities, net of effects from purchases of shell egg production and processing businesses: Receivables and other assets 2,298 (3,821) 1,891 Inventories (3,209) 1,420 5,967 Accounts payable, accrued expenses and deferred expenses 3,500 (1,144) (317)Net cash provided by (used in) operating activities 30,423 (11,066) 24,067
Cash flows from investing activities Purchases of property, plant and equipment (14,060) (27,922) (15,911)Purchases of shell egg production and processing businesses – (35,578) (12,161)Payments received on notes receivable and from investments 1,697 2,995 798 Increase in notes receivable and investments (1,331) (1,134) (4,603)Net proceeds from disposal of property, plant and equipment 736 1,668 5,122 Net cash used in investing activities (12,958) (59,971) (26,755)
Cash flows from financing activities Net borrowings (payments) on note payable to bank (7,500) 7,500 – Long-term borrowings 5,040 40,295 13,135 Principal payments on long-term debt (6,436) (4,563) (11,332)Purchases of common stock for treasury (1,374) (1,241) (3,457)Payments of dividends (607) (611) (586)Net cash provided by (used in) financing activities (10,877) 41,380 (2,240)Increase (decrease) in cash and cash equivalents 6,588 (29,657) (4,928)Cash and cash equivalents at beginning of year 6,541 36,198 41,126 Cash and cash equivalents at end of year $ 13,129 $ 6,541 $ 36,198 See accompanying notes.
F-6

27
Cal-Maine Foods, Inc. and Subsidiaries
Notes to Consolidated Financial Statements (in thousands, except share and per share amounts)
June 2, 2001 1. Significant Accounting Policies Principles of Consolidation The consolidated financial statements include the accounts of Cal-Maine Foods, Inc. and its subsidiaries (the "Company") all of which are wholly-owned. All significant intercompany transactions and accounts have been eliminated in consolidation. Business The Company is engaged in the production, processing and distribution of shell eggs and livestock operations. The Company’s operations are significantly affected by the market price fluctuation of its principal products sold, shell eggs, and the costs of its principal feed ingredients, corn and other grains. Primarily all of the Company's sales are to wholesale egg buyers in the southeastern, southwestern, mid-western and mid-Atlantic regions of the United States. Credit is extended based upon an evaluation of each customer's financial condition and credit history and generally collateral is not required. Credit losses have consistently been within management's expectations. One customer accounted for 13.2% and 10.5% of the Company's net sales in fiscal 2001 and 2000, respectively. Use of Estimates The preparation of the consolidated financial statements in conformity with accounting principles general accepted in the United States requires management to make estimates and assumptions that affect the amount reported in the consolidated financial statements and accompanying notes. Actual results could differ from those estimates. Cash Equivalents The Company considers all highly liquid investments with a maturity of three months or less when purchased to be cash equivalents. Inventories Inventories of eggs, feed, supplies and livestock are valued principally at the lower of cost (first-in, first-out method) or market. The cost associated with flocks, consisting principally of chick purchases, feed, labor, contractor payments and overhead costs, are accumulated during a growing period of approximately 18 weeks. Flock costs are amortized over the productive lives of the flocks, generally one to two years.
F-7

28
Property, Plant and Equipment Property, plant and equipment are stated at cost. Depreciation is provided by the straight-line method over the estimated useful lives, which are 15 to 25 years for buildings and improvements and 3 to 12 years for machinery and equipment. Impairment of Long-Lived Assets The Company continually reevaluates the carrying value of its long-lived assets for events or changes in circumstances which indicate that the carrying value may not be recoverable. As part of this reevaluation, the Company estimates the future cash flows expected to result from the use of the asset and its eventual disposal. If the sum of the expected future cash flows (undiscounted and without interest charges) is less than the carrying amount of the asset, an impairment loss is recognized through a charge to operations. Intangible Assets Included in other assets are loan acquisition costs which are amortized over the life of the related loan and franchise fees which are amortized over ten years. Revenue Recognition and Delivery Costs Revenue is recognized when product is shipped to customers. Costs to deliver product to customers are included in selling, general and administrative expenses in the accompanying consolidated statements of operations and totaled $19,036, $17,823 and $14,531 in fiscal 2001, 2000 and 1999, respectively. Income Taxes Income taxes have been provided using the liability method. Deferred income taxes reflect the net tax effects of temporary differences between the carrying amounts of assets and liabilities for financial reporting purposes and the amounts used for income tax purposes. Stock Based Compensation The Company accounts for stock option grants in accordance with APB Opinion No. 25, “Accounting for Stock Issued to Employees". Net Income (Loss) per Common Share Basic earnings (loss) per share are based on the weighted average common shares outstanding. Diluted earnings (loss) per share include any dilutive effects of options and warrants. Impact of Recently Issued Accounting Standards In June 1998, the FASB issued Statement of Financial Accounting Standards No. 133, "Accounting for Derivative Instruments and Hedging Activities" (SFAS No. 133). The provisions of SFAS No. 133 and related amendments require all derivatives to be recorded on the balance sheet at fair value. SFAS No. 133 establishes "special accounting" for derivatives that are hedges. Derivatives that are not hedges must be adjusted to fair value through income. The effect of the adoption of this statement in the first quarter of fiscal 2002 will be insignificant to the consolidated earnings and financial position of the Company.
F-8

29
Fiscal Year The Company's fiscal year-end is on the Saturday nearest May 31, which was June 2, 2001 (52 weeks), June 3, 2000 (53 weeks) and May 29, 1999 (52 weeks), for the most recent three fiscal years. Reclassifications Certain reclassifications have been made in the fiscal 2000 consolidated financial statements to conform to classifications used in the current year.
2. Acquisitions In September 1999, the Company purchased substantially all of the assets and assumed certain liabilities of Smith Farms, Inc. and certain related companies ("Smith Farms") for cash of $36,205. The assets purchased were Smith Farms' egg production and processing businesses in Texas and Arkansas, and included approximately 3.9 million laying hens and growing pullets. The purchase price was allocated to the assets acquired and consisted primarily of accounts receivable, inventories and property, plant and equipment. In May 1999, the Company purchased all of the issued and outstanding common stock of a shell egg production and processing business for $12,161, net of cash acquired. The purchase price was reduced by $627 in fiscal 2000 based upon the final tax accounting of the company acquired for the period prior to the acquisition. The purchase price was allocated based upon the fair value of the assets acquired and liabilities assumed resulting in goodwill of $3,633, which is being amortized on the straight-line method over 15 years. These acquisitions were accounted for by the purchase method of accounting. The operating results of these businesses acquired are included in the consolidated statements of operations of the Company for the periods subsequent to the acquisition dates. 3. Investment in Affiliates The Company owns 50% of Cumberland Milling JV, Specialty Eggs LLC and Delta Egg Farm, LLC ("Delta Egg") and 41.5% of American Egg Products, Inc. at June 2, 2001. The Company owned 50% of BCM Egg Company ("BCM") a partnership, through May 2000, at which time the Company acquired the other 50% partnership interest. Investment in affiliates, recorded using the equity method of accounting, totaled $6,364 and $5,449 at June 2, 2001 and June 3, 2000, respectively. Equity in earnings of $415, $130 and $357, from these entities have been included in the consolidated statements of operations for fiscal 2001, 2000 and 1999, respectively. The Company purchased $2,589 and $4,863 of eggs from BCM during the fiscal years ended June 3, 2000 and May 29, 1999, which represented a significant percentage of BCM's sales. The Company is a guarantor of 50% of Delta Egg's long-term debt, which totaled approximately $17 million at June 2, 2001. Delta Egg's long-term debt is secured by substantially all assets of Delta Egg and is due in monthly installments through fiscal 2009. Delta Egg is engaged in the production, processing and distribution of shell eggs.
F-9

30
4. Inventories Inventories consisted of the following: June 2 June 3 2001 2000
Flocks $ 31,920 $ 28,417 Eggs 3,149 2,417 Feed and supplies 9,459 10,028 Livestock 2,594 3,051
$ 47,122 $ 43,913 5. Property, Plant and Equipment Property, plant and equipment consisted of the following: June 2 June 3 2001 2000
Land and improvements $ 32,133 $ 31,074 Buildings and improvements 87,300 81,989 Machinery and equipment 122,949 114,408 Construction-in-progress 5,915 9,627 248,297 237,098 Less accumulated depreciation 103,649 88,961 $144,648 $148,137
Depreciation expense was $17,014, $15,349 and $11,958 in fiscal 2001, 2000 and 1999, respectively. 6. Leases Future minimum payments under noncancelable operating leases that have initial or remaining noncancelable terms in excess of one year at June 2, 2001 are as follows:
2002 $ 8,371 2003 7,926 2004 7,510 2005 6,880 2006 6,237 Thereafter 8,926 Total minimum lease payments $ 45,850
Substantially all of the leases provide that the Company pay taxes, maintenance, insurance and certain other operating expenses applicable to the leased assets. The Company has guaranteed under certain operating leases the residual value of transportation equipment at the expiration of the leases. Rent expense was $9,622, $7,044 and $3,824 in fiscal 2001, 2000 and 1999, respectively. Included in rent expense are vehicle rents totaling $2,892, $2,729 and $1,777 in fiscal 2001, 2000 and 1999, respectively.
F-10

31
7. Credit Facilities and Long-Term Debt Long-term debt consisted of the following: June 2 June 3 2001 2000 Note payable at 6.7%; due in monthly installments of $100, plus interest, maturing in 2009 $ 15,600 $ 16,800 Note payable at a variable rate of 5.81% at June 2, 2001; due in quarterly installments of $350, plus interest, maturing in 2007 12,250 13,650 Note payable at 8.26%; due in monthly installments of $155 beginning in 2004, including interest, maturing in 2015 16,000 16,000 Series A Senior Secured Notes at 6.87%; due in annual principal installments of $1,917 beginning in December 2002 through 2009 with interest due semi-annually 11,500 11,500 Series B Senior Secured Notes at 7.18%; due in annual principal installments of $2,143 beginning in December 2003 through 2009 with interest due semi-annually 15,000 15,000 Industrial revenue bonds at 7.21%; due in monthly installments of $120, including interest, maturing in 2011 12,116 12,656 Note payable at 7.64%; due in monthly installments of $114, including interest, maturing in 2004 7,833 8,578 Note payable at 7.75%; due in monthly installments of $55, plus interest, maturing in 2004 5,120 6,070 Note payable at 8.25%; due in monthly installments of $79, including interest, maturing in 2004 2,371 3,086 Note payable at 7.56%; due in monthly installments of $75 beginning in July 2001, plus interest, maturing in 2009 13,400 8,550 Note payable at 7%; due in quarterly installments of $107, plus interest, maturing in 2009 5,572 6,000 Other 1,578 1,846 118,340 119,736 Less current maturities 7,184 7,105 $111,156 $112,631
F-11

32
The aggregate annual fiscal year maturities of long-term debt at June 2, 2001 are as follows:
2002 $ 7,184 2003 9,543 2004 20,299 2005 9,942 2006 9,986 Thereafter 61,386
$118,340 The Company has a $35,000 line of credit with three banks of none of which was outstanding at June 2, 2001. The line of credit, which expires on December 31, 2002 is limited in availability based upon accounts receivable and inventories. The Company had $33,400 available to borrow under the line of credit at June 2, 2001. Borrowings under the line of credit bear interest at 1.5% above the federal funds rate or 1.5% above LIBOR, at the Company's option. Facilities fees of 0.25% per annum are payable quarterly on the unused portion of the line. Substantially all trade receivables and inventories collateralize the line of credit and property, plant and equipment collateralize the long-term debt. The Company is required, by certain provisions of the loan agreements, to maintain minimum levels of working capital and net worth; to limit dividends, capital expenditures and additional long-term borrowings; and to maintain various current, debt-to-equity and interest coverage ratios. Additionally, the chief executive officer of the Company, or his family, must maintain ownership of not less than 50% of the outstanding voting stock of the Company. At June 2, 2001 the Company was in violation of a financial covenant requirement of certain of its long-term debt agreements that is based upon the Company’s most recent three-year average earnings. The Company obtained a waiver of this requirement through June 2, 2002. Interest of $8,966, $8,770 and $6,061 was paid during fiscal 2001, 2000 and 1999, respectively. Interest of $347, $372 and $450 was capitalized for construction of certain facilities during fiscal 2001, 2000 and 1999, respectively. 8. Employee Benefit Plans The Company maintains a medical plan that is qualified under Section 401(a) of the Internal Revenue Code and not subject to tax under present income tax laws. Under its plan, the Company self-insures, in part, coverage for substantially all full-time employees with coverage by insurance carriers for certain stop-loss provisions for losses greater than $60 for each occurrence. The Company's expenses, including accruals for incurred but not reported claims, were approximately $4,570, $3,688 and $3,702 in fiscal 2001, 2000, and 1999, respectively. The Company has a 401(k) plan which covers substantially all employees. Participants in the Plan may contribute up to the maximum allowed by Internal Revenue Service regulations. The Company does not make contributions to the 401(k)plan. The Company has an employee stock ownership plan (ESOP) that covers substantially all employees. The Company makes contributions to the ESOP of 3% of participants' compensation, plus an additional amount determined at the discretion of the Board of Directors. Contributions may be made in cash or the Company's common stock. The contributions vest 20% annually beginning with the participant's third year of service. Beginning in January 2001, company contributions to the ESOP vest immediately. The Company's contributions to the plan were $968, $1,335 and $970 in fiscal 2001, 2000 and 1999, respectively.
F-12

33
The Company has deferred compensation agreements with certain officers for payments to be made over specified periods beginning when the officers reach age 65 or over as specified in the agreements. Amounts accrued for these agreements are based upon deferred compensation earned, discounted over the estimated remaining service life of each officer. Deferred compensation expense totaled $50 in fiscal 2001, 2000 and 1999. 9. Stock Option Plan The Company has elected to follow APB No. 25 and related Interpretations in accounting for its employee stock options because, as discussed below, the alternative fair value accounting provided for under FASB Statement No. 123, Accounting for Stock-Based Compensation, requires use of option valuation models that were not developed for use in valuing employee stock options. Pro forma information regarding net income and net income per share is required by FASB Statement No. 123, and has been determined as if the Company had accounted for its employee stock options under the fair value method of that Statement. The fair value for these options was estimated at the date of grant using a Black-Scholes option pricing model with the following weighted-average assumptions for fiscal 2001 and 2000: risk-free interest rate of 7%; dividend yield of 1%; volatility factor of the expected market price of the Company’s common stock of .29, and a weighted-average expected life of the options of 5 years.
The weighted-average fair value of options granted during fiscal 2001 and 2000 was $1.05. No options were granted in fiscal 1999. The pro forma effect of the estimated fair value of the options granted in fiscal 2001 and 2000 was insignificant to the consolidated net income (loss) and net income (loss) per share of the Company. A summary of the Company’s stock option activity and related information is as follows:
Shares
Weighted-Average
Exercise Price Outstanding May 31, 1998 505,000 $3.46
Terminated (471,000) 3.42 Outstanding at May 29, 1999 34,000 4.06
Granted 500,000 3.00 Terminated (10,000) 3.42 Forfeited (10,000) 3.00
Outstanding at June 3, 2000 514,000 3.06 Granted 15,000 4.19 Exercised (26,000) 3.00 Forfeited (10,000) 3.00
Outstanding at June 2, 2001 493,000 3.10 The Company has reserved 800,000 shares under its 1993 Stock Option Plan. The options have ten-year terms and vest annually over five years beginning one year from the grant date. At June 2, 2001, 272,000 shares were available for grant under the 1993 plan. The Company has reserved 500,000 shares under its 1999 Stock Option Plan, all of which were granted to officers and key employees in fiscal 2000. Each stock option granted under the 1999 Stock Option Plan was accompanied by the grant of a Tandem Stock Appreciation Right ("TSAR"). The options and TSARs have ten-year terms and vest annually over five years beginning one year from the grant date. Upon exercise of a TSAR, the related option is terminated and the holder will receive a cash payment from the Company equal to the excess of the fair market value of the Company's common stock and the option exercise price. Compensation expense of $380 and $95 applicable to the TSARs was recognized in fiscal 2001 and 2000, respectively.
F-13
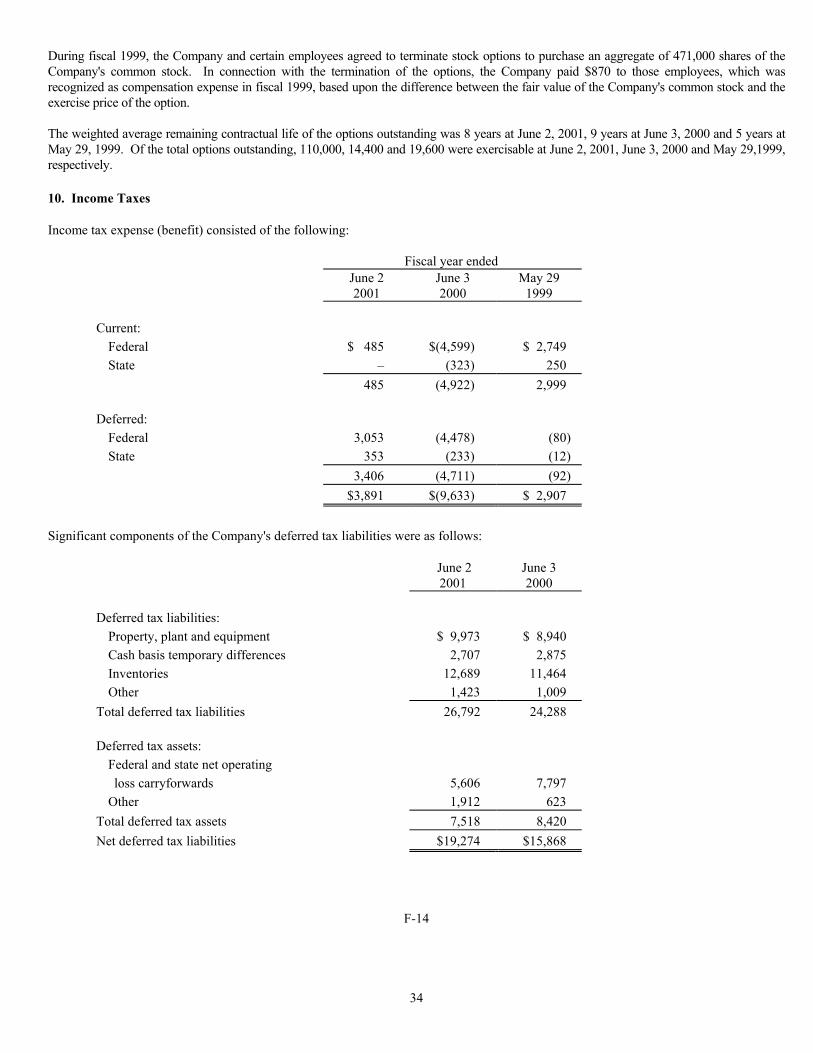
34
During fiscal 1999, the Company and certain employees agreed to terminate stock options to purchase an aggregate of 471,000 shares of the Company's common stock. In connection with the termination of the options, the Company paid $870 to those employees, which was recognized as compensation expense in fiscal 1999, based upon the difference between the fair value of the Company's common stock and the exercise price of the option. The weighted average remaining contractual life of the options outstanding was 8 years at June 2, 2001, 9 years at June 3, 2000 and 5 years at May 29, 1999. Of the total options outstanding, 110,000, 14,400 and 19,600 were exercisable at June 2, 2001, June 3, 2000 and May 29,1999, respectively. 10. Income Taxes Income tax expense (benefit) consisted of the following:
Fiscal year ended June 2 June 3 May 29 2001 2000 1999 Current: Federal $ 485 $(4,599) $ 2,749 State – (323) 250 485 (4,922) 2,999 Deferred: Federal 3,053 (4,478) (80) State 353 (233) (12) 3,406 (4,711) (92) $3,891 $(9,633) $ 2,907
Significant components of the Company's deferred tax liabilities were as follows:
June 2 June 3 2001 2000 Deferred tax liabilities: Property, plant and equipment $ 9,973 $ 8,940 Cash basis temporary differences 2,707 2,875 Inventories 12,689 11,464 Other 1,423 1,009 Total deferred tax liabilities 26,792 24,288 Deferred tax assets: Federal and state net operating loss carryforwards 5,606 7,797 Other 1,912 623 Total deferred tax assets 7,518 8,420 Net deferred tax liabilities $19,274 $15,868
F-14

35
Effective May 29, 1988, the Company could no longer use cash basis accounting for its farming subsidiary because of tax law changes. The Taxpayer Relief Act of 1997 provides that taxes on the cash basis temporary differences as of that date are generally payable over 20 years beginning in fiscal 1999 or in full in the first fiscal year in which there is a change in ownership control. The Company uses the farm-price method for valuing inventories for income tax purposes. The differences between income tax expense (benefit) at the Company's effective income tax rate and income tax expense (benefit) at the statutory federal income tax rate were as follows:
Fiscal year ended June 2 June 3 May 29 2001 2000 1999 Statutory federal income tax (benefit) $3,643 $(9,184) $2,715 State income taxes (benefit), net 233 (367) 156 Other, net (benefit) 15 (82) 36 $3,891 $(9,633) $2,907
Federal and state income taxes of $219, $1,342 and $1,524 were paid in fiscal 2001, 2000 and 1999, respectively. Federal and state income taxes of $4,409, $271 and $237 were refunded in fiscal 2001, 2000 and 1999, respectively. The Company had net operating loss carryforwards of $15,500 at June 2, 2001, which expire in fiscal 2020. 11. Other Matters The carrying amounts in the consolidated balance sheet for cash and cash equivalents, accounts receivable, notes receivable and investments, accounts payable and long-term debt approximate their fair values. The fair values for notes receivable and long-term debt are estimated using discounted cash flow analysis, based on the Company's current incremental borrowing rates for similar arrangements.
The Company’s interest expense is sensitive to changes in the general level of U.S. interest rates. The Company maintains certain of its debt as fixed rate in nature to mitigate the impact of fluctuations in interest rates. Under its current policies, the Company does not use interest rate derivative instruments to manage its exposure to interest rate changes. A one percent (1%) adverse move (decrease) in interest rates would adversely affect the net fair value of the Company’s debt by $5.1 million at June 2, 2001. The Company is a party to no other market risk sensitive instruments requiring disclosure. The Company issued warrants in fiscal 1997 to purchase 220,000 shares of its common stock to the underwriter of the initial public offering of the Company's common stock. The warrants are exercisable at $8.40 per share through December 2001. The Company is the defendant in certain legal actions. It is the opinion of management, based on advice of legal counsel, that the outcome of these actions will not have a material adverse effect on the Company's consolidated financial position or operations.
F-15

36
SCHEDULE II - VALUATION AND QUALIFYING ACCOUNTS Years ended June 2, 2001, June 3, 2000 and May 29, 1999 (in thousands) Balance at Charged to Write-off Balance at Beginning of Cost and of End of Description Period Expense Accounts Period Year ended June 2, 2001: Allowance for doubtful accounts $305 $678 $393 $590 Year ended June 3, 2000: Allowance for doubtful accounts $52 $430 $177 $305 Year ended May 29, 1999: Allowance for doubtful accounts $361 $51 $360 $52 S-1

37
CAL-MAINE FOODS, INC. Form 10-K for the fiscal year
Ended June 2, 2001 EXHIBIT INDEX
Exhibit Number Exhibit 21 Subsidiaries of Cal-Maine Foods, Inc 23 Consent of Independent Auditors

38
Exhibit 21
Percentage of Outstanding Stock
Place of Incorporation or Ownership Interest Held
Name of Subsidiary or Organization by Registrant
--------------------- ------------------------ ----------------------------------
Cal-Maine Farms, Inc. Delaware 100%
Southern Equipment Distributors, Inc. Mississippi 100%
South Texas Applicators, Inc. Delaware 100%
Cal-Maine Partnership, Ltd. Texas (1)
CMF of Kansas, LLC Delaware (2)
-------------------------------------------------
(1) Limited partnership in which Cal-Maine Foods, Inc. has a 1% General Partner interest and Cal-Maine Farms, Inc. has
a 99% Limited Partner interest.
(2) Limited liability company of which Cal-Maine Foods, Inc. and Cal-Maine Farms, Inc. are members and have 99% and 1% interests, respectively.

39
Exhibit 23
Consent of Independent Auditors
We consent to the incorporation by reference in the Registration Statements (Form S-8 No. 333-20169) pertaining to the Cal-Maine Foods, Inc. 1993 Stock Option Plan, (Form S-8 No. 333-29940) pertaining to the Cal-Maine Foods, Inc. 1999 Stock Option Plan on Form S-3 (No. 333-14809) and related Prospectus pertaining to shares underlying common stock purchase warrants of Cal-Maine Foods, Inc., of our report dated July 12, 2001, with respect to the consolidated financial statements and schedule of Cal-Maine Foods, Inc. included in this Annual Report (Form10-K) for the year ended June 2, 2001. /s/ ERNST & YOUNG LLP Jackson, Mississippi August 13, 2001

Corporate OfficesCal-Maine Foods, Inc.3320 Woodrow Wilson DrivePost Office Box 2960Jackson, Mississippi 39207(601) 948-6813calmainefoods.com
Transfer AgentSunTrust Bank,AtlantaCorporate Trust Department58 Edgewood Avenue, Room 225 AnnexAtlanta, Georgia 30303(404) 588-7817
Independent AuditorsErnst & Young LLPOne Jackson Place, Suite 400188 East Capitol StreetJackson, Mississippi 39201
Annual Meeting2:00 p.m.December 11, 2001Cal-Maine Corporate Offices3320 Woodrow Wilson DriveJackson, Mississippi
Form 10-KThe Form 10-K, including the
financial statements and schedulesthereto, for the year ended June 2, 2001,as well as other information about Cal-Maine Foods, Inc. may be obtainedwithout charge by writing to Ms.Delores McMillin, Investor Relations,at the Company’s corporate offices.
Stock Price InformationThe Company’s common stock trades on
the Nasdaq National Market under the symbolCALM. The number of stockholders, includingbeneficial owners holding shares in nomineeor “street” name, as of June 2, 2001, wasapproximately 1,000.
The following table shows quarterly highand low prices for the common stock for thepast two fiscal years. National Market Systemquotations are based on actual sales prices.
Stock PriceFiscal Year 2001 High Low
First Quarter $ 4.38 $ 3.25Second Quarter $ 4.31 $ 3.13Third Quarter $ 6.63 $ 4.00Fourth Quarter $ 5.38 $ 4.41
Stock PriceFiscal Year 2000 High Low
First Quarter $ 5.50 $ 4.38Second Quarter $ 4.88 $ 3.34Third Quarter $ 4.38 $ 2.50Fourth Quarter $ 4.09 $ 3.25
Corporate Information
ArkansasHopeLincolnSearcy
GeorgiaGainesvilleHartwellShady Dale
KansasChase
KentuckyBremenGuthrie
LouisianaHammondPine Grove
MississippiEdwardsJackson (Corporate Offices)Mendenhall
New MexicoAlbuquerque
North CarolinaGreenvilleLouisburg
OhioRossburgUnion City
OklahomaWestville
South CarolinaBethune
TennesseeClarksville
TexasFlatoniaHarwoodIdalouWaelder
UtahDelta
Color indicatesCal-Maine’s majormarket areas.
Cal-Maine Foods, Inc. is engaged in the production, cleaning, grading, packing and sale of fresh shell eggs. The Company is the nation’s largest producer and distributor of fresh shell eggs,with fiscal 2001 sales of 545 million dozen shell eggs, representing approximately 13% of all shelleggs sold in the United States. Cal-Maine primarily markets its shell eggs in 26 states, chiefly inthe southwestern, southeastern, mid-western and mid-Atlantic regions of the United States.
The common shares of Cal-Maine Foods, Inc. are traded on the Nasdaq National Marketunder the symbol CALM.
Cal-Maine Foods, Inc.
Cal-Maine Locations

2 1Cal-Maine Foods, Inc.
Annual Reportto Shareholders
Cal-Maine Foods, Inc.
3320 Woodrow Wilson Drive
Post Office Box 2960
Jackson, Mississippi 39207
(601) 948-6813


