Page 1
Calcium Carbonate Formation in Water Distribution Systems and Autogenous Repair of Leaks
by Inert Particle Clogging
Colin Scott Richards
Thesis submitted to the faculty of the Virginia Polytechnic Institute and State University in
partial fulfillment of the requirements for the degree of
Master of Science
In
Civil and Environmental Engineering
Marc A. Edwards, Chair
Sunil K. Sinha
Fei Wang
May 2nd, 2016
Blacksburg, VA
Keywords: Calcium carbonate, distribution system, precipitation, particle clogging, autogenous
repair
Page 2
Calcium Carbonate Formation in Water Distribution Systems and Autogenous Repair of Leaks
by Inert Particle Clogging
Colin Scott Richards
Abstract (academic)
The formation of calcium carbonate (CaCO3) (i.e. scale) in potable water systems has long been a
concern in water treatment and distribution. A literature review reveals that CaCO3 scaling issues
are re-emerging due to climate change, temperature increases in hot water systems and lower use
of scaling and corrosion inhibitors. Moreover, we have gathered insights that suggest CaCO3
coatings can be beneficial and stop pipeline leaks via self-repair or clogging. Ironically, the actions
we are taking to increase the lifespan of distribution systems (i.e. adding corrosion inhibitors)
might have worsened leaks and pipe lifespans due to interference with self-repair. The increasing
occurrence of scaling coupled with gaps in knowledge over CaCO3 formation in water systems
make revisiting this topic timely.
The concept of autogenous repair by clogging with inert particles was examined using silica and
alumina. Small 250 µm diameter pinhole leaks were simulated in bench-scale water recirculation
systems. Silica and alumina particles were added to solutions ranging from high to low ionic
strength to determine the impact of water quality on leak repair. Size distribution and zeta potential
of the particles were measured. Silica particles were practically unchanged by the different solution
chemistries while the size and zeta potential of alumina particles varied. The rate of clogging with
silica particles was not impacted by water chemistry. Alumina particles with a positive charge
clogged 100% of the leaks while negatively charged alumina could not clog 100%. Very small
alumina particles (4.1 µm) stayed suspended but were unable to clog leaks.
Page 3
Abstract (public)
Formation of calcium carbonate (CaCO3) scale within water distribution and plumbing systems
can cause major problems such as increased head loss and decreased energy efficiency in water
heating systems. CaCO3 scale formation in potable water was once believed to be fully understood
in water treatment and distribution, however there are several emerging trends that are causing the
problematic formation to re-emerge, such as climate change, temperature increases in hot water
systems, and lower usage of corrosion inhibitors. CaCO3 can also play a beneficial role in repairing
leaks that form in pipelines by either depositing directly over the leak or by clogging the leak as a
particle. Actions taken to lengthen the lifespan of water pipelines, such as adding corrosion and
scaling inhibitors, may be having the opposite effect by preventing leak repair via CaCO3.
The concept of leak repair by particle clogging was tested with alumina (Al2O3) and silica (SiO2)
particles approximately 10-100 µm in diameter. Circular leaks 250 µm in diameter were simulated
using glass capillary tubing in water-recirculating systems. The particles were suspended in
recirculating water and passed through the leaks. Water quality parameters such as pH and ionic
strength were adjusted to assess the impact of water quality on repair rate; the SiO2 particle
characteristics were practically unchanged while Al2O3 characteristics varied. Al2O3 in lower pH
solutions had significantly higher repair rates than Al2O3 in higher pH solutions. Very small Al2O3
particles (1.4 µm) were not able to clog leaks over a long period of time.
Page 4
iv
Acknowledgements
First, I am very grateful of my advisor Dr. Marc Edwards for his support, patience, and mentorship
during my three years of graduate study. His incorruptible selflessness in sticking up for the public
is something that will stay with me throughout my career as an engineer, and has made working
with him a truly rewarding experience.
I would also like to thank my research colleagues Dr. Fei Wang and Min Tang, as well as the rest
of the Edwards group, for helping me out with this project and giving me criticism when it was
necessary. Thanks also to Dr. Sunil Sinha for his time serving on my committee. Dr. William
Becker also deserves recognition for his support in writing and presenting the literature review.
Funding was provided by the NSF under grant CBET-1336616. My graduate studies were also
partially supported by the Via Fellowship.
Page 5
v
Attributions
Dr. Fei Wang - Post-doctoral researcher, Department of Civil and Environmental Engineering,
Virginia Tech. Contributed section “1.5 Control and prevention of calcium carbonate scaling” to
the literature review chapter, was involved in the organization and editing of Chapters 1 and 2, and
helped in the creation of the tables and figures.
Dr. William Becker - Vice President of Water Process Research and Technology, Hazen and
Sawyer. Provided results of autogenous repair pilot study on the Delaware Aqueduct, edited
Chapter 1, and assisted in drawing of Figure 1-1.
Dr. Marc Edwards - Professor, Department of Civil and Environmental Engineering, Virginia
Tech. Provided funding and guidance on research detailed in Chapter 2. Major contribution to the
writing of Chapters 1 and 2.
Min Tang - Ph.D. candidate, Department of Civil and Environmental Engineering, Virginia Tech.
Water recirculation systems described and Chapter 2 were influenced by the recirculating systems
used in her research. Authored a literature review on autogenous repair of leaks that lead to this
project.
Page 6
vi
Table of Contents
Abstract (academic) ................................................................................................................... ii
Abstract (public) ....................................................................................................................... iii
Acknowledgements ................................................................................................................... iv
Attributions .................................................................................................................................v
Table of Contents ...................................................................................................................... vi
List of Figures ......................................................................................................................... viii
List of Tables ..............................................................................................................................x
Chapter 1: Literature Review - A 21st Century Perspective on Calcium Carbonate Formation in
Potable Water Systems ................................................................................................................1
1.1 Introduction .......................................................................................................................1
1.1.1 Scaling ........................................................................................................................3
1.1.2 Autogenous Repair .....................................................................................................3
1.2 Recent Trends Affecting CaCO3 Formation .......................................................................4
1.3 Chemistry of CaCO3 Formation ....................................................................................... 11
1.3.1 Background .............................................................................................................. 11
1.3.2 Precipitation and Growth in Plumbing and Distribution Systems ............................... 13
1.3.3 Morphology and Polymorph Stability ....................................................................... 17
1.4 Monitoring CaCO3 Formation in Potable Water Systems ................................................. 18
1.4.1 Tests and Indices for Scale Formation ....................................................................... 18
1.4.2 In-Situ Monitoring of Scale ....................................................................................... 21
1.5 Control and prevention of calcium carbonate scaling ....................................................... 21
1.5.1 Controlling CaCO3 precipitation through water chemistry parameters ....................... 22
1.5.2 Other methods that might be effective in controlling CaCO3 scaling ......................... 25
1.5.3 Delay or prevent CaCO3 precipitation using scale inhibitors ..................................... 26
1.5.4 Potential beneficial application of CaCO3 precipitation for autogenous repair ........... 28
1.5.5 Combating scaling by homeowners ........................................................................... 29
1.6 Knowledge Gaps ............................................................................................................. 31
1.7 References ....................................................................................................................... 32
Page 7
vii
Chapter 2: Autogenous Leak Repair via Inert Particle Clogging ................................................ 43
2.1 Introduction ..................................................................................................................... 43
2.2 Materials and Methods .................................................................................................... 46
2.3 Results and Discussion .................................................................................................... 50
2.4 Conclusions ..................................................................................................................... 57
2.5 Limitations and Future Research ..................................................................................... 58
2.6 References ....................................................................................................................... 59
Appendix: Supporting Tables and Figures ................................................................................. 62
Page 8
viii
List of Figures
Figure 1-1 Overview of CaCO3 from source to tap ......................................................................2
Figure 1-2 Impact of rising atmospheric CO2 levels on CaCO3 formation ....................................8
Figure 1-3 Impact of increasing temperature on CaCO3 formation ............................................. 12
Figure 1-4 Scaling potential in potable water systems throughout the U.S. ................................ 24
Figure 1-5 Autogenous repair of leaks by CaCO3 precipitation in drinking water pipelines........ 29
Figure 2-1 Overview of factors important to particle transport and leak clogging in pipes ......... 45
Figure 2-2 Recirculation system setup ....................................................................................... 49
Figure 2-3 Critical settling velocity model ................................................................................. 52
Figure 2-4 Alumina turbidity measurements .............................................................................. 55
Figure 2-5 Particle size distributions of alumina particles .......................................................... 55
Figure 2-6 Unsettled alumina turbidity over 24 hours ................................................................ 56
Figure 2-7: Microscope images of clogged capillaries ............................................................... 57
Figure A-1: Leak clogging and turbidity results for Min-U-Sil 40 in pH 7 buffer....................... 62
Figure A-2: Leak clogging and turbidity results for Min-U-Sil 40 in pH 8 buffer....................... 62
Figure A-3: Leak clogging and turbidity results for Min-U-Sil 40 in pH 9.6 buffer .................... 63
Figure A-4: Leak clogging and turbidity results for Min-U-Sil 40 in pH 10 buffer ..................... 63
Figure A-5: Leak clogging and turbidity results for Min-U-Sil 40 in 3 mM NaCl solution ......... 64
Figure A-6: Leak clogging and turbidity results for Min-U-Sil 40 in 1 mM Na2CO3 solution .... 64
Figure A-7: Leak clogging and turbidity results for Min-U-Sil 40 in 0.1 mM NaHCO3 solution 65
Figure A-8: Leak clogging and turbidity results for Min-U-Sil 40 in 1 mM NaHCO3 solution ... 65
Figure A-9: Leak clogging and turbidity results for Sil-Co-Sil 75 in pH 7 buffer solution .......... 66
Figure A-10: Leak clogging and turbidity results for Sil-Co-Sil 75 in pH 8 buffer solution ........ 66
Figure A-11: Leak clogging and turbidity results for Sil-Co-Sil 75 in pH 9.6 buffer solution ..... 67
Figure A-12: Leak clogging and turbidity results for Sil-Co-Sil 75 in pH 10 buffer solution ...... 67
Figure A-13: Leak clogging and turbidity results for alumina in 3 mM NaCl solution ............... 68
Figure A-14: Leak clogging and turbidity results for alumina in 1 mM Na2CO3 solution ........... 68
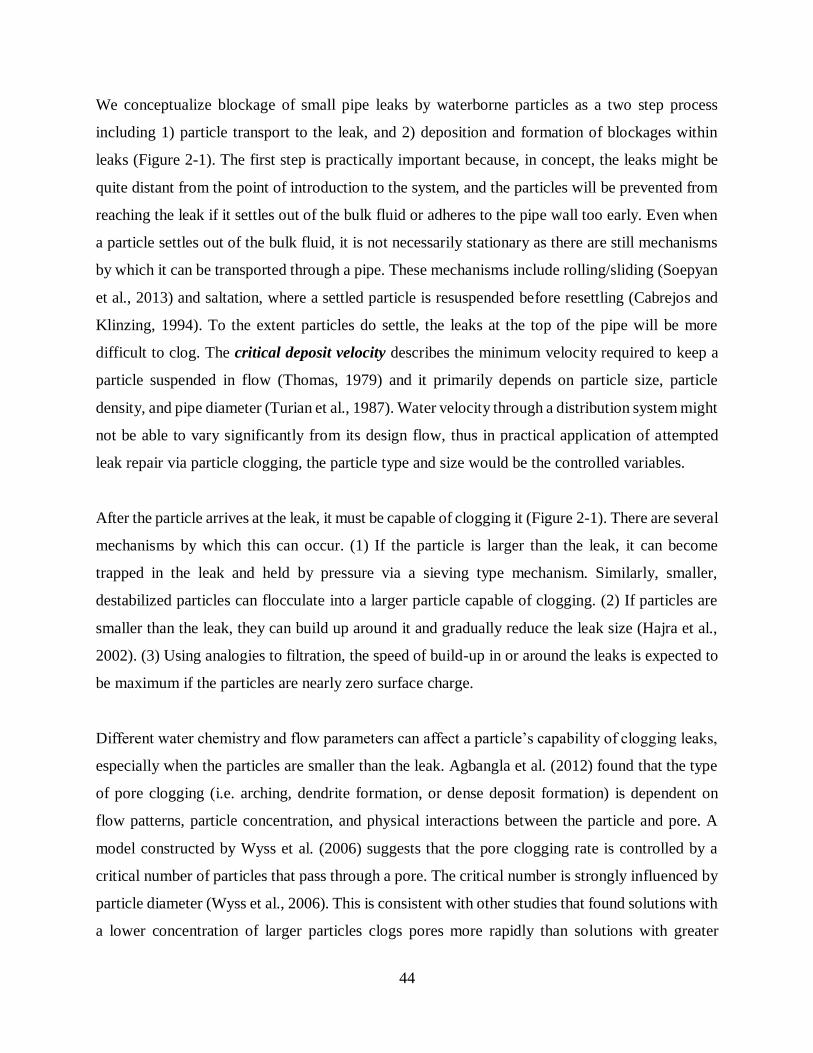
Figure A-15: Leak clogging and turbidity results for alumina in 0.1 mM NaHCO3 solution ....... 69
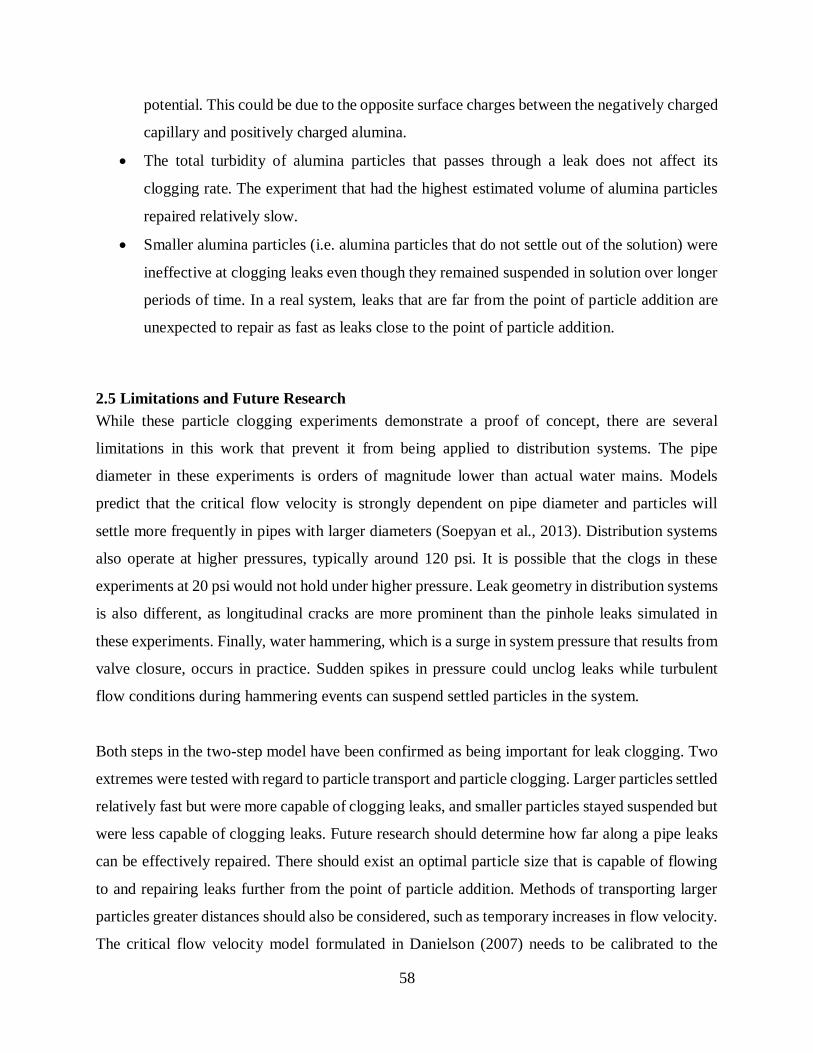
Figure A-16: Leak clogging and turbidity results for alumina in 1 mM NaHCO3 solution.......... 69
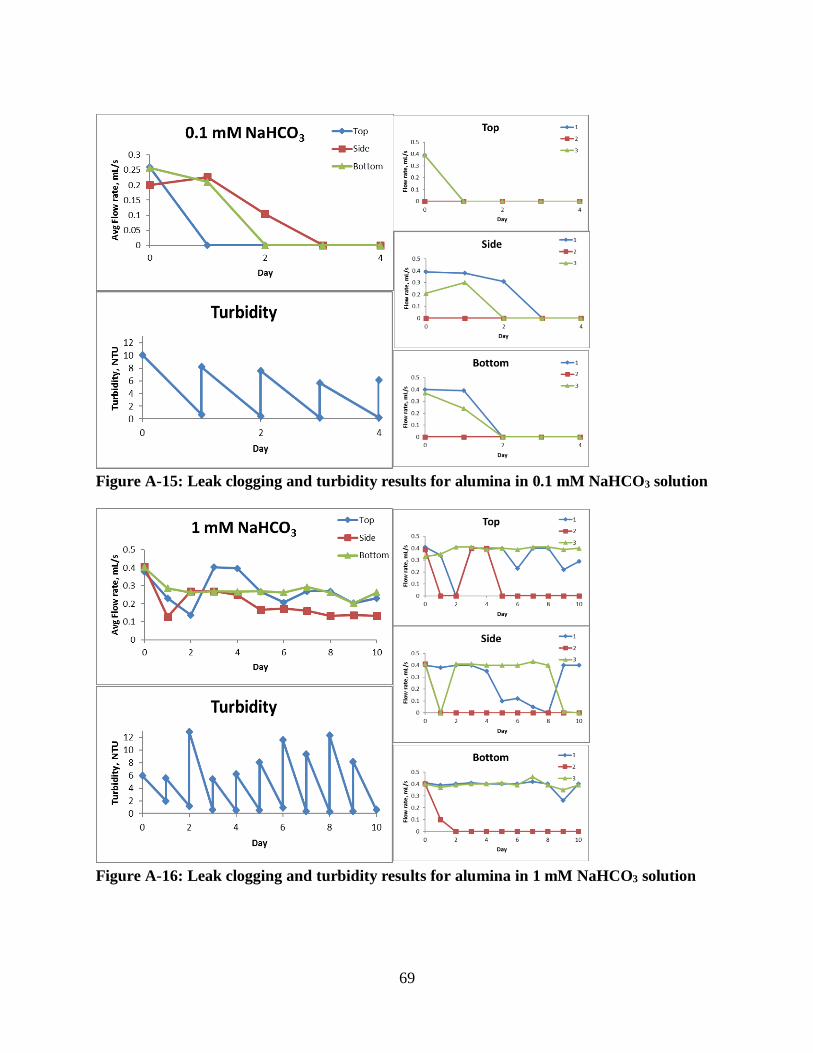
Figure A-17: Leak clogging and turbidity results for unsettled alumina in 1 mM Na2CO3 solution
................................................................................................................................................. 70
Page 9
ix
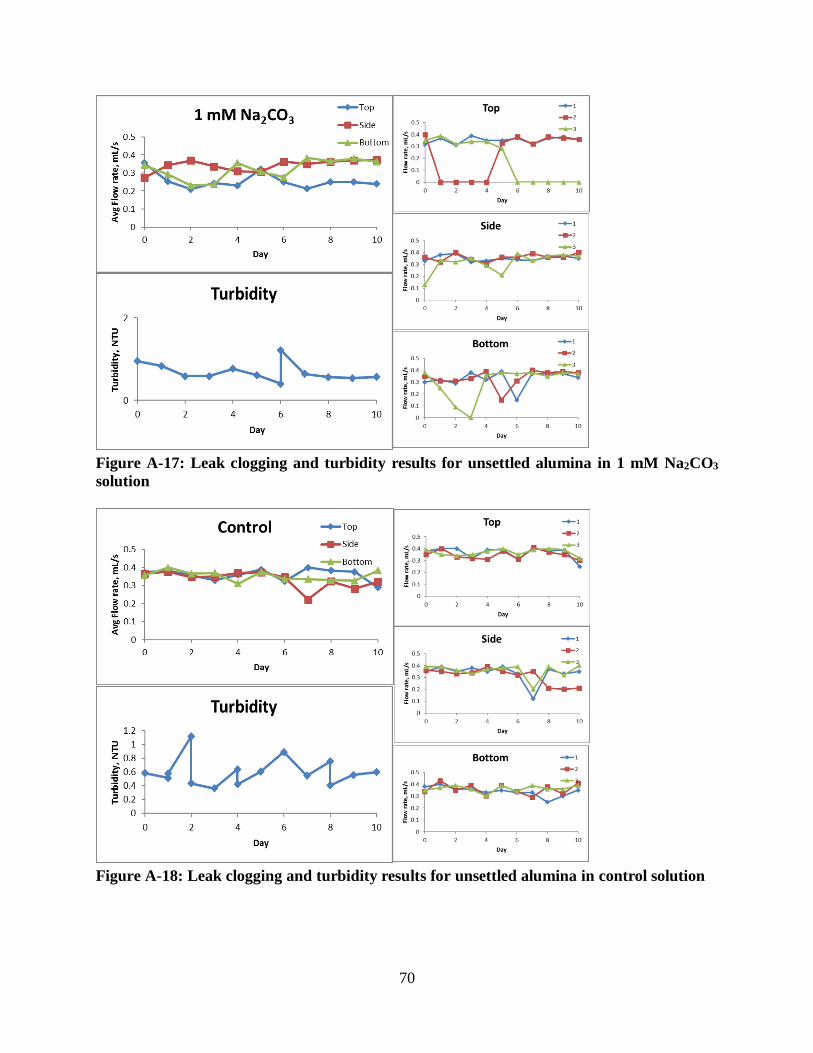
Figure A-18: Leak clogging and turbidity results for unsettled alumina in control solution ........ 70
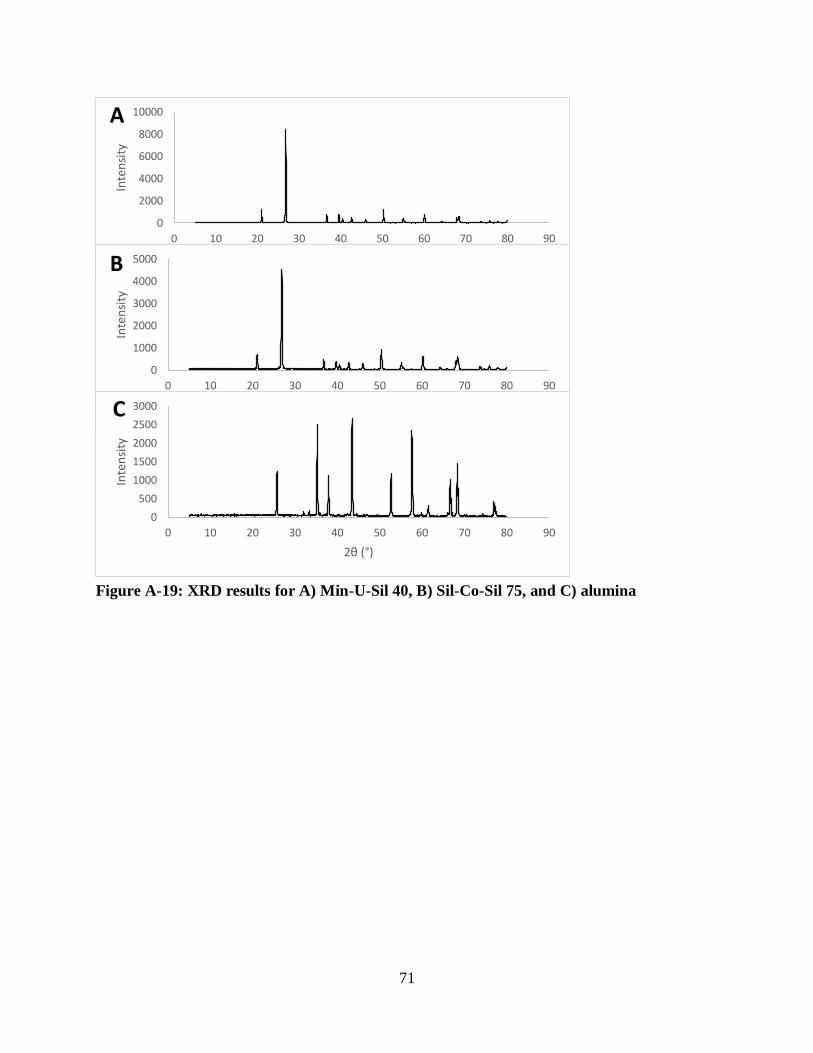
Figure A-19: XRD results for A) Min-U-Sil 40, B) Sil-Co-Sil 75, and C) alumina .................... 71
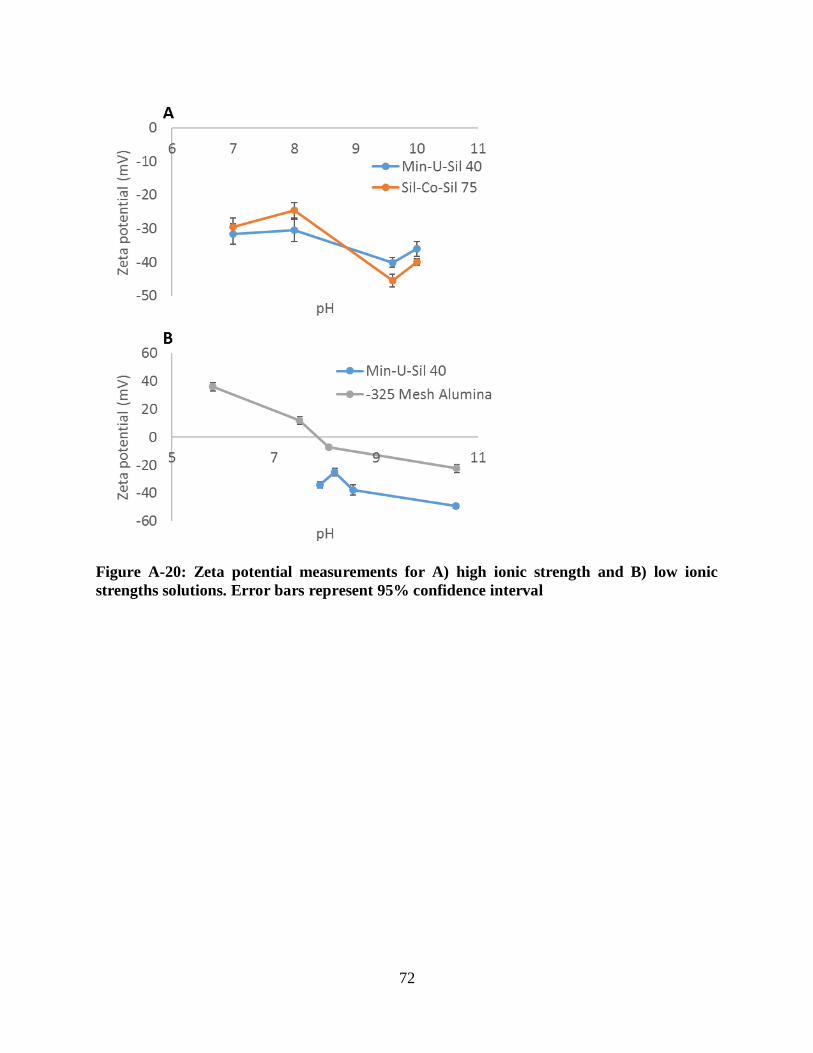
Figure A-20: Zeta potential measurements for A) high ionic strength and B) low ionic strengths
solutions. Error bars represent 95% confidence interval............................................................. 72
Figure A-21: Min-U-Sil 40 particle size distribution in pH 7 buffer solution ............................. 73
Figure A-22: Min-U-Sil 40 particle size distribution in pH 8 buffer solution ............................. 73
Figure A-23: Min-U-Sil 40 particle size distribution in pH 9.6 buffer solution .......................... 73
Figure A-24: Min-U-Sil 40 particle size distribution in pH 10 buffer solution ........................... 74
Figure A-25: Min-U-Sil 40 particle size distribution in low ionic strength solutions .................. 74
Figure A-26: Sil-Co-Sil 75 particle size distribution in pH 7 buffer solution .............................. 74
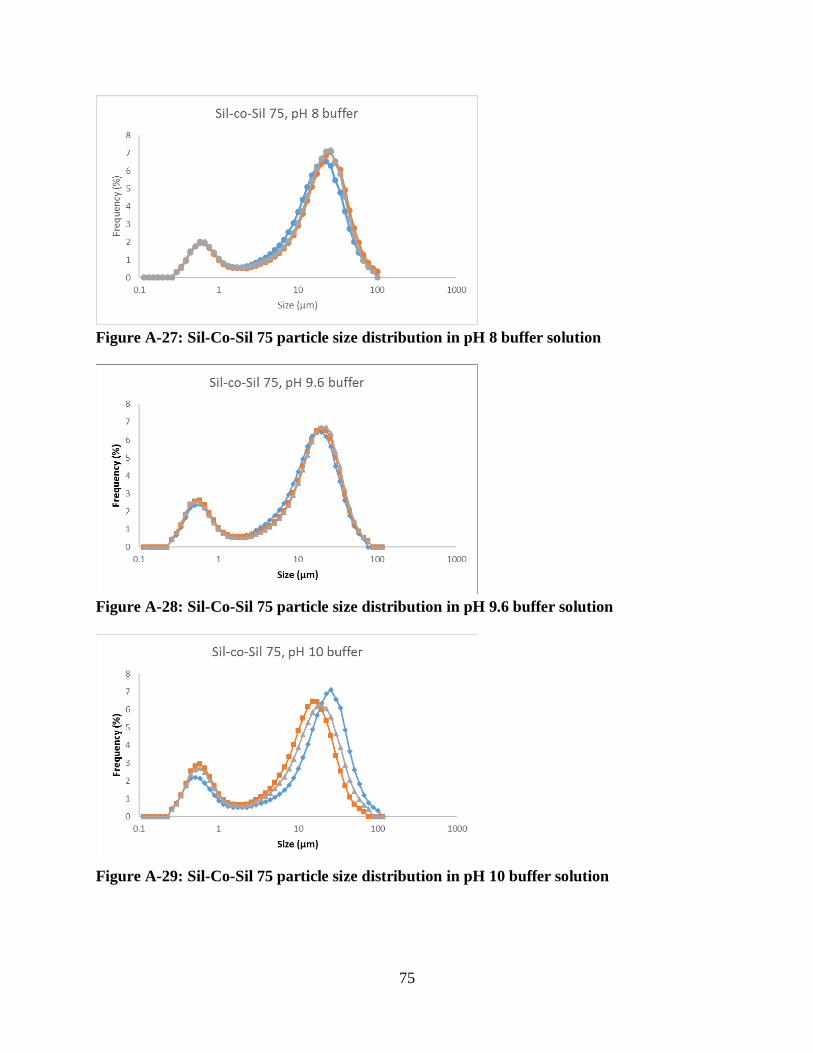
Figure A-27: Sil-Co-Sil 75 particle size distribution in pH 8 buffer solution .............................. 75
Figure A-28: Sil-Co-Sil 75 particle size distribution in pH 9.6 buffer solution ........................... 75
Figure A-29: Sil-Co-Sil 75 particle size distribution in pH 10 buffer solution ............................ 75
Figure A-30: Alumina particle size distribution in 3 mM NaCl solution .................................... 76
Figure A-31: Alumina particle size distribution in 0.1 mM NaHCO3 solution ............................ 76
Figure A-32: Alumina particle size distribution in 1 mM NaHCO3 solution............................... 76
Figure A-33: Alumina particle size distribution in 1 mM Na2CO3 solution ................................ 77
Figure A-34: Particle size distribution on alumina that remained unsettled after 30 and 60
minutes of stagnation in 1 mM Na2CO3 solution ....................................................................... 77
Page 10
x
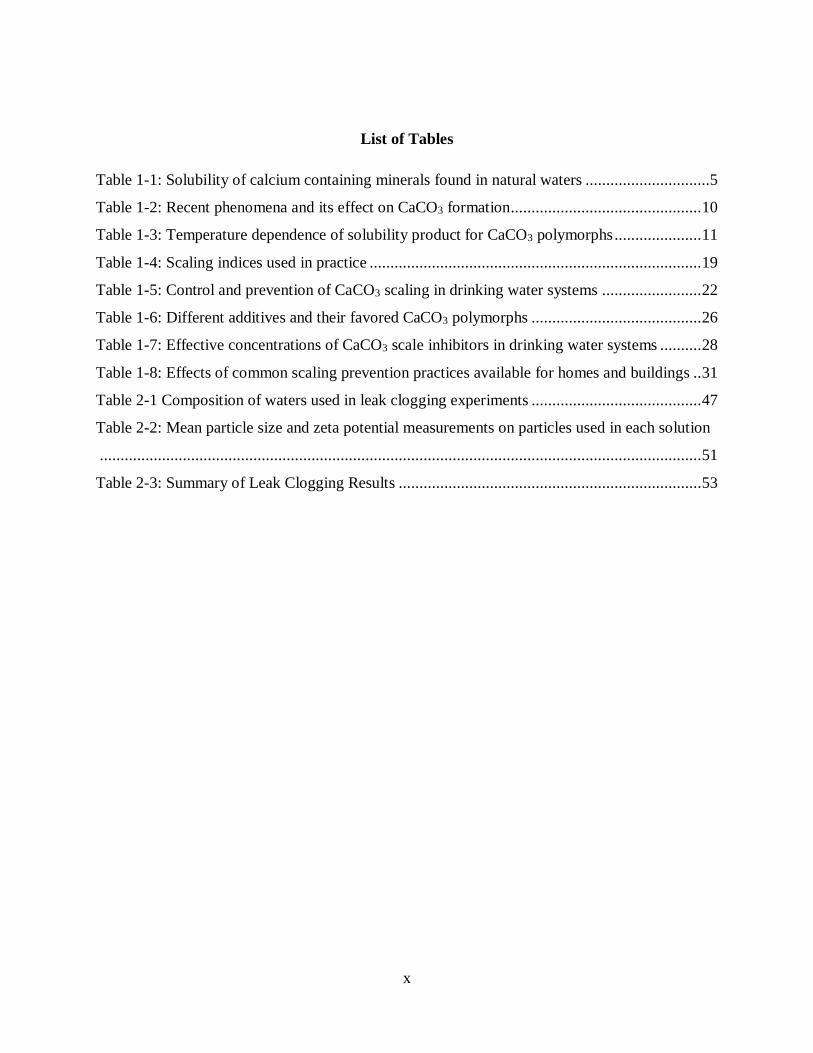
List of Tables
Table 1-1: Solubility of calcium containing minerals found in natural waters ..............................5
Table 1-2: Recent phenomena and its effect on CaCO3 formation .............................................. 10
Table 1-3: Temperature dependence of solubility product for CaCO3 polymorphs ..................... 11
Table 1-4: Scaling indices used in practice ................................................................................ 19
Table 1-5: Control and prevention of CaCO3 scaling in drinking water systems ........................ 22
Table 1-6: Different additives and their favored CaCO3 polymorphs ......................................... 26
Table 1-7: Effective concentrations of CaCO3 scale inhibitors in drinking water systems .......... 28
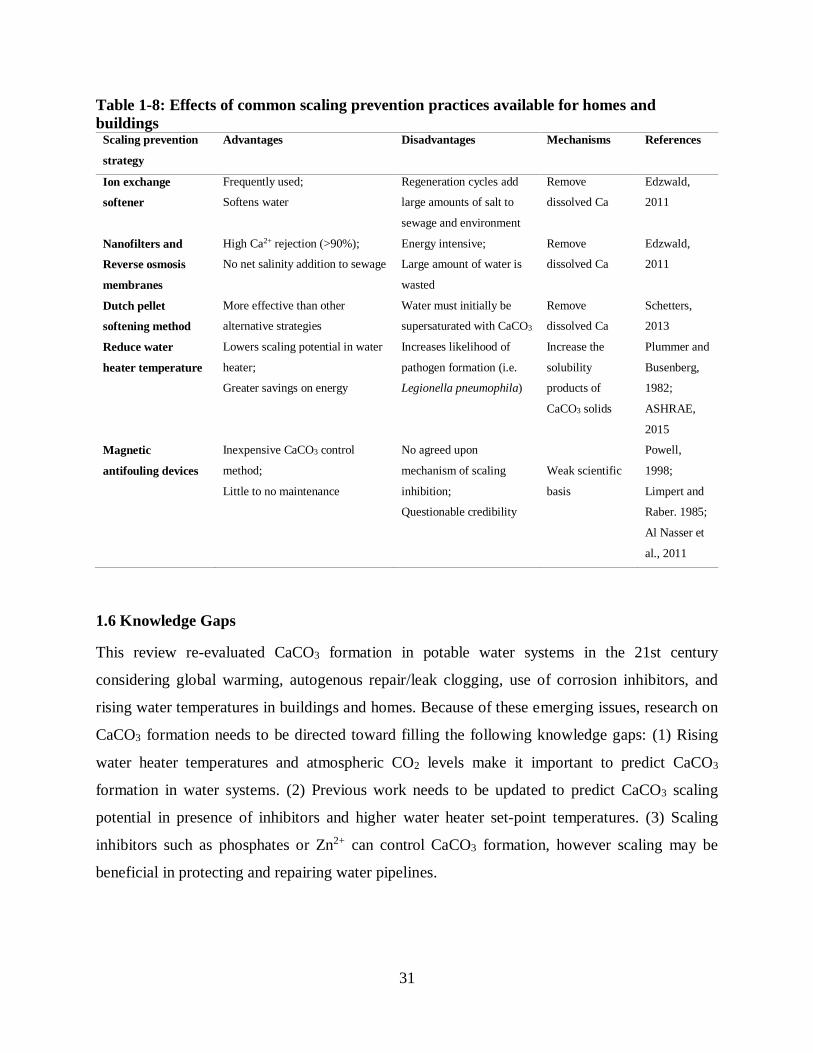
Table 1-8: Effects of common scaling prevention practices available for homes and buildings .. 31
Table 2-1 Composition of waters used in leak clogging experiments ......................................... 47
Table 2-2: Mean particle size and zeta potential measurements on particles used in each solution
................................................................................................................................................. 51
Table 2-3: Summary of Leak Clogging Results ......................................................................... 53
Page 11
1
Chapter 1: Literature Review - A 21st Century Perspective on Calcium Carbonate
Formation in Potable Water Systems
1.1 Introduction
The prediction, monitoring, and consequences of CaCO3 formation have long been a key issue in
potable water treatment. An early concern was that waters highly undersaturated with CaCO3
would be corrosive to metallic and concrete pipe infrastructure (Baylis, 1935), and for waters
highly supersaturated with CaCO3, issues related to scaling (i.e., pipe clogging, head loss, higher
heating costs) are the primary concerns (Garrett-Price et al., 1985). In the 80+ years since the
landmark studies examining these issues were published, many changes have occurred that can
profoundly alter the likelihood of CaCO3 scaling in potable water systems including chemical
corrosion control, changing water heater set-point temperatures, autogenous repair, global
warming, biofilm growth, and erosion corrosion. This review is aimed at summarizing these
changes and highlighting their practical implications for water utilities, regulators, building
managers and consumers (Figure 1-1).
Page 12
2
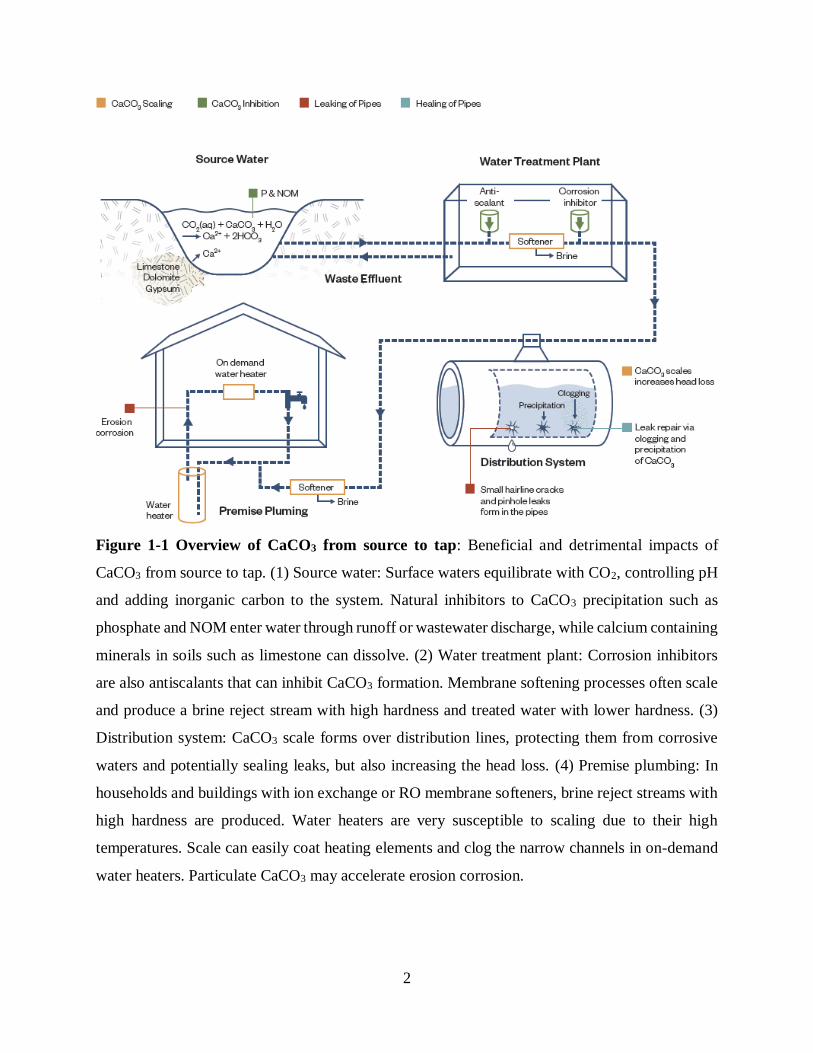
Figure 1-1 Overview of CaCO3 from source to tap: Beneficial and detrimental impacts of
CaCO3 from source to tap. (1) Source water: Surface waters equilibrate with CO2, controlling pH
and adding inorganic carbon to the system. Natural inhibitors to CaCO3 precipitation such as
phosphate and NOM enter water through runoff or wastewater discharge, while calcium containing
minerals in soils such as limestone can dissolve. (2) Water treatment plant: Corrosion inhibitors
are also antiscalants that can inhibit CaCO3 formation. Membrane softening processes often scale
and produce a brine reject stream with high hardness and treated water with lower hardness. (3)
Distribution system: CaCO3 scale forms over distribution lines, protecting them from corrosive
waters and potentially sealing leaks, but also increasing the head loss. (4) Premise plumbing: In
households and buildings with ion exchange or RO membrane softeners, brine reject streams with
high hardness are produced. Water heaters are very susceptible to scaling due to their high
temperatures. Scale can easily coat heating elements and clog the narrow channels in on-demand
water heaters. Particulate CaCO3 may accelerate erosion corrosion.
Page 13
3
1.1.1 Scaling
Scaling is the most obvious manifestation of CaCO3 precipitation in potable water systems,
resulting in flow restrictions in the system by clogging plumbing devices and creating head loss
(Krappe, 1940; Crabtree et al., 1999). CaCO3 scaling is a problem in granular media filters, where
its formation can “cement” together the filter bed making it difficult to regenerate the media
(Logsdon et al., 2002). Scaling is also a major issue in modern filters such as reverse osmosis (RO)
or ultrafiltration membranes as it contributes to membrane fouling (Gwon et al., 2003). The
concentration of Ca2+ and inorganic carbon in the reject stream can lead to CaCO3 precipitating on
the membrane surface (Bremere et al., 1999) and it is recommended that feed water pH is lowered
to prevent scaling on the membrane and brine discharge system (Seneviratne, 2007).
The increased propensity of CaCO3 to precipitate at higher temperatures makes scaling a
troublesome issue in hot water systems, especially in water heater or water cooling applications in
which scale layers interfere with heat transfer and system efficiency. Water heating is extremely
energy intensive, and the total energy demand for building water heating systems exceeds the
energy demand for the entire water and wastewater utility sector (Brazeau and Edwards, 2011). It
is estimated that a hard water can lower the heat transfer efficiency of gas storage water heaters by
8.5%, and of instantaneous gas water heaters by 30%, over a 15 year lifecycle if no softening or
de-liming is practiced (WQRF, 2011). Softening hard water can reduce the life cycle cost of
instantaneous gas water heaters by 22.5% and gas storage water heaters by 6.6% over a 15 year
lifecycle (WQRF, 2011). The annual cost of fouling for industrial operations in the U.S. alone was
estimated in 1982 to be around $3-10 billion (Garrett-Price et al., 1985), including the cost of anti-
scaling programs, downtime for maintenance, lost production, cleaning, higher energy costs due
to reduced heat transfer, and over-sizing equipment where fouling is expected. The worldwide cost
in 2000 was estimated at roughly $26 billion and $8-10 billion in the U.S. alone (Müller-
Steinhagen, 2000).
1.1.2 Autogenous Repair
A possible but overlooked benefit of CaCO3 formation in potable water systems is its ability to
seal leaks in a process known as autogenous leak repair. This method may have been first
Page 14
4
discovered and applied in ancient Rome, where the addition of alkaline wood ash was used to seal
leaking pipelines (Pollio 15 BC as translated by Morgan, 1960). Although the mechanism of leak
repair is unspecified, the high pH of wood ash solutions of 11.7-13.1 (Pitman, 2006) would also
cause solids to precipitate in the water and clog leaks, in addition to the particulates in wood ash
that could directly block leaks. In modern times the self-healing of concrete cracks and leaks is
known to be critical to the satisfactory long-term performance of concrete structures and pipelines
(Hearn, 1998; Edvardsen, 1999). Autogenous healing via hydration reactions in concrete have been
frequently observed (Hearn, 1998). However, CaCO3 deposition is also a major contributor to
concrete repair (Edvardsen, 1999; Clear, 1985). Parks et al. (2010) found that concrete can also be
repaired via magnesium-silicate precipitates which also form autogenously at higher pH in certain
waters.
1.2 Recent Trends Affecting CaCO3 Formation
Overview. In the last half-century, the science and practice of potable water treatment and
distribution has changed markedly in ways that can profoundly alter the extent of CaCO3 formation
and scaling in water main and premise plumbing pipe systems (Figure 1-1). Inorganic carbon
dissolves into natural water systems from CO2 in the atmosphere, and Ca2+ is released in natural
waters through dissolution of minerals such as portlandite, gypsum, and dolomite that come into
contact with the water (Table 1-1). De-icing salt can also contribute thousands of tons of Ca2+ to
groundwater in regions where calcium chloride is used (Houska, 2007).
Page 15
5
Table 1-1: Solubility of calcium containing minerals found in natural waters
Mineral pKsp (25
°C)
Reaction References
Limestone
(calcite +
aragonite)
8.34 -
8.48
𝐶𝑎𝐶𝑂3(𝑠) 𝐶𝑎2+ + 𝐶𝑂32− Plummer and
Busenberg,
1982
Portlandite 22.8 𝐶𝑎(𝑂𝐻)2(𝑠) 𝐶𝑎2+ + 2𝑂𝐻− Brezonik and
Arnold, 2011
Dolomite 17.2 𝐶𝑎𝑀𝑔(𝐶𝑂3)2(𝑠) + 𝐻+ 𝑀𝑔𝐶𝑂3(𝑠) + 𝐶𝑎2+ +
𝐻𝐶𝑂3−
Sherman and
Barak, 2000
Gypsum 4.16 𝐶𝑎𝑆𝑂4 ∙ 2𝐻2𝑂(𝑠) 𝐶𝑎2+ + 𝑆𝑂42− + 2𝐻2𝑂 Brezonik and
Arnold, 2011
CaCO3 formation as a corrosion control method has fallen out of favor. Corrosion has taken
a heavy toll on plumbing and distribution systems throughout the U.S. The cost of maintaining the
aging drinking water infrastructure in the U.S. alone will exceed $1 trillion over the next 25 years
(AWWA, 2012). The original basis for controlling or reducing corrosion in potable water
distribution systems was based on the premise that a layer of CaCO3 formed on pipe surfaces could
almost completely protect all pipe materials from corrosive reactants in the water supply including
oxygen and free chlorine. Numerous corrosion indices based on this hypothesis were formulated
to monitor and control the supposedly protective carbonate scales including: Langelier saturation
index (LSI), Ryznar stability index (RSI), Puckorius scaling index (PSI), Larson-Skold index (LI),
and measurement of temporary hardness (Langelier, 1936; Ryznar and Langelier, 1944; Puckorius
and Brooke, 1991; Larson and Skold, 1958). Early on some of these indices were criticized because
Page 16
6
they oversimplified the process of scaling (Wiggin et al., 1938; Schneider and Stumm, 1964). Such
views dominated potable water treatment until about the mid-1980s, when researchers studying
corrosion began to notice that iron, lead, and copper corrosion had little to do with CaCO3
precipitation, and a consensus emerged that the overall approach was without basis and should be
abandoned (Stumm, 1956; Larson and Skold, 1957; Schock, 1989; AWWARF, 1996). However,
that consensus neglected to consider the possible benefits of the approach in reducing pipeline
leaks and extending lifetime of assets through autogenous repair processes or clogging (Tang et
al., 2013). In practice, many water utilities continue to calculate and target specific levels of CaCO3
saturation (or undersaturation) for corrosion control.
CaCO3 scaling in building heating systems has recently become an increased concern. Many
buildings are now beginning to target higher hot water system temperature setpoints (> 51 °C) to
reduce growth of pathogens (e.g. Legionella pneumophila). Because the solubility of CaCO3
decreases as temperature increases, and rates of precipitation also increase, scale formation on the
surface of the heating element and throughout the system occurs more rapidly. Scaling can create
serious problems including loss of heat transfer efficiency in heating systems, head loss (energy
loss) induced by pipe clogging, and in some cases erosion corrosion from particles (Crabtree et al.,
1999; Dobersek and Goricanec, 2007; Krappe, 1940; Roy and Edwards, 2015). Lower heat transfer
efficiency in heating systems can severely impair the proper operation of water heaters in homes
and buildings as well as cooling towers and heat exchangers in industrial settings (Garrett-Price et
al., 1985).
Tankless on-demand water heaters are emerging as an important energy conserving device, due to
their minimal hot water storage volumes and heat losses due to stagnation. The Department of
Energy estimates that a centralized on-demand water heating system can reduce energy
consumption by 8-34% (U.S. DoE) compared to conventional tank systems. Homeowners with
gas heated on-demand systems are also eligible for federal tax credits (Energy Star) and the lack
of stored hot water can reduce the risk of opportunistic pathogen growth (Brazeau and Edwards,
2011). Although these factors incentivize home and building owners to install on-demand water
heaters, their high surface area-to-volume ratio at heat transfer surfaces, which are inherent to their
instant heating design, makes them highly susceptible to CaCO3 scaling and clogging in scaling
Page 17
7
waters (Thomas et al., 2006; Brazeau and Edwards, 2011). In some cases, scaling may also reduce
or eliminate their energy savings relative to conventional water heaters.
CaCO3 may have the ability to clog leaks that have formed in pipes and extend the lifetime
of distributions systems. It is hypothetically possible, that despite the sound scientific work
discrediting Langelier and related indices as a guide to corrosion control, that the indices might
have actually been “working” as advertised in controlling pipe leaks and extending distribution
system lifetimes (DeMartini, 1938) but for reasons other than corrosion control. Specifically,
rather than forming a thin CaCO3 layer to protect pipe from corrosion and associated leaks
(Langelier, 1936), it is possible that a high CaCO3 formation potential could have reduced leak
frequency by autogenous repair or clogging of leaks (Tang et al., 2013). Autogenous repair is a
process by which existing leaks seal themselves, and CaCO3 formation is a well-known leak self-
repair mechanism for concrete pipes (Parks et al., 2010; Edvardsen, 1999). It is possible that this
mechanism could also repair and heal leaks in metallic pipes before the leak holes grow to
catastrophic failure, by either clogging of holes, assisting the formation of stronger or thicker pipe
scales, or formation of corrosion byproducts (Tang et al., 2013; Tang et al., 2015). More research
is needed correlating actual leaks to CaCO3 formation potential to test this hypothesis, especially
given the poor condition of U.S. distribution system assets and lack of financial resources for
traditional repair and replacement.
CaCO3 precipitation inhibitors that are naturally present or are added at the point of
treatment have probably changed the propensity of water to form CaCO3 scales in the last
few decades. Water treatment policies aimed at controlling lead and copper corrosion dramatically
increased the use of phosphate and polyphosphate corrosion inhibitors starting around 1990. These
inhibitors are known to slow CaCO3 precipitation kinetics in potable water systems (Lin and
Singer, 2005a; Lin and Singer, 2006). Use of such corrosion inhibitors might prevent leak repair
that occurs naturally for concrete pipe leaks or even possibly for metallic pipe leaks that would
have occurred when the inhibitor was absent. On the other hand, this may be offset by increased
removal of natural organic matter (NOM) that many plants are trying to achieve due to its role as
a disinfection byproduct (DBP) precursor. NOM has been shown to inhibit CaCO3 precipitation
(Lin et al., 2005).
Page 18
8
Climate change may play a role in CaCO3 formation. Rising CO2 levels in the atmosphere and
more frequent and longer droughts caused by global warming can increase calcium levels in natural
waters (Anderson and Faust, 1972; Mosley, 2015). Consequently, the CaCO3 saturation index in
potable water systems may also be rising (Figure 1-2). The net effect of these changes is as yet
unclear. Some types of dissolved organic carbon (DOC) are known to be a CaCO3 precipitation
inhibitor (Lebron and Suarez, 1996). Although the major cause of increased DOC levels in natural
waters is attributed to a decrease in acid rain deposition (Evans et al., 2006), there is evidence that
higher CO2 levels leading to increases in primary productivity (Freeman et al., 2004) and rising
temperatures (Freeman et al., 2001) also contribute to DOC release.
Figure 1-2 Impact of rising atmospheric CO2 levels on CaCO3 formation: Calcite at
equilibrium with atmospheric CO2 levels in the pre-industrial era, present day, and those projected
for 2050. Higher atmospheric CO2 can increase the precipitation potential. Using Mineql+, waters
were equilibrated at [Ca2+] = 40 mg/L and PCO2 = 280x10-6, 390x10-6, and 550x10-6 atm. Using the
equilibrium CaT, Alk, and pH from the open systems as starting conditions for the closed systems,
the potential CaCO3 formation at equilibrium was calculated for the closed systems.
Scaling has been shown to affect biofilm growth in premise plumbing.
A comprehensive study conducted by Fox and Abbaszadegan (2013) found that scale on PVC and
copper, materials common in premise plumbing, promoted biofilm growth because it increased the
surface roughness and provided a protected structure for the biofilm to grow on. An increase in
Page 19
9
biofilm growth was most pronounced on scaled copper surfaces because the scale shielded the
biofilm from the antimicrobial properties of copper.
Bulk precipitation of CaCO3 may contribute to erosion corrosion in plumbing systems.
Erosion corrosion occurs via mechanical action of fluid and suspended particles removing
protective films on pipe surfaces. Roy and Edwards (2015) investigated erosion corrosion and
found that aragonite, which is one polymorph of CaCO3, particles of sizes < 2 mm are capable of
creating leaks in copper pipes. Typically, the formation of large CaCO3 particles is not a concern
in potable water systems, however it has been shown that CaCO3 scale can be removed from
premise plumbing materials (copper and polypropylene) by shear stress (Royer et al., 2010). The
scale that gets released has potential to cause or accelerate erosion corrosion, especially in
recirculating systems.
The complexity of these phenomena and their profound impact on the infrastructure, energy and
sustainable water nexus, make it an ideal time to revisit this important topic (Table 1-2). The
objectives of this review are: (1) re-evaluate CaCO3 formation in a modern context, such as global
warming, autogenous repair, corrosion inhibitors and increasing water heater temperatures in
building; (2) identify knowledge gaps regarding CaCO3 formation and control.
Page 20
10
Table 1-2: Recent phenomena and its effect on CaCO3 formation
Phenomenon Effects on CaCO3 formation Research priorities
Global warming Greater CO2 in atmosphere can
raise or lower amount of CaCO3
that could form
More severe droughts could raise
Ca2+ in natural waters
Experimentally alter CaCO3
formation potential at varying
PCO2
Corrosion and
scaling inhibitors
Phosphates added to drinking
water reduce CaCO3 formation
Use increased in last 25 years, but
pressure on industry to lower the
dosage for cost and environmental
reasons
NOM is a scaling inhibitor,
utilities are targeting it for removal
because it is a precursor to DBPs
Find out how CaCO3 precipitation
is affected by higher and lower
phosphate concentrations
Effect of non-phosphate inhibitors
on CaCO3 precipitation
Raising water
heater
temperature
Home and building owners are
raising water heater temperatures
to control opportunistic pathogens.
Higher temperatures increase
CaCO3 scaling potential
Improve water heater design to
reach higher temperatures but
reduce scaling potential
Autogenous
repair
CaCO3 formation could
beneficially be used to seal leaks
in plumbing and distribution
systems
Alter chemistry of drinking water
to promote leak repair via CaCO3
Examine the impact inhibitors
have on ability to repair
Biofilm growth CaCO3 provides a surface for
biofilm to grow on. Shields
biofilm from antimicrobial
plumbing materials
Determine health implications of
CaCO3-induced biofilm growth in
domestic plumbing
Erosion corrosion Small (< 2 mm) CaCO3 particles
and CaCO3 scale released from
pipe surface can cause erosion
corrosion
Analyze flow patterns and
plumbing design to mitigate
erosion corrosion from CaCO3
Page 21
11
1.3 Chemistry of CaCO3 Formation
1.3.1 Background
To fully understand practical aspects of CaCO3 behavior in potable water systems, it is important
to first review the chemistry of CaCO3 formation and dissolution. CaCO3 crystals are made up of
Ca2+ and CO32- lattice ions, both of which are ubiquitous in natural water systems. It can exist in
three crystalline polymorphs as well as an amorphous phase (ACC) or as a mono- and hexahydrate.
The solubility product for each form varies with temperature (Table 1-3). CaCO3 has significantly
lower solubility at higher temperatures, causing CaCO3 formation to be a major issue in many hot
water systems even when it is not a problem in cold water systems for waters with moderate
hardness and alkalinity (Figure 1-3).
Table 1-3: Temperature dependence of solubility product for CaCO3 polymorphs
Polymorph pKsp at
25 °C
Ksp Equation Temperature
Range
References
ACC 6.04 log Ksp =
1247
T− 10.224
16 to 60 °C Clarkson et
al., 1992
Vaterite 7.91 log Ksp = −172.1295 − 0.077993 ∗ T
+3074.688
T+ 71.595
∗ logT
0 to 90 °C Plummer
and
Busenberg,
1982
Aragonite 8.34 log Ksp = −171.9773 − 0.077993 ∗ T
+2903.293
T+ 71.595
∗ logT
0 to 90 °C Plummer
and
Busenberg,
1982
Calcite 8.48 log Ksp = −171.9065 − 0.077993 ∗ T
+2839.319
T+ 71.595
∗ logT
0 to 90 °C Plummer
and
Busenberg,
1982
Note: T is temperature in K.
Page 22
12
Figure 1-3 Impact of increasing temperature on CaCO3 formation: The amount of potential
CaCO3 formation for all crystalline polymorphs (vaterite, aragonite and calcite) and ACC under
different temperatures in water distribution systems. MINEQL+ simulations on a closed system
with alkalinity = 100 mg/L as CaCO3 at pH 8.5 and (a) initial TOTCa = 40 mg/L and (b) initial
TOTCa= 65 mg/L.
While the levels of Ca2+ in natural waters are usually governed by regional geology (limestone,
dolomite, etc.), the carbonate system is more complex. The pKa values indicate that CO32- becomes
the dominant form of inorganic carbon at pH 10.3 and higher (Plummer and Busenberg, 1982).
CO2(g) + H2O CO2(aq) + H2CO3(aq) pKH = 1.47
H2CO3(aq) H+ + HCO3−(aq) pKa1 = 6.4
HCO3−(aq) H+ + CO3
2−(aq) pKa2 = 10.3
The ion activity product, Q, for CaCO3 is the product of the Ca2+ and CO32- activities as shown in
the equation below.
Q = Ca2+CO32−
When Q < Ksp, the solution is undersaturated, precipitation is not thermodynamically favored, and
solid CaCO3 can dissolve. However, when Q > Ksp, CaCO3 is supersaturated and can precipitate.
Page 23
13
Precipitation starts with nucleation, which is the initiation of phase change from aqueous to solid
in the solution. Nucleation is categorized as primary and secondary. Primary nucleation refers to
nucleation when no other crystals are present (Mullin, 2001). It can occur homogeneously
(spontaneous and in the absence of any solids) or heterogeneously (nucleation induced by foreign
solid particles). Heterogeneous nucleation is more commonly observed for CaCO3 because the
surface of the foreign solid generally lowers the activation energy barrier for nucleation (Brezonik
and Arnold, 2011). Secondary nucleation refers to the growth of CaCO3 on pre-existing crystals
(Mullin, 2001).
The induction time, τ, is defined as the time between the moment the solution reaches
supersaturation and the onset of precipitation. A general model for induction time for CaCO3
precipitation is given by Xyla et al. (1991) as
𝜏 = 𝐾(Ω0.5 − 1)𝑝
Where K depends on the system’s characteristics, p is apparent growth order (for CaCO3, p was
determined to be 8.0 [Xyla et al., 1991]), and Ω is the degree of supersaturation, defined as
Ω =𝑄
𝐾𝑠𝑝
Typical induction times for homogeneous precipitation can range from <1 to 136 minutes
depending on Ω and assuming there are no impurities (i.e. inhibitors) (Xyla et al. 1991).
1.3.2 Precipitation and Growth in Plumbing and Distribution Systems
Homogeneous Precipitation
Homogeneous nucleation of CaCO3 occurs less frequently than heterogeneous nucleation due to
the larger energy barrier of spontaneously forming CaCO3 nuclei in solution. As a result,
homogeneous nucleation is mostly observed at Ω greater than 1.6 (Lioliou et al., 2007).
Page 24
14
Homogeneous nucleation of CaCO3 was believed to follow classical nucleation theory (CNT).
CNT states that a nucleus is not stabilized until a critical radius is reached in which the bulk energy
and surface energy of the nuclei is balanced (Gebauer et al., 2014). However, the recent discovery
of pre-nucleation clusters (PNCs) undermines CNT (Gebauer et al., 2008). PNCs contain CaCO3
lattice ions but do not have an explicit phase boundary with the solution. There are also structural
characteristics of PNCs that indicate which polymorph nucleates. More stable PNCs yield ACC
with short-range order corresponding to calcite while less stable PNCs yield ACC with short-range
order corresponding to vaterite (Lam et al., 2007; Gebauer et al., 2014).
Homogeneous CaCO3 precipitation roughly follows Ostwald’s rule of stages. The rule of stages
states that often the least stable polymorph crystallizes first before transforming into the most
stable polymorph (Ng et al., 1996). For CaCO3, ACC is the first to precipitate, followed by vaterite,
before transforming into calcite which is its most stable form (Wolf et al., 2008). Ogino et al.
(1987) observed the same at lower temperatures (14-30 °C) while at higher temperatures (60-80
°C), the transition of ACC to aragonite to calcite was observed. At intermediate temperatures (40-
50 °C), CaCO3 crystallization closely follows Ostwald’s rule of stages because every polymorph
forms before becoming calcite (Ogino et al., 1987).
CaCO3 scale that forms in plumbing and distribution systems is unlikely to have originated from
homogeneous nucleation. The large energy barrier for homogeneous nucleation means the solution
must have a higher Ω for CaCO3 to readily precipitate. Even in systems that stagnate for long
periods of time, heterogeneous nucleation is likely to be the more common form of nucleation due
to the scale already present or bare surfaces that lower the energy barrier for nucleation.
Heterogeneous Precipitation
As discussed previously, heterogeneous nucleation occurs more readily than homogeneous
nucleation due to the lower energy barrier the surface provides. As a result, it is likely the most
common route of nucleation for CaCO3 scale in plumbing and distribution systems.
Many characteristics of surface materials will affect heterogeneous precipitation of CaCO3, such
as surface roughness (Keysar et al., 1994; Wu et al., 2010; Cheong et al., 2013; MacAdam and
Page 25
15
Parsons, 2004a) and surface charge (Wu et al., 2010). Several studies have been conducted to
determine the susceptibility of CaCO3 to scale surfaces made of different materials. In general,
inert materials such as polymers are less likely to scale than metallic surfaces (Githens et al., 1965).
In a study done on heated metallic surfaces, it was found that copper has the highest scaling rate
compared to steel and aluminum (Macadam and Parsons, 2004a). These results contradict those of
a previous experiment that observed aluminum as having the highest scaling rate followed by mild
steel, then copper (Troup and Richardson, 1978).
Comparing copper and polypropylene tubes in heat exchangers, copper was scaled with Ca-
containing minerals at a rate twice that of polypropylene (Wu et al., 2009). However, a similar
study found no significant difference between CaCO3 scaling on copper and polymer surface
including polypropylene (Wang et al., 2005). Comparison of heterogeneous nucleation on PVC
and stainless steel surfaces shows that stainless steel has higher precipitation rate at low Ca2+
concentration (200 mg/L as CaCO3), however at higher Ca2+ concentration (400 mg/L as CaCO3)
higher heterogeneous precipitation rate was observed on PVC (Amor et al., 2004). There is a gap
in research comparing the heterogeneous nucleation on traditional water distribution system
materials (i.e. concrete and cast iron). Predictions about the heterogeneous nucleation rate can be
made using absolute surface roughness. The Hazen-Williams coefficient (C-factor) for concrete is
100 and for cast iron is 80-130, depending on age (Jaćimović et al., 2015). Lower C-factors indicate
a rougher surface; thus aged cast iron would have a higher scaling potential than concrete.
It is also important to consider CaCO3 nucleation on waterborne particles because bulk
precipitation can enhance scaling (Andritsos and Karabelas, 2003; Pääkkönen et al., 2009).
Although suspended calcite crystals are the most effective CaCO3 seeds (Nancollas and Reddy,
1971; Lin and Singer, 2005b), they are relatively uncommon in natural waters. Some particles that
make up clay, which contributes to turbidity, have shown to induce CaCO3 precipitation. For
example, montmorillonite, a type of clay, was shown to instantaneously lead to calcite
precipitation (Kralj and Vdović, 2000).
Surface free energy is believed to influence heterogeneous CaCO3 nucleation. Lower surface
energy reduces the adhesion strength of CaCO3 (Müller-Steinhagen and Zhao, 1997; Förster et al.,
Page 26
16
1999; Yang et al., 2000; Yang et al., 2002; MacAdam and Parsons, 2004b). Müller-Steinhagen and
Zhao (1997) successfully reduced CaSO4 scaling rate on stainless steel by lowering its surface
energy via ion implantation. Förster et al. (1999) also found a negative correlation between surface
energy and induction time for CaSO4 formation on a variety of materials. A similar result might
be expected with CaCO3.
Growth Rate
Previous models of seeded growth kinetics only considered Ω. Morse (1983) modeled the growth
rate using the equation below.
𝑅 = 𝑘(Ω − 1)𝑛
Where R is the rate of precipitation normalized to surface area, k is an empirical rate constant, and
n is reaction order. The general growth rate of CaCO3 has also been modeled in terms of the rate
of decrease in Ca2+ concentration as shown in the equation below (Kazmierczak et al., 1982;
Nancollas and Reddy, 1971).
−𝑑[𝐶𝑎2+]
𝑑𝑡= 𝑘𝑠([𝐶𝑎2+𝐶𝑂3
2−]0.5 − 𝐾𝑠𝑜0.5)2
Where k is the rate constant for growth and s is a function of the crystal surface area. The two
growth models shown so far only consider the degree of supersaturation. Lin and Singer (2005b)
did extensive research on the surface reactions occurring during CaCO3 growth and found positive
correlation between CaCO30 with the surface species >CaCO3
- and >CO3-.
For CaCO3 crystallization, the growth mechanism can be either surface-controlled or diffusion-
controlled. In a surface-controlled mechanism, incorporation of lattice ions into the crystal
structure is the rate limiting process. In a diffusion-controlled mechanism, diffusion of lattice ions
from the solution to the crystal surface is the rate limiting process. Past research points toward the
surface-controlled mechanism being dominant in CaCO3 crystallization (Rodriguez-Hornedo and
Murphy, 1999; Xyla et al., 1991; Dalas et al., 1988; Lioliou et al., 2007). However, pH,
Page 27
17
supersaturation, and hydrodynamic conditions can influence whether the rate is surface- or
diffusion-controlled (Lin and Singer, 2005b).
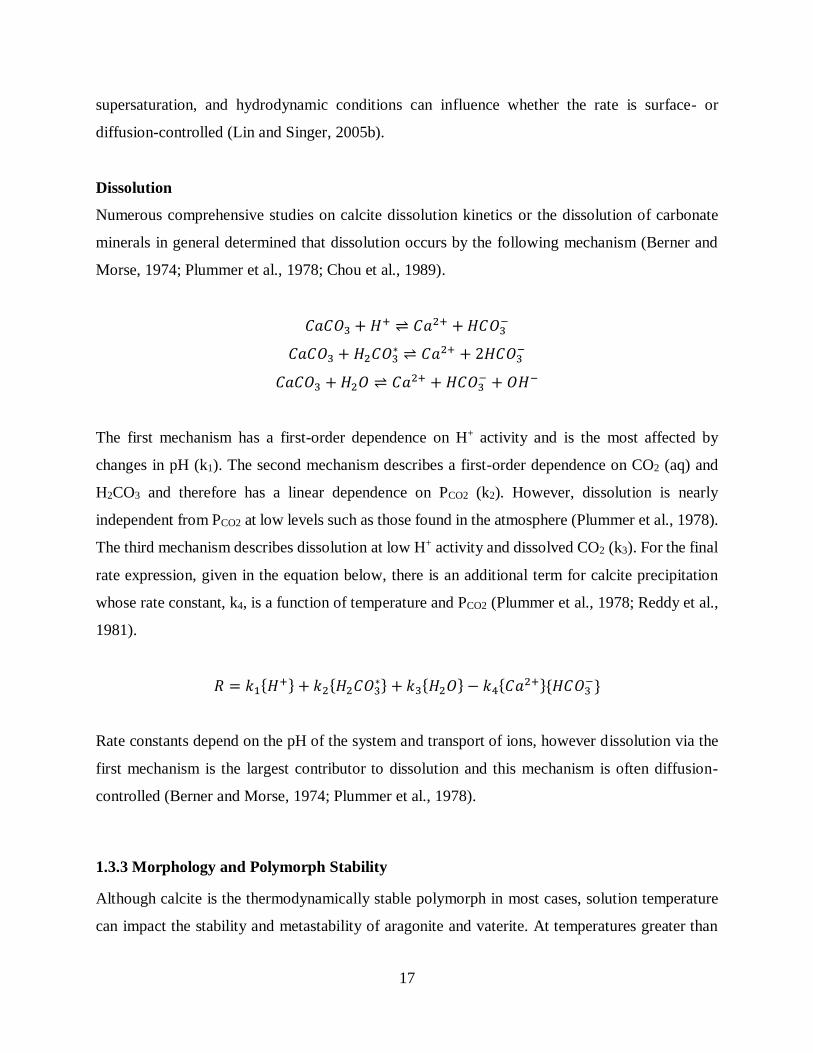
Dissolution
Numerous comprehensive studies on calcite dissolution kinetics or the dissolution of carbonate
minerals in general determined that dissolution occurs by the following mechanism (Berner and
Morse, 1974; Plummer et al., 1978; Chou et al., 1989).
𝐶𝑎𝐶𝑂3 + 𝐻+ 𝐶𝑎2+ + 𝐻𝐶𝑂3−
𝐶𝑎𝐶𝑂3 + 𝐻2𝐶𝑂3∗ 𝐶𝑎2+ + 2𝐻𝐶𝑂3
−
𝐶𝑎𝐶𝑂3 + 𝐻2𝑂 𝐶𝑎2+ + 𝐻𝐶𝑂3− + 𝑂𝐻−
The first mechanism has a first-order dependence on H+ activity and is the most affected by
changes in pH (k1). The second mechanism describes a first-order dependence on CO2 (aq) and
H2CO3 and therefore has a linear dependence on PCO2 (k2). However, dissolution is nearly
independent from PCO2 at low levels such as those found in the atmosphere (Plummer et al., 1978).
The third mechanism describes dissolution at low H+ activity and dissolved CO2 (k3). For the final
rate expression, given in the equation below, there is an additional term for calcite precipitation
whose rate constant, k4, is a function of temperature and PCO2 (Plummer et al., 1978; Reddy et al.,
1981).
𝑅 = 𝑘1𝐻+ + 𝑘2𝐻2𝐶𝑂3∗ + 𝑘3𝐻2𝑂 − 𝑘4𝐶𝑎2+𝐻𝐶𝑂3
−
Rate constants depend on the pH of the system and transport of ions, however dissolution via the
first mechanism is the largest contributor to dissolution and this mechanism is often diffusion-
controlled (Berner and Morse, 1974; Plummer et al., 1978).
1.3.3 Morphology and Polymorph Stability
Although calcite is the thermodynamically stable polymorph in most cases, solution temperature
can impact the stability and metastability of aragonite and vaterite. At temperatures greater than
Page 28
18
60 °C, homogeneous precipitation yields aragonite as the dominant polymorph over a period of
hours (Wray and Daniels, 1957; Sawada, 1997; Kellermeier et al., 2013). Temperature also affects
the relative abundance of each polymorph during the early metastable stage of homogeneous
precipitation. Vaterite is the dominant metastable phase at standard temperature, however at
temperatures below 25 °C, calcite is the dominant metastable phase and at temperatures above 50
°C, aragonite is the dominant metastable phase (Ogino et al., 1987).
The mechanism of CaCO3 precipitation and calcite formation occurs in stages via redissolution of
ACC to vaterite and vaterite to calcite over a period of approximately 3 hours (Ogino et al., 1987;
Sawada, 1997). Knowing the polymorph evolution as CaCO3 precipitates could have importance
in predicting scale formation. Some sources reference formation of “hard” calcite scale and “soft”
aragonite scale that is easier to be removed (Liu et al., 2010). Although this claim is unverified, if
it is true, the time between CaCO3 precipitation and “hard” scale deposition could be predicted in
some systems.
1.4 Monitoring CaCO3 Formation in Potable Water Systems
1.4.1 Tests and Indices for Scale Formation
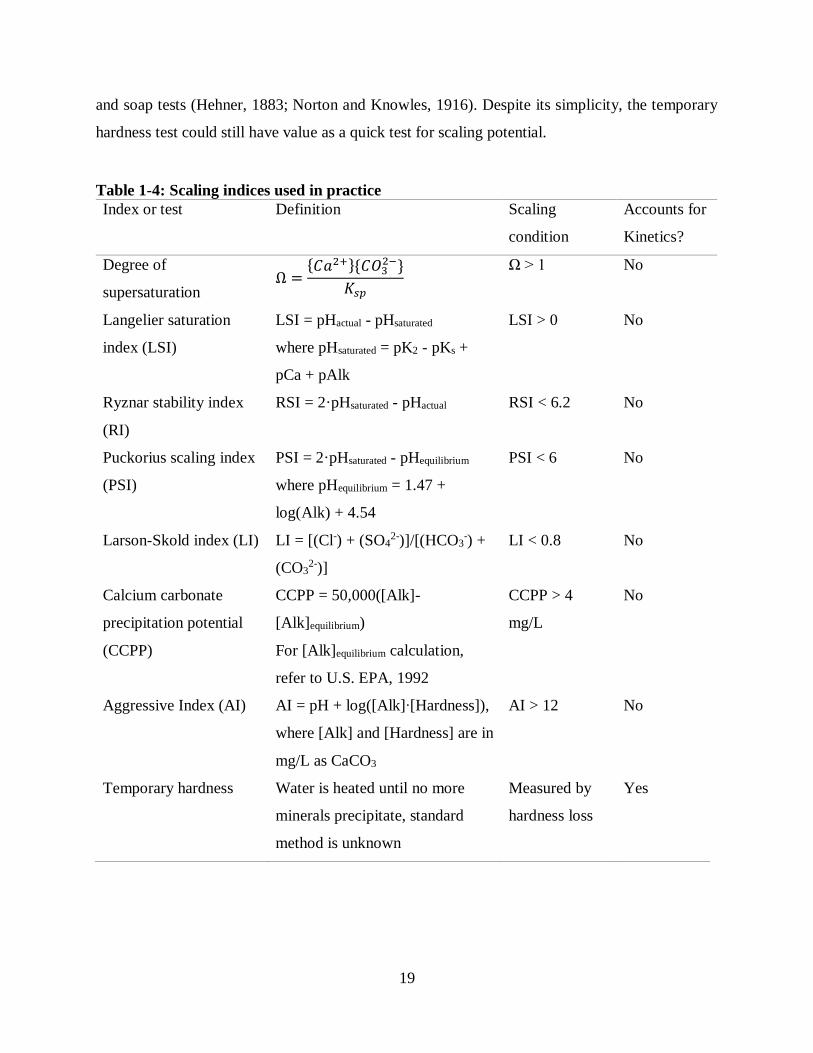
The problems caused by scaling have led to the development of numerous scaling indices (Table
1-4) to monitor CaCO3 formation in potable water systems. Degree of supersaturation (Ω) is the
most widely accepted scaling index, however, it only accounts for chemical equilibrium in
determining whether scaling will occur, and does not account for reaction kinetics. As discussed
in the previous sections, CaCO3 precipitation and dissolution can occur very slowly, especially in
the presence of natural and artificial scaling inhibitors—thus calculation of Ω is only a first step to
predicting scaling in potable water systems. The only measure that takes into account actual
precipitation kinetics is temporary hardness. Temporary hardness represents the amount of
hardness that precipitates by boiling water, and was once widely applied as a practical way of
describing scaling potential of water heating systems. In practice, temporary hardness does not
often differentiate the precipitated solids so it is not only a measure of CaCO3 precipitation but
also of MgCO3 and sulfate salts (Greth, 1910; Buswell, 1916; Goudey, 1933). Temporary hardness
has also been defined strictly as carbonate hardness which in the past was measured by titration
Page 29
19
and soap tests (Hehner, 1883; Norton and Knowles, 1916). Despite its simplicity, the temporary
hardness test could still have value as a quick test for scaling potential.
Table 1-4: Scaling indices used in practice
Index or test Definition Scaling
condition
Accounts for
Kinetics?
Degree of
supersaturation Ω =
𝐶𝑎2+𝐶𝑂32−
𝐾𝑠𝑝
Ω > 1 No
Langelier saturation
index (LSI)
LSI = pHactual - pHsaturated
where pHsaturated = pK2 - pKs +
pCa + pAlk
LSI > 0 No
Ryznar stability index
(RI)
RSI = 2·pHsaturated - pHactual RSI < 6.2 No
Puckorius scaling index
(PSI)
PSI = 2·pHsaturated - pHequilibrium
where pHequilibrium = 1.47 +
log(Alk) + 4.54
PSI < 6 No
Larson-Skold index (LI) LI = [(Cl-) + (SO42-)]/[(HCO3
-) +
(CO32-)]
LI < 0.8 No
Calcium carbonate
precipitation potential
(CCPP)
CCPP = 50,000([Alk]-
[Alk]equilibrium)
For [Alk]equilibrium calculation,
refer to U.S. EPA, 1992
CCPP > 4
mg/L
No
Aggressive Index (AI) AI = pH + log([Alk]∙[Hardness]),
where [Alk] and [Hardness] are in
mg/L as CaCO3
AI > 12 No
Temporary hardness Water is heated until no more
minerals precipitate, standard
method is unknown
Measured by
hardness loss
Yes
Page 30
20
There are several more indices that aim to predict scaling in specific systems. The Langelier
saturation index (LSI) was first described in Langelier (1936) as a way to predict the formation of
a corrosion-resistant CaCO3 coating in distribution systems and has since been revised
(Wojtowicz, 2001). LSI has been called an oversimplification in that it assumes pH and CaCO3
saturation are the most important factors for corrosion control (Schneider and Stumm, 1964) and
it does not account for other dissolved calcium species or other forms of alkalinity (Kutty et al.,
1992). Dabrowski et al. (2010) tested the LSI on a water distribution system and found no
correlation between waters with LSI < 0 and a water’s aggressiveness.
Indices developed after LSI are similar to LSI in that they express CaCO3 undersaturation or
supersaturation, but take into account and emphasize different factors such as equilibrium pH and
non-carbonate hardness. The Ryznar stability index (RI) still uses pHsaturated like the LSI, however,
it recognizes calcium and alkalinity as more important parameters in determining scale formation
potential, thus pHsaturated is multiplied by a factor of 2 (Ryznar and Langelier, 1944). The RI was
successfully tested on real waters where it was determined that an RI < 6.2 should form scale. The
Puckorius scaling index (PSI) was formulated for cooling tower water and includes a term for
pHequilibrium, which depends on alkalinity (Puckorius and Brooke, 1991). PSI stresses the
importance of alkalinity in scale formation, because a higher alkalinity increases the water’s
buffering capacity such that more CaCO3 is able to precipitate before the water reaches equilibrium
pH. Unlike the other indices, the Larson-Skold index (LI) does not use pHsaturated in its calculation.
LI was originally intended for Great Lakes waters traveling through steel distribution lines (Larson
and Skold, 1958) and is best suited for waters of similar quality. LI considers the effect of Cl- and
SO42- on CaCO3 film formation, since higher Cl- and SO4
2- levels usually indicate a greater
presence of non-carbonate hardness (e.g. CaSO4), which is not conducive to scale formation in
potable water systems.
The aggressive index (AI) was developed to monitor the corrosiveness of water in asbestos cement
pipes. AI < 10 indicates a highly aggressive (corrosive) water and AI > 12 indicates a
nonaggressive water (NRC, 1982). Due to the AI’s simplicity, it could be considered one of the
weaker scaling indices, as it does not account for temperature or ionic strength like the other
indices do.
Page 31
21
The calcium carbonate precipitation potential (CCPP) is unique in that it attempts to quantify the
amount of CaCO3 that could precipitate. For the purpose of corrosion control, the EPA once
recommended that the CCPP should have a value of 4 - 10 mg/L to form a thin protective coating
(U.S. EPA, 1992). CCPP relies on the estimation of the equilibrium alkalinity, [Alk]equilibrium,
through an iterative process. Rossum and Merrill’s (1983) study comparing several scaling indices
found that CCPP is the best estimate of a water’s ability to deposit or dissolve CaCO3.
1.4.2 In-Situ Monitoring of Scale
Several in-situ methods have been used to monitor scale formation. These methods are often used
in experiments for the purpose of optimizing anti-scaling techniques. For water heating systems,
scale can be monitored by measuring changes in the overall heat transfer coefficient. Al-Deffeeri
(2007) implemented this method on a multi-stage flash distillation desalination process to optimize
it.
The use of focused beam reflection measurement (FBRM) has also proven capable of monitoring
scale formation (Al Nasser et al., 2008; Al Nasser et al., 2011). Instead of measuring the mass of
the deposited scale, the number of crystals deposited over the FBRM probe is measured as well as
the size distribution of these crystals.
Neville et al. (1999) tested the rotating disk electrode (RDE) method on detecting CaCO3 scale.
RDE is based on the oxygen reduction reaction; as scale accumulates over the RDE, less of the
surface is exposed to the bulk solution and the rate of oxygen reduction is slowed. One of the
benefits of RDE is that it is applicable to many waters of different quality and flow conditions.
1.5 Control and prevention of calcium carbonate scaling
To control and prevent CaCO3 scaling issues, the first and foremost step is to monitor the scaling
potential of drinking water (e.g. degree of supersaturation, Langelier saturation index) at different
points of the distribution system as discussed in Section 4. Once CaCO3 scaling potential is
Page 32
22
confirmed, different control and prevention methods might be applied for specific environmental
conditions and water compositions (Table 1-5).
Table 1-5: Control and prevention of CaCO3 scaling in drinking water systems Methods Likely effects Rationale
Control CaCO3 precipitation
Decrease hot water temperature Effective Solubility products of CaCO3 increase with decreasing water
temperature.
Decrease water pH Effective Saturation ratios of CaCO3 decrease with decreasing pH.
Remove dissolved Ca Effective Saturation ratios of CaCO3 decrease with decreasing dissolved Ca
concentration.
Control CaCO3 morphology Sometimes
effective
Reduce scaling potential, by preferring the CaCO3 polymorph with
a higher solubility product to form first.
Control the use of surface materials Sometimes
effective
Scaling potentials of CaCO3 are different on various surface
materials.
Control the location of CaCO3
formation
Sometimes
effective
Phosphates delay the formation of CaCO3, so that it occurs
throughout potable water systems.
Delay or prevent CaCO3 precipitation
Scale inhibitors Effective Delay or prevent CaCO3 precipitation completely, mostly by
adsorption of inhibitors onto CaCO3 nuclei.
Potential beneficial application of CaCO3
Control CaCO3 precipitation for
autogenous repair of pipe leaks
N/A Precipitation of CaCO3 is allowed. However, the precipitated CaCO3
particles can be used for autogenous repair of the leaks in drinking
water pipelines. (Tang et al., 2013)
Dutch pellet softening method Effective Precipitation of CaCO3 on calcite pellets removes supersaturation
when water passes through a column of calcite pellets. Contact time
and surface area are important parameters. (Schetters, 2013)
1.5.1 Controlling CaCO3 precipitation through water chemistry parameters
Temperature
Reducing water temperature is very effective in reducing CaCO3 scaling potential in potable water
systems. First, the solubility of all CaCO3 polymorphs (calcite, vaterite, aragonite, and amorphous
CaCO3) increase with decreasing temperature (Clarkson et al., 1992; Plummer and Busenberg,
1982), causing less CaCO3 to precipitate at lower temperature. Second, the reaction kinetics for
CaCO3 formation is much slower at lower temperatures (Morse et al., 2007), thereby forming less
Page 33
23
CaCO3 precipitates. Finally, polyphosphates, which are widely present in potable water systems
and are stronger inhibitors for CaCO3 precipitation than orthophosphate (Lin and Singer, 2005),
are converted into orthophosphate much faster at higher temperature through hydrolysis reactions
(Holm and Edwards, 2003). Hence, at a lower temperature, more polyphosphates are present and
will inhibit CaCO3 precipitation more. However, the temperature drop for hot water might cause
Opportunistic Premise Plumbing Pathogens (OPPPs), including Legionella pneumophila, to grow
and transmit in drinking water systems and cause potential human health problems (ASHRAE,
2015).
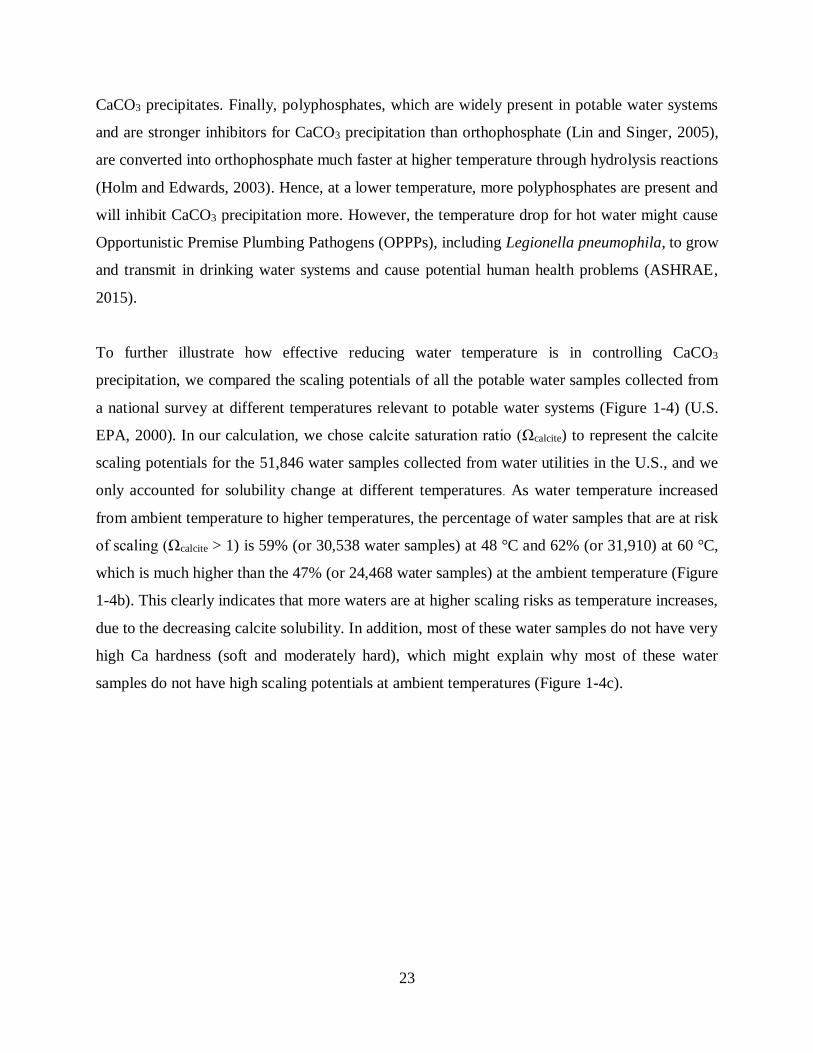
To further illustrate how effective reducing water temperature is in controlling CaCO3
precipitation, we compared the scaling potentials of all the potable water samples collected from
a national survey at different temperatures relevant to potable water systems (Figure 1-4) (U.S.
EPA, 2000). In our calculation, we chose calcite saturation ratio (Ωcalcite) to represent the calcite
scaling potentials for the 51,846 water samples collected from water utilities in the U.S., and we
only accounted for solubility change at different temperatures. As water temperature increased
from ambient temperature to higher temperatures, the percentage of water samples that are at risk
of scaling (Ωcalcite > 1) is 59% (or 30,538 water samples) at 48 °C and 62% (or 31,910) at 60 °C,
which is much higher than the 47% (or 24,468 water samples) at the ambient temperature (Figure
1-4b). This clearly indicates that more waters are at higher scaling risks as temperature increases,
due to the decreasing calcite solubility. In addition, most of these water samples do not have very
high Ca hardness (soft and moderately hard), which might explain why most of these water
samples do not have high scaling potentials at ambient temperatures (Figure 1-4c).
Page 34
24
Figure 1-4 Scaling potential in potable water systems throughout the U.S.: The scaling
potentials of water samples collected from a national survey at different temperatures relevant to
potable water systems (U.S. EPA, 2000). (a) Histogram of saturation ratio of calcite (Ωcalcite) at
various temperatures, (b) the percentage of water samples at scaling risks (Ωcalcite >1), and (c) the
percentage of water samples at different Ca hardness levels. The saturation ratio of calcite was
calculated for 48 oC and 60 oC, in addition to the ambient temperature provided in the national
survey (U.S. EPA, 2000). MATLAB was used to calculate Ωcalcite for 51,846 water samples that
have all four parameters of temperature, pH, alkalinity, and Ca hardness. The change of
equilibrium constants (K) and solubility products (Ksp) with temperature was accounted for using
the K and Ksp values and H at 25 oC from MINEQL+. Ca-containing species considered included
Ca2+, CaHCO3+, CaOH+, and CaCO3(aq).
Page 35
25
Water pH
Reducing water pH and removing dissolved Ca content can reduce scaling potential by decreasing
the ion activity product (𝑄 = 𝐶𝑎2+𝐶𝑂32−). However, engineers should be careful when
considering reducing water pH in drinking water systems, because the decrease in water pH might
cause corrosion of metallic pipelines.
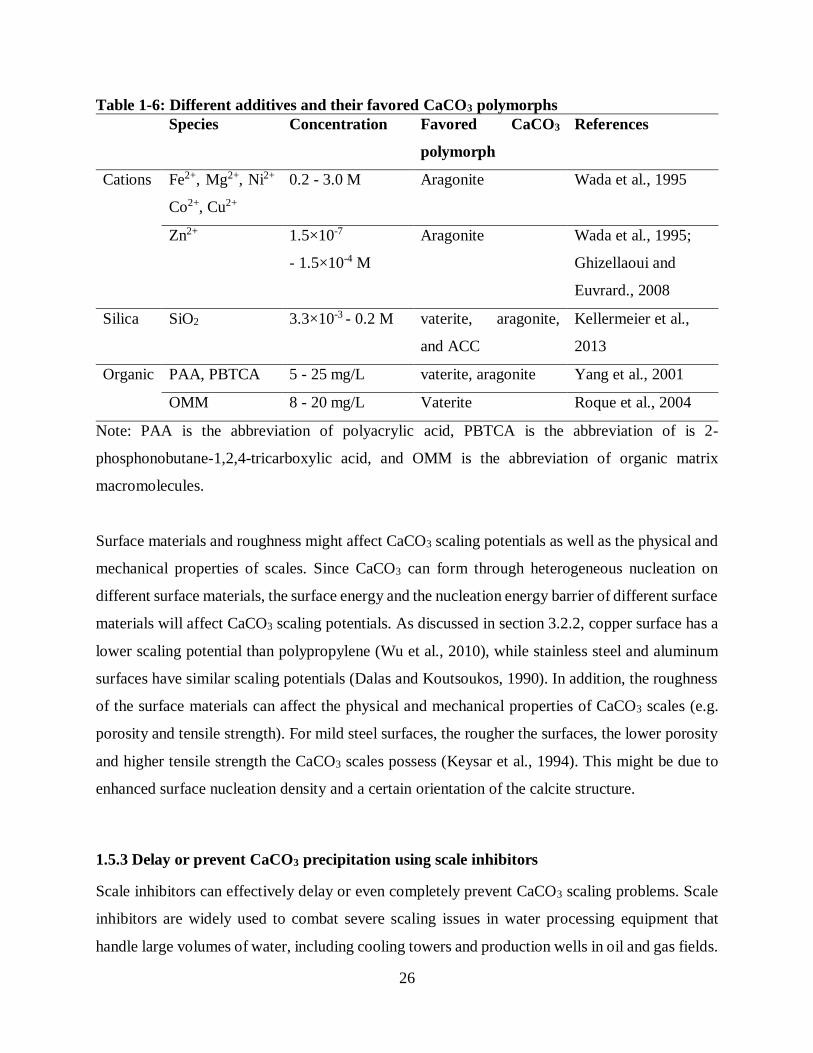
1.5.2 Other methods that might be effective in controlling CaCO3 scaling
Stabilization of metastable CaCO3 polymorphs over calcite by including different additives might
be effective in controlling CaCO3 scaling potential. Additives, including metal cations, silica and
organic species, can help stabilize metastable CaCO3 polymorphs, such as aragonite, vaterite and
ACC (Table 1-6). Zn2+ is the only additive that has been reported to help avoid massive calcite
scaling when dosed at a concentration relevant to drinking water (1.5×10⁻⁷ - 1.5×10⁻⁴ M), by
preferring aragonite nuclei to form instead of calcite. As a result, Zn can co-precipitate into
aragonite nuclei or adsorb on aragonite nuclei and inhibit the further growth of CaCO3 crystals
(Wada et al., 1995; Ghizellaoui and Euvrard, 2008). Other additives must be dosed at
concentrations that are much higher than their typical concentrations in drinking water. For
example, when silica is added at a concentration of 3.3×10⁻³ - 0.2 M, metastable CaCO3
polymorphs can be stabilized to co-exist with calcite for as long as 2 hours at 50 oC and 80 oC
(Kellermeier et al., 2013).
Page 36
26
Table 1-6: Different additives and their favored CaCO3 polymorphs
Species Concentration Favored CaCO3
polymorph
References
Cations Fe2+, Mg2+, Ni2+
Co2+, Cu2+
0.2 - 3.0 M
Aragonite Wada et al., 1995
Zn2+ 1.5×10⁻⁷
- 1.5×10⁻⁴ M
Aragonite Wada et al., 1995;
Ghizellaoui and
Euvrard., 2008
Silica SiO2 3.3×10⁻³ - 0.2 M vaterite, aragonite,
and ACC
Kellermeier et al.,
2013
Organic PAA, PBTCA 5 - 25 mg/L vaterite, aragonite Yang et al., 2001
OMM 8 - 20 mg/L Vaterite Roque et al., 2004
Note: PAA is the abbreviation of polyacrylic acid, PBTCA is the abbreviation of is 2-
phosphonobutane-1,2,4-tricarboxylic acid, and OMM is the abbreviation of organic matrix
macromolecules.
Surface materials and roughness might affect CaCO3 scaling potentials as well as the physical and
mechanical properties of scales. Since CaCO3 can form through heterogeneous nucleation on
different surface materials, the surface energy and the nucleation energy barrier of different surface
materials will affect CaCO3 scaling potentials. As discussed in section 3.2.2, copper surface has a
lower scaling potential than polypropylene (Wu et al., 2010), while stainless steel and aluminum
surfaces have similar scaling potentials (Dalas and Koutsoukos, 1990). In addition, the roughness
of the surface materials can affect the physical and mechanical properties of CaCO3 scales (e.g.
porosity and tensile strength). For mild steel surfaces, the rougher the surfaces, the lower porosity
and higher tensile strength the CaCO3 scales possess (Keysar et al., 1994). This might be due to
enhanced surface nucleation density and a certain orientation of the calcite structure.
1.5.3 Delay or prevent CaCO3 precipitation using scale inhibitors
Scale inhibitors can effectively delay or even completely prevent CaCO3 scaling problems. Scale
inhibitors are widely used to combat severe scaling issues in water processing equipment that
handle large volumes of water, including cooling towers and production wells in oil and gas fields.
Page 37
27
These scale inhibitors generally include phosphonates, phosphate esters, polyacrylates and
phosphates (Matty and Tomson, 1988; Shakkthivel and Vasudevan, 2006; Xyla et al., 1992).
However, most of these inhibitors are not used in drinking water systems (except polyphosphates
or phosphates).
Inorganic cations Mg2+ and Zn2+ that are readily present in drinking water systems can act as scale
inhibitors (Table 1-7). Addition of Mg2+ at a concentration of 10-3 M and above can significantly
inhibit calcite precipitation (Reddy and Wang, 1980; Lin and Singer, 2009). The mechanism
behind the inhibiting effect of Mg2+ has been confirmed as the adsorption of Mg2+ onto calcite
active crystal growth sites (or kinks) and subsequent kink blocking (Lin and Singer, 2009; Nielsen
et al., 2013), rather than the previously proposed mechanisms of increasing the mineral solubility
by incorporating Mg2+ into calcite (or incorporation inhibition) (Davis et al., 2000). Addition of
Zn2+ at a much smaller concentration (~10-7 M) can also significantly inhibit calcite precipitation
(Ghizellaoui and Euvrard, 2008). It is possible Zn2+ can inhibit CaCO3 (calcite or aragonite)
precipitation through either kink blocking or incorporation inhibition, but the exact mechanism
behind this inhibiting effect by Zn2+ has not yet been identified. However, no threshold values can
be identified for either Mg2+ or Zn2+, because they reduce the CaCO3 precipitation rate even at
very low concentrations, rather than abruptly halt calcite precipitation once a threshold value is
reached.
Other organic inhibitors that widely exist in drinking water systems are phosphates and natural
organic matter (or NOM) (Table 1-7). Lin and Singer systematically studied the inhibiting effects
of orthophosphate (PO43-), pyrophosphate (P2O7
4-), tripolyphosphate (P3O105-),
hexametaphosphate (P6O186-) and binary-polyphosphate blends, and suggested that a total P
concentration of 10-8 M and above can inhibit calcite precipitation (Lin and Singer, 2006; Lin and
Singer, 2005a). The reason for this inhibiting effect is the adsorption of phosphates onto calcite
crystal growth sites and blocking further growth. NOM, such as fulvic acid and humic acid, can
also inhibit calcite precipitation through a similar mechanism to phosphates (Lin et al., 2005; Hoch
et al., 2000).
Page 38
28
Table 1-7: Effective concentrations of CaCO3 scale inhibitors in drinking water systems
Scale inhibitors Effective concentration References
Inorganic inhibitors Mg2+ 6 ~ 21 (×10-3 M) Lin and Singer, 2009
Zn2+ 2 ~7 (×10-7 M) Ghizellaoui and Euvrard, 2008
Organic inhibitors Phosphates 1 1 ~ 5 (×10-8 M) Lin and Singer, 2005a
Lin and Singer, 2006
NOM 2 1 ~ 5 (mg/L) Lin et al., 2005
1 Phosphates include orthophosphate, pyrophosphate, tripolyphosphate and hexametaphosphate.
2 NOM includes Suwannee River fulvic acid, Pacific Ocean fulvic acid, and Williams Lake
hydrophobic organic acid.
Phosphates can be used to advantageously control the location of CaCO3 formation in potable
water systems. Addition of excess lime may only tend to coat the pipeline near the point of addition
(Hatch, 1942). However, addition of orthophosphate (Hatch, 1942) and polyphosphate (Hasson
and Karmon, 1981; McCauley, 1960), including hexametaphosphate (Primus and Hunhoff, 1972),
to supersaturated waters could delay precipitation or prevent it completely, potentially extending
the distance that pipes are coated from CaCO3 formation.
1.5.4 Potential beneficial application of CaCO3 precipitation for autogenous repair
Although usually considered harmful, CaCO3 precipitation might be potentially beneficial when
manipulated to repair leaks in drinking water systems via autogenous repair (i.e., leak self-repair)
(Edvardsen, 1999; Clear, 1985; Tang et al., 2013). Autogenous repair is a promising and low cost
approach to leak repair that can be achieved by manipulating the water chemistry and formation
of CaCO3 (e.g., calcite) to clog small leaks (holes typically ≈ 10 µm diameter) (Tang et al., 2013).
If successfully applied, autogenous repair through CaCO3 precipitation might help stop water
losses that cost about $3 billion per year (FHWA, 2002), and extend the lifetime of the critically
important and aging drinking water infrastructure that is expected to cost at least $1 trillion to
repair, replace and upgrade through 2035, according to an estimate by the American Water Works
Association (AWWA) (Shanaghan, 2012).
Page 39
29
The possible mechanisms of autogenous repair by CaCO3 precipitation are either the formation of
precipitates directly in leaks (smart precipitation) or the clogging of the leaks when precipitates
pass through the leaks (physical clogging) (Figure 1-5) (Tang et al., 2013). It is even possible that
these two mechanisms may be operative simultaneously.
Figure 1-5 Autogenous repair of leaks by CaCO3 precipitation in drinking water pipelines:
(a) smart precipitation and (b) physical clogging. (Adopted from Tang et al., 2013)
One potential problem of autogenous repair or clogging by CaCO3 precipitation is the long-term
resistance to dissolution and longevity of the repair. It is possible that the repair materials (i.e.
CaCO3) might start to dissolve, once a water that is undersaturated with respect to CaCO3 is
pumped through the drinking water pipelines. However, since CaCO3 dissolution is not very fast
at pH ≥ 5 (Morse and Arvidson, 2002) and ambient temperature, the repair might be relatively
long-lived, even when the water is relatively undersaturated.
1.5.5 Combating scaling by homeowners
Various water treatment devices have become commercially available for homeowners to combat
scaling issues (Table 1-8), and most of them have a strong scientific basis. First, ion exchange
softeners are designed to exchange Ca2+ with Na+, reducing the dissolved Ca2+ concentration and
scaling potentials in drinking water. Second, membrane treatments (nanofilters and reverse
osmosis) can remove dissolved Ca2+ and inorganic carbon to reduce scaling potential, without
introducing net extra salinity into the drinking water systems considering both reject water and
treated water streams. Third, surface catalyzed crystallization induces CaCO3 precipitation during
the treatment process itself, so that future scaling potential can be greatly reduced. Finally,
Page 40
30
reducing water heater temperature can be easily achieved by homeowners, and reduces scaling
potentials by making all CaCO3 solids more soluble at lower temperatures.
However, researchers are still dubious about the effects of magnetic antifouling, electronic
antifouling and electrostatic devices on treating CaCO3 scaling issues. These devices have been
marketed for half a century, and vendors generally claim that these devices can reduce scaling by
applying a magnetic field using either a permanent magnet or a temporary electromagnetic field
generated by electron currents (Powell, 1998). A literature review by Powell (1998) suggests that
there is little scientific data to support the claims of these devices, and a systematic experimental
study by Limpert and Raber (1985) proved that eight electrostatic, magnetic and electromagnetic
devices did not significantly reduce CaCO3 scaling. However, Al Nasser et al. (2011) has observed
a slight decrease in the scaling rates of CaCO3 with the usage of electronic antifouling. They
suggested that the conversion of calcite to vaterite, which is more soluble at 25 °C, might
contribute to the decreased scaling rates of CaCO3.
Page 41
31
Table 1-8: Effects of common scaling prevention practices available for homes and
buildings Scaling prevention
strategy
Advantages Disadvantages Mechanisms References
Ion exchange
softener
Frequently used;
Softens water
Regeneration cycles add
large amounts of salt to
sewage and environment
Remove
dissolved Ca
Edzwald,
2011
Nanofilters and
Reverse osmosis
membranes
High Ca2+ rejection (>90%);
No net salinity addition to sewage
Energy intensive;
Large amount of water is
wasted
Remove
dissolved Ca
Edzwald,
2011
Dutch pellet
softening method
More effective than other
alternative strategies
Water must initially be
supersaturated with CaCO3
Remove
dissolved Ca
Schetters,
2013
Reduce water
heater temperature
Lowers scaling potential in water
heater;
Greater savings on energy
Increases likelihood of
pathogen formation (i.e.
Legionella pneumophila)
Increase the
solubility
products of
CaCO3 solids
Plummer and
Busenberg,
1982;
ASHRAE,
2015
Magnetic
antifouling devices
Inexpensive CaCO3 control
method;
Little to no maintenance
No agreed upon
mechanism of scaling
inhibition;
Questionable credibility
Weak scientific
basis
Powell,
1998;
Limpert and
Raber. 1985;
Al Nasser et
al., 2011
1.6 Knowledge Gaps
This review re-evaluated CaCO3 formation in potable water systems in the 21st century
considering global warming, autogenous repair/leak clogging, use of corrosion inhibitors, and
rising water temperatures in buildings and homes. Because of these emerging issues, research on
CaCO3 formation needs to be directed toward filling the following knowledge gaps: (1) Rising
water heater temperatures and atmospheric CO2 levels make it important to predict CaCO3
formation in water systems. (2) Previous work needs to be updated to predict CaCO3 scaling
potential in presence of inhibitors and higher water heater set-point temperatures. (3) Scaling
inhibitors such as phosphates or Zn2+ can control CaCO3 formation, however scaling may be
beneficial in protecting and repairing water pipelines.
Page 42
32
1.7 References
Al-Deffeeri, N.S. (2007). Heat transfer measurement as a criterion for performance evaluation of
scale inhibition in MSF plants in Kuwait. Desalination, 204, 423-436.
Al Nasser, W.N., Al Ruwaie, A.H., Hounslow, M.J., and Salman, A.D. (2011). Influence of
electronic antifouling on agglomeration of calcium carbonate. Powder Technology, 206,
201-207.
Al Nasser, W.N., Shaikh, A., Morriss, C., Hounslow, M.J., and Salman, A.D. (2008).
Determining kinetics of calcium carbonate precipitation by inline technique. Chemical
Engineering Science, 63, 1381-1389.
American Society of Heating, Refrigerating, and Air-Conditioning Engineers (ASHRAE).
(2015). Legionellosis: Risk Management for Building Water Systems. Atlanta, GA:
ANSI/ASHRAE.
American Water Works Association (AWWA). (2012). Buried No Longer: Confronting
America’s Water Infrastructure Challenge. Denver, CO: AWWA.
American Water Works Association Research Foundation (AWWARF). (1996). Internal
Corrosion of Water Distribution Systems, 2nd ed. Denver, CO: AWWA
Amor, M.B., Zgolli, D., Tlili, M.M., and Manzola, A.S. (2004). Influence of water hardness,
substrate nature and temperature on heterogeneous calcium carbonate nucleation.
Desalination, 166, 79-84.
Anderson, P.W. and Faust, S.D. (1972). Impact of drought on quality in a New Jersey water
supply system. Water Resources Bulletin (American Water Works Association), 8(4),
750-760.
Andritsos, N. and Karabelas, A.J. (2003). Calcium carbonate scaling in a plate heat exchanger in
the presence of particles. International Journal of Heat and Mass Transfer, 46, 4613-
4627.
Baylis, J.R. (1935). Treatment of water to prevent corrosion. Journal American Water Works
Association, 29(2), 220-234.
Berner, R.A. and Morse, J.W. (1974). Dissolution kinetics of calcium carbonate in sea water IV.
Theory of calcite dissolution. American Journal of Science, 274, 108-134.
Brazeau, R.H. and Edwards, M.E. (2011). A review of the sustainability of residential hot water
infrastructure: public health, environmental impacts, and consumer drivers. Journal of
Page 43
33
Green Building, 6(4), 77-95.
Bremere, I., Kennedy, M., Michel, P., Emmerik, R., Witkamp, G., and Schippers, J. (1999).
Controlling scale in membrane filtration systems using a desupersaturation unit.
Desalination, 124, 51-62.
Brezonik, P.L. and Arnold, W.A. (2011). Water Chemistry: An Introduction to the Chemistry of
Natural and Engineering Aquatic Systems. New York, NY: Oxford University Press.
Buswell, A.M. (1916). A comparison of “temporary hardness” with alkalinity in natural waters.
Journal American Water Works Association, 3(4), 959-961.
Cheong, W.C., Gaskell, P.H., and Neville, A. (2013). Substrate effect on surface
adhesion/crystallisation of calcium carbonate. Journal of Crystal Growth, 363, 7-21.
Chou, L., Garrels, R.M., and Wollast, R. (1989). Comparative study of the kinetics and
mechanisms of dissolution of carbonate minerals. Chemical Geology, 78, 269-282.
Clarkson, J.R., Price, T.J., and Adams, C.J. (1992). Role of metastable phases in the spontaneous
precipitation of calcium carbonate. Journal of the Chemical Society, Faraday
Transactions, 88(2), 243-249.
Clear, C.A. (1985). The effects of autogenous healing upon the leakage of water through cracks
in concrete. Wexham, Slough, UK: Cement and Concrete Association.
Crabtree, M., Eslinger, D., Fletcher, P., Miller, M., Johnson, A., and King, G. (1999). Fighting
scale – removal and prevention. Oilfield Review, autumn 1999, 30-45.
Dąbrowski, W., Buchta, R., Dąbrowska, B., and Mackie, R.I. (2010). Calcium carbonate
equilibria in water supply systems. Environment Protection Engineering, 36(2), 75-94.
Dalas, E., Kallitsis, J., and Koutsoukos, P.G. (1988). The crystallization of calcium carbonate on
polymeric substrates. Journal of Crystal Growth, 89, 287-294.
Dalas, E. and Koutsoukos, P.G. (1990). Calcium carbonate scale formation and prevention in a
flow-through system at various temperatures. Desalination, 78, 403-416.
Davis, K.J., Dove, P.M., and De Yoreo, J.J. (2000). The role of Mg2+ as an impurity in calcite
growth. Science, 290, 1134-1137.
DeMartini, F.E. (1938). Corrosion and the Langelier calcium carbonate saturation index. Journal
American Water Works Association, 30(1), 85-111.
Dobersek, D. and Goricanec, D. (2007). Influence of water scale on thermal flow losses of
domestic applicances. International Journal of Mathematical Models and Methods in
Page 44
34
Applied Sciences, 2(1), 55-61.
Edvardsen, C. (1999). Water permeability and autogenous healing of cracks in concrete. ACI
Materials Journal, 96(4), 448-454.
Edzwald, J.K. (2011). Water Quality and Treatment: A Handbook on Drinking Water. Denver,
CO: AWWA.
Energy Star (United States Department of Energy and United States Environmental Protection
Agency). (n.d.). 2014 Federal tax credits.
http://www.energystar.gov/about/federal_tax_credits/2014_federal_tax_credits (Accessed
12 Nov. 2015).
Evans, C.D., Chapman, P.J., Clark, J.M., Monteith, D.T., and Cresser, M.S. (2006). Alternative
explanations for rising dissolved organic carbon export from organic soils. Global
Change Biology, 12, 2044-2053.
Federal Highway Administration Research and Technology (FHWA). (2002). Corrosion Costs
and Preventive Strategies in the United States. Washington, D.C.: U.S. Department of
Transportation.
Förster, M., Augustin, W., and Bohnet, M. (1999). Influence of the adhesion force crystal/heat
exchanger surface on fouling mitigation. Chemical Engineering and Processing, 38, 449-
461.
Fox, P. and Abbaszadegan, M. (2013). Impact of Scale Formation on Biofilm Growth in Premise
Plumbing. Naples, FL: Salt Institute.
Freeman, C., Evans, C.D., and Monteith, D.T. (2001). Export of organic carbon from peat soils.
Nature, 412, 785.
Freeman, C., Fenner, N., Ostle, N.J., Kang, H., Dowrick, D.J., Reynolds, B., Lock, M.A., Sleep,
D., Hughes, S., and Hudson, J. (2004). Export of dissolved organic carbon from peatlands
under elevated carbon dioxide levels. Nature, 430, 195-198.
Garrett-Price, B.A., Smith, S.A., Watts, R.L., and Knudsen, J.G. (1985). Fouling of Heat
Exchangers: Characteristics, Costs, Prevention, Control, and Removal. Park Ridge, NJ:
Noyes Publications.
Gebauer, D., Kellermeier, M., Gale, J.D., Bergström, L., and Cölfen, H. (2014). Pre-nucleation
clusters as solute precursors in crystallisation. Chemical Society Reviews, 43(7), 2348-
2371.
Page 45
35
Gebauer, D., Völkel, A., and Cölfen, H. (2008). Stable prenucleation calcium carbonate clusters.
Science, 322(5909), 1819-1822.
Ghizellaoui, S. and Euvrard, M. (2008). Assessing the effect of zinc on the crystallization of
calcium carbonate. Desalination, 220, 394-402.
Githens, R.E., Minor, W.R., and Tomsic, V.J. (1965). Flexible-tube heat exchangers. Chemical
Engineering Progress, 61(7), 55.
Goudey, R.F. (1933). The chemistry of water softening. Journal American Water Works
Association, 25(9), 1203-1206.
Greth, J.C.W. (1910). Water Purification Facts for Steam Users. Pittsburgh, PA: Wm. B. Schaife
& Sons Co.
Gwon, E., Yu, M., Oh, H., and Ylee, Y. (2003). Fouling characteristics of NF and RO operated
for removal of dissolved matter from groundwater. Water Research, 37, 2989-2997.
Hasson, D. and Karmon, M. (1981). Method for calcite coating on the inner surface of pipes.
United States Patent no. US4264651
Hatch, G.B. (1942). Control of calcium carbonate deposition for corrosion inhibition. United
States Patent no. US2299748.
Hearn, N. (1998). Self-sealing, autogenous healing and continued hydration: what is the
difference? Materials and Structures, 31, 563-567.
Hehner, O. (1883). Estimation of hardness without soap solution. Analyst, 8, 77-81.
Hoch, A.R., Reddy, M.M., and Aiken, G.R. (2000). Calcite crystal growth inhibition by humic
substances with emphasis on hydrophobic acids from the Florida Everglades. Geochimica
et Cosmochimica Acta, 64, 61-72.
Holm, T.R. and Edwards, M. (2003). Metaphosphate reversion in laboratory and pipe-rig
experiments. Journal American Water Works Association, 95(4), 172-178.
Houska, C. (2007). Deicing salt – recognizing the corrosion threat. International Molybdenum
Association, Pittsburgh, TMR Consulting.
Jaćimović, N., Stamenić, M., Kolendić, P., Đorđević, D., Radanov, B., and Vladić, L. (2015). A
novel method for the inclusion of pipe roughness in the Hazen-Williams Equation. FME
Transactions, 43, 35-39.
Kazmierczak, T.F., Tomson, M.B., and Nancollas, G.H. (1982). Crystal growth of calcium
carbonate. A controlled composition kinetic study. The Journal of Physical Chemistry,
Page 46
36
86, 103-107.
Kellermeier, M., Glaab, F., Klein, R., Melero-García, E., Kunz, W., and García-Ruiz, J.M.
(2013). The effect of silica on polymeric precipitation of calcium carbonate: an on-line
energy-dispersive x-ray diffraction (EDXRD) study. Nanoscale, 5, 7054-7065.
Keysar, S., Semiat, R., Hasson, D., and Yahalom, J. (1994). Effect of surface roughness on the
morphology of calcite crystallization in mild steel. Journal of Colloid and Interface
Science, 162, 311-319.
Kralj, D. and Vdović, N. (2000). The influence of some naturally occurring minerals on the
precipitation of calcium carbonate polymorphs. Water Research, 34(1), 179-184.
Krappe, J.M. (1940). Scale Formation in Water Heaters. Lafayette, IN, USA: Purdue University.
Kutty, P.C.M., Nomani, A.A., and Al-Sulami, S. (1992). Simple experimental method to
determine CaCO3 precipitation tendency in desalinated water. In First Gulf Water
Conference, October, 685-708, Dubai, UAE.
Lam, R.S.K., Charnock, J.M., Lennie, A., and Meldrum, F.C. (2007). Synthesis-dependent
structural variations in amorphous calcium carbonate. CrystEngComm, 9, 1226-1236.
Langelier, W.F. (1936). The analytical control of anti-corrosion water treatment. Journal
American Water Works Association, 28(10), 1500-1521.
Larson, T.E. and Skold, R.V. (1957). Corrosion and tuberculation of cast iron. Journal American
Water Works Association, 49(10), 1294-1302.
Larson, T.E. and Skold, R.V. (1958). Laboratory studies relating mineral quality of water to
corrosion of steel and cast iron. Corrosion, 14(6), 43-46.
Lebron, I. and Suarez, D.L. (1996). Calcite nucleation and precipitation kinetics as affected by
dissolved organic matter at 25 °C and pH > 7.5. Geochimica et Cosmochimica Acta,
60(15), 2765-2776.
Limpert, G.J.C. and Raber, J.L. (1985). Tests of nonchemical scale control devices in a once-
through system. Materials Performance, 24(10), 40-45.
Lin, Y. and Singer, P.C. (2005a). Inhibition of calcite crystal growth by polyphosphates. Water
Research, 39, 4835-4843.
Lin, Y. and Singer, P.C. (2005b). Effect of seed material and solution composition on calcite
precipitation. Geochimica et Cosmochimica Acta, 69(18), 4495-4504.
Lin, Y. and Singer, P.C. (2006). Inhibition of calcite precipitation by orthophosphate: speciation
Page 47
37
and thermodynamic considerations. Geochimicha et Cosmochimica Acta, 70, 2530-2539.
Lin, Y. and Singer, P.C. (2009). Effect of Mg2+ on the kinetics of calcite crystal growth. Journal
of Crystal Growth, 312, 136-140.
Lin, Y., Singer, P.C., and Aiken, G.R. (2005). Inhibition of calcite precipitation by natural
organic material: kinetics, mechanism, and thermodynamics. Environmental Science and
Technology, 39, 6420-6428.
Lioliou, M.G., Paraskeva, C.A., Koutsoukos, P.G., and Payatakes, A.C. (2007). Heterogeneous
nucleation and growth of calcium carbonate on calcite and quartz. Journal of Colloid and
Interface Science, 308, 421-428.
Liu, C.Z., Lin, C.H., Yeh, M.S., Chao, Y.M., and Shen, P. (2010). Surface modification and
planar defects of calcium carbonates by magnetic water treatment. Nanoscale Research
Letters, 5, 1982-1991.
Logsdon, G.S., Hess, A.F., Chipps, M.J., and Rachwal, A.J. (2002). Filter Maintenance and
Operations Guidance Manual. Denver, CO: AWWA.
MacAdam, J. and Parsons, S.A. (2004a). Calcium carbonate scale formation and control.
Reviews in Environmental Science and Bio/Technology, 3, 159-169.
MacAdam, J. and Parsons, S.A. (2004b). Calcium carbonate scale control, effect of material and
inhibitors. Water Science and Technology, 49(2), 153-159.
Matty, J.M. and Tomson, M.B. (1988). Effects of multiple precipitation inhibitors on calcium
carbonate nucleation. Applied Geochemistry, 3(5), 549-556.
McCauley, R.F. (1960). Calcite coating protects water pipes. Water & Sewage Works, 107(7),
276-281.
Morse, J.W. (1983). The kinetics of calcium carbonate dissolution and precipitation. Reviews in
Mineralogy and Geochemistry, 11, 227-264.
Morse, J.W. and Arvidson, R.S. (2002). The dissolution kinetics of major sedimentary carbonate
minerals. Earth Science Reviews, 58(1-2), 51-84.
Morse, J.W., Arvidson, R.S., and Lüttge, A. (2007). Calcium carbonate formation and
dissolution. Chemical Reviews, 107(2), 342-381.
Mosley, L.M. (2015). Drought impacts on the water quality of freshwater systems; review and
integration. Earth-Science Reviews, 140, 203-214.
Müller-Steinhagen, H. (2000). Heat Exchanger Fouling: Mitigation and Cleaning Technologies.
Page 48
38
Rugby, Warwickshire, UK: Institution of Chemical Engineers.
Müller-Steinhagen, H. and Zhao, Q. (1997). Investigation of low fouling surface alloys made by
ion implantation technology. Chemical Engineering Science, 52(19), 3321-3332.
Mullin, J.W. (2001). Nucleation. In: Crystallization, 4th Ed. Oxford, UK: Butterworth-
Heinemann.
Nancollas, G.H. and Reddy, M.M. (1971). The crystallization of calcium carbonate – II. Calcite
growth mechanism. Journal of Colloid and Interface Science, 37(4), 824-830.
National Research Council (NRC). (1982). Drinking Water and Health, Vol. 4. Washington, DC:
National Academy Press.
Neville, A., Hodgkiess, T., and Morizot, A.P. (1999). Electrochemical assessment of calcium
carbonate deposition using a rotating disk electrode (RDE). Journal of Applied
Electrochemistry, 29, 455-462.
Ng, J.D., Lorber, B., Witz, J., Théobald-Dietrich, A., Kern, D., and Giegé, R. (1996). The
crystallization of biological macromolecules from precipitates: evidence for Ostwald
ripening. Journal of Crystal Growth, 168, 50-62.
Nielson, L.C., De Yoreo, J.J., and DePaolo, D.J. (2013). General model for calcite growth
kinetics in the presence of impurity ions. Geochimica et Cosmochimica Acta, 115, 100-
114.
Norton, J.F. and Knowles, H.I. (1916). A study of indicators for the determination of temporary
hardness in water. Journal of the American Chemical Society, 38(4), 877-884.
Ogino, T., Suzuki, T., and Sawada, K. (1987). The formation and transformation mechanism of
calcium carbonate in water. Geochimica et Cosmochimica Acta, 51(10), 2757-2767.
Pääkkönen, T.M., Riihimäki, M., Puhakka, E., Muurinen, E., Simonson, C.J., and Keiski, R.L.
(2009). Crystallization fouling of CaCO3 – effect of bulk precipitation on mass deposition
on the heat transfer surface. Proceedings of International Conference on Heat Exchanger
Fouling and Cleaning VIII, 209-216.
Parks, J., Edwawrds, M, Vikesland, P., and Dudi, A. (2010). Effects of bulk water chemistry on
autogenous healing of concrete. Journal of Materials in Civil Engineering, 22(5), 515-
524.
Pitman, R.M. (2006). Wood ash use in forestry – a review of the environmental impacts.
Forestry, 79(5), 563-588.
Page 49
39
Plummer, L.N. and Busenberg, E. (1982). The solubilities of calcite, aragonite and vaterite in
CO2-H2O solutions between 0 and 90 °C, and an evaluation of the aqueous model for the
system CaCO3-CO2-H2O. Geochimica et Cosmochimica Acta, 46, 1011-1040.
Plummer, L.N., Wigley, T.M.L., and Parkhurst, D.L. (1978). The kinetics of calcite dissolution
in CO2-water systems at 5° to 60°C and 0.0 to 1.0 atm CO2. American Journal of Science,
278, 179-216.
Pollio, M.V. (1960). Vitruvius: The Ten Books on Architecture. Translated by Morgan, M.H.
Cambridge, MA: Harvard University Press.
Powell, M.R. (1998). Magnetic water and fuel treatment: myth, magic, or mainstream science?
Skeptical Inquirer, 22.1.
Primus, N.S. and Hunhoff, R. (1972). Method for Lining Pipes with Calcite. United States Patent
no. US3640759
Puckorius, P.R. and Brooke, J.M. (1991). A new practical index for calcium carbonate scale
prediction in cooling tower systems. Corrosion, 47(4), 280-284.
Reddy, M.M., Plummer, L.N., and Busenberg, E. (1981). Crystal growth of calcite from calcium
bicarbonate solutions at constant PCO2 and 25 °C: a test of a calcite dissolution model.
Geochimica et Cosmochimica Acta, 45, 1281-1289.
Reddy, M.M. and Wang, K.K. (1980). Crystallization of calcium carbonate in the presence of
metal ions: I. Inhibition by magnesium ion at pH 8.8 and 25 °C. Journal of Crystal
Growth, 50(2), 470-480.
Rodriguez-Hornedo, N. and Murphy, D. (1999). Significance of controlling crystallization
mechanisms and kinetics in pharmaceutical systems. Pharmaceutical Sciences, 88(7),
651-660.
Roqué, J., Molera, J., Vendrell-Saz, M., and Salvadó, N. (2004). Crystal size distributions of
induced calcium carbonate crystals in polyaspartic acid and Mytilus edulis acidic organic
proteins aqueous solutions. Journal of Crystal Growth, 262, 543-553.
Rossum, J.R. and Merrill, D.T. (1983). An evaluation of the calcium carbonate saturation
indexes. Journal American Water Works Association, 75(2), 95-100.
Roy, S. and Edwards, M.E. (2015). Role of water hardness precipitation and flashing cavitation
in erosion corrosion of copper in potable water systems. In 134th AWWA Annual
Conference and Exposition (ACE), 7-8 June, Anaheim, CA.
Page 50
40
Royer, M., Davidson, J.H., Francis, L.F., and Mantell, S.C. (2010). Shear induced removal of
calcium carbonate scale from polypropylene and copper tubes. Journal of Solar Energy
Engineering, 132, 011013 (9 pages).
Ryznar, J.W. and Langelier, W.F. (1944). A new index for determining amount of calcium
carbonate scale formed by a water [with discussion]. Journal American Water Works
Association, 36(4), 472-486.
Sawada, K. (1997). The mechanisms of crystallization and transformation of calcium carbonates.
Pure and Applied Chemistry, 69(5), 921-928.
Schetters, M.J.A. (2013). Grinded Dutch calcite as seeding material in the pellet softening
process (Master’s thesis). Delft University of Technology, Delft, Netherlands.
Schneider, C.R. and Stumm, W. (1964). Evaluation of corrosion in distribution systems. Journal
American Water Works Association, 56(5), 621-632.
Schock, M.R. (1989). Understanding corrosion control strategies for lead. Journal American
Water Works Association, 81(7), 88-100.
Seneviratne, M. (2007). A Practical Approach to Water Conservation for Commercial and
Industrial Facilities. Elsevier.
Shakkthivel, P. and Vasudevan, T. (2006). Acrylic acid-diphenylamine sulfonic acid copolymer
threshold inhibitor for sulfate and carbonate scales in cooling water systems.
Desalination, 197, 179-189.
Shanaghan, P.E. (2012). Assessing drinking water infrastructure need. Journal American Water
Works Association, 104(8), 14-15.
Sherman, L.A. and Barak, P. (1999). Solubility and dissolution kinetics of dolomite in Ca-Mg-
HCO3/CO3 solutions at 25 °C and 0.1 MPa carbon dioxide. Soil Science Society of
America Journal, 64(6), 1959-1968.
Stumm, W. (1956). Calcium carbonate deposition at iron surfaces. Journal American Water
Works Association, 48(3), 300-310.
Tang, M., Triantafyllidou, S., and Edwards, M. (2013). In situ remediation of leaks in potable
water supply systems. Corrosion Review, 31(3-6), 105-122.
Tang, M., Triantafyllidou, S., and Edwards, M. (2015). Autogenous metallic pipe leak repair in
potable water systems. Environmental Science and Technology, 49(14), 8697-8703.
Thomas, M., Hayden, A.C.S, and MacKenzie, D. (2006). Reducing GHG emissions through
Page 51
41
efficient water heating technologies. In EIC Climate Change Technology, 2006 IEEE, 10-
12 May, Ottawa, ON.
Troup, D.H. and Richardson, J.A. (1978). The link between corrosion and calcium carbonate
scaling susceptibilities of heat transfer surfaces. Werkstoffe und Korrosion, 29, 312-320.
United States Department of Energy (U.S. DoE). (n.d.). Tankless or demand-type water heaters.
http://energy.gov/energysaver/tankless-or-demand-type-water-heaters (Accessed 10 Nov.
2015).
United States Environmental Protection Agency (U.S. EPA). (1992). Lead and Copper Rule
Guidance Manual Volume II: Corrosion Control Treatment. Washington, DC: Office of
Water.
United States Environmental Protection Agency (U.S. EPA). (2000). Information Collection
Rule (ICR) Auxiliary 1 Database, Version 5.0 Query Tool, Version 2.0. Washington, DC:
NTIS.
Wada, N., Yamashita, K., and Umegaki, T. (1995). Effects of divalent cations upon nucleation,
growth and transformation of calcium carbonate polymorphs under conditions of double
diffusion. Journal of Crystal Growth, 148, 297-304.
Wang, Y., Davidson, J., and Francis, L. (2005). Scaling in polymer tubes and interpretation for
use in solar water heating systems. Journal of Solar Energy Engineering, 127, 3-14.
Water Quality Research Foundation (WQRF). (2011). Softened Water Benefits Study (Energy
and Detergent Savings). Lisle, IL: Water Quality Association.
Wiggin, T.H., Norcom, G.D., Glace, I.M., Davis, D.E., Olson, H.M., Ackerman, J.W., and
Alexander, C. (1938). Corrosion control – studies and operating experiences: a round
table discussion. Journal American Water Works Association, 30(8), 1342-1387.
Wojtowicz, J.A. (2001). A revised and updated saturation index equation. Journal of the
Swimming Pool and Spa Industry, 3(1), 28-34.
Wolf, S.E., Leiterer, J., Kappl, M., Emmerling, F., and Tremel, W. (2008). Early homogeneous
amorphous precursor stages of calcium carbonate and subsequent crystal growth in
levitated droplets. Journal of the American Chemical Society, 130(37), 12342-12347.
Wray, J.L. and Daniels, F. (1957). Precipitation of calcite and aragonite. Journal of the American
Chemical Society, 79(9), 2031-2034.
Wu, Z., Davidson, J.H., and Francis, L.F. (2010). Effect of water chemistry on calcium carbonate
Page 52
42
deposition on metal and polymer surfaces. Journal of Colloid and Interface Science, 343,
176-187.
Wu, Z., Francis, L.F., and Davidson, J.H. (2009). Scale formation on polypropylene and copper
tubes in mildly supersaturated tap water. Solar Energy, 83, 636-645.
Xyla, A.G., Giannimaras, E.K., and Koutsoukos, P.G. (1991). The precipitation of calcium
carbonate in aqueous solutions. Colloids and Surfaces, 53, 241-255.
Yang, Q., Ding, J., and Shen, Z. (2000). Investigation of calcium carbonate scaling on ELP
surface. Journal of Chemical Engineering of Japan, 33(4), 591-596.
Yang, Q., Liu, Y., Gu, A., Ding, J., and Shen, Z. (2001). Investigation of calcium carbonate
scaling inhibition and scale morphology by AFM. Journal of Colloid and Interface
Science, 240, 608-621.
Yang, Q., Liu, Y., Gu, A., Ding, J., and Shen, Z. (2002). Investigation of induction period and
morphology of CaCO3 fouling on heated surface. Chemical Engineering Science, 57,
921-931.
Page 53
43
Chapter 2: Autogenous Leak Repair via Inert Particle Clogging
2.1 Introduction
Fixing the aging water infrastructure in the United States (U.S.) is one of the grand challenges of
the 21st century. As many systems approach 100 years old, they have begun to fail at an alarming
rate. Nearly 5.9 billion gallons of water are lost every day in our water infrastructure due to leaks,
main breaks, and inaccurate meters (CNT, 2013). Consequences of small leaks, if they grow larger,
can include increased water loss and eventually catastrophic and expensive water main breaks—
240,000 main breaks occur in the U.S. every year (ASCE) (2013). Dirt and pathogens can also be
drawn into water mains through leaks (AWWARF, 2001), during brief depressurization events
(Walski and Lutes, 1994). Finally, water main leaks and breaks can cause property damage to
nearby buildings and infrastructure (i.e. flooding, pothole formation), and undermine roads.
In 2013, the ASCE gave the U.S. drinking water infrastructure a grade of D (ASCE, 2013). It is
estimated that the cost of repairing our existing infrastructure is $200 billion over the next 20 years
(Shanaghan, 2012). Conventional methods include repair, rehabilitation, and replacement, which
are effective but time consuming and expensive. Therefore, there is a continued demand for a more
cost-effective solution to fixing our leaking water infrastructure, as well as a desire to reduce the
frequency of leaks in the first place.
Novel methods of in situ repair of leaks have been proposed as promising temporary measure
(Tang et al., 2013) and have shown effective in lab-scale studies in concrete (Edvardsen, 1999;
Parks et al., 2010) and metallic (Tang et al., 2015) pipes. There are three mechanisms: (1) Metallic
corrosion, where leaks are repaired through the formation of iron or copper corrosion precipitates,
(2) precipitation, where leaks are repaired by clogging with water-formed particles such as CaCO3
or hydration products from concrete, and (3) physical clogging, where leaks are repaired via
blockage by waterborne particles. Among these three mechanisms, physical clogging is of the
potentially greatest application, because it might be applied to a wide range of pipe materials
including inert materials such as aged concrete and PVC (Tang et al., 2013).
Page 54
44
We conceptualize blockage of small pipe leaks by waterborne particles as a two step process
including 1) particle transport to the leak, and 2) deposition and formation of blockages within
leaks (Figure 2-1). The first step is practically important because, in concept, the leaks might be
quite distant from the point of introduction to the system, and the particles will be prevented from
reaching the leak if it settles out of the bulk fluid or adheres to the pipe wall too early. Even when
a particle settles out of the bulk fluid, it is not necessarily stationary as there are still mechanisms
by which it can be transported through a pipe. These mechanisms include rolling/sliding (Soepyan
et al., 2013) and saltation, where a settled particle is resuspended before resettling (Cabrejos and
Klinzing, 1994). To the extent particles do settle, the leaks at the top of the pipe will be more
difficult to clog. The critical deposit velocity describes the minimum velocity required to keep a
particle suspended in flow (Thomas, 1979) and it primarily depends on particle size, particle
density, and pipe diameter (Turian et al., 1987). Water velocity through a distribution system might
not be able to vary significantly from its design flow, thus in practical application of attempted
leak repair via particle clogging, the particle type and size would be the controlled variables.
After the particle arrives at the leak, it must be capable of clogging it (Figure 2-1). There are several
mechanisms by which this can occur. (1) If the particle is larger than the leak, it can become
trapped in the leak and held by pressure via a sieving type mechanism. Similarly, smaller,
destabilized particles can flocculate into a larger particle capable of clogging. (2) If particles are
smaller than the leak, they can build up around it and gradually reduce the leak size (Hajra et al.,
2002). (3) Using analogies to filtration, the speed of build-up in or around the leaks is expected to
be maximum if the particles are nearly zero surface charge.
Different water chemistry and flow parameters can affect a particle’s capability of clogging leaks,
especially when the particles are smaller than the leak. Agbangla et al. (2012) found that the type
of pore clogging (i.e. arching, dendrite formation, or dense deposit formation) is dependent on
flow patterns, particle concentration, and physical interactions between the particle and pore. A
model constructed by Wyss et al. (2006) suggests that the pore clogging rate is controlled by a
critical number of particles that pass through a pore. The critical number is strongly influenced by
particle diameter (Wyss et al., 2006). This is consistent with other studies that found solutions with
a lower concentration of larger particles clogs pores more rapidly than solutions with greater
Page 55
45
concentration of smaller particles (Hajra et al., 2002; Mustin and Stoeber, 2010). Finally, the
water’s ionic strength affects a particle’s ability to clog pores. Waters with high ionic strength will
compress the double layer surrounding particles, increasing their likelihood of adhesion upon
contact with one another and the leak wall (Hajra et al., 2002; Dersoir et al., 2015). Other methods
of particle agglomeration, such as neutralizing the zeta potential, may also prove to be conducive
to clogging (Tang et al., 2013). However, in a potable water system, the larger particles formed by
agglomeration may settle out of a solution or adhere to the pipe wall before they reach a leak,
which in turn eliminates the likelihood of clogging a leak. Therefore, the particle size, surface
charge, and solution ionic strength may need to be optimized to maximize clogging rate at a given
distance downstream from a point at which particles are added to the water.
Figure 2-1 Overview of factors important to particle transport and leak clogging in pipes: (1)
Large particles and flocculated smaller particles may settle before reaching the leak. (2) Charged
particles can stick to the walls of the pipe if conditions are suitable in terms of charge and transport.
(3) Particles smaller than the leak can clog it by sticking to the wall of the leak and gradually
building up inside it. (4) A single large particle or a floc of smaller particles can clog the leak
provided it has a greater diameter. (5) Particles of a similar charge can coat a leak as a monolayer
without particle build-up. (6) Certain flow conditions (i.e. turbulence) can allow particles
suspended throughout the pipe depth to clog leaks regardless of leak orientation.
Page 56
46
The overall goal of this work is to assess leak repair via the particle clogging mechanism. Both the
particle transport and particle clogging steps of this mechanism are tested simultaneously.
Specifically, this study aims to simulate pinhole (circular, 250 µm diameter) leaks in a bench scale
water-recirculating system using two model inert particles including silica and alumina.
2.2 Materials and Methods
Particle Analysis
Silica particles were ground Sil-Co-Sil 75 and fine ground Min-U-Sil 40, donated by U.S. Silica.
Aluminum oxide (alumina) particles was purchased from Sigma Aldrich (CAS number 1344-28-
1), sized -325 mesh with purity ≥ 99%. The crystal polymorph of the silica and alumina were
analyzed by X-ray diffraction (Panalytical X’Pert 3 Powder). Particle size distributions were
measured using a HORIBA LA-300 Laser Diffraction Particle Size Distribution Analyzer. A 10.12
± 0.06 µm diameter polystyrene particle was used as a size standard to confirm particle sizing
accuracy. Particle zeta potential was determined by measurement of electrophoretic mobility using
a Zeta-Meter 3.0+ instrument. Accurate zeta potential measurement was confirmed using a 100
mg/L Min-U-Sil 40 standard in a 100 mg/L NaCl solution per manufacturer instruction.
Solution Compositions
A total of nine different solutions were prepared in nanopure water for the leak repair experiments
including one control (Table 2-1) with the highest concentration of each constituent used in the
high ionic strength waters. Low ionic strength solutions represented potable water quality in a real
water distribution system. The pH of the low ionic strength solutions ranged from 5.5 to 10.3
without any particles. NaCl was added to the 0.1 mM NaHCO3 and 1 mM NaHCO3 waters to
ensure each of low ionic strength solutions had a nearly uniform ionic strength. The pH of each
water measured by an Oakton 110 Series pH meter. Ionic strength for each solution was calculated
using Mineql+.
Page 57
47
Table 2-1 Composition of waters used in leak clogging experiments
Name Composition Ionic strength
(M)1
Control
Control 94 mM K2HPO4 + 38.5 mM
KH2PO4 + 25 mM NaHCO3 + 10.7
mM KOH
0.335
High ionic strength
pH 7 Buffer 61.5 mM K2HPO4 + 38.5 mM
KH2PO4
0.199
pH 8 Buffer 94 mM K2HPO4 + 6 mM KH2PO4 0.240
pH 9.6 Buffer 25 mM NaHCO3 + 5 mM KOH 0.035
pH 10 Buffer 25 mM NaHCO3 + 10.7 mM KOH 0.045
Low ionic strength
3 mM NaCl 3 mM NaCl 3.00x10⁻³
0.1 mM NaHCO3 0.1 mM NaHCO3 + 2.9 mM NaCl 3.00x10⁻³
1 mM NaHCO3 1 mM NaHCO3 + 2 mM NaCl 3.07x10⁻³
1 mM Na2CO3 1 mM Na2CO3 2.61x10⁻³
1Ionic strength calculated using Mineql+ in a closed system
Leak Repair Experimental Design
A series of 17 separate leak repair experiments and 1 control experiment were conducted to study
the repair of leaks by particle clogging: 4 experiments were conducted using Sil-Co-Sil 75 in the
high ionic strength waters, 8 were conducted using Min-U-Sil 40 in the high ionic strength and
low ionic strength waters, 4 were conducted using alumina particles in the low ionic strength
waters, and 1 was conducted using alumina particles that remained unsettled 60 minutes after
mixing a 5 g/L alumina stock solution. No particles were added to the control experiment.
Each experiment was conducted in a water-recirculation system (Figure 2-2) in which water was
pumped (MasterFlex L/S series peristaltic pump) through a system made from rigid PVC tubing
(3/8” o.d. x 1/4” i.d.). Total system pressure was adjusted to 20 psi via a needle valve and was
Page 58
48
monitored using a pressure gauge. Three 1 m long segments of flexible tubing were installed to
maintain constant pressure. After the valve, the water was redirected back into the stirred vessel.
Leaks were simulated using borosilicate, heavy wall capillaries (3 mm o.d. x 0.25 mm i.d.)
purchased from Vitrocom. 3 mm diameter holes were drilled into a 6 in. long portion of PVC
tubing. The capillaries were cut to lengths of 2 cm and adhered to the holes using epoxy glue.
Leaks were oriented on the top, side, and bottom walls of the tubing to test leak clogging at
different orientations. Each orientation was tested in triplicate, making a total of nine leaks in each
experiment. Flexible, 3 mm i.d. tubing was placed at the end of each capillary to redirect the leaked
water back into the stirred vessel.
Before starting each experiment, silica or alumina particles were added into the synthesized
solutions (Table 2-1) in the reservoir. For experiments using silica particles, an initial turbidity of
approximately 6-7 NTU was achieved by adding 4-5 mL of the silica stock solution (5 g/L) into
750 mL of the solution. For the experiments using alumina particles, an initial alumina
concentration of 250 mg/L was achieved by adding alumina stock solution (5 g/L) into 855 mL of
the synthesized solution. An additional experiment was conducted on smaller alumina particles
that have a lower tendency to settle. For this experiment, the alumina stock solution was stirred
vigorously before settling for 60 minutes. Then, 45 mL were drawn from the surface of the stock
solution, which contained the unsettled alumina particles, and transferred to 855 mL of the
synthesized solution via pipette.
Page 59
49
Figure 2-2 Recirculation system setup: Synthesized solutions were well mixed with silica or
alumina particles in a reservoir, before being pumped through the recirculation system using a
peristaltic pump. A pressure tank was placed after the pump to maintain 20 psi and reduce
fluctuations in pressure. Capillaries (250 um i.d.) simulated pipe leaks, and the leaked water was
rerouted back to the stirred container via flexible tubing (not shown). A pressure gauge and needle
valve were used to monitor and regulate system pressure.
Leak Monitoring
The leak rate through each capillary was measured daily for 10 days. The water in each vessel was
also replaced daily with freshly made synthesized water and dosed to the same particle
concentration, with the exception of the unsettled particle experiment, which was only replaced
once at day 6. Two turbidity measurements were taken daily, right before and after each water
replacement. Turbidity was measured on a Hach 2100N Turbidimeter which was regularly
calibrated using a hydrazine sulfate turbidity standard. Microscope photos of the leaks, simulated
by glass capillaries, were taken using an MU300 3 megapixel camera mounted on an AmScope
IN300TC optical microscope.
Page 60
50
2.3 Results and Discussion
Particle Characterization
Particle size distributions were measured for Min-U-Sil 40, Sil-Co-Sil 75, and alumina in each of
the solutions used in the clogging experiments (Table 2-2). As expected given that the pH of the
experiments was much higher than the pHPZC (Schwarz et al., 1984), the size of the Min-U-Sil 40
and Sil-Co-Sil 75 particles were not significantly affected by the solution chemistry. In contrast,
the alumina particles had higher mean diameter than the silica particles, and had a range of zeta
potentials from moderately negative (-22.2 mV), near neutral (-7.1 and 12.0 mV), and highly
positive (36.0 mV) consistent with pHpzc = 7.1 correspondingly varied in size due to coagulation
(Schwarz et al., 1984). Thus, the silica particles essentially allowed for study of fixed particle size
and settling velocity on clogging rates in different solutions, whereas the alumina allowed these
parameters to be varied, thereby representing extremes of behavior for particles that could be used
in practice. In one experiment, the fraction of alumina unsettled after 60 minutes of stagnation was
collected, creating a suspension with much lower particle size and initial settling velocity than the
other alumina solutions.
As discussed in the introduction, it was hypothesized that larger particles would be more efficient
at clogging pores than small particles at the same volume fraction (Hajra et al., 2002; Mustin and
Stoeber, 2006; Wyss et al., 2010). On the other hand, if the particles are too large, they have a
higher tendency to settle out of the water flowing through the pipe before they arrive at a leak. The
critical settling velocity, or the minimum fluid velocity required to keep particles from settling in
a pipeline, was modeled using the approach of Danielson (2007) (Figure 2-3). Larger diameter
pipes require higher flow velocities to keep particles suspended. For the particles tested herein, the
model predicts that all the alumina and silica particles in a real pipe system with a large diameter
such as the Delaware Aqueduct will settle, including particles as small as 10 nm (Figure 2-3A, 2-
3C). But for the very small diameter tube systems tested herein, the average-sized particles in each
of these experiments are predicted to remain in suspension, with the alumina particles being closer
to the critical settling velocity than silica (Figure 2-3B, 2-3D).
Page 61
51
Table 2-2: Mean particle size and zeta potential measurements on particles used in each
solution
Solution Mean diameter (µm) Mean standard deviation
(µm)
Zeta potential (mV)
Min-U-Sil 40
Nanopure 17.4 9.6 N/A
pH 7 Buffer 15.3 12.5 -31.6
pH 8 Buffer 13.7 12.3 -30.5
pH 9.6 Buffer 14.1 12.4 -40.0
pH 10 Buffer 16.2 13.3 -36.0
3 mM NaCl 17.3 9.5 -34.1
0.1 mM NaHCO3 15.5 8.6 -49.3
1 mM NaHCO3 17.3 9.6 -25.0
1 mM Na2CO3 19.6 10.8 -37.8
Sil-Co-Sil 75
Nanopure 12.7 7.9 N/A
pH 7 Buffer 16.5 13.4 -29.4
pH 8 Buffer 18.6 15.8 -24.5
pH 9.6 Buffer 14.8 12.8 -45.4
pH 10 Buffer 15.3 13.6 -40.0
Alumina
Nanopure 30.2 13.3 N/A
3 mM NaCl 31.2 11.5 36.0
0.1 mM NaHCO3 40.2 24.3 12.0
1 mM NaHCO3 37.1 18.5 -7.1
1 mM Na2CO3 26.6 12.9 -22.2
Alumina, unsettled after 60 minutes stagnation
1 mM Na2CO3 4.1 2.5 -18.9
Page 62
52
Figure 2-3 Critical settling velocity model: Critical settling velocities for particles in water at
20°C for A) alumina and C) silica in pipes of varying diameter, including real systems such as the
Delaware Aqueduct (19.5’) and these experiments (1/4”). Dotted lines are the flow velocities in
those systems. Bottom graphs magnify the critical flow velocity scale to conditions relevant to this
experiment. Dots represent B) mean alumina size in each low ionic strength solution and D) mean
silica sizes in high ionic strength and high ionic strength solutions. However, visual observations
indicated that the majority of the particles did settle to the bottom of the tubes despite the prediction
herein, suggesting that the model approach would need to be adjusted to make accurate predictions
in practice. The model in Danielson (2007) was calibrated for silica sand with mean diameters of
280-500 µm and tube diameter of 6.9 cm, which is outside the range in this experiment.
Leak Clogging with Silica
Both Min-U-Sil 40 and Sil-Co-Sil 75 in were shown to be capable of repairing leaks in nearly
every solution, with the exception of Min-U-Sil 40 in the 1 mM NaHCO3 solution (Table 2-3).
None of the leaks repaired in the high ionic strength control after ten days. As noted before, there
are similarities between the two types of silica; they have similar sizes and zeta potentials in the
high ionic strength solutions (Table 2-2). Although both types of silica had similar particle
characteristics in high ionic strength solutions, there was variation in clogging rate. For example,
Page 63
53
Sil-Co-Sil 75 in the pH 9.6 buffer clogged all nine leaks over eight days, while Sil-Co-Sil 75 in
pH 8 buffer only repaired one leak over ten days. Regardless of particle similarities, there seems
to be some randomness in the length of time required to clog a leak with silica.
Table 2-3: Summary of Leak Clogging Results
1Experiments were run for 10 days but were ended early if every leaked was clogged.
Leak Clogging with Alumina
The results of the leak clogging experiments with alumina particles provide valuable insight into
the effects of water quality on repair efficiency. Like silica, alumina was shown capable of leak
clogging in each solution (Table 2-3), though alumina was added at higher concentration. The two
alumina solutions that clogged all of the leaks were 3 mM NaCl and 0.1 mM NaHCO3. While their
sizes were significantly different, the zeta potential of alumina in both of these solutions was
positive while the borosilicate capillaries should have a negative charge (Lameiras et al., 2008).
This suggests that opposite charges on the particle and leak surfaces could be highly conducive to
initiating processes of leak clogging, as the particles quickly adhere over and inside the leak as a
monolayer. This also promotes the notion that smaller particles whose charge is opposite of that
Particle Solution Fraction
repaired
Experiment
duration (days)1
N/A Control 0/9 10
Min-U-Sil 40 pH 7 Buffer 4/8 10
pH 8 Buffer 5/9 10
pH 9.6 Buffer 4/9 10
pH 10 Buffer 8/9 10
3 mM NaCl 9/9 8
0.1 mM NaHCO3 6/9 10
1 mM NaHCO3 0/9 10
1 mM Na2CO3 6/9 10
Sil-Co-Sil 75 pH 7 Buffer 4/9 10
pH 8 Buffer 1/9 10
pH 9.6 Buffer 9/9 8
pH 10 Buffer 5/9 10
Alumina 3 mM NaCl 9/9 4
0.1 mM NaHCO3 8/8 3
1 mM NaHCO3 4/9 10
1 mM Na2CO3 6/9 10
Alumina, unsettled after
60 min. stagnation
1 mM Na2CO3 1/9 10
Page 64
54
in the leak may be more effective in repairing leaks because they have lower tendency to settle out
in the system. On the other hand, there is homogeneity in the materials in real pipe systems outside
of this experiment, and the particles should also deposit to pipe surfaces other than the inside of
the leak and be more rapidly lost from the system.
Turbidity was tracked in the recirculation systems for each solution over 24 hours (Figure 2-4).
However, turbidity is not exactly proportional to particle volume as it can depend on particle size
(Baker and Lavelle, 1984; Gibbs and Wolanski, 1992). For the alumina size ranges in these
experiments (>0.5 µm), the turbidity should decrease as particles grow larger, assuming equal
particle volumes (Morris, 1987). Because the alumina in the 0.1 mM NaHCO3 and 1 mM NaHCO3
solutions has higher average size, there is a lower amount of turbidity generated in those solutions
per unit volume of alumina particles.
There is a rapid drop in turbidity in every system in the first hour after the water is replaced, likely
due to particles settling out of the system (Figure 2-4). While the flow velocity is fast enough to
keep the mean particle size suspended (Figure 2-3), there are alumina particles that are large
enough (>100 µm) to settle out in each system (Figure 2-5). The portions of each recirculation
system where particle build-up occurred include the pressure gauge, valve, pressure tank, and 90°
elbows. These components likely contributed to the initial turbidity drop. The area under the curves
in Figure 2-4A was calculated to estimate the relative volume of alumina particles that were
flowing through each system (Figure 2-4B). 3 mM NaCl, 0.1 mM NaHCO3, and 1 mM NaHCO3
solutions had similar total turbidities over 24 hours, while 1 mM Na2CO3 had the highest total
turbidity. Although the 1 mM Na2CO3 experiment had the highest overall turbidity pass through it
each day, it did not fully repair. This contradicts previous studies showing that pore clogging rate
depends on the number of particles that pass through the pore (Wyss et al., 2006). Furthermore,
the condition with the second highest turbidity had the lowest repair rate after 10 days. These
findings support our previous assertion that particle charge is a dominant factor in repair.
Page 65
55
Figure 2-4 Alumina turbidity measurements: A) Turbidity of alumina solutions passing through
the recirculation systems over a 24-hour period. B) Area under each curve in Figure 2-4A,
proportional to the total amount of particles that pass through each system over 24 hours.
Figure 2-5 Particle size distributions of alumina particles.
A leak clogging experiment on the suspension of smaller alumina particles that did not settle after
60 minutes of stagnation was done to assess leak repair in a system that retains most of its initial
turbidity. 60 minutes was selected as the stagnation time because more than 50% the initial
turbidity was still suspended in the recirculation system after running for 24 hours (Figure 2-6).
While two leaks were temporarily clogged for one and four days, only one leak was clogged after
ten days (Table 2-3). The phenomenon of temporary leak clogging before becoming unclogged
occurred in the other experiments as well. Additional experiments in 3 mM NaCl or 0.1 mM
NaHCO3 solutions could be performed to test if the unsettled particles have a higher clogging
efficiency with a positive zeta potential.
Page 66
56
Figure 2-6 Unsettled alumina turbidity over 24 hours.
The final disposition of particles in holes that were successfully clogged also varied widely (Figure
2-7). For example, microscope images observe build-up of smaller particles over a leak (Figure 2-
7B), clogging by a single large particle (Figure 2-7C), and clogging by small particles further down
the path of the leak (Figure 2-7D). The wall thickness of the pipe material could be an important
factor in repair via particle clogging. For example, particles traveling through leaks in pipes with
lower wall thickness will have less opportunities to collide with and stick to the leak wall than
particles traveling through leaks in pipes with greater wall thickness.
Page 67
57
Figure 2-7: Microscope images of clogged capillaries. 40x magnification of 250 µm i.d.
capillaries from -alumina in 1 mM NaHCO3 clogging experiment. A) Non-repaired leak. B)
Potential leak repair by gradual build-up of particles. The clog extends approximately 600 µm into
the leak. C) Leak repaired by a single large particle. D) Leak repaired further down the leak path.
2.4 Conclusions
Analysis of particle sizes, zeta potential, and leak clogging data from silica and alumina particles
in various solutions yielded the following conclusions:
Changing water quality impacted the size of alumina particles, but not silica particles.
Alumina sizes were consistent with expectations based on their zeta potential. Silica
particles were roughly the same size likely because they had highly negative zeta
potentials.
Silica particles were proven capable of repairing leaks in high and low ionic strength
solutions, but the water quality was not shown to influence leak clogging rate.
Water quality has a pronounced impact on clogging with alumina particles. Alumina with
positive zeta potential repaired significantly faster than alumina with negative zeta
A B
C D
Page 68
58
potential. This could be due to the opposite surface charges between the negatively charged
capillary and positively charged alumina.
The total turbidity of alumina particles that passes through a leak does not affect its
clogging rate. The experiment that had the highest estimated volume of alumina particles
repaired relatively slow.
Smaller alumina particles (i.e. alumina particles that do not settle out of the solution) were
ineffective at clogging leaks even though they remained suspended in solution over longer
periods of time. In a real system, leaks that are far from the point of particle addition are
unexpected to repair as fast as leaks close to the point of particle addition.
2.5 Limitations and Future Research
While these particle clogging experiments demonstrate a proof of concept, there are several
limitations in this work that prevent it from being applied to distribution systems. The pipe
diameter in these experiments is orders of magnitude lower than actual water mains. Models
predict that the critical flow velocity is strongly dependent on pipe diameter and particles will
settle more frequently in pipes with larger diameters (Soepyan et al., 2013). Distribution systems
also operate at higher pressures, typically around 120 psi. It is possible that the clogs in these
experiments at 20 psi would not hold under higher pressure. Leak geometry in distribution systems
is also different, as longitudinal cracks are more prominent than the pinhole leaks simulated in
these experiments. Finally, water hammering, which is a surge in system pressure that results from
valve closure, occurs in practice. Sudden spikes in pressure could unclog leaks while turbulent
flow conditions during hammering events can suspend settled particles in the system.
Both steps in the two-step model have been confirmed as being important for leak clogging. Two
extremes were tested with regard to particle transport and particle clogging. Larger particles settled
relatively fast but were more capable of clogging leaks, and smaller particles stayed suspended but
were less capable of clogging leaks. Future research should determine how far along a pipe leaks
can be effectively repaired. There should exist an optimal particle size that is capable of flowing
to and repairing leaks further from the point of particle addition. Methods of transporting larger
particles greater distances should also be considered, such as temporary increases in flow velocity.
The critical flow velocity model formulated in Danielson (2007) needs to be calibrated to the
Page 69
59
conditions in these experiments as well as the conditions relevant to water distributions systems.
Modeling critical flow velocity in a real system can have benefits outside of autogenous repair.
For example, presence of lead particulates is a concern in some systems (Masters et al., 2016) and
having accurate models for critical flow velocity would allow for tracking its transport.
2.6 References
Agbangla, G.C., Climent, É., and Bacchin, P. (2012). Experimental investigation of pore clogging
by microparticles: Evidence for a critical flux density of particle yielding arches and
deposits. Separation and Purification Technology. 101, 42.
American Society of Civil Engineers (ASCE). (2013). 2013 Report Card for America’s
Infrastructure. Reston, VA: ASCE. Available at:
http://www.infrastructurereportcard.org/a/#p/drinking-water/conditions-and-capacity
American Water Works Association Research Foundation (AWWARF). (2001). Pathogen
Intrusion into the Distribution System. Denver, CO: AWWA.
Baker, E.T. and Lavelle, J.W. (1984). The effect of particle size on the light attenuation coefficients
of natural suspensions. Journal of Geophysical Research. 89, 8197.
Cabrejos, F.J. and Klinzing, G.E. (1994). Pickup and saltation mechanisms of solid particles in
horizontal pneumatic transport. Powder Technology. 79, 173.
Center for Neighborhood Technology (CNT). (2013). The Case for Fixing Leaks: Protecting
people and saving water while supporting economic growth in the Great Lakes region.
Chicago, IL: Center for Neighborhood Technology.
Danielson, T.J. (2007). Sand transport modelling in multiphase pipelines. Presented at the 2007
Offshore Technology Conference, Houston, Texas, USA, April 30 – May 3.
Dersoir, B., Robert de Saint Vincent, M., Abkarian, M., and Tabuteau, H. (2015). Clogging of a
single pore by colloidal particles. Microfluid Nanofluid. 19, 953.
Edvardsen, C. (1999). Water permeability and autogenous healing of cracks in concrete. ACI
Materials Journal. 96, 448.
Gibbs, R.J. and Wolanski, E. (1992). The effect of flocs on optical backscattering measurements
of suspended material concentration. Marine Geology. 107, 289.
Page 70
60
Hajra, M.G., Reddi, L.N., Glasgow, L.A., Xiao, M., and Lee, I.M. (2002). Effects of ionic strength
on fine particle clogging of soil filters. Journal of Geotechnical and Geoenvironmental
Engineering. 128, 631.
Lameiras, F.S., Leles de Souza, A., Rodrigues de Melo, V.A., Nunes, E.H.M., and Braga, I.D.
(2008). Measurement of the zeta potential of planar surfaces with a rotating disk. Materials
Research. 11, 217.
Masters, S., Welter, G.J., and Edwards, M. (2016). Seasonal variations in lead release to potable
water. Environmental Science and Technology.
Morris, T.M. (1987). The relationship between haze and the size of particles in beer. Journal of
the Institute of Brewing. 93, 13.
Mustin, B. and Stoeber, B. (2010). Deposition of particles from polydisperse suspensions in
microfluidic systems. Microfluid Nanofluid. 9, 905.
Parks, J., Edwards, M, Vikesland, P., and Dudi, A. (2010). Effects of bulk water chemistry on
autogenous healing of concrete. Journal of Materials in Civil Engineering. 22, 515.
Schwarz, J.A., Driscoll, C.T., and Bhanot, A.K. (1984). The zero point of charge of silica-alumina
oxide suspensions. Journal of Colloid and Interface Science. 97, 55.
Shanaghan, P.E. (2012). Assessing drinking water infrastructure need. Journal of the American
Water Works Association. 104, 14.
Soepyan, F.B., Cremaschi, S., Sarica, C., Subramani, H.J., and Kouba G.E. (2013). Solids transport
models comparison and fine-tuning for horizontal, low concentration flow in single-phase
carrier fluid. AIChE Journal. 60, 76.
Tang, M., Triantafyllidou, S., and Edwards, M. (2013). In situ remediation of leaks in potable
water supply systems. Corrosion Reviews. 31, 105.
Tang, M., Triantafyllidou, S., and Edwards, M. (2015). Autogenous metallic pipe leak repair in
potable water systems. Environmental Science and Technology. 49, 8697.
Thomas, A.D. (1979). Predicting the deposit velocity for horizontal turbulent pipe flow of slurries.
International Journal of Multiphase Flow. 5, 113.
Turian, R.M., Hsu, F.L., and Ma, T.W. (1987). Estimation of the critical velocity in pipeline flow
of slurries. Powder Technology. 51, 35.
Walski, T.M. and Lutes, T.L. (1994). Hydraulic transients cause low pressure problems. Journal
of the American Water Works Association. 86, 24.
Page 71
61
Wyss, H.M. Blair, D.L., Morris, J.F., Stone, H.A., and Weitz, D.A. (2006). Mechanism for
clogging or micro-channels. Physical Review E. 74, 1.
Page 72
62
Appendix: Supporting Tables and Figures
Figure A-1: Leak clogging and turbidity results for Min-U-Sil 40 in pH 7 buffer
Figure A-2: Leak clogging and turbidity results for Min-U-Sil 40 in pH 8 buffer
Page 73
63
Figure A-3: Leak clogging and turbidity results for Min-U-Sil 40 in pH 9.6 buffer
Figure A-4: Leak clogging and turbidity results for Min-U-Sil 40 in pH 10 buffer
Page 74
64
Figure A-5: Leak clogging and turbidity results for Min-U-Sil 40 in 3 mM NaCl solution
Figure A-6: Leak clogging and turbidity results for Min-U-Sil 40 in 1 mM Na2CO3 solution
Page 75
65
Figure A-7: Leak clogging and turbidity results for Min-U-Sil 40 in 0.1 mM NaHCO3 solution
Figure A-8: Leak clogging and turbidity results for Min-U-Sil 40 in 1 mM NaHCO3 solution
Page 76
66
Figure A-9: Leak clogging and turbidity results for Sil-Co-Sil 75 in pH 7 buffer solution
Figure A-10: Leak clogging and turbidity results for Sil-Co-Sil 75 in pH 8 buffer solution
Page 77
67
Figure A-11: Leak clogging and turbidity results for Sil-Co-Sil 75 in pH 9.6 buffer solution
Figure A-12: Leak clogging and turbidity results for Sil-Co-Sil 75 in pH 10 buffer solution
Page 78
68
Figure A-13: Leak clogging and turbidity results for alumina in 3 mM NaCl solution
Figure A-14: Leak clogging and turbidity results for alumina in 1 mM Na2CO3 solution
Page 79
69
Figure A-15: Leak clogging and turbidity results for alumina in 0.1 mM NaHCO3 solution
Figure A-16: Leak clogging and turbidity results for alumina in 1 mM NaHCO3 solution
Page 80
70
Figure A-17: Leak clogging and turbidity results for unsettled alumina in 1 mM Na2CO3
solution
Figure A-18: Leak clogging and turbidity results for unsettled alumina in control solution
Page 81
71
Figure A-19: XRD results for A) Min-U-Sil 40, B) Sil-Co-Sil 75, and C) alumina
0
2000
4000
6000
8000
10000
0 10 20 30 40 50 60 70 80 90
Inte
nsi
ty
2θ (°)
0
1000
2000
3000
4000
5000
0 10 20 30 40 50 60 70 80 90
Inte
nsi
ty
2θ (°)
0
500
1000
1500
2000
2500
3000
0 10 20 30 40 50 60 70 80 90
Inte
nsi
ty
2θ (°)
A
B
C
Page 82
72
Figure A-20: Zeta potential measurements for A) high ionic strength and B) low ionic
strengths solutions. Error bars represent 95% confidence interval
Page 83
73
Figure A-21: Min-U-Sil 40 particle size distribution in pH 7 buffer solution
Figure A-22: Min-U-Sil 40 particle size distribution in pH 8 buffer solution
Figure A-23: Min-U-Sil 40 particle size distribution in pH 9.6 buffer solution
Page 84
74
Figure A-24: Min-U-Sil 40 particle size distribution in pH 10 buffer solution
Figure A-25: Min-U-Sil 40 particle size distribution in low ionic strength solutions
Figure A-26: Sil-Co-Sil 75 particle size distribution in pH 7 buffer solution
Page 85
75
Figure A-27: Sil-Co-Sil 75 particle size distribution in pH 8 buffer solution
Figure A-28: Sil-Co-Sil 75 particle size distribution in pH 9.6 buffer solution
Figure A-29: Sil-Co-Sil 75 particle size distribution in pH 10 buffer solution
Page 86
76
Figure A-30: Alumina particle size distribution in 3 mM NaCl solution
Figure A-31: Alumina particle size distribution in 0.1 mM NaHCO3 solution
Figure A-32: Alumina particle size distribution in 1 mM NaHCO3 solution
Page 87
77
Figure A-33: Alumina particle size distribution in 1 mM Na2CO3 solution
Figure A-34: Particle size distribution on alumina that remained unsettled after 30 and 60
minutes of stagnation in 1 mM Na2CO3 solution