Calcium supplementation for prevention of primaryhypertension
Gabriela Cormick1, Agustín Ciapponi2 , María Luisa Cafferata2, José M Belizán1
1Department of Mother and Child Health Research, Institute for Clinical Effectiveness and Health Policy (IECS), Buenos Aires,Argentina. 2Argentine Cochrane Centre, Institute for Clinical Effectiveness and Health Policy (IECS), Buenos Aires, Argentina
Contact address: Gabriela Cormick, Department of Mother and Child Health Research, Institute for Clinical Effectiveness and HealthPolicy (IECS), Dr. Emilio Ravignani 2024, Buenos Aires, C1414CPV, Argentina. [email protected]. [email protected].
Editorial group: Cochrane Hypertension Group.Publication status and date: New, published in Issue 6, 2015.Review content assessed as up-to-date: 15 April 2015.
Citation: Cormick G, Ciapponi A, Cafferata ML, Belizán JM. Calcium supplementation for prevention of primary hypertension.Cochrane Database of Systematic Reviews 2015, Issue 6. Art. No.: CD010037. DOI: 10.1002/14651858.CD010037.pub2.
Hypertension is a major public health problem that increases the risk of cardiovascular and kidney diseases. Several studies have shownan inverse association between calcium intake and blood pressure. As small reductions in blood pressure have been shown to producerapid reductions in vascular disease risk even in individuals with normal blood pressure ranges, this review intends to evaluate the effectof calcium supplementation in normotensive individuals as a preventive health measure.
Objectives
To assess the efficacy and safety of calcium supplementation versus placebo or control for reducing blood pressure in normotensivepeople.
Search methods
We searched the Cochrane Hypertension Group Specialised Register, the Cochrane Central Register of Controlled Trials (CENTRAL),MEDLINE, MEDLINE In-Process, EMBASE and ClinicalTrials.gov for randomised controlled trials up to October 2014. The WHOInternational Clinical Trials Registry Platform (ICTRP) is searched for inclusion in the Group’s Specialised Register. We also reviewedreference lists from retrieved studies and contacted authors of relevant papers. We applied no language restrictions.
Selection criteria
We selected trials that randomised normotensive people to dietary calcium interventions such as supplementation or food fortificationversus placebo or control. We excluded quasi-random designs. The primary outcomes were hypertension (defined as blood pressure ≥
140/90 mmHg) and blood pressure measures.
Data collection and analysis
Two review authors independently selected trials for inclusion, abstracted the data and assessed the risks of bias.
1Calcium supplementation for prevention of primary hypertension (Review)
We included 16 trials with 3048 participants. None of the studies reported hypertension as a dichotomous outcome. The effect onsystolic and diastolic blood pressure was mean difference (MD) -1.43 mmHg (95% confidence interval (CI) -2.15 to -0.72) and -0.98mmHg (95%CI -1.46 to -0.50) respectively. The effect on systolic and diastolic blood pressure for those younger than 35 years (7trials with 399 participants) was -2.11 mmHg (95%CI -3.58 to -0.64) / -2.61 mmHg (95% CI -3.74, -1.49). The effect on systolicand diastolic blood pressure for those 35 years or more (9 trials with 2649 participants) was -0.96 mmHg (95%CI -1.83 to -0.09) / -0.59 mmHg (95%CI -1.13 to -0.06). The effect on systolic and diastolic blood pressure for women (6 trials with 1823 participants)was -1.45 mmHg (95% CI -2.78 to -0.12) / -0.92 mmHg (95% CI -1.71 to -0.14). The effect on systolic and diastolic blood pressurefor men (5 trials with 617 participants) was -2.07 (95%CI -3.56 to -0.59] / -1.91 (95%CI -2.80 to -1.02).The quality of evidence foreach of these outcomes was high. The effect is consistent in both genders regardless of baseline calcium intake.
The effect on systolic blood pressure was 0.08 mmHg (95% CI -2.16 to 2.32) with doses less than 1000 mg, -1.14 mmHg (95% CI-2.01 to -0.27) with 1000 - 1500 mg, and -2.79 mmHg (95% CI -4.71 to -0.86) with more than 1500 mg. The effect on diastolicblood pressure was -0.54 mmHg (95% CI -2.23 to 1.15), -0.71 mmHg (95% CI -1.37 to -0.06) and -1.43 mmHg (95% CI -2.22 to-0.64) respectively. The quality of evidence for each of these outcomes was high.
None of the studies reported adverse events.
Authors’ conclusions
An increase in calcium intake slightly reduces both systolic and diastolic blood pressure in normotensive people, particularly in youngpeople, suggesting a role in the prevention of hypertension. These results should be interpreted with caution, since the proposedbiological mechanism explaining the relationship between calcium and blood pressure has not been fully confirmed. The effect acrossmultiple prespecified subgroups and a possible dose response effect reinforce this conclusion. Even small reductions in blood pressurecould have important health implications for reducing vascular disease.
There is a great need for adequately-powered clinical trials randomising young people. Subgroup analysis should involve basal calciumintake, age, sex, basal blood pressure, and body mass index. We also require assessment of side effects, optimal doses and the best strategyto improve calcium intake.
P L A I N L A N G U A G E S U M M A R Y
Extra calcium to prevent high blood pressure
Review question
We wanted to find out the effects of calcium intake on blood pressure in people with normal blood pressure.
Background
Hypertension is a serious health problem that increases the risk of heart and kidney diseases. Several studies have shown that increasingcalcium intake lowers blood pressure even in individuals within a normal blood pressure range. Increasing calcium intake also hasbenefits for pregnancy outcomes, effects which are thought to be mediated also by blood pressure reduction. High blood pressure hasbeen identified as a major risk factor for mortality and even small reductions in blood pressure can decrease the occurrence of coronaryartery disease, stroke and death.
Study characteristics
We selected studies that assessed the effect of dietary calcium interventions such as supplementation or food fortification on bloodpressure in normotensive people of all ages. The last search date was October 2014.
Key findings
This review analysed information from 16 trials (3048 participants). We found that an increase in calcium intake slightly reduces bothsystolic and diastolic blood pressure 1.43 mmHg lower and 0.98 mmHg lower respectively. This effect was higher with doses of calciumabove 1000 mg/day. Systolic blood pressure was reduced by 1.14 mmHg with doses of calcium 1000 to 1500 mg/day and by 2.79mmHg with doses of calcium equal to or over 1500 mg/day.
2Calcium supplementation for prevention of primary hypertension (Review)
We noted a reduction in blood pressure in both men and women and at ages from 11 to 82 years old, but the reduction was greateramong younger people. Systolic blood pressure was reduced by 2.11 mmHg among those less than 35 years and by 0.96 mmHg amongthose 35 years or older.
None of the studies reported adverse events. We need further research to determine the ideal dosage of supplementation and whetherit is more effective and safer as part of the diet or as a supplement.
Quality of the evidence
We found high quality of evidence for systolic and diastolic blood pressure in both men and women. The quality of evidence was alsohigh for participants 35 years or older and moderate for younger people.
The quality of evidence was high for doses of calcium of 1000 to 1500 mg/day and was moderate for lower or higher doses.
Five of the 16 trials were industry funded.
3Calcium supplementation for prevention of primary hypertension (Review)
The Seventh Report of the Joint National Committee on Preven-tion, Detection, Evaluation and Treatment of High Blood Pressuredefines “hypertension” as blood pressure above 139 mmHg sys-tolic and/or diastolic above 89 mmHg . It also defines blood pres-sure ranging from 120-139 mmHg systolic and/or 80-89 mmHgdiastolic as “prehypertension” in order to identify those individualsin whom early intervention by adoption of healthy lifestyles couldreduce blood pressure, decrease the rate of progression of bloodpressure to hypertensive levels with age, or prevent hypertensionentirely (Chobanian 2003).Primary hypertension may develop as a result of environmentalor genetic causes. Secondary hypertension has multiple etiologies,such as renal, vascular, and endocrine causes. Primary or essentialhypertension accounts for 90-95% of adult cases and secondaryhypertension accounts for 2-10% of cases (Carretero 2000).Hypertension is a major public health problem that increases therisk of cardiovascular and kidney diseases in both the developedand the developing world. The global prevalence of hypertensionand high blood pressure are estimated to be 30% and 26% respec-tively (Kearney 2004) and high blood pressure has been estimatedto increase to 29% by the year 2025 (Kearney 2005).High blood pressure has been identified as the leading risk factorfor mortality and the third leading risk factor for disease burdenglobally (Ezzati 2002). In the year 2001, 7.6 million (13.5%) ofall deaths were attributable to high blood pressure (Lawes 2008).While the prevalence of hypertension seems to be stabilising ordecreasing in the developed world, it is increasing in developingcountries (Kearney 2004). Low-income and middle-income re-gions contribute up to 80% of the attributable burden of dis-ease, affecting the younger age groups more than in high-incomecountries (Lawes 2008). While chronic diseases have increased inthese countries, problems related to undernutrition such as mi-cronutrient deficiencies persist, causing a double burden of disease(Llanos 2008). These present a challenge to developing interven-tions, as excess and deficit nutritional problems have to be tackledwithin the same population and frequently within the same home(Garrett 2005).
Description of the intervention
Several studies have shown an inverse association between calciumintake and blood pressure or hypertension. The hypothesis orig-inated with the observation that indigenous Guatemalan womenhave a low incidence of oedema-, proteinuria-, and hypertension-gestosis associated with a high calcium intake due to the Mayanhabit of treating corn with lime water (Belizan 1980). Based onthis hypothesis, a series of studies has been conducted mainly in
pregnant women, but also in children, as well as in young andolder adults (Belizan 1980; Belizan 1983).A recent World Health Organization (WHO) review of obser-vational epidemiological and ecological studies found an inverse(protective) association between cardiovascular disease mortalityand increased water hardness (measured by calcium carbonate oranother hardness parameter and/or the calcium and magnesiumcontent of water). (WHO 2009).A Cochrane review in 2006 found that calcium supplementationin hypertensive people elicited a small but statistically significantreduction in systolic blood pressure (SBP) (mean difference: -2.5mmHg, 95% confidence interval (CI) -4.5 to -0.6), but not indiastolic blood pressure (DBP) (mean difference: -0.8 mmHg,95% CI -2.1 to 0.4) (Dickinson 2006).Several reviews have shown an association between calcium intakeand blood pressure (Allender 1996; Griffith 1999; Van Mierlo2006). The most recent review in 2006 found that calcium sup-plementation (mean daily dose: 1200 mg) reduced SBP by 1.86mmHg (95% CI 2.91 to 0.81) and DBP by 0.99 mmHg (95% CI1.61 to 0.37) (Van Mierlo 2006). In people with a relatively lowcalcium intake (less than 800 mg per day) higher blood pressureestimates were obtained, at 2.63 (95% CI 4.03 to 1.24) for SBPand 1.30 (95% CI 2.13 to 0.47) for DBP.Furthermore, a Cochrane review has shown that calcium supple-mentation has an effect on reducing pregnancy hypertensive dis-eases (Hofmeyr 2014).
How the intervention might work
The mechanisms by which calcium could influence blood pressureare not well understood. One hypothesis is that low calcium in-take would lead to changes in vitamin D and parathormone levelstriggering a chain of reactions resulting in an increase in intracel-lular calcium and consequently increased vascular smooth musclereactivity, which would result in increased peripheral vascular re-sistance and thus increased blood pressure (Belizan 1988; Webb2003). In this way, high blood pressure could be a collateral effectof hormones that are released to compensate for low calcium levelsin the organism (Heaney 2006). More basic and clinical studiesare required to understand the mechanisms involved in the rela-tionship between calcium intake and blood pressure.
Why it is important to do this review
Small reductions in blood pressure were predicted to have im-portant health implications as they were shown to produce rapidreductions in vascular disease risk even in individuals with nor-mal blood pressure ranges (Lewington 2002). A 2 mmHg-lowersystolic blood pressure is predicted to produce about 10% lowerstroke mortality and about 7% lower mortality from ischaemicheart disease, while a 5 mmHg reduction in SBP at the population
5Calcium supplementation for prevention of primary hypertension (Review)
level is predicted to result in a 14% reduction in stroke death, a9% reduction in coronary artery disease-related death and a 7%reduction in total mortality (Whelton 2002). In the same way,a 2 mmHg reduction in SBP in adults is estimated to have thepotential to save about 12,000 lives a year in the United States(Stamler 1991).Due to the high frequency of hypertension, population-basedstrategies to reduce blood pressure are more cost effective thanindividual strategies (Kearney 2005).Calcium supplementation or food fortification are affordable in-terventions that, if proven effective in reducing blood pressureeven by small levels, could have considerable impact at a popula-tion level. The effects on children and young people are of partic-ular importance, as blood pressure tends to track into adulthood(Williams 2011).This review explores the efficacy and safety of calcium supple-mentation or food fortification in preventing hypertensive-relatedproblems in normotensive people of different ages. It looks at theeffect in reducing blood pressure in each population group and inpreventing, rather than treating, hypertensive-related problems. Italso provides more information on the effect of increasing calciumintake on blood pressure in non-pregnant women of reproductiveage. Reviewing the effect of calcium in a normotensive populationis valuable in assessing whether it could allow women to reachpregnancy with a lower range of blood pressure and a lower riskof developing pre-eclampsia or eclampsia.As there have been some concerns about adverse events of calciumsupplementation (Bolland 2008; Curhan 2004; Harris 2002),there is a need to assess adverse events such as renal tract stoneformation, impaired absorption of other minerals and increasedcardiovascular events.Excess calcium in the body had been implicated as a risk factor forkidney stone formation; however, data suggest that free calcium inthe body does not increase the risk and that high calcium intakemay actually be a protective factor against the formation of kidneystones (Curhan 2004; Heaney 2006; Jackson 2006; Williams2001).The effect of calcium supplementation on cardiovascular eventsis unclear, as there are currently conflicting data, studies havenot been powered to significantly detect cardiac events, and themethodology does not allow the results to be generalisable to abroader population. Two studies that were conducted in cohortsof older women have reported a higher incidence of cardiovascularevents such as myocardial infarction and the composite end pointof myocardial infarction, stroke, or sudden death in the experi-mental groups. However, these differences were not statisticallysignificant (Bolland 2008; Sabbagh 2009).Calcium has been shown to interfere with iron absorption in theshort term; however, research has also shown that prolonged cal-cium supplementation has no effect on iron absorption over time(Harris 2002; Ilich-Ernst 1998; Kalkwarf 1998; Sokoll 1992).
O B J E C T I V E S
To assess the efficacy and safety of calcium supplementation versusplacebo or control for reducing blood pressure in normotensivepeople.
M E T H O D S
Criteria for considering studies for this review
Types of studies
All published, unpublished and ongoing trials with random allo-cation to dietary calcium intervention such as supplementationor food fortification versus placebo or control. We exclude quasi-random designs.
Types of participants
Participants include normotensive people of different ages, butexcluding pregnant women.We planed to analyse groups by age, sex, baseline calcium intake,dose received, duration of intervention, type of intervention, eth-nicity, baseline blood pressure, and intake of other minerals in-volved in blood pressure regulation, such as sodium, magnesium,potassium and fat intake.
Types of interventions
We include calcium interventions such as supplementation usingpills, tablets or sprinkle powder, or any food or beverage fortifica-tion, compared to placebo or control.Calcium fortification could include salt of calcium carbonate, sul-phate, citrate, citrate malate, chloride, hydroxyapatite, phosphate,acetate, lactate, glycerophosphate, gluconate, oxide, or hydrox-ide. Calcium content in these salts varies from 9% to 70% (Allen2006).We exclude studies with no placebo or control. We also excludeinterventions where calcium was combined with other macro- ormicronutrient to assess the effects of both.
Types of outcome measures
Primary outcomes
1. Hypertension, defined as blood pressure ≥ 140/90 mmHg2. Systolic and diastolic blood pressure
6Calcium supplementation for prevention of primary hypertension (Review)
1. Any adverse event2. Withdrawals due to adverse events3. Kidney stone formation4. Iron deficiency anaemia5. Anaemia6. Total mortality7. Cardiovascular events8. Myocardial infarction9. Stroke
10. Sudden death
Search methods for identification of studies
Electronic searches
We searched the Database of Abstracts of Reviews of Effects(DARE) and the Cochrane Database of Systematic Reviews forrelated reviews.We searched the following databases for primary studies: theCochrane Hypertension Group Specialised Register (all years toOctober 2014), the Cochrane Central Register of Controlled Trials(CENTRAL) (2014 Issue 9), MEDLINE (1946 - October 2014),EMBASE (1974 - October 2014) and ClinicalTrials.gov (all yearsto October 2014). The Cochrane Hypertension Group SpecialisedRegister includes controlled trials from searches of the CochraneCentral Register of Controlled Trials (CENTRAL), MEDLINE,EMBASE, AGRICOLA, Allied and Complementary Medicine(AMED), BIOSIS, CAB Abstracts, CINAHL, Food Science andTechnology Abstracts (FSTA), Global Health, International Phar-maceutical Abstracts (IPA), LILACS, ProQuest Dissertations &Theses, PsycINFO, SCIRUS, Web of Science and the WHO In-ternational Clinical Trials Registry Platform (ICTRP).We searched electronic databases using a strategy combining theCochrane Highly Sensitive Search Strategy for identifying ran-domised trials in MEDLINE: sensitivity- and precision-max-imising version (2008 revision) with selected MeSH terms andfree-text terms relating to calcium. The MEDLINE search strat-egy (Appendix 1) was translated into CENTRAL (Appendix2), EMBASE (Appendix 3), the Cochrane Hypertension GroupSpecialised Register (Appendix 4), LILACS (Appendix 5), andClinicalTrials.gov (Appendix 6) using the appropriate controlledvocabulary as applicable. We applied no language restrictions.We also searched systematic reviews and meta-analyses from thesedatabases to check their reference lists, as well as those of ran-domised controlled trials included in the review.
Searching other resources
Other sources:1. Reference lists of all papers and relevant reviews identified
2. We contacted authors of relevant papers regarding anyfurther published or unpublished work
3. We contacted authors of trials reporting incompleteinformation to provide the missing information
4. We searched ISI Web of Science for papers citing studiesincluded in the review
Data collection and analysis
Pairs of review authors independently assessed the methodologicalquality and other inclusion criteria of the identified trials, resolvingdisagreements by consensus.
Selection of studies
We imported references and abstracts of searched results toEarly Reviewer Organizing Software (EROS) (Ciapponi 2011;Glujovsky 2010), basing selection of studies on the criteria listedabove.
Data extraction and management
Two review authors independently extracted data, using a standardform, and then cross checked them. A third person confirmed allnumeric calculations and graphic interpolations.Descriptive data include authors, year of publication, country,time span of the trial, gender, type of placebo, baseline dietarycalcium intake, type, dose and duration of calcium-related inter-vention, compliance, co-interventions, trial quality assessments,and numbers randomised and analysed.The position of the participant during blood pressure measure-ment may affect the blood pressure-lowering effect. However, inorder to not lose valuable data if only one position was reported,we collected data from that position. When blood pressure mea-surement data were available in more than one position, sittingblood pressure is the first preference. If both standing and supinemeasurements were available, we used standing blood pressure.
Assessment of risk of bias in included studies
GC and MLC independently assessed risks of bias for each studyusing the criteria outlined in the Cochrane Handbook for SystematicReviews of Interventions (Higgins 2011). We resolved any disagree-ment through discussion with the whole team. We made explicitjudgements about whether studies had high risk of bias, accordingto the criteria described below. We assessed the magnitude anddirection of the bias and whether we considered it was likely toimpact on the findings through sensitivity analysis. See Sensitivityanalysis below.
7Calcium supplementation for prevention of primary hypertension (Review)
(1) Sequence generation (checking for possible selection bias)
We describe the method used to generate the allocation sequencefor each included study in sufficient detail to allow an assessmentof whether it should produce comparable groups.We assessed the method as:
• low risk of bias (any truly random process, e.g. random number table; computer random number generator)
• high risk of bias (any non-random process, e.g. odd or even date of birth; hospital or clinic record number)
• unclear risk of bias
(2) Allocation concealment (checking for possible selection
bias)
We describe the method used to conceal the allocation sequencefor each included study and determine whether intervention allo-cation could have been foreseen in advance of or during recruit-ment, or changed after assignment.We assessed the methods as:
• low risk of bias (e.g. telephone or central randomisation; consecutively-numbered sealed opaque envelopes)
• high risk of bias (open random allocation; unsealed or non-opaque envelopes, alternation; date of birth)
• unclear risk of bias
(3) Blinding (checking for possible performance bias)
We describe for each included study the methods used, if any, toblind study participants and personnel from knowledge of whichintervention a participant received. We consider studies at low riskof bias if they are blinded, or if we judge that the lack of blindingcould not have affected the results. We assessed blinding separatelyfor different outcomes or classes of outcomes.We assessed the methods as:
• low, high or unclear risk of bias for participants
• low, high or unclear risk of bias for personnel
• low, high or unclear risk of bias for outcome assessors
8Calcium supplementation for prevention of primary hypertension (Review)
(4) Incomplete outcome data (checking for possible attrition
bias through withdrawals, dropouts, protocol deviations).
We describe for each included study, and for each outcome or classof outcomes, the completeness of data including attrition and ex-clusions from the analysis. We state whether attrition and exclu-sions were reported, the numbers included in the analysis at eachstage (compared with the total randomised participants), reasonsfor attrition or exclusion where reported, and whether missing datawere balanced across groups or were related to outcomes. Wheresufficient information was reported, or was supplied by the trialauthors, we re-included missing data in the re-analyses.We assessed methods as:
• low risk of bias (e.g. no missing outcome data; missing outcome data balanced across groups)
• high risk of bias (e.g. numbers or reasons for missing data imbalanced across groups; ’as treated’ analysis done with substantialdeparture of intervention received from that assigned at randomisation)
• unclear risk of bias
(5) Selective reporting bias
We describe for the included study how we investigated the pos-sibility of selective outcome reporting bias and our findings.We assessed the methods as:
• low risk of bias (where it is clear that all of the study’s prespecified outcomes and all expected outcomes of interest to the reviewhave been reported)
• high risk of bias (where not all the study’s prespecified outcomes have been reported; one or more reported primary outcomeswere not prespecified; outcomes of interest are reported incompletely and so cannot be used; study fails to include results of akey outcome that would have been expected to have been reported)
• unclear risk of bias
(6) Other sources of bias
We describe any important concerns we have about other possiblesources of bias for each included study.We assessed whether the study was free of other problems thatcould put it at risk of bias and record our judgement as:
9Calcium supplementation for prevention of primary hypertension (Review)
• low risk of bias (the study appears to be free of other sources of bias)
• high risk of bias (potential source of bias related to the specific study design used; or has been claimed to have been fraudulent;or had some other problem)
• unclear risk of bias
Measures of treatment effect
For continuous data, we used the mean difference (MD) if out-comes were measured in the same way between trials. We usedthe standardised mean difference (SMD) to combine trials thatmeasure the same outcome but used different methods.
Unit of analysis issues
In the case of studies with more than one treatment comparisonwe divided the control groups by the number of subgroups.
Dealing with missing data
In the case of missing information in the included studies, we con-tacted investigators (using email, letter and/or fax) to obtain themissing information. In the case of missing standard deviation ofblood pressure change, we imputed the standard deviation basedon the information in the same trial or from other trials whichassessed calcium-related interventions. We used the following hi-erarchy (listed from high to low preference) to impute standarddeviation values:
1. standard deviation of change in blood pressure taken in a different position from that of the blood pressure data used
2. standard deviation of blood pressure at the end of treatment
3. standard deviation of blood pressure at the end of treatment measured in a different position from that of the blood pressuredata used
4. standard deviation of blood pressure at baseline (except if this measure is used as an entry criterion)
5. mean standard deviation of change in blood pressure from other trials assessing calcium-related interventions
Assessment of heterogeneity
We assessed statistical heterogeneity in each meta-analysis usingthe T², I² and Chi² statistics (Higgins 2003; Higgins 2011). Weregarded heterogeneity as moderate if T² was greater than zero andeither I² was greater than 30% or there was a low P value (less than0.10) in the Chi² test for heterogeneity. I² values greater than 50%indicate high levels of heterogeneity.
Assessment of reporting biases
We investigated reporting biases (such as publication bias) by pro-ducing funnel plots. We assessed funnel plot asymmetry visually.
In case of asymmetry suggested by a visual assessment, we plannedto perform exploratory analyses to investigate it.
Data synthesis
We carried out statistical analysis using the Review Manager 5software (RevMan 2014). For continuous data, we used the meandifference (MD) and its 95% confidence interval (CI) if outcomeswere measured in the same way between trials. We used the stan-dardised mean difference (SMD) to combine trials that measurethe same outcome but using different methods. We compared cat-egorical data using risk ratios (RRs) and their 95% CIs. We testedfor statistical heterogeneity among trials using the I² statistic. We
10Calcium supplementation for prevention of primary hypertension (Review)
used fixed-effect meta-analysis for combining data where it wasreasonable to assume that studies were estimating the same under-lying treatment effect, i.e. where trials were examining the sameintervention, and we judged the trials’ populations and methods tobe sufficiently similar. If there was clinical heterogeneity sufficientto expect that the underlying treatment effects differed betweentrials, or if we detected substantial statistical heterogeneity, weused random-effects meta-analysis to produce an overall summarywhere we considered an average treatment effect across trials wasclinically meaningful. We treated the random-effects summary asthe average range of possible treatment effects, and we discussedthe clinical implications of treatment effects differing between tri-als. If the average treatment effect was not clinically meaningfulwe did not combine trials.
Subgroup analysis and investigation of heterogeneity
We carried out the following subgroup analyses:• We analysed sex and age using recommended nutrient
intake age groups (1 to less than 4 years; 4 to less than 6 years; 6to less than 10 years; 10 to less than 19 years; 19 to less than 50years; 50 and over), for men and women.
• Ethnicity
• Duration of calcium intervention• Dose received• Intake of other minerals: where possible we analysed groups
according to intakes of minerals involved in blood pressureregulation such as sodium, magnesium, potassium
• Fat intake• Baseline calcium intake: we divided population groups into
low or adequate calcium intake, according to WHO Food andAgriculture Organization (FAO) recommendations by age group
• Baseline blood pressure: high blood pressure as defined bytrial authors. Ideally, high blood pressure would be defined asdiastolic blood pressure ≥ 90 mmHg (or systolic blood pressure≥ 140 mmHg).
Sensitivity analysis
We planned sensitivity analyses to explore the effect of trial qualityassessed by concealment of allocation, high attrition rates, or both,with poor-quality studies being excluded from the analyses in orderto assess whether this made any difference to the overall result.We tested the robustness of the results using several sensitivityanalyses, including:
1. Trials that are industry-sponsored versus non-industry sponsored
2. Trials with blood pressure data measured in the sitting position versus other measurement positions
3. Trials with reported standard deviations of blood pressure change versus imputed standard deviations
4. Risk of bias items
In order to explore the robustness of the results, we performed fourpost hoc sensitivity analyses. The first sensitivity analysis was bymean difference and standardised mean difference in those caseswhen the result combined final blood pressure values and bloodpressure change from baseline. We decided to present the results asmean differences, as they are easier to interpret; however in orderto be more accurate we compared the mean difference results withthe standardised mean differences. We based the other analyseson duration of intervention, on blood pressure methodology (aus-cultatory and oscillometric method) and on clinic blood pressuremeasurements and automated ambulatory blood pressure.
R E S U L T S
Description of studies
Results of the search
We retrieved 1627 references by the electronic searches and con-sidered 88 as potentially eligible after screening. See Figure 1.
11Calcium supplementation for prevention of primary hypertension (Review)
We included 16 randomised trials coming from 18 articles (therewere two secondary references for Lyle 1987 and Lijnen 1995).See Characteristics of included studies.Participants
Most of the studies were performed in adults; four studies wereperformed in older men and women (Reid 2005; Reid 2010;Thomsen 1987; Van Beresteyn 1986), one study in teenagers (Davis 1996) and one in 11-year-old children (Gillman 1995).We found 11 studies (Belizan 1983; Cutler 1992; Gillman 1995;Hilary Green 2000; Johnson 1985; Lyle 1992; Reid 2005; Reid2010; Sacks 1998; Shidfar 2010; Van Beresteyn 1986) reportingbaseline mean calcium intake with values ranging from around400 mg to 1120 mg a day in adult groups. Using this range, weorganised the studies into three categories: less than 600 mg a day,600 to less than 800 mg a day, and 800 mg a day or more, asnone of the studies in adult populations had intakes above theFAO Recommended Dietary Intake of 1000 mg per day for peoplebetween 19 and 50 years of age.We found five studies that only included women (Johnson 1985;Reid 2005; Sacks 1998; Thomsen 1987; Van Beresteyn 1986) andfour studies that only included men (Lijnen 1995; Lyle 1987; Reid2010; Shidfar 2010).Sample sizes
For most studies the sample size was less than 100 participants;three studies had a sample size between 100 and 200 participantsand the two largest studies were Cutler 1992 with 471 participantsand Reid 2005 with 1471 participants.Settings
Most studies were performed in higher-income countries, witheight set in the USA (Cutler 1992; Davis 1996; Gillman 1995;Johnson 1985; Lyle 1987; Lyle 1992; McCarron 1985; Sacks1998), three in New Zeland (Hilary Green 2000; Reid 2005; Reid2010), three in Europe (Lijnen 1995 in Belgium; Thomsen 1987in Denmark; Van Beresteyn 1986 in the Netherlands). Two studieswere set in middle-income countries: Belizan 1983 in Guatemalaand Shidfar 2010 in Iran.Interventions
The intervention consisted of a supplement tablet in 13 studies,while one study (Hilary Green 2000) evaluated the effect of two
servings per day of high-calcium skim milk versus ordinary skimmilk (control), and two studies used a fortified juice (Gillman1995; Van Beresteyn 1986).For most studies the intervention was 1000 to 2000 mg of elemen-tal calcium per day. Two studies had an intervention group with600 mg of calcium a day (Gillman 1995; Reid 2010) and anotherstudy compared a high-calcium skim milk containing 1075 mg to720 mg of the non-fortified skim milk (Hilary Green 2000).Seven studies used calcium carbonate for the intervention (Cutler1992; Johnson 1985; Lyle 1992; Lyle 1987; Shidfar 2010; Sacks1998; Van Beresteyn 1986); three studies used calcium citrate(Gillman 1995; McCarron 1985; Reid 2005), one study used glu-conate (Lijnen 1995) and two studies used a combination of cal-cium salts (Belizan 1983; Thomsen 1987). Three did not reportthe salt used (Davis 1996; Hilary Green 2000; Reid 2010).We did not specify a minimum intervention time in order to in-clude studies. However the included studies had a median follow-up intervention period of 3.5 months. After initiation of calciumsupplementation, blood pressure seemed to stabilise at between1.5 and 2.5 months (Belizan 1983). Four studies had interventionsthat lasted a year or more: Thomsen 1987 one year, Reid 2010two years, Reid 2005 two-and-a-half years and Johnson 1985 fouryears.
Excluded studies
We excluded four studies for not having a randomised controlledtrial (RCT) design, three studies for not reporting the number ofparticipants (Dwyer 1998; Morris 1988; Smith 1987), two studieshad a co-intervention that could affect the blood pressure result(Eftekhari 2009; Shalileh 2010), two studies included hypertensivepeople (Pan 1993; Bostick 2000) and in two studies the outcomewas not change in blood pressure (Karanja 1987; Pan 2000). SeeCharacteristics of excluded studies.
Risk of bias in included studies
See Figure 2; Figure 3. Some information to assess risk of bias wasnot available for 10 published papers. We found contact details foreight of those studies and obtained the required information fromfive (Cutler 1992; Gillman 1995; Lyle 1987; Lyle 1992; Sacks1998).
13Calcium supplementation for prevention of primary hypertension (Review)
Figure 3. Risk of bias graph: review authors’ judgements about each risk of bias item presented as
percentages across all included studies.
Allocation
Allocation concealment risk of bias was low for seven of the 16included studies, and unclear or not described or the remainingnine studies. For the seven studies classified as low risk, allocationwas made by a centralised unit or packets were of identical appear-ance and were numbered at randomisation.
Blinding
Blinding bias was low for 11 of the 16 studies and unclear ornot described for the remaining five studies. For the 11 studiesclassified as low risk of performance bias, blinding of participantsand personnel was ensured by a double-blind design and identicalappearance of the food or supplement provided.Studies at low risk of detection bias used a random-baseline sphyg-momanometer, a blood pressure machine that automatically en-tered the blood pressure data on computer tape, an ambulatoryblood pressure monitor, or trained personnel who were blinded tothe allocation groups.
Incomplete outcome data
Attrition bias was low for 10 of the 16 studies, while we classifiedtwo studies at high risk (Belizan 1983; Johnson 1985), as theyhad more than 10% dropouts. For the remaining four studies theinformation was unclear or not described.
Selective reporting
We classified all studies at low risk of reporting bias, as all primaryoutcomes were addressed or there was no evidence of selectivereporting bias.
Other potential sources of bias
We detected no other bias for 12 of the 16 studies. Davis 1996 didnot present baseline characteristics of the population so we rated itas at unclear risk. We rated three studies at high risk of bias: base-line characteristics of intervention and placebo groups presentedsmall differences (in different directions) in Hilary Green 2000;in Lyle 1992 the treatment group presented at baseline more menthan the placebo group, although blood pressure values showed nodifference; and in Thomsen 1987 placebo participants had higherinitial weight and lower systolic blood pressure.
Effects of interventions
See: Summary of findings for the main comparison Calciumsupplementation/fortification compared to control for preventionof primary hypertension
Primary outcomes
Hypertension defined as blood pressure ≥ 140/90 mmHg. Noneof the studies reported hypertension as a dichotomous outcome.
15Calcium supplementation for prevention of primary hypertension (Review)
• Effect considering all the studies reporting change or
final value of blood pressure
There was a reduction in blood pressure with calcium supple-mentation/fortification compared with control. The overall effecton systolic blood pressure was a mean difference (MD) of -1.43mmHg (95% confidence interval (CI) -2.15 to -0.72) reportedin 16 trials (N = 3048) with low heterogeneity (P = 0.68; I² =0%) (Analysis 1.1) and the effect on diastolic blood pressure was -0.98 mmHg (95% CI -1.46 to -0.50) in 15 trials (N = 2947) withmoderate heterogeneity (P = 0.01; I² = 49%) (Analysis 1.2).
• Effect considering only the studies reporting change in
blood pressure
The estimated effect on change in systolic pressure was -1.28mmHg (95% CI -2.04 to -0.52), reported in nine trial subgroups(N = 2694) (Analysis 1.3). The estimated effect on change in dias-tolic pressure was -0.96 mmHg (95% CI -1.47 to -0.45) reportedin eight trials (N = 2593) (Analysis 1.4). Heterogeneity was low forsystolic blood pressure (P = 0.50; I² = 0%) and high for diastolic(P = 0.005; I² = 62%).
• Effect considering only the studies reporting final values
of blood pressure
The estimated effect on final systolic blood pressure was -2.19mmHg (95% CI -3.84 to -0.54), reported in 10 trials (N = 538)(Analysis 1.5) and on diastolic blood pressure - 1.22 mmHg (95%CI -2.52 to -0.08), reported in nine trials (N = 437) (Analysis 1.6).Heterogeneity was low for both systolic (P = 0.27; I² = 18%) anddiastolic blood pressure (P = 0.22; I² = 24%).
Subgroup analyses
We report tests for subgroup differences only when P values wereless than 0.1.
Analysis by sex
Of the 16 studies included, 10 studies (Belizan 1983; Johnson1985; Lijnen 1995; Lyle 1987; Reid 2005; Reid 2010; Sacks 1998;Shidfar 2010; Thomsen 1987; Van Beresteyn 1986) presented theresults by sex.
• Effect considering all the studies reporting change or
final value of blood pressure
The overall effect on systolic blood pressure was -1.45 mmHg(95% CI -2.78 to -0.12) for women, six studies (N = 1823) withlow heterogeneity (P = 0.90; I² = 0%) and -2.07 mmHg (95%CI -3.56 to -0.59) for men, five studies (N = 507) with low het-erogeneity (P = 0.37; I² = 8%) (Analysis 1.1). The effect on dias-tolic blood pressure was -0.92 mmHg (95% CI -1.71 to -0.14) forwomen, six studies (N = 1823) with low heterogeneity (P = 0.35;I² = 10%) and -1.91 mmHg (95% CI -2.80 to -1.02) in men,
five studies (N = 617) with moderate heterogeneity (P = 0.12; I² =41%) (Analysis 1.2) (Test for subgroup differences: Chi² = 7.15,df = 2 (P = 0.03), I² = 72.0%).
• Effect considering only the studies reporting change in
blood pressure
For those studies showing change in systolic blood pressure theeffect was -1.53 mmHg (95% CI -2.97 to -0.09) for women, threestudies (N = 1656) with low heterogeneity (P = 0.51; I² = 0%) and-1.85 mmHg (95% CI -3.45 to -0.25) for men, four studies (N =432) with low heterogeneity (P = 0.23; I² = 29%) (Analysis 1.3).The effect on diastolic was -1.13 mmHg (95% CI -1.98 to -0.29)for women, three studies (N = 1656) with moderate heterogeneity(P = 0.21; I² = 36%) and -2.01 mmHg (95% CI -2.94 to -1.08)for men, four studies (N = 432) with high heterogeneity (P = 0.06;I² = 57%) (Analysis 1.4).
• Effect considering only the studies reporting final values
of blood pressure
In those studies reporting final values the effect on systolic bloodpressure was -1.01 mmHg (95% CI -4.49 to 2.48) for women,three studies (N = 167) with low heterogeneity (P = 0.90; I² = 0%)and -5.27 mmHg (95% CI -8.53 to -2.01) for men, two studies(N = 124) with low heterogeneity (P = 0.30; I² = 17%) (Analysis1.5). On diastolic blood pressure the effect was 0.51 mmHg (95%CI -1.70 to 2.73) in women, three studies (N = 167) with lowheterogeneity (P = 0.74; I² = 0%) and -1.88 mmHg (95% CI -4.26to 0.50) in men, two studies (N = 124) with low heterogeneity (P= 0.46; I² = 0%) (Analysis 1.6).
Analysis by age
Although all studies reported the age groups of the population,most of them did not present their results by age group, so it wasnot possible to do the analysis using the groups originally planned.We divided studies into those that presented a mean age of lessthan 35 years and those with a mean age of 35 or more.
• Effect considering all the studies reporting change or
final value of blood pressure
The overall effect on systolic blood pressure was -2.11 mmHg(95% CI -3.58 to -0.64) for those younger than 35 years, sevenstudies (N = 399) with moderate heterogeneity (P = 0.36; I² =9%) and -0.96 mmHg (95% CI -1.83 to -0.09) for those aged35 years or more, nine studies (N = 2649) with low heterogeneity(P = 0.81; I² = 0%) (Analysis 1.7). The overall effect on diastolicblood pressure was -2.61 mmHg (95% CI -3.74 to -1.49) forthose younger than 35 years, six studies (N = 298) with highheterogeneity (P = 0.02; I² = 60%) and -0.59 mmHg (95% CI -1.13 to -0.06) for those aged 35 years or more, nine studies (N =2649) with low heterogeneity (P = 0.70; I² = 0%) (Analysis 1.8)(Test for subgroup differences: Chi² = 10.09, df = 1; P = 0.001, I²= 90.1%).
16Calcium supplementation for prevention of primary hypertension (Review)
• Effect considering only the studies reporting change in
blood pressure
For those studies showing change in systolic blood pressure theeffect was -2.56 mmHg (95% CI -4.90 to -0.23) for those youngerthan 35 years, two studies (N = 89) with low heterogeneity (P =0.30; I² = 16%) and -0.98 mmHg (95% CI -1.87 to -0.10) forthose aged 35 years or more, five studies (N = 2470) with lowheterogeneity (P = 0.40; I² = 2%) (Analysis 1.9). The effect ondiastolic blood pressure was -3.96 mmHg (95% CI -5.48 to -2.44)for those younger than 35 years, two studies (N = 89) with lowheterogeneity (P = 0.56; I² = 0%) and -0.58 mmHg (95% CI -1.13 to -0.04) for those aged 35 years or more, five studies (N= 2470) with low heterogeneity (P = 0.34; I² = 12%) (Analysis1.10).
• Effect considering all the studies reporting change or
final value of blood pressure
In those studies reporting final values the effect for systolic bloodpressure was -1.81 mmHg (95% CI -3.71 to 0.09) for thoseyounger than 35 years, five studies (N = 310) with low hetero-geneity (P = 0.29; I² = 19%) and -3.39 mmHg (95% CI -6.76 to-0.03) for those aged 35 years or more, five studies (N = 228) withlow heterogeneity (P = 0.25; I² = 26%) (Analysis 1.11); diastolicblood pressure was -0.99 mmHg (95% CI -2.66 to 0.68) in thoseyounger than 35 years, four studies (N = 209) with high hetero-geneity (P = 0.05; I² = 58%) and -1.58 mmHg (95% CI -3.65 to0.49) in those aged 35 years or more, five studies (N = 228) withlow heterogeneity (P = 0.70; I² = 0%) (Analysis 1.12).
Analysis by basal calcium intake
Of the 16 studies included, 11 studies presented the results bybasal calcium intake. See Description of studies. However onestudy (Gillman 1995) was carried out in children, so we excludedit from the analysis as the nutrient recommendations for childrenare different, and another study (Lyle 1992) gave a range of intakesand could not be classified for this analysis.
• Effect considering all the studies reporting change or
final value of blood pressure
The effect on systolic blood pressure was -1.70 mmHg (95% CI-6.33 to 2.33) for those that were consuming on average less than600 mg, one study (N = 58); -0.87 mmHg (-0.1.88 to 0.13) forthose that consumed between 600 and 800 mg of calcium perday, five studies (N = 786) without heterogeneity (P = 0.44; I²= 0%); and -01.34 mmHg (95% CI -2..80 to 0.13) for thoseconsuming more than 800 mg of calcium per day, four studies(N = 1860) (Analysis 1.13). The overall effect on diastolic bloodpressure was 1.40 mmHg (95% CI -1.90 to 4.70) for those thatwere consuming on average less than 600 mg of calcium per day,one study (N = 58); -0.41 mmHg (95% CI -1.11 to 0.29) for thosethat consumed between 600 and 800 mg of calcium per day, fivestudies (N = 786) with high heterogeneity (P = 0.08; I² = 52%);
and -1.14 mmHg (95% CI -1.96 to -0.33) for those consumingmore than 800 mg of calcium per day, three studies (N = 1822)with low heterogeneity (P = 0.25; I² = 25%) (Analysis 1.14).
• Effect considering only the studies reporting change in
blood pressure
None of the studies showing basal calcium intake and reportingchange in blood pressure had a group with calcium intake less than600 mg/day.For those studies showing change in systolic blood pressure theeffect was -0.90 mmHg (95% CI -1.92 to 0.12) for those whoconsumed between 600 and 800 mg of calcium per day, fourstudies (N = 705) with low heterogeneity (P = 0.30; I² = 19%)and -1.37 mmHg (95% CI -2.86 to 0.12) for those consumingmore than 800 mg of calcium per day, three studies (N = 1822)with low heterogeneity (P = 0.64; I² = 0%) (Analysis 1.15). Theeffect on diastolic blood pressure was -0.43 mmHg (95% CI -1.15to 0.29) for those who consumed between 600 and 800 mg ofcalcium per day, four studies (N = 705) with high heterogeneity(P = 0.04; I² = 63%) and -1.14 mmHg (95% CI -1.96 to -0.33)for those consuming more than 800 mg of calcium per day, threestudies (N = 1822) with moderate heterogeneity (P = 0.15; I² =44%) (Analysis 1.16).
• Effect considering all the studies reporting final value of
blood pressure
In those studies reporting final values the effect on systolic bloodpressure was -1.70 mmHg (95% CI -6.33 to 2.93) for those con-suming less than 600 mg a day, one study (N = 58); -4.56 mmHg(95% CI -8.58 to -0.54) for those who consumed between 600and 800 mg of calcium per day, two studies (N = 130) with highheterogeneity (P = 0.04; I² = 77%) and 0.00 mmHg (95% CI -8.93 to 8.93) for those consuming more than 800 mg of calciumper day, one study (N = 38) (Analysis 1.17). The effect on diastolicblood pressure was 1.40 mmHg (95% CI -1.90 to 4.70) for thoseconsuming less than 600 mg a day, one study (N = 58); -1.49mmHg (95% CI -4.00 to 1.01) for those who consumed between600 and 800 mg of calcium per day, two studies (N = 130) withmoderate heterogeneity (P = 0.16; I² = 48%) and -1.00 mmHg(95% CI -6.72 to 4.72) for those consuming more than 800 mgof calcium per day, one study (N = 38) (Analysis 1.18).
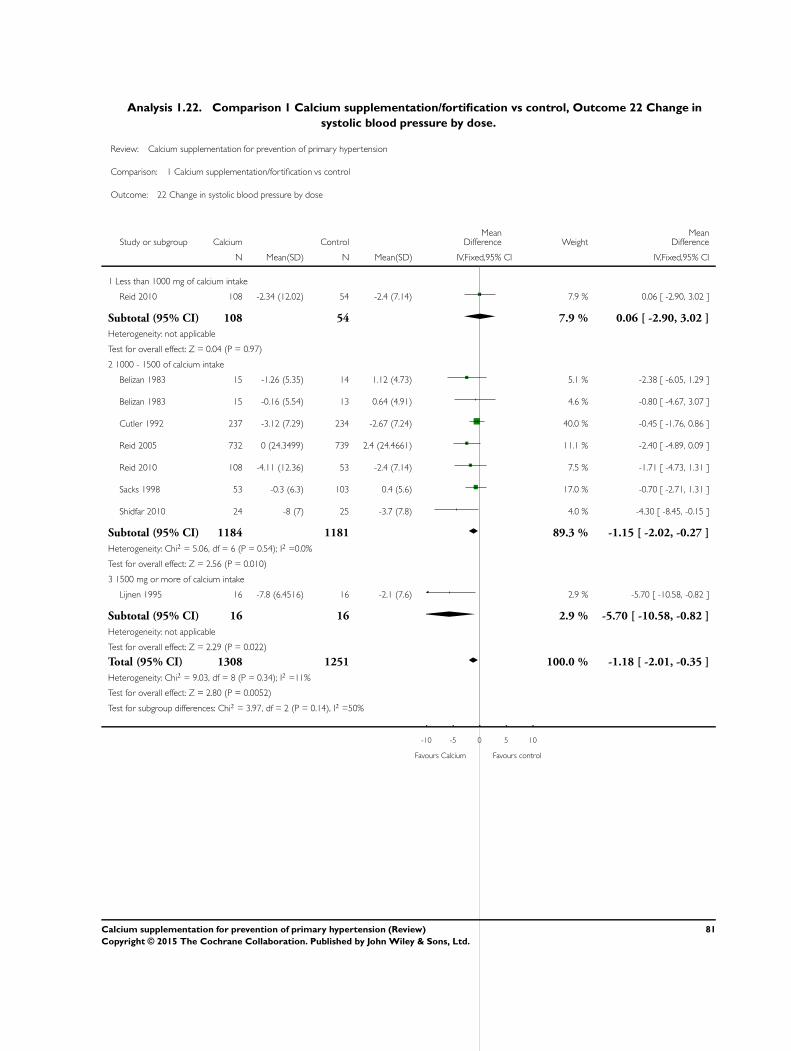
Analysis by dose
• Effect considering all the studies reporting change or
final value of blood pressure
The overall effect on systolic blood pressure was 0.08 mmHg (95%CI -2.16 to 2.32) for the group with doses less than 1000 mg, twostudies (N = 263) with low heterogeneity (P = 0.99; I² = 0%), -1.14 mmHg (95% CI -2.01 to -0.27) with doses between 1000and 1500 mg, eight studies (N = 2435) with low heterogeneity(P = 0.74; I² = 0%) and -2.79 mmHg (95% CI -4.71 to -0.86)
17Calcium supplementation for prevention of primary hypertension (Review)
with doses more than 1500 mg, seven studies (N = 350) with lowheterogeneity (P = 0.45; I² = 0%) (Analysis 1.19).The overall effect on diastolic blood pressure was -0.54 mmHg(95% CI -2.23 to 1.15) for the group with doses less than 1000mg, one study (N = 162), -0.71 mmHg (95% CI -1.37 to -0.06)with doses between 1000 and 1500 mg, seven studies (N = 964)with high heterogeneity (P = 0.03; I² = 55%) and -1.43 mmHg(95% CI -2.22 to -0.64) with doses more than 1500 mg, eightstudies (N = 1821) with high heterogeneity (P = 0.04; I² = 51%)(Analysis 1.20).
• Effect considering all the studies reporting change or
final value of blood pressure
For those studies showing change in systolic blood pressure theeffect was 0.06 (95%CI -2.90 to 3.02) with less than 1000 mg ofcalcium intake one study (N = 162), -1.15 (95%CI -2.02 to -0.27)with 1000 - 1500 of calcium intake, six studies (N = 2365) and -5.70 (95%CI -10.58 to -0.82) with 1500 mg or more of calciumintake, one study (N= 32) (Analysis 1.22)For those studies showing change in diastolic blood pressure theeffect was -0.54 (95%CI -2.23 to 1.15) with less than 1000 mg ofcalcium intake one study (N = 162), -0.68 (95%CI -1.35 to -0.02)with 1000 - 1500 of calcium intake, five studies (N = 894) and -1.69 (95%CI -2.64 to -0.75) with 1500 mg or more of calciumintake, two studies (N= 1503) (Analysis 1.21)
• Effect considering all the studies reporting final value of
blood pressure
For those studies reporting final values in systolic blood pressurethe effect was 0.10 (95%CI -3.33 to 3.53) with less than 1000mg of calcium intake one study (N = 101),-0.70 (95%CI -7.90to 6.50) with 1000 - 1500 of calcium intake, two studies (N =70) and -2.25 (95%CI -4.34 to -0.16) with 1500 mg or more ofcalcium intake, six studies (N= 318) (Analysis 1.23)For those studies reporting final values in diastolic blood pressurethe effect was -1.91 (95%CI -6.13 to 2.30) with 1000 - 1250 ofcalcium intake, two studies (N = 70) and -0.80 (95%CI -2.26 to0.65) with 1500 mg or more of calcium intake, six studies (N=318) (Analysis 1.24).
Analysis by intervention duration
The overall effect on systolic blood pressure was -1.79 mmHg(95% CI -2.92 to -0.67) where the intervention lasted less than sixmonths, 11 studies (N = 674) with low heterogeneity (P = 0.47;I² = 0%) and -0.83 mmHg (95% CI -1.83 to 0.17) where the in-tervention lasted six months or more, five studies (N = 2374) withlow heterogeneity (P = 0.76; I² = 0%) (Analysis 1.25). The overalleffect on diastolic blood pressure was -1.95 mmHg (95% CI -2.77 to -1.14) where the intervention lasted less than six months,10 studies (N = 573) with moderate heterogeneity (P = 0.03; I² =48%) and -0.43 mmHg (95% CI -1.03 to 0.17) where the inter-vention lasted six months or more, five studies (N = 2374) with
The overall effect on systolic blood pressure was -1.33 mmHg(95% CI -2.10 to -0.56) where the intervention was food sup-plementation, 14 studies (N = 2909) with low heterogeneity (P =0.51; I² = 0%) and 0.09 mmHg (95% CI -3.11 to 3.29) where theintervention was food fortification, two studies (N = 139) withlow heterogeneity (P = 0.98; I² = 0%) (Analysis 1.27). The overalleffect on diastolic blood pressure was -0.97 mmHg (95% CI -1.45to, -0.48) where the intervention was food supplementation, 14studies (N = 2909) with high heterogeneity (P = 0.006; I² = 53%)and -1.00 mmHg (95% CI -6.72 to 4.72) where the interventionwas food fortification, one study (N = 38) (Analysis 1.28).
Analysis by ethnicity, fat intake, other minerals
It was not possible to do this analysis presented in the protocol, asthe information was not available.Planned sensitivity analysis results:
1- Sensitivity analysis of risk of bias
Figure 2 shows risks of bias classification of studies.Mean effect on systolic blood pressure in 16 studies (N = 3048)(mean difference in all cases) was -1.43 mmHg (-2.15 to -0.72).When we restricted the analyses to only those studies with low riskof bias the results still showed a significant effect:1- Random sequence: -1.26 mmHg (-2.04 to -0.49) in 10 studies(N = 1730)2- Allocation concealment: -1.20 mmHg (-2.09 to -0.31) in 7studies (N = 1193)3- Blinding of participants: -1.35 mmHg (-2.11 to -0.59) in 12studies (N = 2788)4- Blinding of outcome assessment: -1.34 mmHg (-2.10 to -0.58)in 11 studies (N = 2800)5- Incomplete outcome data: -1.46 mmHg (-2.35 to -0.57) in 10studies (N =1211)Mean effect on diastolic blood pressure in 15 studies (N = 2947)was -0.98 mmHg (-1.46 to -0.50). When we restricted the analysesto only those studies with low risk of bias the results still showeda significant effect:1- Random sequence: -0.87 mmHg 9-1.40 to -0.34) in 9 studies(N =1629)2- Allocation concealment: -0.73 mmHg (-1.40 to -0.05) in 6studies (N =1092)3- Blinding of participants: -1.04 mmHg (-1.55 to -0.53) in 11studies (N = 2687)4- Blinding of outcome assessment: -0.81 mmHg (-1.33 to -0.29)in 10 studies (N = 2799)
18Calcium supplementation for prevention of primary hypertension (Review)
5- Incomplete outcome data: -0.87 mmHg (-1.52 to -0.22) in 9studies (N =1110)
2- Sensitivy analysis for industry-funded studies
We performed a sensitivity analysis excluding five studies that webelieved to be industry-funded (Gillman 1995; Hilary Green2000; Johnson 1985; Lijnen 1995; Reid 2010).Mean difference of the effect on systolic blood pressure excludingindustry-funded studies was -1.40 mmHg (95% CI -2.23 to -0.56)11 studies (N = 1473), whereas for the industry-funded studies
the mean difference was -1.54 mmHg (95% CI -2.94 to -0.15) 5studies (N=1575).Mean difference of the effect on diastolic blood pressure excludingindustry-funded studies was -0.78 mmHg (95% CI -1.33 to -0.22)11 studies (N = 1473), whereas for the industry-funded studiesthe mean difference was -1.59 mmHg (95% CI -2.55 to -0.64) 4studies (N=1474).
3- Sensitivity analysis by position of the participant during
blood pressure measurement
Systolic blood pressure
Sitting position (Belizan 1983; Gillman 1995; Johnson 1985) -1.60 mmHg (95% CI -3.23 to 0.03), 3 studies (N=299)
Standing (Lijnen 1995) -5.70 mmHg (95% CI -10.58 to -0.82), 1 study (N=32)
Supine (McCarron 1985; Thomsen 1987) -1.24 mmHg (95% CI -9.76 to 7.29), 2 studies (N=60)
19Calcium supplementation for prevention of primary hypertension (Review)
Sitting (Belizan 1983; Johnson 1985) -2.90 mmHg (95% CI -5.06 to -0.73), 2 studies (N=138)
Standing (Lijnen 1995) -3.50 mmHg (95% CI -5.29 to -1.71), 1 study (N=32)
Supine (McCarron 1985; Thomsen 1987) -2.29 mmHg (95% CI -7.07 to 2.48), 2 studies (N=60)
4- Sensitivity analysis for trials with imputed standard
deviations
We did not impute any standard deviation in the data used fromthese 16 trials.Post hoc sensitivity analyses
Sensitivity analysis comparing mean difference and standard-
ised mean difference results
We did a sensitivity analysis comparing mean difference (MD) andstandardised mean difference (SMD) results for all 24 outcomesreported in data analysis. Even though the mean difference resultswere in the same direction, of the 24 analyses performed, sevenpresented confidence intervals with different statistical significancebetween MD and SMD results, suggesting that we should be morecautious in interpreting these results. The following list shows caseswhere the confidence interval crosses the line of no effect on onemeasurement method but not on the other:
1. The mean difference effect on change of systolic bloodpressure for men was -1.85 mmHg (95% CI -3.45 to -0.25),whereas the standardised mean difference was -0.19 mmHg(95% CI -0.39 to 0.01) Analysis 1.3.
2. The mean difference effect on the final value of diastolicblood pressure for both genders was -2.33 mmHg (95% CI -4.50 to -0.17), whereas the standardised mean difference was -0.32 mmHg (95% CI -0.65 to 0.01) Analysis 1.6.
3. The mean difference effect on systolic blood pressure in thegroup with intakes higher than 800 mg a day was -1.34 mmHg(95% CI -2.80 to 0.13), whereas the standardised meandifference was -0.09 mmHg (95% CI -0.19 to -0.00) Analysis1.13.
4. The mean difference effect on change of systolic bloodpressure in the group with intakes higher than 800 mg a day was-1.37 mmHg (95% CI -2.86 to 0.12), whereas the standardisedmean difference was -0.10 mmHg (95% CI -0.19 to -0.00)Analysis 1.15.
5. The mean difference effect on the final value of systolicblood pressure in the group with intakes between 600 and 800mg a day was -4.56 mmHg (95% CI -8.58 to -0.54), whereas thestandardised mean difference was -0.30 mmHg (95% CI -0.65
to 0.05) Analysis 1.17.6. The overall mean difference effect on the final value of
systolic blood pressure by basal calcium intake was -2.99 mmHg(95% CI -5.86 to -0.11), whereas the standardised meandifference was -0.22 mmHg (95% CI -0.48 to 0.04) Analysis1.17.
7. The mean difference effect on systolic blood pressure forthose with interventions longer than six months was -0.83mmHg (95% CI -1.83 to 0.17), whereas the standardised meandifference was -0.08 mmHg (95% CI -0.16 to -0.00) Analysis1.25.When we analysed the results in units of standard deviation(SMDs), each study weight was modified; if the weight in-creased in those studies showing more effect, the final result usingthis method showed a higher effect. Correspondingly, when theweights were increased in the studies with no effect, the final resulttended to show a weaker global effect.Sensitivity analysis excluding studies with less than 3.5 months
of intervention
Of the 16 included studies, eight (Belizan 1983; Cutler 1992;Johnson 1985; Sacks 1998; Reid 2005; Reid 2010; Lijnen 1995;Thomsen 1987) presented interventions lasting more than3.5months (N=2619).The mean effect in systolic blood pressure was -1.43 mmHg (-2.15 to -0.72) (Analysis 1.1). When we performed a sensitivityanalysis only including the studies with interventions lasting morethan 3.5 months the results were still significant: -1.03 mmHg (-1.87 to -0.19).The mean effect in diastolic blood pressure was -0.98 mmHg (-1.46 to -0.50) (Analysis 1.2). When we performed a sensitivityanalysis only including the studies with interventions lasting morethan 3.5 months the results were still significant: -0.91 mmHg(95% CI -1.42 to -0.39).Sensitivity analysis by blood pressure methodology
Blood pressure was measured using an auscultatory method inseven studies (Belizan 1983; Cutler 1992; Johnson 1985; Lyle1992; Lyle 1987; McCarron 1985; Thomsen 1987; [N=786]).,and using an oscillometric method in six studies (Gillman 1995
20Calcium supplementation for prevention of primary hypertension (Review)
Sensitivity analysis by studies reporting clinic blood pressure
measurements and automated ambulatory blood pressure
Blood pressure was measured at a clinic in eight studies (Belizan1983; Gillman 1995; Cutler 1992; Johnson 1985; Lyle 1992;Lyle 1987; McCarron 1985; Thomsen 1987; [N=887]) and usingautomated ambulatory measurements in three studies (HilaryGreen 2000; Davis 1996; Sacks 1998; [N=228]).We did not find any study using ambulatory measurements re-ported by the participant. Those studies reporting ambulatorymeasurement were conducted with automated devices.
Systolic blood pleasure
Clinic measurements -1.25 mmHg (95% CI -2.22 to -0.28)
Automated ambulatory measurements -0.92 mmHg (95% CI -2.63 to 0.78)
Diastolic blood pressure
Clinic -0.61 mmHg (95% CI -1.39 to 0.16)
Automated ambulatory measurements -0.83 mmHg (95% CI -2.05 to 0.39)
Assessment of potential reporting biases (such as publicationbias)Funnel plot visual analysis revealed no asymmetry (Figure 4; Figure5)
22Calcium supplementation for prevention of primary hypertension (Review)
Figure 5. Funnel plot of comparison: 1 calcium supplementation/fortification vs control, Effect Mean
difference of Diastolic blood pressure.
Secondary Outcomes
Cutler 1992 is the only article evaluating side effects, but reportednone. A further two study reports (Lyle 1987; McCarron 1985)mentioned that the supplements were well tolerated and that noparticipants required withdrawal from the trial after randomisa-tion.No trials reported any incidence of kidney stone formation, irondeficiency anaemia, anaemia, cardiovascular events, myocardialinfarction, stroke or mortality.
D I S C U S S I O N
The aim of this review was to evaluate the effectiveness of calciumsupplementation, as a single nutrient, for the prevention of pri-mary hypertension. We analysed the effect of calcium according tosex, intervention dose, intervention duration, age of participantsand basal calcium intake.
Summary of main results
There was a reduction in both systolic and diastolic blood pres-sure in the groups receiving calcium compared to those receivingplacebo or control. The effect of calcium on diastolic blood pres-sure was higher in men than in women. We found a lower effect inthose studies that did not discriminate between the results by sex,and in at least one of those studies (Lyle 1992) a sex imbalance atrandomisation was reported as a possible explanation.The effect was confirmed in multiple prespecified subgroups. Wedetected a dose-response effect trend, both in systolic and in dias-tolic blood pressure, that could reinforce the efficacy of the inter-vention. Those studies with interventions of 1500 mg of calciuma day or higher showed a higher decrease in systolic and diastolicblood pressure than those studies with interventions less than 1000mg a day. For those studies with interventions of less than 1000mg we found no effect, although in this last group there were veryfew studies from which to draw any conclusion.When we evaluated the overall effect and change of blood pres-sure before and after the intervention with calcium, those studiesperformed in younger people tended to show higher reductions in
24Calcium supplementation for prevention of primary hypertension (Review)
systolic and diastolic blood pressure than those in older people.There was no difference in the effect by baseline calcium intake,reported in nine of the 16 included studies. This can be due to dif-ferent methods used in assessing calcium intake among the stud-ies. The information provided in this review therefore does notcontradict the possibility of a higher effect in populations withlow calcium intake, as has been suggested before (Belizan 1980;Belizan 1983; WHO 2009). Only two of the selected studies wereperformed in low- or middle-income countries.It is difficult to assess the effect of differences in the forms ofcalcium interventions, such as diet, fortification or supplements,since 14 of the 16 included studies used supplementation as theintervention.Our data show a greater effect in those studies lasting less thansix months. There is some suggestion that the effect might be lostover time in populations with adequate calcium intake, as somestudies showed no effect after 30 months (Reid 2005) and oneyear (Thomsen 1987).
Overall completeness and applicability ofevidence
We found a substantial number of studies to address the objectivesof the review, with no evidence of publication bias, although somepopulation groups such as children and teenagers might not be wellrepresented. Only one study was performed in children (Gillman1995), and one in teenagers (Davis 1996).The effect was higher in two studies from low- and middle-incomecountries (Belizan 1983; Shidfar 2010) (MD -2.41 mmHG, 95%CI -4.65 to -0.17); however, we also found an effect on bloodpressure reduction in high-income countries, 14 studies (-1.27mmHg, 95% CI -2.02 to -0.53).The effect on diastolic blood pressure was higher in men, in thoseyounger than 35 years old and in those receiving intervention forless than six months (Test for subgroup differences: P values 0.03,0.004 and 0.003 respectively).The other subgroup analyses look underpowered and thereforeneed to be interpreted very cautiously. For example, we observeda trend to higher effect with increasing doses; however the test forsubgroup differences P values was not statistically significant (0.14and 0.34 for systolic and diastolic blood pressure respectively).The findings of this review support the importance of an ade-quate calcium intake for the prevention of high blood pressureand the need to explore interventions to increase calcium intakein both men and women. For cardiovascular risk prevention, asmall decrease in blood pressure outweighs a larger decrease onlyamong hypertensive groups (Gillman 1995). Additionally, smallreductions in blood pressure of general population are predicted tohave important health implications, as they are shown to producerapid reductions in vascular disease risk even in individuals withnormal blood pressure ranges (Lewington 2002). Population-widedecreases in blood pressure of 2 - 3 mmHg could decrease the
prevalence of hypertension by 17%, the risk of coronary arterydisease by 6% and the risk of stroke by 15% (Cook 1995). A 2mmHg lower systolic blood pressure is predicted to produce about10% lower stroke mortality and about 7% lower mortality fromischaemic heart disease, and a 5 mmHg reduction in systolic bloodpressure at the population level is predicted to result in a 14%reduction in stroke death, 9% reduction in coronary artery dis-ease-related death and a 7% reduction in total mortality (Whelton2002). In the same way a 2 mmHg reduction in systolic bloodpressure in adults is estimated to have the potential to save about12,000 lives a year in the United States (Stamler 1991) and togenerate an increase in life expectancy of 1.8 months in men and1.4 months in women (Selmer 2000).
Quality of the evidence
We included 16 trials, with 3048 participants, providing high qual-ity evidence (Guyatt 2011) of the effect calcium supplementationon systolic and diastolic blood pressure (Summary of findings forthe main comparison).Risks of bias for random sequence generation and incomplete out-come data were low for 63% of the studies; allocation conceal-ment risk of bias was low for 44% of the studies and unclear forthe remainder; blinding of participants and personnel and risk ofdetection bias were low for 69% of the studies, and we rated allthe studies at low risk of reporting bias.
Potential biases in the review process
We restricted this review to clinical trials in which the interventionwas calcium supplementation as a single ingredient, which limitedthe number of studies we could include. On the other hand, weused an exhaustive search strategy to avoid publication selectionbias. Two review authors independently assessed the articles anddouble-checked data extraction to minimise errors.Many of the studies were old and even though in those cases wherepublished information was not enough to assess risk of bias, weattempted to contact authors, although the response was limited.Nevertheless, there was generally a low risk of bias.
Agreements and disagreements with otherstudies or reviews
Our results are in line with the most recent review by Van Mierlo2006 that includes a meta-analysis of 40 randomised controlledtrials (RCTs) with normotensive and hypertensive people, show-ing that supplementation with around 1 gm of calcium per daysignificantly reduces systolic blood pressure by 1.9 mmHg anddiastolic blood pressure by 1.0 mmHg. This review also founda higher effect in populations with low basal calcium intake. Ina previous meta-analysis involving 42 trials in normotensive andhypertensive people, the pooled analysis shows a reduction in sys-tolic blood pressure of -1.44 mmHg (95% CI -2.20 to -0.68; P <
25Calcium supplementation for prevention of primary hypertension (Review)
.001) and in diastolic blood pressure of -0.84 mmHg (95% CI -1.44 to -0.24; P < .001) (Griffith 1999).Our results are in the same direction as the Dickinson 2006 reviewin hypertensive people. Although this shows a statistically signifi-cantly larger reduction in blood pressure in the calcium group, theauthors interpret this as more likely reflecting a bias due to poorquality trials than a real effect. We performed a sensitivity analysisexcluding studies classified at high and moderate risk of bias. Allstudies were classified at low risk of selective reporting bias, sowe could conduct no analysis for this domain. For the remainingfive domains evaluated, the effect persisted after removing studiesclassified as being at high or moderate risk.Calcium intake also showed effects on different populations. ACochrane review (Hofmeyr 2014) showed that a good calciumintake has benefits for pregnancy outcomes, effects which arethought to be mediated by blood pressure reduction. Preliminaryobservations show that calcium supplementation during preg-nancy could also have effects on reducing the blood pressure ofthe progeny (Belizan 1988, Hatton 2003). Consequently, calciumintake could play a role in the prevention of hypertension, par-ticularly at a young age where small changes in blood pressurecould have a higher effect. It has been shown that lowering bloodpressure at younger ages is relevant, since the relative risk of car-diovascular diseases with blood pressure decreases with age and nosignificant deviations from linearity occurred in the associationsof either systolic or diastolic blood pressure (Rapsomaniki 2014).
A U T H O R S ’ C O N C L U S I O N S
Implications for practice
An increase in calcium intake slightly reduces both systolic anddiastolic blood pressure in normotensive people. The effect wasconfirmed in multiple prespecified subgroups, including a possibledose-response effect, reinforcing the efficacy of the intervention.The effects can be observed after only 3.5 months of intervention.
Although the effect is small, an adequate calcium intake shouldbe an objective to be reached in the population.
Implications for research
Randomised controlled trials (RCT) are needed with high powerin the early stages of life for a long period of time (at least oneyear), randomising young people of both sexes to attain a dailycalcium intake of at least 1 gm in comparison with a control group.Subgroup analyses should be prespecified and powered to assessoutcomes on systolic and diastolic blood pressure related to basalcalcium intake, age, sex, basal blood pressure, and body mass index(BMI).
There is a need for studies exploring the mechanisms of calciumintake on blood pressure. This will allow the identification of earlymarkers of individuals that could be more susceptible to calciumintake. It would also be of interest to assess whether there is acausal relationship between a given polymorphism and the effect ofcalcium on blood pressure. Research into the mechanisms could benested within the RCT suggested above, to see if, as hypothesised,calcium could have an effect on vasoconstriction, the first stagein the further development of hypertension, particularly in youngpeople.
More research is needed to assess the dose required and the beststrategy to improve calcium intake, comparing the effect of dietarycalcium with a supplemental version. Furthermore, if the effect ofcalcium intake on blood pressure is confirmed, studies of calciumfortification will be desirable to include populations with low cal-cium intake involving a universal effect on blood pressure.
Any future research on calcium intake must report adverse events,particularly in older people.
A C K N O W L E D G E M E N T S
The authors would like to acknowledge the contribution of DanielComandé to the search strategy.
R E F E R E N C E S
References to studies included in this review
Belizan 1983 {published data only}
Belizan JM, Villar J, Pineda O, Gonzalez AE, Sainz E,Garrera G, et al. Reduction of blood pressure with calciumsupplementation in young adults. JAMA 1983;249(9):1161–5.
Cutler 1992 {published data only}∗ Cutler JA, Whelton PK, Appel L, Charleston J, DalcinAT, Ewart C, et al. The effects of nonpharmacologicinterventions on blood pressure of persons with high normal
levels: Results of the trials of hypertension prevention,phase I. JAMA 1992;4(267):1213–20.Yamamoto ME, Applegate WB, Klag MJ, Borhani NO,Cohen JD, Kirchner KA, et al. Lack of blood pressure effectwith calcium and magnesium supplementation in adultswith high-normal blood pressure. Results from Phase I ofthe Trials of Hypertension Prevention (TOHP). Trials ofHypertension Prevention (TOHP) Collaborative ResearchGroup. Annals of Epidemiology 1995;5(2):96–107.
26Calcium supplementation for prevention of primary hypertension (Review)
Davis IJ, Grim C, Dwyer K, Nicholson L, Dwyer J. Theeffects of calcium supplementation on ambulatory bloodpressure in African-American adolescents. Journal of theNational Medical Association 1996;88(12):774–8.
Gillman 1995 {published data only}
Gillman MW, Hood MY, Moore LL, Nguyen US, SingerMR, Andon MB. Effect of calcium supplementation onblood pressure in children. Journal of Pediatrics 1995;127
(2):186–92.
Hilary Green 2000 {published data only}
Hilary Green J, Richards JK, Bunning RL. Blood pressureresponses to high-calcium skim milk and potassium-enriched high-calcium skim milk. Journal of Hypertension
2000;18(9):1331–9.
Johnson 1985 {published data only}
Johnson NE, Smith EL, Freudenheim JL. Effects on bloodpressure of calcium supplementation of women. American
Journal of Clinical Nutrition 1985;42(1):12–7.
Lijnen 1995 {published data only}∗ Lijnen P, Petrov V. Dietary calcium, blood pressure andcell membrane cation transport systems in males. Journal of
Hypertension 1995;13(8):875–82.Petrov V, Lijnen P. Modification of intracellular calcium andplasma renin by dietary calcium in men. American Journalof Hypertension 1999;12(12 Pt 1-2):1217–24.
Lyle 1987 {published data only}
Lyle RM, Melby CL, Hyner GC. Metabolic differencesbetween subjects whose blood pressure did or did notrespond to oral calcium supplementation. American Journal
of Clinical Nutrition 1988;47(6):1030–5.∗ Lyle RM, Melby CL, Hyner GC, Edmondson JW, MillerJZ, Weinberger MH. Blood pressure and metabolic effectsof calcium supplementation in normotensive white andblack men. JAMA 1987;257(13):1772–6.
Lyle 1992 {published data only}
Lyle RM. Does baseline serum total calcium level influencethe blood pressure response to calcium supplementation? Adouble-blind study. Netherlands Journal of Medicine 1992;41(1-2):48–55.
McCarron 1985 {published data only}
McCarron DA, Morris CD. Blood pressure response to oralcalcium in persons with mild to moderate hypertension. Arandomized, double-blind, placebo-controlled, crossovertrial. Annals of Internal Medicine 1985;103(6 ( Pt 1)):825–31.
Reid 2005 {published data only}
Reid IR, Horne A, Mason B, Ames R, Bava U, GambleGD. Effects of calcium supplementation on body weightand blood pressure in normal older women: a randomizedcontrolled trial. Journal of Clinical Endocrinology &Metabolism 2005;90(7):3824–9.
Reid 2010 {published data only}
Reid IR, Ames R, Mason B, Bolland MJ, Bacon CJ, ReidHE, et al. Effects of calcium supplementation on lipids,blood pressure, and body composition in healthy older men:
a randomized controlled trial. American Journal of Clinical
Nutrition 2010;91(1):131–9.
Sacks 1998 {published data only}
Sacks FM, Willett WC, Smith A, Brown LE, Rosner B,Moore TJ. Effect on blood pressure of potassium, calcium,and magnesium in women with low habitual intake.Hypertension 1998;31(1):131–8.
Shidfar 2010 {published data only}
Shidfar F, Moghayedi M, Kerman SR, Hosseini S, ShidfarS. Effects of a calcium supplement on serum lipoproteins,apolipoprotein B, and blood pressure in overweight men.International Journal of Endocrinology and Metabolism 2010;8(4):194–200.
Thomsen 1987 {published data only}
Thomsen K, Nilas L, Christiansen C. Dietary calciumintake and blood pressure in normotensive subjects. ActaMedica Scandinavica 1987;222(1):51–6.
Van Beresteyn 1986 {published data only}
Van Beresteyn EC, Schaafsma G, De Waard H. Oralcalcium and blood pressure: a controlled intervention trial.American Journal of Clinical Nutrition 1986;44(6):883–8.
References to studies excluded from this review
Bostick 2000 {published data only}
Bostick RM, Fosdick L, Grandits GA, Grambsch P, GrossM, Louis TA. Effect of calcium supplementation on serumcholesterol and blood pressure. A randomized, double-blind, placebo-controlled, clinical trial. Archives of Family
Medicine 2000;9(1):31-8; Discussion 39.
Dwyer 1998 {published data only}
Dwyer JH, Dwyer KM, Scribner RA, Sun P, Li L, NicholsonLM, et al. Dietary calcium, calcium supplementation, andblood pressure in African American adolescents. AmericanJournal of Clinical Nutrition 1998;68(3):648–55.
Eftekhari 2009 {published data only}
Eftekhari MH, Rajaeifard AR, Ahmadi A, Kashfi SM,Khajeh Rahim AA. Effect of two isocaloric diets, lowfat- high calcium and low fat- high fiber on weightreduction, lipid profile, and blood pressure. InternationalCardiovascular Research Journal 2009;3(4):200–6.
Karanja 1987 {published data only}
Karanja N, Morris CD, Illingworth DR, McCarron DA.Plasma lipids and hypertension: response to calciumsupplementation. American Journal of Clinical Nutrition
1987;45(1):60–5.
Luft 1986 {published data only}
Luft FC, Aronoff GR, Sloan RS, Fineberg NS, WeinbergerMH. Short-term augmented calcium intake has no effecton sodium homeostasis. Clinical Pharmacology and
Therapeutics 1986;39(4):414–9.
Morris 1988 {published data only}
Morris CD, Karaja N, McCarron DA. Dietary vssupplemental calcium to reduce blood pressure. WesternSection Hypertension. 1988:139A.
27Calcium supplementation for prevention of primary hypertension (Review)
Pan WH, Wang CY, Li LA, Kao LS, Yeh SH. No significanteffect of calcium and vitamin D supplementation onblood pressure and calcium metabolism in elderly Chinese.Chinese Journal of Physiology 1993;36(2):85–94.
Pan 2000 {published data only}
Pan Z, Zhao L, Guo D, Yang R, Xu C, Wu X. Effects of oralcalcium supplementation on blood pressure in population.Zhonghua Yu Fang Yi Xue Za Zhi 2000;34(2):109–12.
Shalileh 2010 {published data only}
Shalileh M, Shidfar F, Haghani H, Eghtesadi S, Heydari I.The influence of calcium supplement on body composition,weight loss and insulin resistance in obese adults receivinglow calorie diet. Journal of Research in Medical Sciences2010;15(4):191–201.
Smith 1987 {published data only}
Smith AN. The Effect of Calcium Supplementation on BloodPressure of Black Women. Chappel Hill: University of NorthCarolina, 1987.
Weinberge 1993 {published data only}
Weinberger MH, Wagner UL, Fineberg NS. The bloodpressure effects of calcium supplementation in humansof known sodium responsiveness. American Journal of
Hypertension 1993;6(9):799–805.
Additional references
Allen 2006
Allen L, De Benoist B, Dary O, Hurrel R. Guidelineson food fortification with micronutrients (WHO/FAO).//www.who.int/nutrition/publications/micronutrients/9241594012/en/. WHO/FAO, (accessed 16th May 2015).
Allender 1996
Allender PS, Cutler JA, Follmann D, Cappuccio FP, PryerJ, Elliott P. Dietary calcium and blood pressure: a meta-analysis of randomized clinical trials. Annals of InternalMedicine 1996;124(9):825–31.
Belizan 1980
Belizan JM, Villar J. The relationship between calciumintake and edema-, proteinuria-, and hypertension-gestosis:an hypothesis. American Journal of Clinical Nutrition 1980;33(10):2202–10.
Belizan 1988
Belizan JM, Villar J, Repke J. The relationship betweencalcium intake and pregnancy-induced hypertension:up-to-date evidence. American Journal of Obstetrics andGynecology 1988;158(4):898–902.
Carretero Oscar A, Oparil Suzanne. Essential Hypertension:Part I: Definition and Etiology. Circulation 2000;101:329–35.
Chobanian 2003
Chobanian AV, Bakris GL, Black HR, Cushman WC,Green LA, Izzo JL Jr, et al. Seventh report of the JointNational Committee on Prevention, Detection, Evaluation,and Treatment of High Blood Pressure. Hypertension 2003;42(6):1206–52. [PUBMED: 14656957]
Ciapponi 2011
Ciapponi A, Glujovsky D, Bardach A, García Martí S,Comande D. EROS: a new software for early stage ofsystematic reviews. HTAi 2011 Conference. Rio de Janeiro,Brazil, 2011.
Cook 1995
Cook NR, Cohen J, Hebert PR, Taylor JO, Hennekens CH.Implications of small reductions in diastolic blood pressurefor primary prevention. Archives of Internal Medicine 1995;155(7):701–9.
Curhan 2004
Curhan GC, Willett WC, Knight EL, Stampfer MJ. Dietaryfactors and the risk of incident kidney stones in youngerwomen: Nurses’ Health Study II. Archives of Internal
Medicine 2004;164(8):885–91.
Dickinson 2006
Dickinson HO, Nicolson D, Cook JV, Campbell F, BeyerFR, Ford GA, et al. Calcium supplementation for themanagement of primary hypertension in adults. Cochrane
Database of Systematic Reviews 2006, Issue 2. [DOI:10.1002/14651858.CD004639.pub2]
Ezzati 2002
Ezzati M, Lopez AD, Rodgers A, Vander Hoorn S, MurrayCJ. Selected major risk factors and global and regionalburden of disease. Lancet 2002;360(9343):1347–60.[PUBMED: 12423980]
Garrett 2005
Garrett J, Ruel MT. The coexistence of child undernutritionand maternal overweight: prevalence, hypotheses, andprogramme and policy implications. Maternal and ChildNutrition 2005;1(3):185–96.
Glujovsky 2010
Glujovsky D, Bardach A, García Martí S, Comande D,Ciapponi A. New software for early stage of systematicreviews. XVIII Cochrane Colloquium. The JointColloquium of the Cochrane & Campbell Collaborations.Keystone Resort, Colorado, USA, 2010.
Griffith 1999
Griffith LE, Guyatt GH, Cook RJ, Bucher HC, CookDJ. The influence of dietary and nondietary calciumsupplementation on blood pressure. American Journal of
Hypertension 1999;12(1):92.
Guyatt 2011
Guyatt, G, Oxman, A. D, Akl, E. A, et al. GRADEguidelines: 1. Introduction-GRADE evidence profilesand summary of findings tables. Journal of ClinicalEpidemiology 2011; Vol. 64, issue 4:383–94.
28Calcium supplementation for prevention of primary hypertension (Review)
Harris SS. The effect of calcium consumption on ironabsorption and iron status. Nutrition in Clinical Care 2002;5(5):231–5.
Hatton 2003
Hatton DC, Harrison-Hohner J, Coste S, Reller M,McCarron D. Gestational calcium supplementation andblood pressure in the offspring. American journal of
Higgins J, Green S (editors). Cochrane Handbook forSystematic Reviews of Interventions Version 5.1.0 [updatedMarch 2011]. The Cochrane Collaboration, 2011.Available from cochrane-handbook.org.
Hofmeyr 2014
Hofmeyr GJ, Lawrie TA, Atallah ÁN, Duley L, Torloni MR.Calcium supplementation during pregnancy for preventinghypertensive disorders and related problems. Cochrane
Database of Systematic Reviews 2014, Issue 6. [DOI:10.1002/14651858.CD001059.pub4; : CD001059]
Ilich-Ernst 1998
Ilich-Ernst JZ, McKenna AA, Badenhop NE, ClairmontAC, Andon MB, Nahhas RW, et al. Iron status, menarche,and calcium supplementation in adolescent girls. AmericanJournal of Clinical Nutrition 1998; Vol. 68, issue 4:880–7.
Jackson 2006
Jackson RD, LaCroix AZ, Gass M, Wallace RB, Robbins J,Lewis CE, et al. Women’s Health Initiative Investigators.Calcium plus vitamin D supplementation and the risk offractures. New England Journal of Medicine 2006; Vol.354, issue 7:669–83.
Kalkwarf 1998
Kalkwarf HJ, Harrast SD. Effects of calciumsupplementation and lactation on iron status. American
Journal of Clinical Nutrition 1998 ;67(6):1244–9.
Kearney 2004
Kearney PM, Whelton M, Reynolds K, Whelton PK, He J.Worldwide prevalence of hypertension: a systematic review.Journal of Hypertension 2004 ; Vol. 22, issue 1:11–9.
Kearney 2005
Kearney PM, Whelton M, Reynolds K, Muntner P,Whelton PK, He J. Global burden of hypertension: analysisof worldwide data. Lancet 2005;365(9455):217–23.
Lawes 2008
Lawes CM, Vander Hoorn S, Rodgers A. Global burdenof blood-pressure-related disease 2001. Lancet 2008; Vol.371, issue 9623:1513–8.
Lewington 2002
Lewington S, Clarke R, Qizilbash N, Peto R, Collins R,Prospective Studies Collaboration. Age-specific relevance ofusual blood pressure to vascular mortality: a meta-analysisof individual data for one million adults in 61 prospectivestudies. Lancet 2002;360(9349):1903–13.
Llanos 2008
Llanos A, Oyarzún MT, Bonvecchio A, Rivera JA, Uauy R.Are research priorities in Latin America in line with thenutritional problems of the population?. Public HealthNutrition 2008;11(5):466–77.
Rapsomaniki 2014
Rapsomaniki E, Timmis A, George J, Pujades-Rodriguez M,Shah AD, Denaxas S, et al. Blood pressure and incidenceof twelve cardiovascular diseases: lifetime risks, healthylife-years lost, and age-specific associations in 1·25 millionpeople. Lancet 2014;383(9932):1899–911.
RevMan 2014
The Nordic Cochrane Centre, The Cochrane Collaboration.Review Manager (RevMan. 5.3. Copenhagen: The NordicCochrane Centre, The Cochrane Collaboration, 2014.
Sabbagh 2009
Sabbagh Z, Vatanparast H. Is calcium supplementationa risk factor for cardiovascular diseases in older women?.Nutrition Reviews 2009;67(2):105–8.
Selmer 2000
Selmer RM, Kristiansen IS, Haglerod A, Graff-Iversen S,Larsen HK, Meyer HE, et al. Cost and health consequencesof reducing the population intake of salt. Journal ofEpidemiology and Community Health 2000;54(9):697–702.
Sokoll 1992
Sokoll LJ, Dawson-Hughes B. Calcium supplementationand plasma ferritin concentrations in premenopausalwomen. American Journal of Clinical Nutrition 1992;56(6):1045–8.
Stamler 1991
Stamler J. Blood pressure and high blood pressure. Aspectsof risk. Hypertension 1991; Vol. 18, issue 3 Suppl:I95–107.
Van Mierlo 2006
Van Mierlo LA, Arends LR, Streppel MT, Zeegers MP, KokFJ, Grobbee DE, et al. Blood pressure response to calciumsupplementation: a meta-analysis of randomized controlledtrials. Journal of Human Hypertension 2006;20(8):571–80.
Webb 2003
Webb RC. Smooth muscle contraction and relaxation.Advances in Physiology Education 2003; Vol. 27, issue1–4:201–6.
Whelton 2002
Whelton PK, He J, Appel LJ, Cutler JA, Havas S, KotchenTA, et al. Primary prevention of hypertension: clinicaland public health advisory from The National High BloodPressure Education Program. JAMA 2002;288(15):1882–8.
29Calcium supplementation for prevention of primary hypertension (Review)
World Health Organization. Calcium and Magnesiumin Drinking water. Geneva: World Health Organization,2009.
Williams 2001
Williams CP, Child DF, Hudson PR, Davies GK, DaviesMG, John R, et al. Why oral calcium supplements mayreduce renal stone disease: report of a clinical pilot study.Journal of Clinical Pathology 2001 ;54(1):54–62.
Williams 2011
Williams B. High blood pressure in young people andpremature death. BMJ 2011;22:342:d1104.
References to other published versions of this review
Cormick 2012
Cormick Gabriela, Ciapponi Agustín, Mazzoni Agustina,Belizán José M, Cafferata María Luisa. Calciumsupplementation for prevention of primary hypertension.Cochrane Database of Systematic Reviews 2012, Issue 8.[DOI: 10.1002/14651858.CD010037]
∗ Indicates the major publication for the study
30Calcium supplementation for prevention of primary hypertension (Review)
Characteristics of included studies [ordered by study ID]
Belizan 1983
Methods Randomised double-blind clinical trial. ”The trial was conducted in Guatemala.
Participants 57 subjects (28 men and 29 women).Age:18 and 35 years.Healthy subjects not receiving medical treatment, women were not using hormonalcontraceptives. Subjects .. “were free of diseases as assessed by a comprehensive clinicalexamination and blood and urine tests.”
Interventions Calcium supplementation vs placebo tablets.Intervention group: daily oral tablet containing 0.8 gms of calcium carbonate and 5.23 gms of calcium lactate gluconate (Calcium-Sandoz, 1,000 mg), representing 1 gm ofelemental calciumPlacebo group: daily oral tablet of the same weight, size, and organoleptic characteristicsas the calcium tabletTrial duration: 22 weeks.
Outcomes Systolic blood pressure: read when the appearance of the first Korotkoff ’s sound occurred;Diastolic blood pressure: taken at the disappearance of the fifth Korotkoff ’s soundThe final value and SD were calculated from the reported basal blood pressure valuesand the percent changes between basal values and stable period (weeks 9 through 23)reported in the articleBlood levels of total calcium and magnesium by atomic absorption spectrophotometryBlood levels of inorganic phosphate by spectrophotometryBlood levels of albumin by dye-binding bromocresol purposeTotal calcium intake: basal dietary intake measured by 24 hr. food record plus compliancewith supplementation
Notes
Risk of bias
Bias Authors’ judgement Support for judgement
Random sequence generation (selectionbias)
Low risk A computer random number generator wasused. Participants were randomly assignedto 2 treatment groups. “Separate randomi-sation schedules were used for sex and agegroups (18 - 23 years and 24 - 35 years).”
Allocation concealment (selection bias) Low risk Sequentially-numbered containers weresimilar for both types of tablets, and a keynumber indicated the composition
31Calcium supplementation for prevention of primary hypertension (Review)
Blinding of participants and personnel(performance bias)All outcomes
Low risk “The placebo group received a daily tabletof the same weight, size, and organolepticcharacteristics as the calcium tablet.” Thetreatment assignment was made double-blind. The composition of the tablet un-known to participants or to the professionalin charge of the examinations
Blinding of outcome assessment (detectionbias)All outcomes
Low risk Composition of the tablet was unknown toparticipants or to professional in charge ofthe examinations or BP measurements
Incomplete outcome data (attrition bias)All outcomes
High risk 28 men and 29 women were randomisedto the study groups and 23 men and 20women completed the study
Selective reporting (reporting bias) Low risk All primary outcomes addressed.
Other bias Low risk No differences between groups were foundin the variables collected during the base-line period except for systolic BP in the dor-sal position among the men
Cutler 1992
Methods Randomised double-blind clinical trial.
Participants Healthy subjects. with high-normal diastolic blood pressure, not taking antihypertensivedrugs, not grossly obese (BMI < 36.15 kg/m*), and not consuming more than 21 alcohol-containing drinks weeklyIntervention group: 237 participants assigned to receive calciumControl group: 234 participants assigned to receive placebo.Gender: Men and women.Age: 30 to 54 years.Exclusion criteria included pre-existing cardiovascular or life-threatening conditions,conditions requiring or contraindicating any of the study interventions, and intent tobecome pregnant during the study periodAge average: 43 years; 69% were men, 86% were white, and 51% had completed collegeBaseline blood pressures averaged 125/84 mm Hg and BMI averaged 27.3 kg/m2Dietary calcium intake: average 970 mg.
Interventions Calcium supplementation vs placebo tablets.Intervention group: calcium carbonate representing calcium, 25 mmol or 1.0 g (2 pillsper day)Control group: placebo tablet.Trial duration: 6 months.
32Calcium supplementation for prevention of primary hypertension (Review)
Outcomes Primary: “change in diastolic blood pressure from baseline to final follow-up.”Secondary: “changes in systolic blood pressure and intervention compliance measures.”
Notes Dietary calcium intakes according to the food frequency questionnaire data averaged970 mg
Risk of bias
Bias Authors’ judgement Support for judgement
Random sequence generation (selectionbias)
Low risk Randomisation lists were computer-gener-ated at the TOHP Data Coordinating Center
Allocation concealment (selection bias) Low risk Randomisation assignments were obtainedfrom the coordinating centre by telephonewhen possible, otherwise sealed opaque en-velopes were used to convey the treatment as-signment. Adherence to the appropriate as-signment sequence was monitored by the co-ordinating centre
Blinding of participants and personnel(performance bias)All outcomes
Low risk Double-blind fashion, with placebo controls
Blinding of outcome assessment (detectionbias)All outcomes
Low risk “Trained, certified observers who wereblinded to participants’ treatments. Bloodpressure was measured with a Hawksley ran-dom-zero sphygmomanometer.”
Incomplete outcome data (attrition bias)All outcomes
Low risk Blood pressure data were complete for 95%of participants at 3 months and 93% at 6months. Pill counts were obtained for 91%at 6 weeks, 90% at 3 months, and 84% at 6months
Selective reporting (reporting bias) Low risk There is no evidence of selective reporting.
Other bias Low risk Baseline characteristics were similar.
Davis 1996
Methods Randomised control trial.The trial was conducted in the United States of America.
Participants 34 healthy, normotensive adolescents.Ethnicity: African-American.Age:14 - 19 years.
33Calcium supplementation for prevention of primary hypertension (Review)
Interventions Intervention: 1.5 grams of calcium per day.Control group: daily placebo tablets.Trial duration: 4 weeks.
Outcomes Ambulatory systolic blood pressure and diastolic blood pressure
Notes There is no information of calcium intake reported.Participants were recruited from a high school in Los Angeles
Risk of bias
Bias Authors’ judgement Support for judgement
Random sequence generation (selectionbias)
Unclear risk The authors reported that participants wererandomly assigned to the treatment or con-trol group
Allocation concealment (selection bias) Unclear risk Not described
Blinding of participants and personnel(performance bias)All outcomes
Unclear risk Not described
Blinding of outcome assessment (detectionbias)All outcomes
Low risk The ambulatory blood pressure unit mea-sured the blood pressure every 30 minutesduring the day. “Unit was placed on eachparticipant for 24 hours.”
Incomplete outcome data (attrition bias)All outcomes
Unclear risk Not reported from how many participantsgave data for the results
Selective reporting (reporting bias) Low risk The planned outcome was reported.
Other bias Unclear risk No information of baseline characteristicswas reported.
Gillman 1995
Methods Randomised, double-blind , placebo-controlled trial.The trial was conducted in the United States of America.
Participants 101 5th-grade students.Gender: 50 girls and 51 boys;Ethnicity: 61 were black.Setting: inner city school.
34Calcium supplementation for prevention of primary hypertension (Review)
Interventions Intervention: 480 ml of juice containing 600 mg calcium (as calcium citrate malate)dailyControl: Same juice with no calcium.Trial duration: 12 weeks
Outcomes “Blood pressure 4 times on each of 3 weekly sittings at baseline and at follow-up”
Notes Nutrient data from 3 sets of 2-day food records on each participantFunding: Procter and Gamble Co.
Risk of bias
Bias Authors’ judgement Support for judgement
Random sequence generation (selectionbias)
Low risk Random allocation was performed by acentralised unit with the ID numbers thatresearchers provided. ID labels were affixedto each ’juice box’, and sent to researcherswho were completely blinded to treatmentassignment
Allocation concealment (selection bias) Low risk Random allocation was performed by acentralised unit with the ID numbers thatresearchers provided. ID labels were affixedto each ’juice box’ and sent to researcherswho were completely blinded to treatmentassignment
Blinding of participants and personnel(performance bias)All outcomes
Low risk All investigators and participants weremasked to treatment assignment through-out the intervention period. “The inter-vention and placebo beverages were formu-lated to look and taste the same.” “Single-serving containers (”juice boxes“) and la-belled with the subject’s name and studyidentification number.”
Blinding of outcome assessment (detectionbias)All outcomes
Low risk “Automated device (Dinamap Vital SignsMonitor model 845-A, Critikon, Inc.,Tampa, Fla.).” “Blood pressure data wereautomatically recorded on a floppy disk; in-vestigators and participants were masked tothese data until the end of the study.”
Incomplete outcome data (attrition bias)All outcomes
Low risk 106 participants randomised, 5 movedfrom the school and the analyses included101 participants. Age, sex, and race of non-participants and those who dropped out be-
35Calcium supplementation for prevention of primary hypertension (Review)
Selective reporting (reporting bias) Low risk All outcomes were reported.
Other bias Low risk There were small differences (in differ-ent directions) between intervention andplacebo participants in baseline systolicblood pressure, hours of television watched,and amount of dietary calcium
Hilary Green 2000
Methods Double-blind, randomised, controlled cross-over studyThe trial was conducted in New Zealand
Participants 38 healthy volunteers.Age: over 40 years
Interventions Intervention: high-calcium skim powder milk.Control: replacement of usual liquid milk with 2 servings a day of skim non-fortifiedpowder milkTrial duration: 4 weeks, with a minimum of 4 weeks of wash-out between interventions
Outcomes Systolic blood pressure and ambulatory blood pressure
Notes ”For many people in the trial, the control skim milk provided additional calcium to thediet. This may explain the small reduction in office“.. standing systolic blood pressureobserved in the control groupCalcium intake was calculated using 24 hour food recalls.This study was supported by The New Zealand Dairy Board.
Risk of bias
Bias Authors’ judgement Support for judgement
Random sequence generation (selectionbias)
Unclear risk Not described
Allocation concealment (selection bias) Unclear risk Not described
Blinding of participants and personnel(performance bias)All outcomes
Unclear risk Stated ”Randomized double-blind con-trolled trial’. Double-blind, randomised,controlled cross-over study. “Each volun-teer consumed each of the milks in ran-domised order.” “The milk was provided tothe volunteers as a dry powder.”
36Calcium supplementation for prevention of primary hypertension (Review)
Incomplete outcome data (attrition bias)All outcomes
Unclear risk Dropouts not reported
Selective reporting (reporting bias) Low risk All primary outcomes were reported.
Other bias High risk There were small differences (in differ-ent directions) between intervention andplacebo participants in baseline office andambulatory blood pressure, except for base-line systolic blood pressure: Skim milk 121± 14 and high-calcium skim milk 125 ± 19.Controls may have accidentally received acalcium boost from the placebo milk thatshould be treated as a potential bias
Johnson 1985
Methods Randomised double-blind clinical trial. . Women were divided into a control and anexperimental group in aThe trial was conducted in the United States of America.
Participants 81 normotensive and 34 medicated hypertensive women.Age: between 35 and 65 years.
Interventions Intervention group: 3 daily tablets of a calcium carbonate supplement containing 500mg calcium-tabletControl group: placebo tablets.Trial duration: 4-year.
Outcomes Bone mineral content and blood pressure
Notes Most of the women were using thiazides“Dietary calcium of all women was determined using a precoded food record form, whichhad been tested for validity against weighed food intakes.”This study was supported by Wisconsin Milk Marketing Board, Inc, Marion Laborato-ries, Kansas City, MO
Risk of bias
Bias Authors’ judgement Support for judgement
37Calcium supplementation for prevention of primary hypertension (Review)
Allocation concealment (selection bias) Unclear risk Not described
Blinding of participants and personnel(performance bias)All outcomes
Unclear risk “The original group of women, includingthe hypertensives, was divided into a con-trol and an experimental group in a dou-ble-blind design.” However methods werenot described
Blinding of outcome assessment (detectionbias)All outcomes
Unclear risk “Blood pressure was measured from theright arm of seated participants usinga standard mercury sphygmomanometer.” Not reported if outcome assessors wereblinded to the intervention
Incomplete outcome data (attrition bias)All outcomes
High risk 44 participants were randomised to the in-tervention and 41 were analysed. 51 par-ticipants were randomized to placebo and40 were analysed
Selective reporting (reporting bias) Low risk All primary outcomes were reported
Other bias Low risk Baseline characteristics were similar be-tween the groups.
Lijnen 1995
Methods Double-blind, placebo-controlled parallel-group cross-over studyThe trial was conducted in Belgium.
Participants 32 male participants.Age: 24 ± 1 (range 20 - 44 years) and weight 75.9 ± 1.3 kg.
Interventions Intervention group: 1 g elemental calcium as calcium gluconate powder twice a day(morning and evening)Control group: placebo with the same orange flavour as interventionTrial duration: 16 weeks.
Outcomes Blood pressure recorded in standing positionIntracellular cationic concentrationsTransmembrane cation transport systemsPlasma total and ionised calciumCalciotropic hormones
Notes This study was supported by Boehringer Ingelheim.
38Calcium supplementation for prevention of primary hypertension (Review)
Other bias Low risk Baseline characteristics were similar be-tween calcium and placebo groups
Lyle 1987
Methods Randomised, double-blind, placebo-controlled trial.The trial was conducted in the United States of America.
Participants Normotensive male participants.Ethnicity: Black (n = 21) and white (n = 54).”Age: 19 to 52 years.
Interventions Internvention group: calcium, 1500 mg a day.Control group: placebo.“Participants were randomly assigned within racial groups to either a treatment”Trial duration: 12-week period.
Outcomes Blood pressureSerum levels of total and ionised calciumTotal inorganic phosphorusParathyroid hormoneOvernight urinary electrolyte values
Notes
39Calcium supplementation for prevention of primary hypertension (Review)
Allocation concealment (selection bias) Low risk The supplements were strip-wrapped in-dividually and coded by someone not in-volved in the research study. The partic-ipants did not know which group theywere assigned to, and the researcher(s) whocollected other information also were notaware of the group assignment. Early anal-yses were completed prior to revealing theassigned groups as well
Blinding of participants and personnel(performance bias)All outcomes
Low risk Assignment was double-blind. “Indistin-guishable placebo tablets were composedof microcrystalline methylcellulose andstarch.”
Blinding of outcome assessment (detectionbias)All outcomes
Low risk “Use of a random-baseline sphygmo-manometer and blinded observers to elim-inate bias during blood pressure measure-ment, documentation of nutrient intakeother than the supplement, and controlfor body weight and other possible con-founders.”
Incomplete outcome data (attrition bias)All outcomes
Low risk All participants randomised were includedin the results.
Selective reporting (reporting bias) Low risk All outcomes were reported.
Other bias Low risk The groups were similar at baseline.
Lyle 1992
Methods Randomised, double-blind, placebo-controlled trialThe trial was conducted in the United States of America.
Participants 42 adults.Gender: men and women.High normal or mildly hypertensive levels of blood pressure.
40Calcium supplementation for prevention of primary hypertension (Review)
Interventions Intervention group: 500 mg of elemental calcium as calcium carbonate tabletsControl group: placebo tablets.Trial duration: 8 weeks.
Outcomes Blood pressure
Notes
Risk of bias
Bias Authors’ judgement Support for judgement
Random sequence generation (selectionbias)
Low risk Participants were given a random numberof calcium or placebo tablets
Allocation concealment (selection bias) Low risk The supplements were strip-wrapped in-dividually and coded by someone not in-volved in the research study. The partic-ipants did not know which group theywere assigned to, and the researcher(s) whocollected other information also were notaware of the group assignment. Early anal-yses were completed prior to revealing theassigned groups as well
Blinding of participants and personnel(performance bias)All outcomes
Low risk Experimental group assessment was dou-ble-blind. Tablets contained 500 mg of ele-mental calcium in the form of calcium car-bonate; Indistinguishable placebo tablets
Blinding of outcome assessment (detectionbias)All outcomes
Low risk Measurements were taken with randomzero sphygmomanometer at least 1 minuteapart
Incomplete outcome data (attrition bias)All outcomes
Low risk 44 men and women participants were ran-domised, 2 participants withdrew due toappointment conflicts and 42 participantscompleted the studyMissing outcome data balanced in numbersacross intervention groups
Selective reporting (reporting bias) Low risk All outcomes were reported.
Other bias High risk In the treatment group there were moremen than in the placebo group. 8 of the10 women were allocated to the placebogroup. However, blood pressure measure-ments showed not statistically significant
41Calcium supplementation for prevention of primary hypertension (Review)
Methods Randomised, double-blind, placebo- controlled, cross-over trialThe trial was conducted in the United States of America.
Participants 32 normotensive subjects.Healthy volunteers with no signs of secondary hypertension.Age: between 21 and 70 years.
Interventions Intervention group: 1000 mg a day of elemental calcium as the carbonate or citrate saltControl group: placebo tablets.Trial duration: 8 weeks, or placebo.
Outcomes Change in blood pressure
Notes
Risk of bias
Bias Authors’ judgement Support for judgement
Random sequence generation (selectionbias)
Low risk Random assignment of participants wasdone separately in blocks by computer
Allocation concealment (selection bias) Low risk Medications were pre-packaged by ran-domisation number for each participantand dispensed every 2 weeks
Blinding of participants and personnel(performance bias)All outcomes
Low risk “Placebo tablets consisted of microcrys-talline cellulose and starch and were iden-tical in taste and appearance to the calciumcarbonate tablets. Subjects and members ofthe investigative staff were blinded.”
Blinding of outcome assessment (detectionbias)All outcomes
Low risk “A Hawksley random-zero sphygmo-manometer (Hawksley & Sons, Ltd., Lanc-ing, England) was used for measurementof blood pressure after the participant wassupine for 5 minutes and after standing for2 minutes.”
Incomplete outcome data (attrition bias)All outcomes
Low risk All 32 normotensive participants were re-ported in the results
Selective reporting (reporting bias) Low risk Primary outcome result reported
42Calcium supplementation for prevention of primary hypertension (Review)
Other bias Low risk The baseline characteristics were similar be-tween the groups
Reid 2005
Methods Double-blind, randomised, controlled trial.The trial was conducted in New Zealand.
Participants Healthy postmenopausal women more than 5 years from postmenopauseAge: more than 55 years (mean age, 74 years;Mean baseline weight: 67 kg;Mean baseline blood pressure:134/70 mmHg.Exclusion criteria: participants receiving therapy for osteoporosis or taking calcium sup-plements, major ongoing disease including serum creatinine greater than 1.8 mg/dl (0.2 mmol/litre), untreated hypo- or hyperthyroidism, liver disease, serum 25-hydroxyvi-tamin D below 10 g/litre (25 nmol/litre), malignancy, or metabolic bone disease, usersof hormone replacement therapy, anabolic steroids, glucocorticoids, or bisphosphonatein the previous 1 year
Interventions Intervention group: calcium as calcium citrate (1 gm of elemental calcium a day; n =732)Control group: identical placebo (n = 739).Trial duration 30 months.
Outcomes Primary outcome: fracture incidenceSecondary analysis:- Body weight- Blood pressure
Notes Dietary calcium intake was assessed using a validated food frequency questionnaireCalcium was provided by Citracal, Mission Pharmacal, San Antonio TX
Risk of bias
Bias Authors’ judgement Support for judgement
Random sequence generation (selectionbias)
Low risk “Treatments were allocated randomly us-ing a minimisation algorithm balancing forcurrent thiazide use, age, and the occur-rence of fractures resulting from minimaltrauma after the age of 40 years.”
Allocation concealment (selection bias) Unclear risk Not described
Blinding of participants and personnel(performance bias)All outcomes
Low risk Double-blinded study. “Subjects received 1g elemental calcium daily as citrate (Citra-cal, Mission Pharmacal, San Antonio TX)or an identical placebo.”
43Calcium supplementation for prevention of primary hypertension (Review)
Blinding of outcome assessment (detectionbias)All outcomes
Low risk “Blood pressure was measured using a Di-namap automatic monitor (Johnson &Johnson, Tampa, FL) at each visit.”
Incomplete outcome data (attrition bias)All outcomes
Unclear risk Dropouts were not reported.
Selective reporting (reporting bias) Low risk A variety of preplanned models wererun: an intention-to-treat analysis, withand without imputation (maximum likeli-hood) of missing values, and with and with-out adjustment for compliance; a per pro-tocol analysis; and an analysis of the changein blood pressure, excluding those takingblood pressure-lowering medication
Other bias Low risk Baseline characteristics were similar be-tween groups.
Reid 2010
Methods Randomised controlled trial.The trial was conducted in New Zealand.
Participants 323 healthy men.Age: over 40 years.
Interventions Intervention groups: group 1: 600 mg calcium a day or group 2: 1200 mg calcium a dayas calcium citrateControl group: placebo.Trial duration: 2 years.
Outcomes Primary endpoint: change in the ratio of HDL to LDL cholesterolSecondary endpoints: changes in cholesterol fractions, triglycerides, blood pressure, andbody composition
Notes This study was supported by Mission Pharmacal
Risk of bias
Bias Authors’ judgement Support for judgement
Random sequence generation (selectionbias)
Low risk “Treatments were allocated randomly byusing computer-generated random num-bers (Microsoft Excel 2003; Microsoft,Redmond, WA) within blocks of randomsizes in multiples of 3.”
44Calcium supplementation for prevention of primary hypertension (Review)
Allocation concealment (selection bias) Low risk “Randomization was performed before thestudy began by the study statistician andwas conveyed to a staff member who dis-pensed the study medication into num-bered containers. This individual had nodirect contact with other study staff norwith trial participants. Subjects were allo-cated a study number according to the se-quence of their enrolment.”
Blinding of participants and personnel(performance bias)All outcomes
Low risk Participants and study staff were blinded totreatment allocation throughout the study
Blinding of outcome assessment (detectionbias)All outcomes
Low risk “Blood pressure was measured by using aDinamap automatic monitor (Johnson &Johnson, Tampa, FL).”
Incomplete outcome data (attrition bias)All outcomes
Low risk “Complete follow-up was achieved in 96%of the participants, and the proportions ofthose randomly assigned still receiving thetrial medication at study end were as fol-lows: 93% in the placebo group, 91% inthe Ca600 group, and 86%in the Ca1200group (P = 0.19 for between-group com-parisons).”
Selective reporting (reporting bias) Low risk All outcomes were reported.
Other bias Low risk There were small differences (in differ-ent directions) between intervention andplacebo participants
Sacks 1998
Methods Randomised, double blind parallel group trial.The trial was conducted in the United States of America.
Participants 321 participants 93% completed baseline and midpoint measurements“Exclusion criteria included reported diastolic blood pressure 65 mm Hg; hypertension;BMI > 32 kg/m²; insulin-dependent diabetes; cardiovascular disease; renal failure; med-ications that affect blood pressure, weight loss diets, use of nutritional supplements ofcalcium, magnesium, or potassium (including antacid preparations).”
“The placebo group received twice the number of participants as the four treatmentgroups to improve statistical power.”
Outcomes Ambulatory 24-hour blood pressure24-hour urineBody weightHealth and side effects questionnairePill counts
Notes Participants who had baseline systolic blood pressure above 160 mmHg or diastolic bloodpressure above 95 mm Hg were excluded and advised to see their physicians
Risk of bias
Bias Authors’ judgement Support for judgement
Random sequence generation (selectionbias)
Low risk The randomisation was performed bya computer programme directed by thestatistician on the project. The statisticianhad no contact with the data collectors orthe participants. (Information provided bythe author)
Allocation concealment (selection bias) Unclear risk Not described
Blinding of participants and personnel(performance bias)All outcomes
Low risk Participants were under double-blind con-ditions for 16 weeks but methods not de-scribe. The participants were not informedabout their specific supplement group
Blinding of outcome assessment (detectionbias)All outcomes
Low risk The blood pressure machine automaticallyentered the blood pressure data on com-puter tape that was later converted to anASCII file at the study office
Incomplete outcome data (attrition bias)All outcomes
Unclear risk 321 participants were randomised. 300participants were available for follow-upmeasurements and 290 completed thestudy measurements
Methods Double-blind randomised placebo-controlled trial.The trial was conducted in Denmark.
Participants 28 healthy women with early menopause (6 months to 3 years earlier). Overweight wasnot an exclusion criterion
Interventions Intervention group:2000 mg calcium per day (14 participants)Control group: identical-looking placebo tablets (14 participants)Trial duration: 1 year.
Outcomes Blood pressure. BP was measured by mercury manometer after 10 min of supine rest
Notes Tablets were provided by Sandoz
Risk of bias
Bias Authors’ judgement Support for judgement
Random sequence generation (selectionbias)
Low risk Participants were allocated into 2 groupsaccording to random sampling numbers
Allocation concealment (selection bias) Unclear risk Not described
Blinding of participants and personnel(performance bias)All outcomes
Low risk Double-blind, placebo-controlled trial. Participants received iden-tical-looking tablets
Blinding of outcome assessment (detectionbias)All outcomes
Unclear risk Not described
Incomplete outcome data (attrition bias)All outcomes
Low risk All participants were evaluated at the endof the study.
Selective reporting (reporting bias) Low risk The primary outcome was reported.
Other bias High risk Placebo participants had higher initialweight and lower systolic blood pressure
Van Beresteyn 1986
Methods Double-blind, placebo-controlled trial.Participants were assigned to 2 groups according to a randomised block design thataccounted for habitual calcium intake and BMIThe trial was conducted in the Netherlands.
Participants 58 normotensive healthy female dietetic students, not receiving any medical treatmentat the time of recruitment
48Calcium supplementation for prevention of primary hypertension (Review)
Interventions Intervention group: Daily lemonade or apple juice with powder containing 1500 mgCalcium - calcium carbonate (1. 251 g), citric acid (2. 168 g), sodium-hydrogen carbonate(0.5 g), and dextrose (2.88 g)Control group: Daily lemonade or apple juice placebo powder with citric acid (0.85 g),sodium-hydrogen carbonate (0.5 g), dextrose (4.5 g), and corn-flour (0. 1 g)Both groups received a low-calcium diet (500 mg Calcium a day) restricting intake ofdairy productsTrial duration: 6 weeks.
Outcomes Difference for each individual between baseline blood pressure and final blood pressureIndividual change in blood pressure during the experiment as indicated by the regressioncoefficient (slope) obtained from linear regression analysis of blood pressure versus timeduring the experimental period
Notes
Risk of bias
Bias Authors’ judgement Support for judgement
Random sequence generation (selectionbias)
Unclear risk Participants were assigned to 2 groups ac-cording to a randomised block design thataccounted for habitual calcium intake andbody mass index
Allocation concealment (selection bias) Unclear risk Not described
Blinding of participants and personnel(performance bias)All outcomes
Unclear risk Double-blind, placebo-controlled trial butmethods not described
Blinding of outcome assessment (detectionbias)All outcomes
Unclear risk Not described
Incomplete outcome data (attrition bias)All outcomes
Low risk All participants were reported in the results
Selective reporting (reporting bias) Low risk All outcomes were reported.
Other bias Low risk Baseline characteristics were similar be-tween the 2 groups.
ABP: ambulatory blood pressureBMI: body mass index
49Calcium supplementation for prevention of primary hypertension (Review)
Characteristics of excluded studies [ordered by study ID]
Study Reason for exclusion
Bostick 2000 There was no discrimination in the outcomes for hypertensive or normotensive participants. “Persons with orwithout hypertension or hypercholesterolaemia, or taking or not taking antihypertensive or cholesterol-loweringmedications were eligible to participate except as specified below.”
Dwyer 1998 Number of cases in each cross-over step were not reported.
Eftekhari 2009 Low fat, high fibre diet was a co- intervention.
Karanja 1987 Blood pressure is not an outcome of the study.
Luft 1986 Quasi-randomised trial
Morris 1988 No details of number of participants in calcium placebo groups
Pan 1993 Most participants (63%) were taking antihypertensive drugs.
Pan 2000 Blood pressure is not an outcome of the study.
Shalileh 2010 Energy-restricted diet was a co-intervention.
Smith 1987 Quasi-randomised study. It used even and odd number from a table of random numbers
Weinberge 1993 Salt-sensitive or salt-resistant participants. No details of number of participants in calcium placebo groups
50Calcium supplementation for prevention of primary hypertension (Review)
7.1 Less than 35 years of age 7 399 Mean Difference (IV, Fixed, 95% CI) -2.11 [-3.58, -0.64]7.2 35 years and older 9 2649 Mean Difference (IV, Fixed, 95% CI) -0.96 [-1.83, -0.09]
8 Effect mean difference ofdiastolic blood pressure by age
8.1 Less than 35 years of age 6 298 Mean Difference (IV, Fixed, 95% CI) -2.61 [-3.74, -1.49]8.2 35 years and older 9 2649 Mean Difference (IV, Fixed, 95% CI) -0.59 [-1.13, -0.06]
9.1 Less than 35 years of age 2 89 Mean Difference (IV, Fixed, 95% CI) -2.56 [-4.90, -0.23]9.2 35 years and older 5 2470 Mean Difference (IV, Fixed, 95% CI) -0.98 [-1.87, -0.10]
10.1 Less than 35 years of age 2 89 Mean Difference (IV, Fixed, 95% CI) -3.96 [-5.48, -2.44]10.2 35 years and older 5 2470 Mean Difference (IV, Fixed, 95% CI) -0.58 [-1.13, -0.04]
11.1 Less than 35 years of age 5 310 Mean Difference (IV, Fixed, 95% CI) -1.81 [-3.71, 0.09]11.2 35 years and older 5 228 Mean Difference (IV, Fixed, 95% CI) -3.39 [-6.76, -0.03]
12.1 Less than 35 years of age 4 209 Mean Difference (IV, Fixed, 95% CI) -0.99 [-2.66, 0.68]12.2 35 years and older 5 228 Mean Difference (IV, Fixed, 95% CI) -1.58 [-3.65, 0.49]
13 Effect mean difference insystolic blood pressure by basalcalcium intake
Test for subgroup differences: Chi2 = 0.00, df = 1 (P = 0.99), I2 =0.0%
-10 -5 0 5 10
Favours Calcium Favours control
(1) Black men
(2) White men
(3) Intervention: elemental calcium 600 mg daily
(4) Intervention: elemental calcium 1200 mg daily
A P P E N D I C E S
Appendix 1. MEDLINE search strategy
Database: Ovid MEDLINE(R) 1946 to Present with Daily UpdateSearch Date: 16 October 2014--------------------------------------------------------------------------------1 dietary supplements/2 calcium, dietary/3 calcium carbonate/4 (calcium adj8 (acetate$ or add$ or boost$ or carbonate$ or consum$ or daily or day or diet$ or fed or feed$ or food or fortif$ orintake$ or suppl$)).tw.5 (calcium adj8 (capsul$ or compound$ or liquid$ or oral$ or pill$ or powder$ or tab$)).tw.6 (apocal or aragonite or biocal or calcimix or calcite or calsan or calsup or caltrate or maxicalc or mega cal or os cal or oscal orvaterite).tw.7 or/1-68 hypertension/9 hypertens$.tw.10 exp blood pressure/11 (blood pressure or bloodpressure).tw.12 ((arterial or diastolic or systolic) adj2 pressure).tw.13 or/8-1214 randomized controlled trial.pt.15 controlled clinical trial.pt.16 randomized.ab.17 placebo.ab.18 clinical trials as topic/19 randomly.ab.20 trial.ti.
90Calcium supplementation for prevention of primary hypertension (Review)
21 or/14-2022 animals/ not (humans/ and animals/)23 (eclampsia or preeclampsia).ti.24 21 not (22 or 23)25 7 and 13 and 2426 remove duplicates from 25
Appendix 2. CENTRAL search strategy
Database: Cochrane Central Register of Controlled Trials < Issue 9 2014 >Search Date: 16 October 2014--------------------------------------------------------------------------------ID Search#1 MeSH descriptor: [Dietary Supplements] this term only#2 MeSH descriptor: [Calcium, Dietary] this term only#3 MeSH descriptor: [Calcium Carbonate] this term only#4 (calcium near/10 (acetate* or add* or boost* or carbonate* or consum* or daily or day or diet* or fed or feed or food or fortif* orintake$ or suppl*)):ti,ab#5 (calcium near/10 (capsul* or compound* or liquid* or oral* or pill* or powder* or tab*)):ti,ab#6 (apocal or aragonite or biocal or calcimix or calcite or calsan or calsup or caltrate or maxicalc or mega cal or os cal or oscal or vaterite):ti,ab#7 #1 or #2 or #3 or #4 or #5 or #6#8 MeSH descriptor: [Hypertension] explode all trees#9 hypertens*:ti,ab#10 MeSH descriptor: [Blood Pressure] explode all trees#11 (“blood pressure” or bloodpressure):ti,ab#12 ((arterial or diastolic or systolic) near/2 pressure):ti,ab in Trials#13 #8 or #9 or #10 or #11 or #12#14 #7 and #13
Appendix 3. EMBASE search strategy
Database: Embase <1974 to 2014 Week 41>Search date: 16 October 2014--------------------------------------------------------------------------------1 diet supplementation/2 calcium intake/3 calcium carbonate/4 (calcium adj8 (acetate$ or add$ or boost$ or carbonate$ or consum$ or daily or day or diet$ or fed or feed or food or fortif$ orintake$ or suppl$)).tw.5 (calcium adj8 (capsul$ or compound$ or liquid$ or oral$ or pill$ or powder$ or tab$)).tw.6 (apocal or aragonite or biocal or calcimix or calcite or calsan or calsup or caltrate or maxicalc or mega cal or os cal or oscal orvaterite).tw.7 or/1-68 exp hypertension/9 hypertens$.tw.10 exp blood pressure/11 (blood pressure or bloodpressure).tw.12 ((arterial or diastolic or systolic) adj2 pressure).tw.13 or/8-1214 randomized controlled trial/15 crossover procedure/16 double-blind procedure/
91Calcium supplementation for prevention of primary hypertension (Review)
17 (randomi$ed or randomly).tw.18 (crossover$ or cross-over$).tw.19 placebo.ab.20 (doubl$ adj blind$).tw.21 assign$.ab.22 allocat$.ab.23 or/14-2224 (exp animal/ or animal.hw. or nonhuman/) not (exp human/ or human cell/ or (human or humans).ti.)25 23 not 2426 7 and 13 and 2527 remove duplicates from 26
Appendix 4. Hypertension Group Specialised Register search strategy
Database: Hypertension Group Specialised RegisterSearch date: 16 October 2014--------------------------------------------------------------------------------1 (calcium:TI AND (hypertension) NOT (channel):TI NOT (antagonist*):TI) AND ( INREGISTER)2 RCT3 #1 AND #2
Appendix 5. LILACS search strategy
Search Date: 17 October 2014(MH Hipertensión Inducida en el Embarazo OR Transient Hypertension OR Hipertensión Gestacional OR Hipertensão GestacionalOR Gestational Hypertension OR Pregnancy-Induced Hypertension OR Gestosis OR Eclampsia$ OR Pre Eclampsia$ OR PregnancyToxemia$ OR Preeclampsia$) AND (MH Intervalo entre Nacimientos OR Birth Spac$ OR Birth Interval$ OR Delivery Interval$ ORDelivery Spac$ OR Intergenesic Interval$ OR Reproductive Pattern$ OR Subsequent Pregnan$ OR Espaçamento entre NascimentosOR Padrão Reprodutivo OR Gravidez Subseqüente OR Patrón Reproductivo OR Timing OR Intervalo Intergenésico OR Interpreg-nancy Spac$ OR Interpregnancy Interval$) [Palabras]
Appendix 6. ClinicalTrials.gov search strategy
Database: ClinicalTrials.gov (via Cochrane Register of Studies)Search date: 16 October 2014--------------------------------------------------------------------------------Study type: Interventional StudiesInterventions: calcium NOT channelOutcome Measures: blood pressureSearch terms: randomized
C O N T R I B U T I O N S O F A U T H O R S
Roles and responsibilities
TASK WHO HAS UNDERTAKEN THE TASK
Drafted the protocol Gabriela Cormick/Agustín Ciapponi/ José M Belizán
Developed a search strategy Gabriela Cormick/Agustín Ciapponi
92Calcium supplementation for prevention of primary hypertension (Review)
D I F F E R E N C E S B E T W E E N P R O T O C O L A N D R E V I E W
Agustina Mazzoni was listed in the published protocol with the role of extracting data but María Luisa Cafferata and Gabriela Cormickdid this work.
We planned to include cluster-randomised trials in the analyses along with individually randomised trials. We planned to adjust theirsample sizes using the methods described in the Cochrane Handbook (Higgins 2011) using an estimate of the intracluster correlationco-efficient (ICC) derived from the trial (if possible), from a similar trial or from a study of a similar population. If we used ICCs fromother sources, we planned to report this and conduct sensitivity analyses to investigate the effect of variation in the ICC. If we identifiedboth cluster-randomised trials and individually randomised trials, we planned to synthesise the relevant information. We consideredit reasonable to combine the results from both if there was little heterogeneity between the study designs and the interaction betweenthe effect of intervention and if the choice of randomisation unit was considered to be unlikely. We planned also to acknowledgeheterogeneity in the randomisation unit and perform a sensitivity analysis to investigate the effects of the randomisation unit. We didnot find any cluster randomised trials that met our eligibility criteria.
For dichotomous data, we planned to present results as summary risk ratios with 95% confidence intervals. None of the studies reportedhypertension as a dichotomous outcome.
94Calcium supplementation for prevention of primary hypertension (Review)