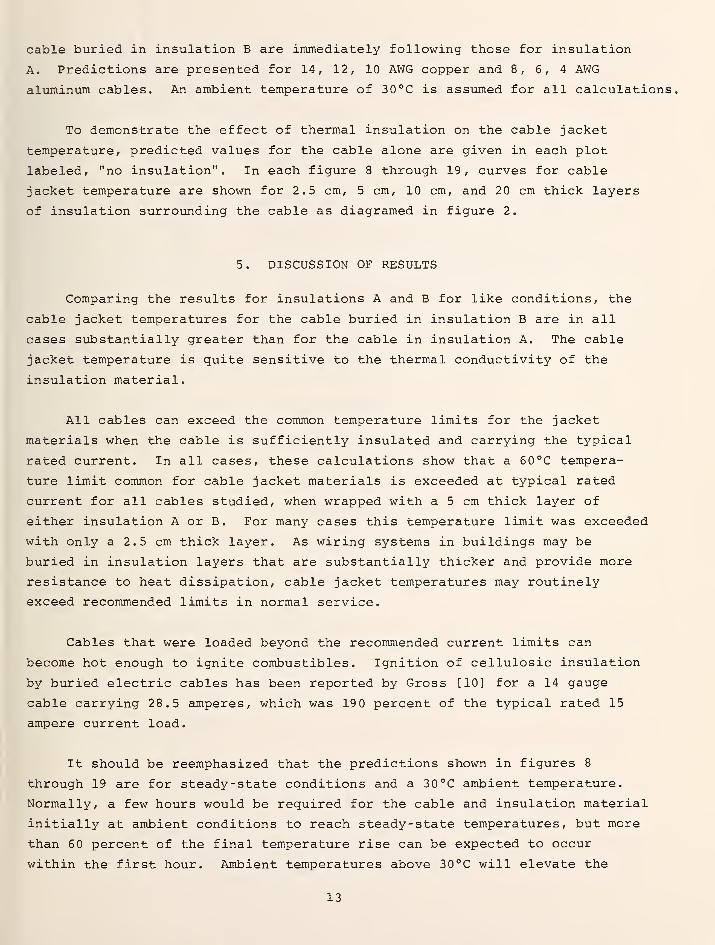
NBS TECHNICAL NOTE 1133 NAU- INST. OF STAND & TECH A111D7 ED^LjflS U.S. DEPARTMENT OF COMMERCE/National Bureau of Standards Calculated Operating Temperatures of Thermally Insulated Electric Cables QC 100 U5753 no, 1133 1980 c. 2
Transcript
NBS TECHNICAL NOTE 1133NAU- INST. OF STAND & TECH
A111D7 ED^LjflS
U.S. DEPARTMENT OF COMMERCE/National Bureau of Standards
Calculated Operating
Temperatures of Thermally
Insulated Electric Cables
QC
100
U5753
no, 1133
1980
c. 2
NATIONAL BUREAU OF STANDARDS
The National Bureau of Standards' was established by an act of Congress on March 3, 1901.
The Bureau's overall goal is to strengthen and advance the Nation's science and technology
and facilitate their effective application for public benefit. To this end, the Bureau conducts
research and provides: (1) a basis for the Nation's physical measurement system, (2) scientific
and technological services for industry and government, (3) a technical basis for equity in
trade, and (4) technical services to promote public safety. The Bureau's technical work is per-
formed by the National Measurement Laboratory, the National Engineering Laboratory, and
the Institute for Computer Sciences and Technology.
THE NATIONAL MEASUREMENT LABORATORY provides the national system of
physical and chemical and materials measurement; coordinates the system with measurement
systems of other nations and furnishes essential services leading to accurate and uniform
physical and chemical measurement throughout the Nation's scientific community, industry,
and commerce; conducts materials research leading to improved methods of measurement,
standards, and data on the properties of materials needed by industry, commerce, educational
institutions, and Government; provides advisory and research services to other Government
agencies; develops, produces, and distributes Standard Reference Materials; and provides
calibration services. The Laboratory consists of the following centers:
Absolute Physical Quantities 2 — Radiation Research — Thermodynamics and
[6] Standard Recommended Practice for Determination of Heat Gain or Loss;
and Surface Temperatures of Insulated Pipe and Equipment Systems by the
Use of a Computer Program, 1978 Annual Book of ASTM Standards, Part 18,
C680, p. 430.
[7] Bosworth, R. C. L. , Heat transfer phenomena, the flow of heat in physical
systems, John Wiley and Sons, New York, 1952, p. 101.
[8] Kreith, F. , Principles of heat transfer, International Textbook Company,
Scranton, 1965, p. 595.
[9] Churchill, R. V., Complex variables and applications, Second Edition,
McGraw-Hill Book Company, New York, 1960.
[10] Gross, D., A preliminary study of the fire safety of thermal insulation
for use in attics or enclosed spaces in residential housing, Nat. Bur.
Stand. (U.S.), NBSIR 78-1497, July 1978.
15
#4 AWG 3 CDRS
Aluminum SE Cable
Model Cable
1.3cm
Effective diameter
Figure 1. Comparison of actual and model cable
Natural convection
30°C ambient
Radiation
Figure 2. Geometry of the insulated cable
16
o
Eu
>-
DZou
<
40
30
20
15
10
9
8
7
6
100 200 300
TEMPERATURE °C
400
Figure 3. Thermal conductivity for fibrous insulation
17
S-l
muQ)
>(0
-H
co•HPn3
rH3en
cH QJ
rHX
s: (0
P U
c S-H sx:4-" ajH tn5 a
rd
C tn
H •<*
P H3ja T3H QJ
S-l PJJ t0
0} rH•H 313 W
cH
U3 >i-P .H<0 HS-l (0
Q) eOj S-l
= a)
0) r^
H P
QJ
S-l
tn
X—LOCATION OFHEAT SOURCE
^X'
3 mxlO" 2
Figure 5. Dimensional sketch of the insulation cylinder with two heatsources representing the conductors in a 14 gauge cable
yj\d^
E [ Yh^0.0846 |C ^
A I
A
rX
J 1 X
Figure 6. Normalized dimensional sketch of the insulation cylinderwith two heat sources
Fiqure 7. Transformation of cylinder onto the upper w-plane
19
300
280
260-
240 -
220 -
200 -
180-
160-
140-
g 120 -
100
80
60
40
20
Typical rated service: 15 amperes
oo
2
Curve
no.
1
2
3
4
5
Insulation
thickness
20cm
10cm
5cm
2.5cm
No insulation
10 15 20
CURRENT AMPERES
25 30
Figure 8. Steady-state jacket temperature for AWG #14 copper 2-G NMcable surrounded by insulation A
20
oo
2E
300
280
260 -
240
220
200
180
160
140
120
100
80
60
40
20
Typical rated service: 15 amperes
Curve
no.
1
2
3
4
5
Insulation
thickness
20cm10cm
5cm
2.5cm
No insulation
10 15 20
CURRENT AMPERES
25 30
Figure 9. Steady-state jacket temperature for AWG #14 copper 2-G NMcable surrounded by insulation B
21
oo
2
300
280
260
240
220
200
180
160
140
120
100
80
60
40
20
Typical
!
rated service: 20
I
amperes
I l
_
- Curve
no.
Insulation
thickness
-
"1 20cm
"
-2 10cm
- 3
4
5cm
2.5cmX -
— 5 No insulation s ~
- yT -
\^z>^^-
5 ^^____=i
I
i 11
—
10 15 20 25
CURRENT AMPERES
30 35
Figure 10. Steady-state jacket temperature for AWG #12 copper 2-G NM
cable surrounded by insulation A
22
oo
XL
300
280
260
240
220
200
180
160
140
120
100 -
80
60
40
20
_! j
__—
^
Typical rated service: 20 amperes
Curve
no.
1
2
3
4
5
Insulation
thickness
20cm
10cm
5cm
2.5cm
No insulation
1 i
10 15 20 25
CURRENT AMPERES
30 35
Figure 11. Steady-state jacket temperature for AWG #12 copper 2-G NMcable surrounded by insulation B
23
300
280
260
240
220
200
P18°
| 160 h
g 140
| 120
100
80
60
40
20
Typical rated service: 30 amperes
Curve
na
1
2
3
4
5
Insulation
thickness
20cm
10cm
5cm
2.5cm
No insulation
10 20 30 40
CURRENT AMPERES
50 60
Figure 12. Steady-state jacket temperature for AWG #10 copper 2-G NMcable surrounded by insulation A
24
oo
300 -
280 -
260 -
240 -
220 -
200 -
180 -
160 -
140 -
120 -
100 -
80 -
60 -
40 -
20 -
_
1 r~
Typical rated service: 30 amperes
Curve
no.
1
2
3
4
5
Insulation
thickness
20cm
10cm
5cm
2.5cm
No insulation
1
10 20 30
CURRENT AMPERES
40 50 60
Figure 13. Steady-state jacket temperature for AWG #10 copper 2-G NMcable surrounded by insulation B
25
o
2UJQ_
300
280
260
240
220
200
180
160
140
120
100
80
60
40
20
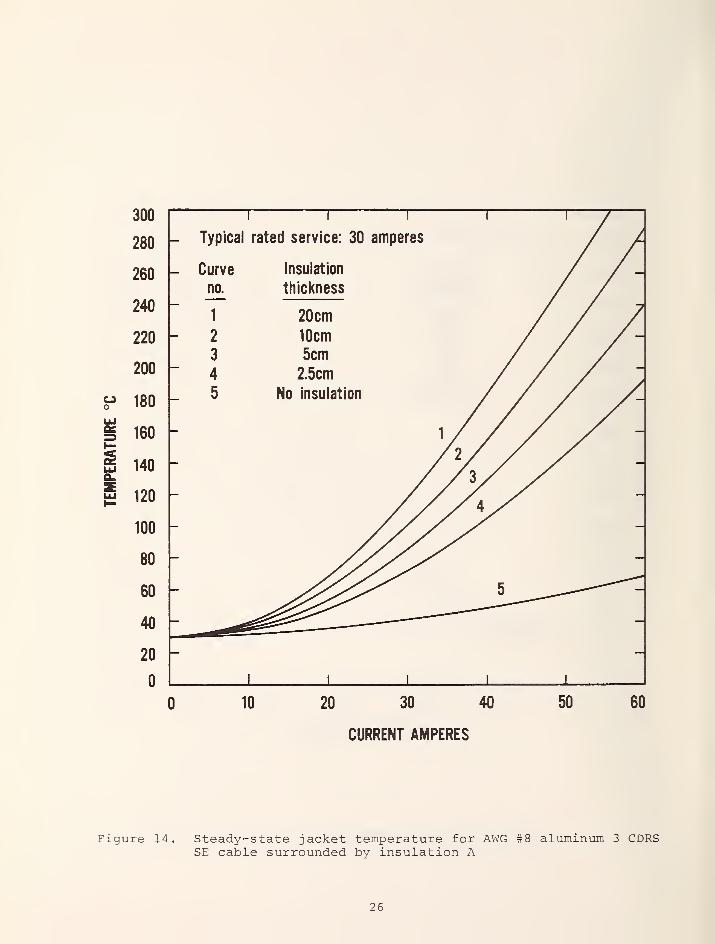
- Typical rated service: 30 amperes
Curve
no.
1
2
3
4
5
Insulation
thickness
20cm
10cm
5cm
2.5cm
No insulation
10 20 30 40
CURRENT AMPERES
50 60
Figure 14. Steady-state jacket temperature for AWG #8 aluminum 3 CDRSSE cable surrounded by insulation A
26
300
280
260 -
240-
220 -
200 -
180 -
160 -
2 140
120 -
100
80
60
40
20
1 r~Typical rated service: 30 amperes
Curve
no.
1
2
3
4
5
Insulation
thickness
20cm
10cm
5cm
2.5cm
No insulation
10 20 30 40
CURRENT AMPERES
50 60
Figure 15. Steady-state jacket temperature for AWG #8 aluminum 3 CDRSSE cable surrounded by insulation B
27
300
oo
t—
280-
260-
240 -
220 -
200 -
180-
160 -
140
120
100
80
60
40
20
10
1 1 r~~
Typical rated service: 40 amperes
Curve
no.
1
2
3
4
5
Insulation
thickness
20cm
10cm
5cm
2.5cm
No insulation
l 1
20 30 40 50
CURRENT AMPERES
60 70
Figure 16. Steady-state jacket temperature for AWG #6 aluminum 3 CDRSSE cable surrounded by insulation A
28
oo
2
10 20 30 40 50
CURRENT AMPERES
60 70
Figure 17. Steady-state jacket temperature for AWG #6 aluminum 3 CDRSSE cable surrounded by insulation B
29
oo
300
280
260
240
220
200
180
| 160
| 140
| 120
100
80
60
40
20
I I I
- Typical rated service: 55 amperes
i I
_
_ Curve Insulation
no. thickness
1 20cm
2 10cm —
3 5cm
4 2.5cm^r —
_ 5 No insulation
/ 2 yS- y/ *>^ -
-
^^ 4^^-
- ^^ 5-
_j Ii
i i
-
20 30 40 50 60
CURRENT AMPERES
70 80
Figure 18. Steady-state jacket temperature for AWG #4 aluminum 3 CDRSSE cable surrounded by insulation A
30
300
280
I I
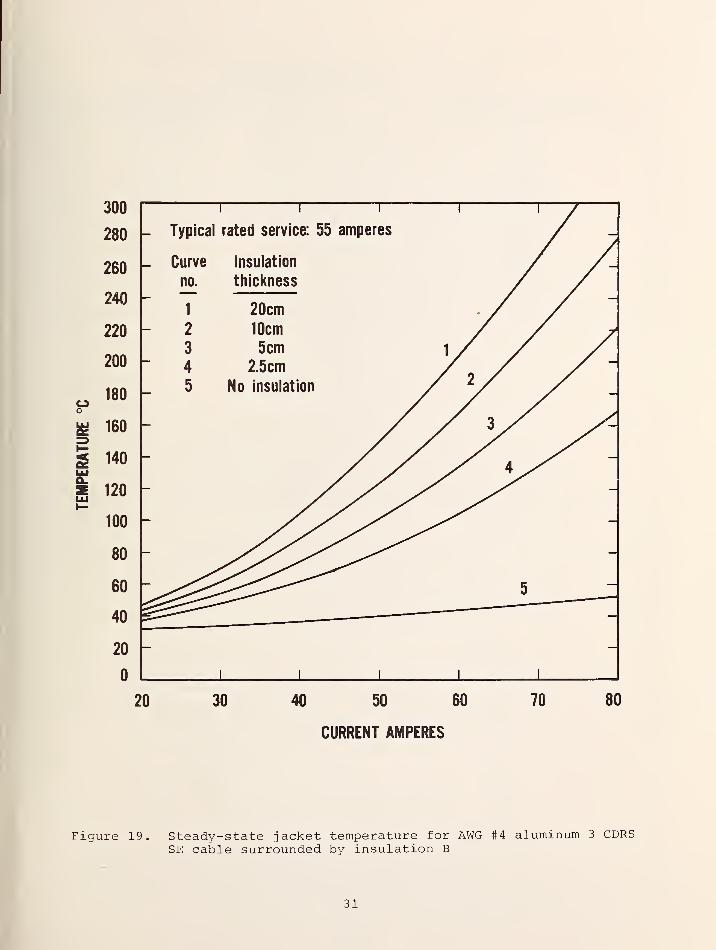
Typical rated service: 55
i
amperes
l I
260 Curve
no.
Insulation
thickness
/ -
2401 20cm
' —
220 2 10cm
2003
4
5cm
2.5cm/ -
o 180o
5 No insulation / ^/ / -
£ 160
£ 140UJ
-
| 120-
100 -
80 -
60-
5—
40
"""I20-
l Ii i i
20 30 40 50 60
CURRENT AMPERES
70 80
Figure 19. Steady-state jacket temperature for AWG #4 aluminum 3 CDRSSE cable surrounded by insulation B
31
Table 1. Effective diameter of cables
2-G AWG Gauge/Metal Effective Diameter (cm)
14/Cu 0.91
12/Cu 1.02
10/Cu 1.15
4/A1 1.85
6/A1 1.54
8/A1 1.46
Table 2. Electrical resistance of metal conductors
1
General Form:
R = A [1 + BT(°C)] x 10~ 5 ohms/cm
Copper B = 0.00427 [1/°C]
Aluminum B = 0.00438 [1/°C]
AWG Gauge/Metal A* [ohms/cm]
14/Cu 7.63
12/Cu 4.80
10/Cu 3.02
4/A1 1.229
6/A1 1.954
8/A1 3.106
*For stranded aluminum conductors, increase table value of A by 2%.
32
Table 3. Values of thermal conductivity for air atatmospheric pressure
Temperature Thermal Conductivity°C W/cm°C
0.000242
38 0.000266
148 0.000334
260 0.000400
371 0.000464
482 0.000524
815 0.000692
Table 4. Values of 2-SP f or a ^r at atmospheric pressure
Temperature°C
ggp 2
V1°/C cm 3
201
38 112
148 28
260 10.1
371 4.48
482 2.29
815 0.447
33o U. S. GOVERNMENT PRINTING OFFICE : 1980 340-997/329
NBS-114A irev, 2-8C)
U.S. DEPT. OF COMM.
BIBLIOGRAPHIC DATASHEET (See instructions,)
1. PUBLICATION ORREPORT NO.
NBS TN 1133
2. Performing Organ. Report No. 3. Publ ication Date
January 19814. TITLE AND SUBTITLE
Calculated Operating Temperatures of Thermally Insulated Electric Cables
5. AUTHOR(S)
David D . Evan
s
6. PERFORMING ORGANIZATION (If joint or other than NBS. see instructions)
NATIONAL BUREAU OF STANDARDSDEPARTMENT OF COMMERCEWASHINGTON, D.C. 20234
7. Contract/Grant No.
8. Type of Report & Period Covered
Final
9. SPONSORING ORGANIZATION NAME AND COMPLETE ADDRESS (Street. City. State, ZIP)
U.S. Consumer Product Safety CommissionWashington, DC 20207
10. SUPPLEMENTARY NOTES
2] Document describes a computer program; SF-185, FlPS Software Summary, is attached.
11. ABSTRACT (A 200-word or less factual summary of most significant information. If document includes a significantbibliography or literature survey, mention it here)
Steady-state operating temperatures of current-carrying electric cables
buried axially in cylinders of thermal insulation were calculated.
Combinations of six types of nonmetallic electric cable, two thermal
insulation materials, five thermal insulation thicknesses and a range
of currents both greater and less than the typical rated service currents
for the cables were studied.
These calculations show that thermally insulated electric cables carrying
the rated current may exceed the rated operating temperature limit for
common cable jacket materials.
12. KEY WORDS (Six to twelve entries; alphabetical order; capitalize only proper names; and separate key words by semicolons)
Electric cable; electrical fire; models; thermal insulation; wiring system.
13. AVAILABILITY
[X~~| Unlimited
|For Official Distribution. Do Not Release to NTIS
[X~~| Order From Superintendent of Documents, U.S. Government Printing Office, Washington, D.C.20402.
[] Order From National Technical Information Service (NTIS), Springfield, VA. 22161
14. NO. OFPRINTED PAGES
4115. Price
$2.25
USCOMM-DC 6043-P80
There'sanewlook
. . . the monthlymagazine of the Nation-al Bureau of Standards.
Still featured are special ar-
ticles of general interest oncurrent topics such as consum-er product safety and building
technology. In addition, new sec-
tions are designed to . . . PROVIDESCIENTISTS with illustrated discussions
of recent technical developments andwork in progress . . . INFORM INDUSTRIAL
MANAGERS of technology transfer activities in
Federal and private labs. . . DESCRIBE TO MAN-UFACTURERS advances in the field of voluntary and
mandatory standards. The new DIMENSIONS/NBS also
carries complete listings of upcoming conferences to beheld at NBS and reports on all the latest NBS publications,
with information on how to order. Finally, each issue carries
a page of News Briefs, aimed at keeping scientist and consum-alike up to date on major developments at the Nation's physi-
cal sciences and measurement laboratory.
(please detach here)
SUBSCRIPTION ORDER FORM
Enter my Subscription To DIMENSIONS/NBS at $11.00. Add $2.75 for foreign mailing. No additional
postage is required for mailing within the United States or its possessions. Domestic remittances
should be made either by postal money order, express money order, or check. Foreign remittances
should be made either by international money order, draft on an American bank, or by UNESCOcoupons.
Send Subscription to:
I l I I I I I I I I I I I I I I I I I I I I I I I
tZI Remittance Enclosed
(Make checks payable
to Superintendent of
Documents)
D Charge to my Deposit
Account No.NAME-FIRST, LAST
COMPANY NAME OR ADDITIONAL ADDRESS LINE
STREET ADDRESS
J_L 11 11
M IllSTATE ZIP CODE
MAIL ORDER FORM TO:
Superintendent of Documents
Government Printing Office
Washington, D.C. 20402
PLEASE PRINT
NBS TECHNICAL PUBLICATIONS
PERIODICALS
JOURNAL OF RESEARCH—The Journal of Research of the
National Bureau of Standards reports NBS research and develop-
ment in those disciplines of the physical and engineering sciences in
which the Bureau is active. These include physics, chemistry,
engineering, mathematics, and computer sciences. Papers cover a
broad range of subjects, with major emphasis on measurement
methodology and the basic technology underlying standardization.
Also included from time to time are survey articles on topics
closely related to the Bureau's technical and scientific programs.
As a special service to subscribers each issue contains complete
citations to all recent Bureau publications in both NBS and non-
NBS media. Issued six times a year. Annual subscription: domestic
$13; foreign $16.25. Single copy, $3 domestic: $3.75 foreign.
NOTE: The Journal was formerly published in two sections: Sec-
tion A "Physics and Chemistry" and Section B "Mathematical
Sciences."
DIMENSIONS/NBS—This monthly magazine is published to in-
form scientists, engineers, business and industry leaders, teachers,
students, and consumers of the latest advances in science andtechnology, with primary emphasis on work at NBS. The magazinehighlights and reviews such issues as energy research, fire protec-
tion, building technology, metric conversion, pollution abatement,
health and safety, and consumer product performance. In addi-
tion, it reports the results of Bureau programs in measurementstandards and techniques, properties of matter and materials,
engineering standards and services, instrumentation, andautomatic data processing. Annual subscription: domestic $11;
foreign $13.75.
NONPERIODICALS
Monographs—Major contributions to the technical literature onvarious subjects related to the Bureau's scientific and technical ac-
tivities.
Handbooks—Recommended codes of engineering and industrial
practice (including safety codes) developed in cooperation with in-
terested industries, professional organizations, and regulatory
bodies.
Special Publications—Include proceedings of conferences spon-sored by NBS, NBS annual reports, and other special publications
appropriate to this grouping such as wall charts, pocket cards, andbibliographies.
Applied Mathematics Series—Mathematical tables, manuals, andstudies of special interest to physicists, engineers, chemists,
biologists, mathematicians, computer programmers, and others
engaged in scientific and technical work.
National Standard Reference Data Series—Provides quantitative
data on the physical and chemical properties of materials, com-piled from the world's literature and critically evaluated.
Developed under a worldwide program coordinated by NBS underthe authority of the National Standard Data Act (Public Law90-396).
NOTE: The principal publication outlet for the foregoing data is
the Journal of Physical and Chemical Reference Data (JPCRD)published quarterly for NBS by the American Chemical Society
(ACS) and the American Institute of Physics (AIP). Subscriptions,
reprints, and supplements available from ACS, 1 155 Sixteenth St.,
NW, Washington, DC 20056.
Building Science Series—Disseminates technical information
developed at the Bureau on building materials, components,
systems, and whole structures. The series presents research results,
test methods, and performance criteria related to the structural and
environmental functions and the durability and safety charac-
teristics of building elements and systems.
Technical Notes—Studies or reports which are complete in them-
selves but restrictive in their treatment of a subject. Analogous to
monographs but not so comprehensive in scope or definitive in
treatment of the subject area. Often serve as a vehicle for final
reports of work performed at NBS under the sponsorship of other
government agencies.
Voluntary Product Standards— Developed under procedures
published by the Department of Commerce in Part 10, Title 15, of
the Code of Federal Regulations. The standards establish
nationally recognized requirements for products, and provide all
concerned interests with a basis for common understanding of the
characteristics of the products. NBS administers this program as a
supplement to the activities of the private sector standardizing
organizations.
Consumer Information Series—Practical information, based on
NBS research and experience, covering areas of interest to the con-
sumer. Easily understandable language and illustrations provide
useful background knowledge for shopping in today's tech-
nological marketplace.
Order the above NBS publications from: Superintendent of Docu-
ments, Government Priming Office, Washington, DC 20402.
Order the following NBS publications—F/PS and NBSIR's—fromthe National Technical Information Services, Springfield, VA 22161.
Federal Information Processing Standards Publications (FIPS
PUB)—Publications in this series collectively constitute the
Federal Information Processing Standards Register. The Register
serves as the official source of information in the Federal Govern-
ment regarding standards issued by NBS pursuant to the Federal
Property and Administrative Services Act of 1949 as amended,
Public Law 89-306 (79 Stat. 1127), and as implemented by E:.
ecutive Order 1 1717 (38 FR 12315, dated May 11, 1973) and Part o
of Title 15 CFR (Code of Federal Regulations).
NBS Interagency Reports (NBSIR)—A special series of interim or
final reports on work performed by NBS for outside sponsors
(both government and non-government). In general, initial dis-
tribution is handled by the sponsor; public distribution is by the
National Technical Information Services, Springfield, VA 22161,
in paper copy or microfiche form.
U.S. DEPARTMENT OF COMMERCENational Bureau of StandardsWashington, DC. 20234